Transport demand modelling in Melbourne - WIT Press · Transport demand modelling in Melbourne F....
17
Transport demand modelling in Melbourne F. Spiridonos Transport Modelling and Mapping, Department of Transport, Victoria, Australia Abstract Transport demand models are a systematic representation of the large and complex real-world transport system as it exists, and as it might be. The development and application of such models is fundamental to the transport project and policy development and economic appraisals undertaken within the Victorian Department of Transport (VDOT) and its agencies. Transport demand models provide an analytical framework to understand and assess the performance of the transport system under existing and future demands. Additionally, transport demand models can be used to: assess the impacts of integrated transport and land-use strategies on a systematic basis provide the background analysis to identify the implications of transport policies and strategies; and identify the quantum and location of congestion. Furthermore, the application of such models enables quantitative measures to be generated that act as key inputs to the project appraisal process. Some of these inputs can only be derived in a sufficiently robust and disaggregate manner by using transport demand models. The VDOT has developed the Victorian Integrated Transport Model (VITM) to undertake multi-modal transport demand modelling of transport project, policy and land use initiatives. The VITM also incorporates a Melbourne Freight Movement Model (MFMM) for the modelling of freight demand across metropolitan Melbourne. Keywords: transport demand modelling, congestion, freight modelling. 1 Introduction This paper provides an overview of the development, application and proposed future developments of a transport demand modelling system, covering both commuter travel and freight travel, for metropolitan Melbourne (fig. 1). www.witpress.com, ISSN 1743-3509 (on-line) WIT Transactions on The Built Environment, Vol 130, © 2013 WIT Press doi:10.2495/UT130261 Urban Transport XIX 331
Transcript of Transport demand modelling in Melbourne - WIT Press · Transport demand modelling in Melbourne F....

Transport demand modelling in Melbourne
F. Spiridonos Transport Modelling and Mapping, Department of Transport, Victoria, Australia
Abstract
Transport demand models are a systematic representation of the large and complex real-world transport system as it exists, and as it might be. The development and application of such models is fundamental to the transport project and policy development and economic appraisals undertaken within the Victorian Department of Transport (VDOT) and its agencies. Transport demand models provide an analytical framework to understand and assess the performance of the transport system under existing and future demands. Additionally, transport demand models can be used to: assess the impacts of integrated transport and land-use strategies on a
systematic basis provide the background analysis to identify the implications of transport
policies and strategies; and identify the quantum and location of congestion. Furthermore, the application of such models enables quantitative measures to be generated that act as key inputs to the project appraisal process. Some of these inputs can only be derived in a sufficiently robust and disaggregate manner by using transport demand models. The VDOT has developed the Victorian Integrated Transport Model (VITM) to undertake multi-modal transport demand modelling of transport project, policy and land use initiatives. The VITM also incorporates a Melbourne Freight Movement Model (MFMM) for the modelling of freight demand across metropolitan Melbourne. Keywords: transport demand modelling, congestion, freight modelling.
1 Introduction
This paper provides an overview of the development, application and proposed future developments of a transport demand modelling system, covering both commuter travel and freight travel, for metropolitan Melbourne (fig. 1).
www.witpress.com, ISSN 1743-3509 (on-line) WIT Transactions on The Built Environment, Vol 130, © 2013 WIT Press
doi:10.2495/UT130261
Urban Transport XIX 331

Figure 1: Metropolitan Melbourne.
2 Transport demand modelling in Melbourne
The development of transport demand models in Melbourne had been sporadic, initially focussed on integrated multi-modal transport modelling systems during the mid-to-late 1970s. For the subsequent two decades, transport demand modelling was characterised by a highway-based Melbourne-centric focus, given the predominance of road transport projects and studies in the Melbourne metropolitan region over this period. This resulted in a re-focus solely on 24-hour transport demand modelling utilising the Melbourne Strategic Highway Model (MSHM) from the early 1980s and onwards. The Victorian Department of Infrastructure (VDOI) was established in 1996 and initiated a programme of transport modelling systems development and updating, beginning with two projects – the re-calibration of the MSHM trip generation and trip distribution parameters, and the revision and update of the MSHM speed/flow curves. These two projects were interim enhancements, providing the VDOI with an updated strategic highway demand modelling
www.witpress.com, ISSN 1743-3509 (on-line) WIT Transactions on The Built Environment, Vol 130, © 2013 WIT Press
332 Urban Transport XIX
capacity to meet the then immediate transport network planning and analysis needs, whilst scoping the development of a multi-period, multi-purpose and multi-modal transport demand modelling capacity.
2.1 The Melbourne Integrated Transport Model (MITM)
Using the MSHM as the basis, the VDOI developed the Melbourne Integrated Transport Model (MITM) in 2001. In contrast to the MSHM, the MITM now incorporated updated and refined highway and public transport networks together with travel demands for fourteen trip purposes derived from the Victorian Activity and Travel Survey (VATS), a household survey of travel, conducted between 1994 and 2001. The MITM also included a mode-choice modelling capability and the modelling of the AM-Peak period. The MITM provided the VDOI with a multi-modal, multi-purpose, multi-period integrated transport demand model of Melbourne, capable of integrated transport demand modelling of the transport network (highway and public transport) and associated travel demands for personal travel.
2.2 The Victorian Integrated Survey of Travel and Activity 2007
In the 12-month period from June 2007 to June 2008,the VDOI undertook the Victorian Integrated Survey of Travel and Activity 2007 (VISTA07). VISTA07 was a household survey of travel and activity of 11,000 households in metropolitan Melbourne and a total of 6,000 households in the regional centres of Geelong, Bendigo, Ballarat, Shepparton and Traralgon, covering every day of the 12-month survey period. VISTA07 provided a much-needed update to the travel database of Melbourne and the regional centres, making available detailed household travel and activity patterns by all modes on all days of the year.
3 The Victorian Integrated Transport Model
The information on household travel and activity patterns derived from VISTA07 was the catalyst for the recalibration of the MITM. The recalibrated and restructured MITM was re-branded as the Victorian Integrated Transport Model (VITM) [1]. The VITM now incorporated: a combined mode choice and trip distribution module; four time periods –AM Peak (07:00 to 09:00), Inter Peak (09:00 to 15:00),
PMPeak (15:00 to 18:00) and Off Peak (18:00 to 07:00); and trip rates were calculated on the basis of person types rather than household
type. The simplified structure of the VITM is shown in fig. 2.
www.witpress.com, ISSN 1743-3509 (on-line) WIT Transactions on The Built Environment, Vol 130, © 2013 WIT Press
Urban Transport XIX 333

Figure 2: Structure of the VITM.
The Melbourne component of the VITM comprises 2,912 transport zones (2,893 internal and 19 external) and over 60,000 one-way links which provide connectivity from each of the 2,912 transport zones to every other transport zone, fig. 3.The transport zones are generally more detailed in the inner and middle suburbs and along major transport corridors. The highway network covers all freeways, toll ways, arterial and collector roads and the public transport network covers all tram, train and bus routes. The following sections provide an overview of the main components of the VITM.
www.witpress.com, ISSN 1743-3509 (on-line) WIT Transactions on The Built Environment, Vol 130, © 2013 WIT Press
334 Urban Transport XIX

Figure 3: VITM Melbourne network.
3.1 Data sources
Travel demands for the VITM have been developed using travel and activity data from VISTA07. VISTA07 was a self-completion household travel and activity survey of 11,000 across metropolitan Melbourne covering all days of the 12-month period from June 2007 to June 2008. In addition to VISTA07, data from the Australian Bureau of Statistics 2006 Census of Population and Housing (population and employment levels and distribution) was also used in the development of the VITM, together with other demographic and travel data (e.g. school enrolments; car ownership levels; household income; public transport usage; traffic counts).
www.witpress.com, ISSN 1743-3509 (on-line) WIT Transactions on The Built Environment, Vol 130, © 2013 WIT Press
Urban Transport XIX 335
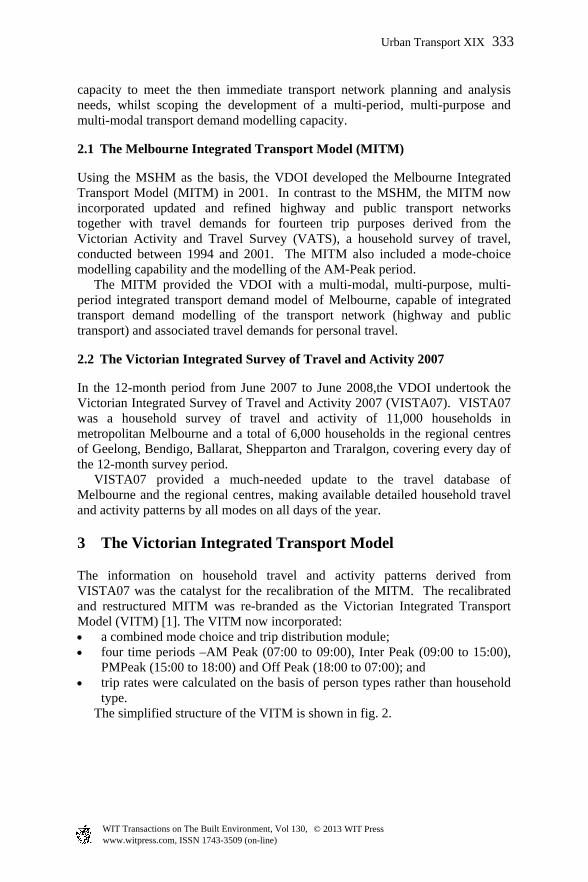
3.2 Trip purposes
From the analysis of the VISTA07 data, the VITM adopted the nine trip purposes shown in table 1.
Table 1: VITM trip purposes.
Trip purpose
Home-based Work
Home-based Primary Education
Home-based Secondary Education
Home-based Tertiary Education
Home-based Shopping
Home-based Social
Home-based Other
Employer’s business
Non-home-based Other
For the distribution and mode choice models, the home-based work trips were further divided into white collar and blue collar trips.
3.3 Household type and car ownership
The household type and car ownership components of the VITM segment the population of each transport zone into various household types and car availability categories. These segments are used in the trip generation model to estimate the level of trip-making activity by each person in a transport zone. Eight household and four car-ownership segments were identified from the VISTA07 data. These segments were derived by identifying common car ownership patterns across various household structures and also identifying the distinctive trip-making characteristics by different age groups within households. The household types used in the VITM are shown in table 2.
Table 2: VITM household types.
Number of household adults
Number of employed adults in household
0 1 2 3+
1 Type 1 Type 2 N/A N/A
2 Type 3 Type 4 Type 5 N/A
3+ Type 6 Type 7 Type 8
www.witpress.com, ISSN 1743-3509 (on-line) WIT Transactions on The Built Environment, Vol 130, © 2013 WIT Press
336 Urban Transport XIX

The segments are based on the number of employed adults and the total number of adults (both employed and not employed) in each household. Variables relating to individual residents within each household, such as age and employment status, are considered in the trip generation model. The car ownership model further categorises households by the number of vehicles in the household (0, 1, 2 or 3+). Households with three or more vehicles are grouped to form a separate car ownership segment.
3.4 Trip generation
The trip generation model in the VITM estimates the quantum of motorised trip ends (i.e. productions and attractions) for each transport zone in the VITM network. Walking and cycling trips are also calculated for each transport zone but are not assigned as there is no representative walking and cycling network. The trip generation model is comprised of a trip production and trip attraction module, both for motorised modes. The trip production module estimates the number of home-based trips produced by each transport zone with the primary inputs being: household type; person type and car availability. The trip attraction module estimates the number of trips attracted to each transport with the primary inputs being: population distribution by transport zone; total employees by transport zone and the total primary, secondary and tertiary education enrolments by transport zone. Both the trip production and trip attraction modules estimate typical weekday trips.
3.5 Combined mode choice and trip distribution
The distribution and mode choice model forecasts the distribution of car and public transport trips across the Melbourne metropolitan area. The inputs to the model are the trip ends derived from the trip generation model and the outputs are 24-hour trip matrices in production-attraction form. The models cover motorised mode trips, they are segmented by trip purposes and are based on a typical 24-hour weekday. The MITM had adopted separate distribution and mode choice models, with distribution calculated on a 24-hour basis and mode choice calculated on a time-period basis. However, with distribution and mode choice modelled as separate processes, interactions between choice of destination (i.e. distribution) and choice of mode were not directly captured. In some extreme situations, this could potentially lead to counter-intuitive model sensitivities. By combining the distribution and mode choice models (in a simultaneous distribution and mode choice formulation) for each trip purpose, the VITM can now better model these interactions and also brings the VITM into line with current international practice in strategic transport demand models. This approach also provides a foundation for modelling other choice variables in the future (such as travellers’ departure time choice in response to road-user charges).
www.witpress.com, ISSN 1743-3509 (on-line) WIT Transactions on The Built Environment, Vol 130, © 2013 WIT Press
Urban Transport XIX 337

3.6 Modelled time periods
The VITM incorporates four time periods as shown in table 3. The VITM models all four time periods in each model iteration and reports the results separately for each period. These results can be combined to provide daily flows if required.
Table 3: VITM time periods.
Period Start End Duration Scale factor AM Peak 07:00 09:00 2 hours 1 Inter Peak 09:00 15:00 6 hours 1/3 PM Peak 15:00 18:00 3 hours 2/3 Off Peak 18:00 07:00 13 hours 1/3
The VITM represents road network capacities on a two-hourly basis, so the total volume of travel in each period is multiplied by the appropriate scale factors shown in table 3 to produce a representative two-hour traffic volume. It should be noted that whilst the Off Peak period duration is shown as 13 hours, most of the travel in this period occurs between 18:00 and 21:00. Consequently, a scale factor of 1/3 was adopted to represent a typical 2-hour period in the evening, as compared to an average 2-hour period calculated over the 13-hour duration.
3.7 Trip assignment
The distribution and mode choice model derives a series of mode-based travel demand matrices for each of the VITM travel purposes, and for each of the modelled time periods. In the assignment stage, the public transport person-demand matrices and the highway demand matrices are assigned to the public transport network and the highway network respectively. Highway characteristics such as capacity and highway classification are included in the VITM, as are public transport route characteristics, to enable the changes in travel conditions across the transport network to be modelled. The changes in highway travel conditions are modelled in the VITM by the use of speed-flow curves for various highway classifications (freeways, undivided arterials, local roads). The speed-flow curves describe the change in speed, and consequently travel time, on a section of highway based on the assigned volume and the capacity of the highway section. It should be noted that the designation of capacity in the VITM is not an absolute measure but describes a characteristic of the highway section, for planning purposes. It links travel conditions to traffic volumes and takes into account: the cross section of the road (e.g. number of lanes, divided or undivided); operational characteristics of the road (parking bans, presence of trams); intersection spacing and configuration; abutting land uses; and pedestrian movements.
www.witpress.com, ISSN 1743-3509 (on-line) WIT Transactions on The Built Environment, Vol 130, © 2013 WIT Press
338 Urban Transport XIX

4 Application of the VITM
4.1 A definition of congestion
For the purposes of this paper, congested highway sections are defined as those sections of the highway network with a traffic volume greater than, or equal to, their physical traffic carrying capacity i.e. a Volume-to-Capacity Ratio (VCR) greater than or equal to one. Based on this definition, one way of identifying congested highway sections would be to undertake extensive traffic counts across the Melbourne metropolitan highway network and use these in conjunction with the quantified capacity of the highway network to estimate the congestion levels. Such data however, is neither readily, nor comprehensively, available and the cost of collection would be prohibitive. It is also difficult under this approach to forecast changes in congestion over time. In this context, the approach adopted was to use the VITM, to model the quantum of congestion across the highway network.
4.2 Results of congestion analysis
The VITM was used to model travel conditions during the 2-hour AM peak period at 2011 and 2021. Table 4 presents the results of the modelling and reports on a series of network performance indicators (congested road length, congested vehicle kilometres and congested vehicle hours, average network speed), on the basis of the above definition of congestion. Table 4 indicates that of the total time spent travelling (vehicle-hours) during the AM Peak period, 17.4% is in congested conditions at 2011 and that by 2021, this will increase to 21.9%. As a consequence of the increase in congested travel time, the average travel speed across the metropolitan highway network will decrease by 4% by 2021, from 36.6km/hr in 2011 to 35.1km/hr.
Table 4: Modelled network performance indicators.
Network performance indicator AM peak
2011 2021
Total Road Length (km) 19,747 19,894 Congested Road Length (km)
(% of Total) 222
(1.12)346
(1.74) Total Vehicle Kilometres 16,929,341 18,984,445
Congested Vehicle Kilometres (% of Total)
1,039,399 (6.41)
1,388,500 (7.31)
Total Vehicle Hours 462,646 540,479 Congested Vehicle Hours
(% of Total) 80,563 (17.41)
118,377 (21.90)
Average Speed(km/hr) 36.6 35.1
www.witpress.com, ISSN 1743-3509 (on-line) WIT Transactions on The Built Environment, Vol 130, © 2013 WIT Press
Urban Transport XIX 339

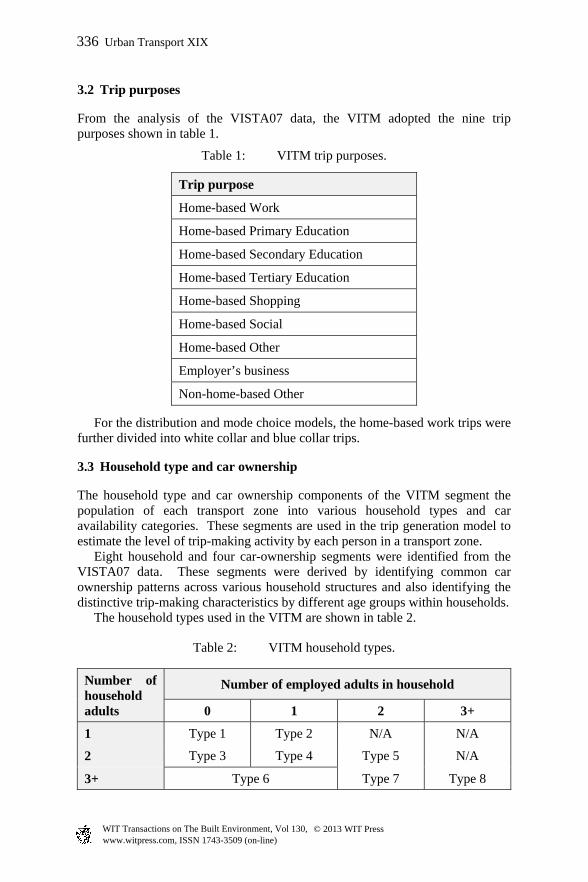
In addition, the modelling indicates that the extent of the highway network operating under congested conditions during the morning peak period will increase from 222 km in 2011 to 346 km in 2021, an increase of 56%. The congested highway sections at 2011 and 2021 are shown in figs 4 and 5 respectively.
Figure 4: Modelled 2011 congestion.
Figure 5: Modelled 2021 congestion
www.witpress.com, ISSN 1743-3509 (on-line) WIT Transactions on The Built Environment, Vol 130, © 2013 WIT Press
340 Urban Transport XIX

The increases in congestion levels are a consequence of the forecast urban growth and the corresponding increase in the propensity for travel in the outer urban areas, specifically in the north, west and south-east regions of Melbourne.
5 The Melbourne Freight Movement Model
The total metropolitan travel task is a function of the demand for personal travel and freight movement within and through metropolitan Melbourne, both which contribute to local and system-wide congestion across the metropolitan transport system. Metropolitan freight operations are complex, with freight movements reflecting both freight demands and the structure and operational characteristics of the freight industry. Victoria’s domestic markets, manufacturing, trade and logistics centres are concentrated in the metropolitan region and the efficient movement of freight within this region is critical for both the economic functioning of the region itself and for the performance of the total freight system. Given the extent that freight movement contributes to the total travel task, and consequently congestion, it was critical that the VDOI began to also understand the quantum and coverage of the existing freight movement task across metropolitan Melbourne. The VDOI undertook the development of the Melbourne Freight Movement Model (MFMM) in 2006 with the primary aim of establishing a practical and operational freight movement modelling and forecasting capability to be consolidated with the forecasting of passenger movement across metropolitan Melbourne using the VITM. Such a consolidation would provide the VDOI with the capability to assess the impacts of the demand for personal and freight movement on the metropolitan transport network and ensure holistic forecasting and assessment of proposed transport project and policy initiatives. Specifically, the MFMM development was driven by the need to reliably represent the existing Melbourne metropolitan freight movement task and patterns, and to forecast and analyse changes in freight movement on the basis of changes in: the locations and magnitude of freight generators and attractors e.g. ports,
rail terminals, major import/export facilities etc.; the transport network; demographics (population and employment); the structure of the road freight and logistics sectors; the location and operation of intermodal terminals; the nature and amount of freight being carried; and changes in industry cost structures.
5.1 The MFMM structure
The main requirement in the development of the MFMM was to consider the commodity production and freight movement system across metropolitan Melbourne as a multi-stage, sequential decision process, commencing with decisions relating to commodity and freight production, ending with the
www.witpress.com, ISSN 1743-3509 (on-line) WIT Transactions on The Built Environment, Vol 130, © 2013 WIT Press
Urban Transport XIX 341

decisions relating to the route for road freight modes in the road network and having a statistical updating and ‘feed-back’ facility, to maximize the information gain from available data sources and the accuracy of the resulting commodity and freight movement estimates. The structure of the FMM is shown in fig. 6 [2].
Figure 6: Structure of the MFMM.
5.2 The MFMM inputs
The primary data sources required to develop and apply the MFMM are shown in the top level of fig. 4 and can be summarized as follows:
Co
mm
od
ity
– F
reig
ht
Veh
icle
Mo
du
leIn
pu
t d
ata
Cu
be
Mo
du
le
www.witpress.com, ISSN 1743-3509 (on-line) WIT Transactions on The Built Environment, Vol 130, © 2013 WIT Press
342 Urban Transport XIX

business surveys were undertaken to provide commodity production, freight movement and employment data for May 2006. The surveys also collected data on seasonal variations in commodity production, to enable estimation of commodity production and freight movements for an average week in May, or other months of the year. The survey data indicated that for some businesses and commodities there were significant seasonal variations. A sample of the business survey form is shown in fig. 7.
economic data from Access Economics [3] which also included observed data and forecasts for the economic variable, Victorian Gross State Product;
the quantum of imports through the Port of Melbourne (POM) was obtained from the Bureau of Transport and Regional Economics and included tonnage by pack type (e.g., containerised, bulk, etc.) moved in and out of the POM, by detailed commodity and segmented by coastal and international freight;
data on imports from regional Victoria and interstate was obtained from the Australian Bureau of Statistics (ABS) [4] giving estimates of articulated truck tonnage flows, tonne-kilometres and laden trips in and out of metropolitan Melbourne to/from regional Victoria and interstate;
employment data from the ABS [5], by industry class, for metropolitan Melbourne and total employment for the remainder of Australia;
the ABSbusiness employment register [6] of estimates of the number of businesses by broad industry class and size in metropolitan Melbourne;
the MITM/VITM strategic road network provided the coded travel zones, road network and personal travel trip matrices;
available observed freight vehicle volumes for particular time periods of the work-day and week; and
Figure 7: Sample of the MFMM business survey form.
Quantity 1
Quantity 2
Quantity 3
E.g. 15% or -15%
for the month of May 2006.
for the month of May 2006.
for the month of May 2006.
In Survey 1 you indicated that the production of Auto suspension parts in May 2006 was
NOTE !!! There may be more than 1 quantity class, if so, please include each. Please estimate equivalent quantities in tonnes for each quantity class.
for the month of May 2006.
Please complete the table below
10.00 t
<Please Select>
<Please Select> or
<Please Select> or
Quantity Class (Shipping UOM) Estimated equivalent Qty in tonnes
Quantity
Question 1
or
Total estimated qty in tonnes 0.00 t
Question 2 vary per month?Auto suspension partsOver a year, how does the production of
Jun-05 Jul-05 Aug-05 Sep-05 May-06Oct-05 Nov-05 Dec-05 Jan-06
0%
Feb-06 Mar-06 Apr-06
0%0% 0%0% 0% 0% 0%
Please indicate the avge % increase/decrease in production for each month in relation to May-06
0% 0%Please indicate avge % difference in production
0% 10%
Production of Auto suspension parts
YesIs production of Auto suspension parts measured by your business in shipping units other than tonnes
Section 2 -
www.witpress.com, ISSN 1743-3509 (on-line) WIT Transactions on The Built Environment, Vol 130, © 2013 WIT Press
Urban Transport XIX 343

5.3 The MFMM commodity and freight vehicle module
The middle section of fig. 4 indicates the set of modules that comprise the MFMM Commodity and Freight Vehicle Module (CFVM) and which estimates the commodity production and freight movements used in the CUBE module of the MFMM. The primary input datasets that drive the CFVM, involve economic data (state demand), land-use data (industry employment in freight areas and travel zones) and transport network data (transport zones, road network and travel times between freight areas and travel zones). The outputs from the CFVM comprise matrices of commodity movements across Melbourne by industry class and vehicle class (rigid and articulated) as well as freight vehicle trip matrices. The industry classes and freight vehicle classes used in the FMM are shown in fig. 8.
Figure 8: The MFMM industry and commodity classes.
5.4 The MFMM CUBE module
The CUBE Module section of fig. 4 requires input from the CFVM, transport network data form the VITM, observed freight vehicle volumes and commodity and freight vehicle proportions by time period. The time period data is used to estimate the proportion of the average weekly commodity movements and freight vehicle trips generated by the CFVM module, which occur in a specified day (e.g., average workday) and hourly period (e.g., AM Peak). The primary outputs from this module are in the form of freight vehicle trip matrices between transport zones which, when assigned to the VITM network, result in the freight vehicle volumes across metropolitan Melbourne shown in fig. 9.
FMM Stage 1 CommodityI1 Horticulture and Fruits Vegetables and fruitsI2 Grains and Meats Grains and meatI3 Dairying Milk, etcI4 Mining Other Mining Construction materialsI5 Food , Beverage Food and beverageI6 Textiles, Clothing, etc Textiles, etcI7 Wood and Paper Wood and paperI8 Printing, etc Printing productsI9 Petroleum, etc Petroleum products
I10 Non-Metallic Products Non-metallic productsI11 Metal Products Metal productsI12 Machinery and Equipment Machinery and equipmentI13 Other Manufacturing Other manufactured productsI14 Basic MaterialI15 Machinery and VehiclesI16 Personal and HouseholdI17 Food RetailingI18 Personal and HouseholdI19 Motor VehicleI20 Transport DepotI21 WarehouseI22 Distribution Centre
Wholesaling
Retail
Transp and Storage
Industry
Industry and commodity class
Agriculture
Manufacturing
LCVRigid M2Artic M3
RailAirSea
Road-based
FMM transport modes
FMM Stage 1
www.witpress.com, ISSN 1743-3509 (on-line) WIT Transactions on The Built Environment, Vol 130, © 2013 WIT Press
344 Urban Transport XIX
Figure 9: Daily freight volumes.
6 Further developments to the VITM and MFMM
The development and application of the VITM has established an analytical framework for transport policy and project development and appraisal within the Victorian Department of Transport (VDOT) which was established in May 2008. The enhancement of the VITM with the development of a practical freight movement model, the MFMM, has provided the VDOT with the capability to assess the impacts of the demand for personal and freight movement on the Melbourne metropolitan transport system. Any transport demand model is a tool for understanding and assessing the likely impacts of changes in the drivers of transport i.e. transport supply, demographics, land use. As such, transport model development is not static and to ensure the continued relevance of the VDOT’s transport demand modelling system and its ‘fit-for-purpose’, a number of enhancement are being considered.
www.witpress.com, ISSN 1743-3509 (on-line) WIT Transactions on The Built Environment, Vol 130, © 2013 WIT Press
Urban Transport XIX 345

6.1 VITM enhancements
The following VITM enhancements are being considered: use the data and information from the Victorian Integrated Survey of Travel
and Activity 2009 and 2012 (VISTA09 and VISTA12) to recalibrate the VITM.
expand the network and travel demand coverage to develop a statewide travel demand model (fig. 10), using the VISTA09 and VISTA12 data, together with the 2011 Census data.
Figure 10: Proposed VITM statewide model.
6.2 MFMM enhancement
The MFMM has provided the VDOT with a Melbourne metropolitan-wide freight movement modelling capability. Some of the future enhancements to the MFMM being considered are provided below: an on-going programme of automatic vehicle classification counts across the
Melbourne metropolitan area to confirm and update the freight vehicle trip matrices derived through the MFMM process;
the business surveys indicated that some commodities are moved by light commercial vehicles, which were outside the scope of the MFMM project. It is desirable, and feasible, to undertake the design and conduct of a light commercial vehicle survey to capture data from those industries which generate light commercial vehicle trips (e.g. couriers, service-related activities);
www.witpress.com, ISSN 1743-3509 (on-line) WIT Transactions on The Built Environment, Vol 130, © 2013 WIT Press
346 Urban Transport XIX

undertake travel time surveys for other peak periods as well as the AM Peak period;
there were several ‘gaps’ in the industry and commodity classes covered by the business surveys. For the future development of the MFMM it is desirable that the commodity production – distribution database be extended to cover several additional industry and commodity classes, in particular production data for mining and quarries and waste collection and distribution.
References
[1] AECOM, SKM: Recalibration and Revalidation of the Melbourne Integrated Transport Model, 2011, Volume 1: Summary Report.
[2] IMIS, MWT, JEA, AE, PT and ITLS (2006), FMM Modelling Specification Report.
[3] Access Economics (2006).Industry Report. [4] Australian Bureau of Statistics (ABS), (2001a). Cat. No. 9220.0 – Freight
Movements, Australia, Summary, Mar 2001. [5] ABS (2001b). Basic Community Profiles, Time Series Profiles and Working
Population Profiles. [6] ABS (2004). Cat. No. 8161.0.55.003 – Australian Bureau of Statistics
Business Register Counts of Businesses – Postcode by Industry Division by Employment Size, Jun 2004.
www.witpress.com, ISSN 1743-3509 (on-line) WIT Transactions on The Built Environment, Vol 130, © 2013 WIT Press
Urban Transport XIX 347