TRANSPLANTATION Copyright © 2021 Transitional B cell ...
13
Cherukuri et al., Sci. Transl. Med. 13, eabe4929 (2021) 24 February 2021 SCIENCE TRANSLATIONAL MEDICINE | RESEARCH ARTICLE 1 of 12 TRANSPLANTATION Transitional B cell cytokines predict renal allograft outcomes Aravind Cherukuri 1,2 , Alan D. Salama 3 , Rajil Mehta 1,2 , Kanishka Mohib 1 , Leting Zheng 1,4 , Ciara Magee 3 , Mark Harber 3 , Hans Stauss 5 , Richard J. Baker 6 , Amit Tevar 1 , Douglas Landsittel 1,7 , Fadi G. Lakkis 1,2,8 , Sundaram Hariharan 1,2 , David M. Rothstein 1,2,8 * Early immunological biomarkers that predict rejection and chronic allograft loss are needed to inform preemptive therapy and improve long-term outcomes. Here, we prospectively examined the ratio of interleukin-10 (IL-10) to tumor necrosis factor– (TNF) produced by transitional-1 B cells (T1B) 3 months after transplantation as a predictive biomarker for clinical and subclinical renal allograft rejection and subsequent clinical course. In both Training (n = 162) and Internal Validation (n = 82) Sets, the T1B IL-10/TNF ratio 3 months after transplantation predicted both clinical and subclinical rejection anytime in the first year. The biomarker also predicted sub- sequent late rejection with a lead time averaging 8 months. Among biomarker high-risk patients, 60% had early rejection, of which 48% recurred later in the first posttransplant year. Among high-risk patients without early re- jection, 74% developed rejection later in the first year. In contrast, only 5% of low-risk patients had early and 5% late rejection. The biomarker also predicted rejection in an External Validation Set (n = 95) and in key patient subgroups, confirming generalizability. Biomarker high-risk patients exhibited progressively worse renal func- tion and decreased 5-year graft survival compared to low-risk patients. Treatment of B cells with anti-TNF in vitro augmented the IL-10/TNF ratio, restored regulatory activity, and inhibited plasmablast differentiation. To con- clude, the T1B IL-10/TNF ratio was validated as a strong predictive biomarker of renal allograft outcomes and provides a rationale for preemptive therapeutic intervention with TNF blockade. INTRODUCTION Despite remarkable short-term renal transplant outcomes, about 35% of recipients lose their allograft by 10 years, and this has changed little with time (1). Such late allograft loss is increasingly attributed to the cumulative effects of underlying subacute immunological injury identified only after irreversible damage has already occurred (2, 3). In this regard, up to 30% of surveillance biopsies in the first posttransplant year show subclinical rejection (4–6). This suggests that, although current immunosuppression reduces acute clinical rejection, it does not always prevent more subtle immune-mediated damage that can smolder unrecognized. Thus, there is a major interest in identifying high-risk patients far enough in advance to allow preemptive treatment before the effector alloimmune response has fully matured and irreversible damage has begun to occur. Currently used clinical and laboratory parameters, including delayed graft function (DGF), serum creatinine, and donor-specific antibody (DSA), are associated with worse outcomes but have limited predictive value (7, 8). Although frequent surveillance biopsies might identify patients with acute rejection, they are invasive and impractical (6). Moreover, they cannot identify individuals at high risk for fu- ture rejection or those whose rejection may be refractory to therapy. Thus, there is an imminent need for noninvasive biomarkers to not only identify but also predict future rejection and poor long-term outcomes. Various transcriptional profiles and protein signatures in peripheral blood or urine correlate with the diagnosis of rejection, but their ability to predict future rejection or long-term outcomes is unclear (9–12). Although transcriptional profiles were recently reported to predict rejection and long-term outcomes, their perform- ance was not assessed in key patient subgroups (including immuno- suppressive regimen, medication adherence, opportunistic viral infections, DGF, and DSA), limiting their generalizability (9, 13–15). Moreover, these studies did not provide mechanistic insights that might guide therapeutic intervention. B cells with regulatory activity (Bregs) have been implicated in modulating the immune response in alloimmunity, autoimmunity, and infectious immunity in both humans and mice (16–21). How- ever, there are no specific markers for Bregs. We previously showed that human regulatory B cell activity is best defined by the ratio of interleukin-10 (IL-10) to tumor necrosis factor– (TNF) expres- sion by immature (transitional) B cells and that this ratio falls with late rejection (22, 23). Here, we conducted a prospective, multi- center observational study to determine whether the ratio of IL-10/ TNF expression by the transitional-1 B (T1B) subset, a marker of regulatory B cells in the peripheral blood, is an early predictor of acute rejection and clinical course in adult renal transplant recipi- ents. Furthermore, we studied the effect of TNF blockade on B cell regulatory activity to provide a rationale for personalized therapeu- tic intervention. RESULTS University of Pittsburgh Medical Center allograft outcomes We first assessed clinical outcomes in all patients receiving transplants at the University of Pittsburgh Medical Center (UPMC) between 2013 and 2015 (n = 596). When not medically contraindicated, patients underwent two surveillance biopsies at 3 and 12 months in 1 Thomas E. Starzl Transplantation Institute, Department of Surgery, University of Pittsburgh, Pittsburgh, PA 15261, USA. 2 Renal and Electrolyte Division, Department of Medicine, University of Pittsburgh, Pittsburgh, PA 15261, USA. 3 University Col- lege of London Department of Renal Medicine, Royal Free Hospital, London NW3 2QG, UK. 4 Department of Rheumatology and Immunology, First Affiliated Hospital of Guangxi Medical University, Nanning, Guangxi 530021, China. 5 UCL Institute of Immunity and Transplantation, Royal Free Hospital, London NW3 2QG, UK. 6 Renal Unit, St. James’s University Hospital, Leeds LS9 7TF, UK. 7 Department of Biomedical Informatics, University of Pittsburgh, Pittsburgh, PA 15206, USA. 8 Department of Immunology, University of Pittsburgh, Pittsburgh, PA 15213, USA. *Corresponding author. Email: [email protected] Copyright © 2021 The Authors, some rights reserved; exclusive licensee American Association for the Advancement of Science. No claim to original U.S. Government Works
Transcript of TRANSPLANTATION Copyright © 2021 Transitional B cell ...

Cherukuri et al., Sci. Transl. Med. 13, eabe4929 (2021) 24 February 2021
S C I E N C E T R A N S L A T I O N A L M E D I C I N E | R E S E A R C H A R T I C L E
1 of 12
T R A N S P L A N T A T I O N
Transitional B cell cytokines predict renal allograft outcomesAravind Cherukuri1,2, Alan D. Salama3, Rajil Mehta1,2, Kanishka Mohib1, Leting Zheng1,4, Ciara Magee3, Mark Harber3, Hans Stauss5, Richard J. Baker6, Amit Tevar1, Douglas Landsittel1,7, Fadi G. Lakkis1,2,8, Sundaram Hariharan1,2, David M. Rothstein1,2,8*
Early immunological biomarkers that predict rejection and chronic allograft loss are needed to inform preemptive therapy and improve long-term outcomes. Here, we prospectively examined the ratio of interleukin-10 (IL-10) to tumor necrosis factor– (TNF) produced by transitional-1 B cells (T1B) 3 months after transplantation as a predictive biomarker for clinical and subclinical renal allograft rejection and subsequent clinical course. In both Training (n = 162) and Internal Validation (n = 82) Sets, the T1B IL-10/TNF ratio 3 months after transplantation predicted both clinical and subclinical rejection anytime in the first year. The biomarker also predicted sub-sequent late rejection with a lead time averaging 8 months. Among biomarker high-risk patients, 60% had early rejection, of which 48% recurred later in the first posttransplant year. Among high-risk patients without early re-jection, 74% developed rejection later in the first year. In contrast, only 5% of low-risk patients had early and 5% late rejection. The biomarker also predicted rejection in an External Validation Set (n = 95) and in key patient subgroups, confirming generalizability. Biomarker high-risk patients exhibited progressively worse renal func-tion and decreased 5-year graft survival compared to low-risk patients. Treatment of B cells with anti-TNF in vitro augmented the IL-10/TNF ratio, restored regulatory activity, and inhibited plasmablast differentiation. To con-clude, the T1B IL-10/TNF ratio was validated as a strong predictive biomarker of renal allograft outcomes and provides a rationale for preemptive therapeutic intervention with TNF blockade.
INTRODUCTIONDespite remarkable short-term renal transplant outcomes, about 35% of recipients lose their allograft by 10 years, and this has changed little with time (1). Such late allograft loss is increasingly attributed to the cumulative effects of underlying subacute immunological injury identified only after irreversible damage has already occurred (2, 3). In this regard, up to 30% of surveillance biopsies in the first posttransplant year show subclinical rejection (4–6). This suggests that, although current immunosuppression reduces acute clinical rejection, it does not always prevent more subtle immune-mediated damage that can smolder unrecognized. Thus, there is a major interest in identifying high-risk patients far enough in advance to allow preemptive treatment before the effector alloimmune response has fully matured and irreversible damage has begun to occur.
Currently used clinical and laboratory parameters, including delayed graft function (DGF), serum creatinine, and donor-specific antibody (DSA), are associated with worse outcomes but have limited predictive value (7, 8). Although frequent surveillance biopsies might identify patients with acute rejection, they are invasive and impractical (6). Moreover, they cannot identify individuals at high risk for fu-ture rejection or those whose rejection may be refractory to therapy. Thus, there is an imminent need for noninvasive biomarkers to not only identify but also predict future rejection and poor long-term
outcomes. Various transcriptional profiles and protein signatures in peripheral blood or urine correlate with the diagnosis of rejection, but their ability to predict future rejection or long-term outcomes is unclear (9–12). Although transcriptional profiles were recently reported to predict rejection and long-term outcomes, their perform-ance was not assessed in key patient subgroups (including immuno-suppressive regimen, medication adherence, opportunistic viral infections, DGF, and DSA), limiting their generalizability (9, 13–15). Moreover, these studies did not provide mechanistic insights that might guide therapeutic intervention.
B cells with regulatory activity (Bregs) have been implicated in modulating the immune response in alloimmunity, autoimmunity, and infectious immunity in both humans and mice (16–21). How-ever, there are no specific markers for Bregs. We previously showed that human regulatory B cell activity is best defined by the ratio of interleukin-10 (IL-10) to tumor necrosis factor– (TNF) expres-sion by immature (transitional) B cells and that this ratio falls with late rejection (22, 23). Here, we conducted a prospective, multi-center observational study to determine whether the ratio of IL-10/TNF expression by the transitional-1 B (T1B) subset, a marker of regulatory B cells in the peripheral blood, is an early predictor of acute rejection and clinical course in adult renal transplant recipi-ents. Furthermore, we studied the effect of TNF blockade on B cell regulatory activity to provide a rationale for personalized therapeu-tic intervention.
RESULTSUniversity of Pittsburgh Medical Center allograft outcomesWe first assessed clinical outcomes in all patients receiving transplants at the University of Pittsburgh Medical Center (UPMC) between 2013 and 2015 (n = 596). When not medically contraindicated, patients underwent two surveillance biopsies at 3 and 12 months in
1Thomas E. Starzl Transplantation Institute, Department of Surgery, University of Pittsburgh, Pittsburgh, PA 15261, USA. 2Renal and Electrolyte Division, Department of Medicine, University of Pittsburgh, Pittsburgh, PA 15261, USA. 3University Col-lege of London Department of Renal Medicine, Royal Free Hospital, London NW3 2QG, UK. 4Department of Rheumatology and Immunology, First Affiliated Hospital of Guangxi Medical University, Nanning, Guangxi 530021, China. 5UCL Institute of Immunity and Transplantation, Royal Free Hospital, London NW3 2QG, UK. 6Renal Unit, St. James’s University Hospital, Leeds LS9 7TF, UK. 7Department of Biomedical Informatics, University of Pittsburgh, Pittsburgh, PA 15206, USA. 8Department of Immunology, University of Pittsburgh, Pittsburgh, PA 15213, USA.*Corresponding author. Email: [email protected]
Copyright © 2021 The Authors, some rights reserved; exclusive licensee American Association for the Advancement of Science. No claim to original U.S. Government Works

Cherukuri et al., Sci. Transl. Med. 13, eabe4929 (2021) 24 February 2021
S C I E N C E T R A N S L A T I O N A L M E D I C I N E | R E S E A R C H A R T I C L E
2 of 12
addition to for-cause biopsies. Twenty-one percent of patients had no biopsies in the first year. In the remaining 468 patients, 28% (n = 138) had one biopsy, and 72% (n = 330) had paired early and late biopsies (Fig. 1A). In these 468 patients, clinical T cell–mediated rejection (cTCMR) was diagnosed in 16.9% in the first year, and surveillance biopsies identified an additional 18.8% of patients with subclinical T cell–mediated rejection (scTCMR) (Fig. 1A). Overall, 3% had mixed antibody-mediated rejection (ABMR) and TCMR, and none had pure ABMR. TCMR in the first year was associated with a similar decrease in 5-year graft survival whether analyzed in all 596 patients transplanted between 2013 and 2015 or only in the 468 patients who had at least one biopsy (fig. S1).
The availability of paired biopsies (early and late, n = 330) al-lowed us to analyze TCMR progression in the first year (Fig. 1A). Of these 330 patients, 25% had “early” TCMR (0 to 4 months), of which more than half (14%) was subclinical (Fig. 1B). Despite treatment,
44% of those with early TCMR had recurrent or recalcitrant “late” TCMR (5 to 12 months). Of the patients without early TCMR (75%), 23% developed de novo late TCMR. Overall, 28% (94 of 330 patients) had late TCMR, of which 70% (66 of 94) was scTCMR. In this cohort with paired biopsies, any TCMR in the first year was associated with worse graft survival at 5 years (Fig. 1C). Patients with early TCMR that resolved with therapy did not have worse outcomes than patients with no TCMR (P = 0.07; Fig. 1D). In contrast, those with late TCMR (either recurrent or recalcitrant TCMR or de novo TCMR), had significantly worse graft survival, identifying patients with late TCMR as a high-risk group (P < 0.001). Both late scTCMR and cTCMR were associated with decreased graft survival (P = 0.01 and P < 0.001, respectively; Fig. 1E). Thus, we aimed to identify a biomarker that not only predicts any rejection in the first year but also specifically predicts late rejection and long-term graft outcomes.
Biomarker study populationOf the 468 patients transplanted between 2013 and 2015 who had at least one biopsy, 244 participated in the UPMC biorepository. All were included in the biomarker study (162 in the Training Set and 82 in the Validation Set; Fig. 2). The breakdown of biopsies by timing and type is depicted in Fig. 2. Key characteristics of study partici-pants and nonparticipants were similar except for higher live donor frequency and associated shorter cold ischemia time among study participants (table S1). TCMR rates, both clinical and subclinical, were comparable.
Fig. 1. TCMR in the first posttransplant year and associated graft loss. (A) Flow diagram showing UPMC transplant recipients according to number of biopsies. (B) Three hundred thirty of 596 patients in total underwent paired biopsies at both early (0 to 4 months) and late (5 to 12 months) time points in the first posttrans-plant year. The graphic depicts incidence of TCMR and its progression at early and late time points. (C) Five-year death-censored graft survival in the 330 patients with or without TCMR in the first posttransplant year. (D) Five-year death-censored graft survival in patient groups defined by the progression of TCMR in the first posttransplant year. ns, not significant. (E) Five-year death-censored graft survival in patients with or without late TCMR. Survival analysis was done by Kaplan-Meier method, and curves were compared by log-rank tests. *P < 0.001; **P = 0.01.
Fig. 2. Biomarker study flow diagram for the UPMC cohorts. Patients were enrolled from January 2013 to December 2015. Two surveillance biopsies were planned at 3 months (range, 2 to 4 months) and 12 months (range, 11 to 14 months) along with any for-cause biopsies. For-cause biopsies were performed either for new on-set proteinuria of >1 g or a 30% increase in serum creatinine from baseline. Patients with Banff >1B TCMR were subjected to a repeat biopsy 2 months after initiation of therapy. A total of 495 biopsies were performed in total (Training Set, 327; Internal Validation Set, 168). *Four patients were excluded (three rituximab treated and one with no viable cells).
Cherukuri et al., Sci. Transl. Med. 13, eabe4929 (2021) 24 February 2021
S C I E N C E T R A N S L A T I O N A L M E D I C I N E | R E S E A R C H A R T I C L E
3 of 12
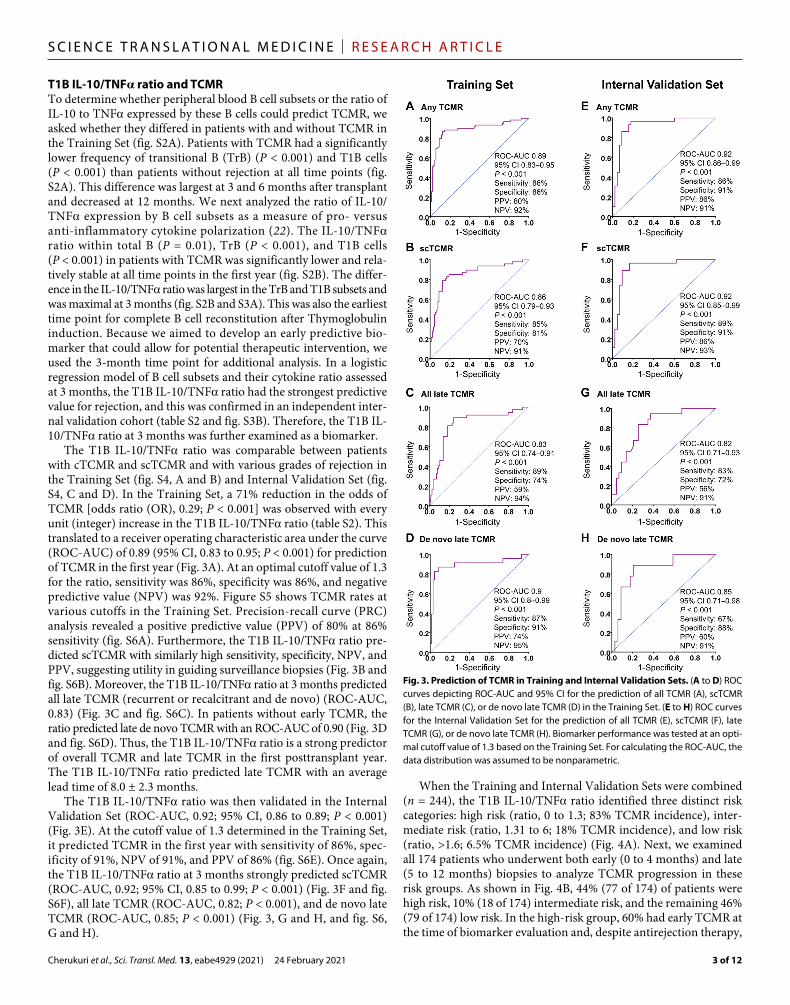
T1B IL-10/TNF ratio and TCMRTo determine whether peripheral blood B cell subsets or the ratio of IL-10 to TNF expressed by these B cells could predict TCMR, we asked whether they differed in patients with and without TCMR in the Training Set (fig. S2A). Patients with TCMR had a significantly lower frequency of transitional B (TrB) (P < 0.001) and T1B cells (P < 0.001) than patients without rejection at all time points (fig. S2A). This difference was largest at 3 and 6 months after transplant and decreased at 12 months. We next analyzed the ratio of IL-10/TNF expression by B cell subsets as a measure of pro- versus anti-inflammatory cytokine polarization (22). The IL-10/TNF ratio within total B (P = 0.01), TrB (P < 0.001), and T1B cells (P < 0.001) in patients with TCMR was significantly lower and rela-tively stable at all time points in the first year (fig. S2B). The differ-ence in the IL-10/TNF ratio was largest in the TrB and T1B subsets and was maximal at 3 months (fig. S2B and S3A). This was also the earliest time point for complete B cell reconstitution after Thymoglobulin induction. Because we aimed to develop an early predictive bio-marker that could allow for potential therapeutic intervention, we used the 3-month time point for additional analysis. In a logistic regression model of B cell subsets and their cytokine ratio assessed at 3 months, the T1B IL-10/TNF ratio had the strongest predictive value for rejection, and this was confirmed in an independent inter-nal validation cohort (table S2 and fig. S3B). Therefore, the T1B IL-10/TNF ratio at 3 months was further examined as a biomarker.
The T1B IL-10/TNF ratio was comparable between patients with cTCMR and scTCMR and with various grades of rejection in the Training Set (fig. S4, A and B) and Internal Validation Set (fig. S4, C and D). In the Training Set, a 71% reduction in the odds of TCMR [odds ratio (OR), 0.29; P < 0.001] was observed with every unit (integer) increase in the T1B IL-10/TNF ratio (table S2). This translated to a receiver operating characteristic area under the curve (ROC-AUC) of 0.89 (95% CI, 0.83 to 0.95; P < 0.001) for prediction of TCMR in the first year (Fig. 3A). At an optimal cutoff value of 1.3 for the ratio, sensitivity was 86%, specificity was 86%, and negative predictive value (NPV) was 92%. Figure S5 shows TCMR rates at various cutoffs in the Training Set. Precision-recall curve (PRC) analysis revealed a positive predictive value (PPV) of 80% at 86% sensitivity (fig. S6A). Furthermore, the T1B IL-10/TNF ratio pre-dicted scTCMR with similarly high sensitivity, specificity, NPV, and PPV, suggesting utility in guiding surveillance biopsies (Fig. 3B and fig. S6B). Moreover, the T1B IL-10/TNF ratio at 3 months predicted all late TCMR (recurrent or recalcitrant and de novo) (ROC-AUC, 0.83) (Fig. 3C and fig. S6C). In patients without early TCMR, the ratio predicted late de novo TCMR with an ROC-AUC of 0.90 (Fig. 3D and fig. S6D). Thus, the T1B IL-10/TNF ratio is a strong predictor of overall TCMR and late TCMR in the first posttransplant year. The T1B IL-10/TNF ratio predicted late TCMR with an average lead time of 8.0 ± 2.3 months.
The T1B IL-10/TNF ratio was then validated in the Internal Validation Set (ROC-AUC, 0.92; 95% CI, 0.86 to 0.89; P < 0.001) (Fig. 3E). At the cutoff value of 1.3 determined in the Training Set, it predicted TCMR in the first year with sensitivity of 86%, spec-ificity of 91%, NPV of 91%, and PPV of 86% (fig. S6E). Once again, the T1B IL-10/TNF ratio at 3 months strongly predicted scTCMR (ROC-AUC, 0.92; 95% CI, 0.85 to 0.99; P < 0.001) (Fig. 3F and fig. S6F), all late TCMR (ROC-AUC, 0.82; P < 0.001), and de novo late TCMR (ROC-AUC, 0.85; P < 0.001) (Fig. 3, G and H, and fig. S6, G and H).
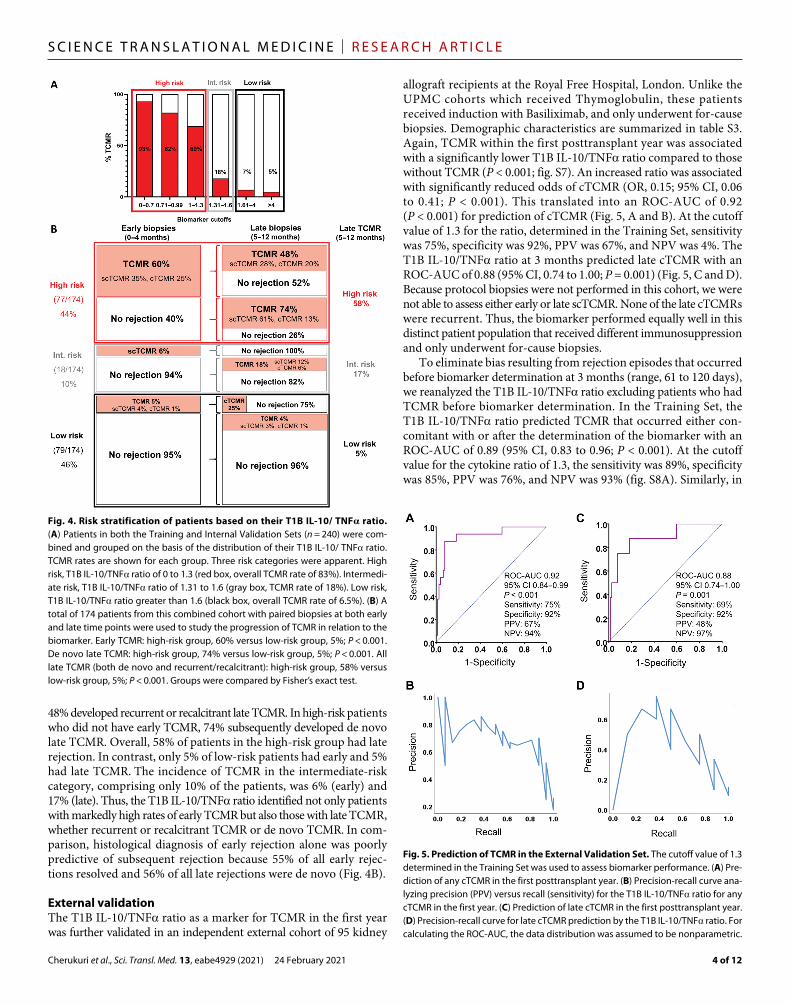
When the Training and Internal Validation Sets were combined (n = 244), the T1B IL-10/TNF ratio identified three distinct risk categories: high risk (ratio, 0 to 1.3; 83% TCMR incidence), inter-mediate risk (ratio, 1.31 to 6; 18% TCMR incidence), and low risk (ratio, >1.6; 6.5% TCMR incidence) (Fig. 4A). Next, we examined all 174 patients who underwent both early (0 to 4 months) and late (5 to 12 months) biopsies to analyze TCMR progression in these risk groups. As shown in Fig. 4B, 44% (77 of 174) of patients were high risk, 10% (18 of 174) intermediate risk, and the remaining 46% (79 of 174) low risk. In the high-risk group, 60% had early TCMR at the time of biomarker evaluation and, despite antirejection therapy,
Fig. 3. Prediction of TCMR in Training and Internal Validation Sets. (A to D) ROC curves depicting ROC-AUC and 95% CI for the prediction of all TCMR (A), scTCMR (B), late TCMR (C), or de novo late TCMR (D) in the Training Set. (E to H) ROC curves for the Internal Validation Set for the prediction of all TCMR (E), scTCMR (F), late TCMR (G), or de novo late TCMR (H). Biomarker performance was tested at an opti-mal cutoff value of 1.3 based on the Training Set. For calculating the ROC-AUC, the data distribution was assumed to be nonparametric.
Cherukuri et al., Sci. Transl. Med. 13, eabe4929 (2021) 24 February 2021
S C I E N C E T R A N S L A T I O N A L M E D I C I N E | R E S E A R C H A R T I C L E
4 of 12
48% developed recurrent or recalcitrant late TCMR. In high-risk patients who did not have early TCMR, 74% subsequently developed de novo late TCMR. Overall, 58% of patients in the high-risk group had late rejection. In contrast, only 5% of low-risk patients had early and 5% had late TCMR. The incidence of TCMR in the intermediate-risk category, comprising only 10% of the patients, was 6% (early) and 17% (late). Thus, the T1B IL-10/TNF ratio identified not only patients with markedly high rates of early TCMR but also those with late TCMR, whether recurrent or recalcitrant TCMR or de novo TCMR. In com-parison, histological diagnosis of early rejection alone was poorly predictive of subsequent rejection because 55% of all early rejec-tions resolved and 56% of all late rejections were de novo (Fig. 4B).
External validationThe T1B IL-10/TNF ratio as a marker for TCMR in the first year was further validated in an independent external cohort of 95 kidney
allograft recipients at the Royal Free Hospital, London. Unlike the UPMC cohorts which received Thymoglobulin, these patients received induction with Basiliximab, and only underwent for-cause biopsies. Demographic characteristics are summarized in table S3. Again, TCMR within the first posttransplant year was associated with a significantly lower T1B IL-10/TNF ratio compared to those without TCMR (P < 0.001; fig. S7). An increased ratio was associated with significantly reduced odds of cTCMR (OR, 0.15; 95% CI, 0.06 to 0.41; P < 0.001). This translated into an ROC-AUC of 0.92 (P < 0.001) for prediction of cTCMR (Fig. 5, A and B). At the cutoff value of 1.3 for the ratio, determined in the Training Set, sensitivity was 75%, specificity was 92%, PPV was 67%, and NPV was 4%. The T1B IL-10/TNF ratio at 3 months predicted late cTCMR with an ROC-AUC of 0.88 (95% CI, 0.74 to 1.00; P = 0.001) (Fig. 5, C and D). Because protocol biopsies were not performed in this cohort, we were not able to assess either early or late scTCMR. None of the late cTCMRs were recurrent. Thus, the biomarker performed equally well in this distinct patient population that received different immunosuppression and only underwent for-cause biopsies.
To eliminate bias resulting from rejection episodes that occurred before biomarker determination at 3 months (range, 61 to 120 days), we reanalyzed the T1B IL-10/TNF ratio excluding patients who had TCMR before biomarker determination. In the Training Set, the T1B IL-10/TNF ratio predicted TCMR that occurred either con-comitant with or after the determination of the biomarker with an ROC-AUC of 0.89 (95% CI, 0.83 to 0.96; P < 0.001). At the cutoff value for the cytokine ratio of 1.3, the sensitivity was 89%, specificity was 85%, PPV was 76%, and NPV was 93% (fig. S8A). Similarly, in
Fig. 4. Risk stratification of patients based on their T1B IL-10/ TNF ratio. (A) Patients in both the Training and Internal Validation Sets (n = 240) were com-bined and grouped on the basis of the distribution of their T1B IL-10/ TNF ratio. TCMR rates are shown for each group. Three risk categories were apparent. High risk, T1B IL-10/TNF ratio of 0 to 1.3 (red box, overall TCMR rate of 83%). Intermedi-ate risk, T1B IL-10/TNF ratio of 1.31 to 1.6 (gray box, TCMR rate of 18%). Low risk, T1B IL-10/TNF ratio greater than 1.6 (black box, overall TCMR rate of 6.5%). (B) A total of 174 patients from this combined cohort with paired biopsies at both early and late time points were used to study the progression of TCMR in relation to the biomarker. Early TCMR: high-risk group, 60% versus low-risk group, 5%; P < 0.001. De novo late TCMR: high-risk group, 74% versus low-risk group, 5%; P < 0.001. All late TCMR (both de novo and recurrent/recalcitrant): high-risk group, 58% versus low-risk group, 5%; P < 0.001. Groups were compared by Fisher’s exact test.
Fig. 5. Prediction of TCMR in the External Validation Set. The cutoff value of 1.3 determined in the Training Set was used to assess biomarker performance. (A) Pre-diction of any cTCMR in the first posttransplant year. (B) Precision-recall curve ana-lyzing precision (PPV) versus recall (sensitivity) for the T1B IL-10/TNF ratio for any cTCMR in the first year. (C) Prediction of late cTCMR in the first posttransplant year. (D) Precision-recall curve for late cTCMR prediction by the T1B IL-10/TNF ratio. For calculating the ROC-AUC, the data distribution was assumed to be nonparametric.

Cherukuri et al., Sci. Transl. Med. 13, eabe4929 (2021) 24 February 2021
S C I E N C E T R A N S L A T I O N A L M E D I C I N E | R E S E A R C H A R T I C L E
5 of 12
both the Internal and External Validation Sets, the T1B cytokine ratio strongly predicted TCMR in the first posttransplant year even when patients with TCMR diagnosed before biomarker determina-tion were excluded (fig. S8, B and C).
Stratified analysisOnce the biomarker was validated, we combined all three patient cohorts to assess its performance in patients stratified by key demo-graphic and clinical variables. As shown in Fig. 6, the ratio was associated with a similarly low OR regardless of recipient age, gender, ethnicity, donor source, human leukocyte antigen (HLA) mismatches, type of induction immunosuppression, DGF, serum creatinine at 3 months, or adherence to immunosuppression. Furthermore, the ratio predicted TCMR in all subgroups, with ROC-AUCs ranging from 0.87 to 0.94 (Fig. 6). Although patients with DSA in the first year had a lower ratio than those without DSA, the biomarker performed equally well in both groups (Fig. 6 and fig. S9). Last, the ratio was not influenced by either cytomegalovirus (CMV) or BK virus (BKV) infection (Fig. 6 and fig. S10). Thus, the T1B IL-10/TNF ratio predicted TCMR in key patient subgroups, confirming generalizability.
To assess reproducibility, two trained laboratory personnel using the same experimental protocol independently performed assays to determine the IL-10/TNF ratio in samples from eight healthy donors, starting with separate frozen aliquots of peripheral blood mononuclear cells (PBMCs) through flow cytometric analysis. The mean coefficient of variation (CV) between these personnel was
12.6% (fig. S11A). Furthermore, the CV for T1B IL-10/TNF ratio determined by the same individual on two different days (n = 6) was 3.8% (fig. S11B). Thus, both interpersonal and intrapersonal vari-ability in evaluating the IL-10/TNF ratio were relatively low.
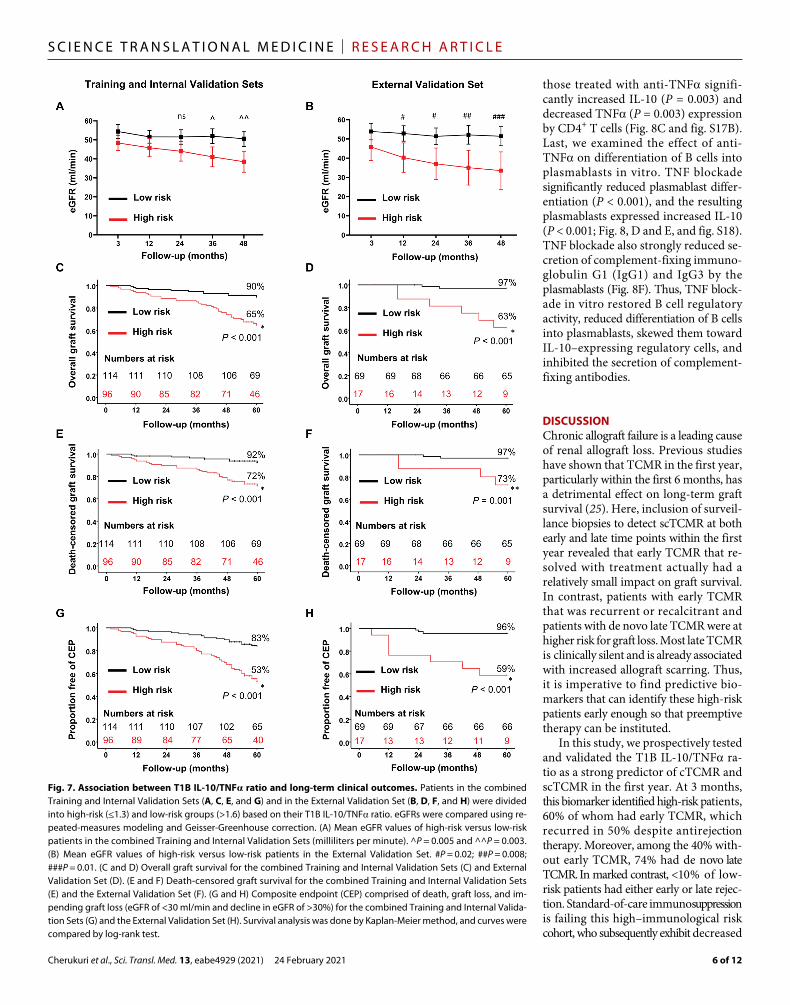
Long-term allograft outcomesOur ultimate goal was to develop an early biomarker that risk-stratifies patients for long-term allograft outcomes. Analysis of 1-year biop-sies in the UPMC cohorts revealed an increase in chronic damage manifest as interstitial fibrosis and tubular atrophy (IFTA) in high-risk (ratio of ≤1.3) compared to low-risk (ratio of >1.6) patients (fig. S12). Renal function, assessed by estimated glomerular filtration rate (eGFR), progressively declined in high-risk compared to low-risk patients in both the UPMC (P = 0.003) and the London (P = 0.01) cohorts between 3 months and 4 years after transplantation (Fig. 7, A and B). High-risk patients had significantly worse 5-year overall and death-censored graft survival compared to low-risk pa-tients (P < 0.001; Fig. 7, C to E; P = 0.001; Fig. 7F). Furthermore, a composite endpoint of allograft loss or impending graft loss (eGFR of <30 ml/min and eGFR of >30%) was also significantly greater in the high-risk group (P < 0.001; Fig. 7, G and H). In a multivariate Cox proportional hazard model, an increase in the T1B IL-10/TNF ratio was associated with a significantly lower hazard of death-censored graft loss (P = 0.004), overall graft loss (P = 0.001), or the composite endpoint (P < 0.001), independent of factors commonly associated with poor transplant outcomes such as eGFR at 3 months, DGF, and DSA (table S4). Last, in the subset of patients with no rejection at 3 months, biomarker high-risk patients still had significantly worse 5-year overall and death-censored graft survival (P = 0.001 or lower) and a higher incidence of the composite endpoint as compared to low-risk patients (P = 0.002 or lower), highlighting the ability of the biomarker to risk-stratify apparently stable renal transplant patients who lacked concomitant or prior rejection at 3 months (fig. S13). Thus, a low T1B IL-10/TNF ratio strongly predicted TCMR and was also associated with early allograft scarring, progressive decline in allograft function, and graft loss.
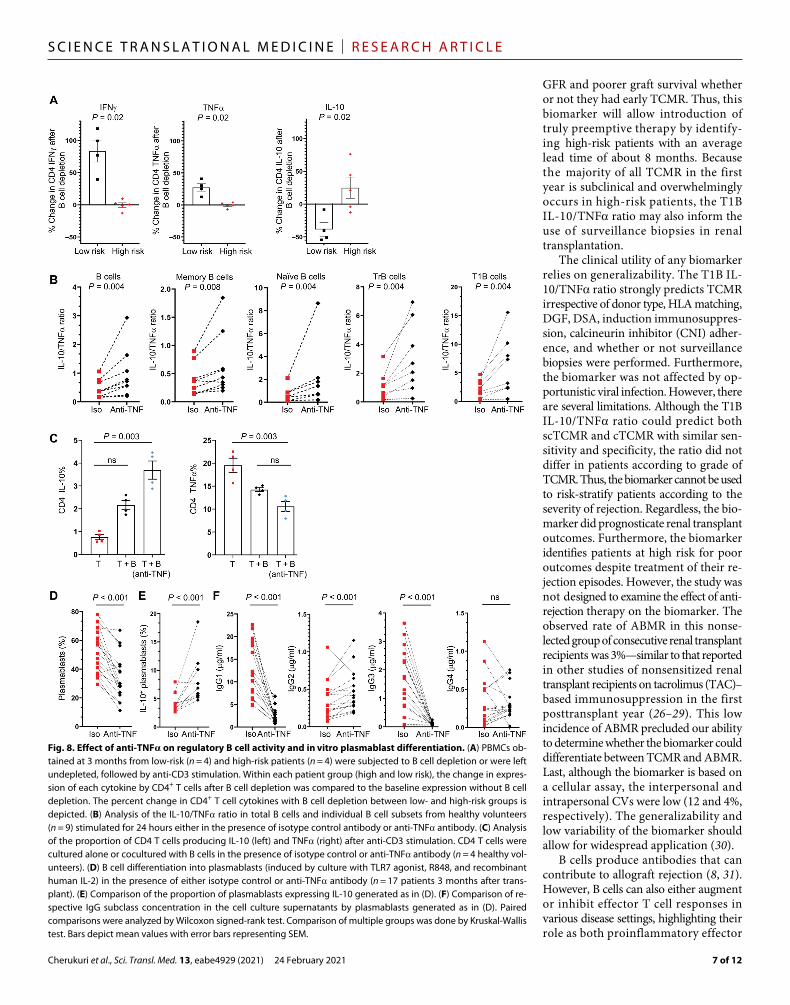
Effect of TNF blockade on B cellsBecause B cells in high-risk patients exhibited a more proinflamma-tory cytokine profile based on their low IL-10/TNF ratio, we com-pared the regulatory activity of B cells in PBMCs from high- and low-risk patients by examining the effect of B cell depletion on cyto-kine expression by activated CD4+ T cells (fig. S14A). B cell deple-tion significantly increased TNF (P = 0.02) and interferon- (IFN) (P = 0.02) expression and decreased IL-10 expression (P = 0.02) by CD4+ T cells in PBMCs from low-risk patients, suggesting that B cells were exerting regulatory activity (Fig. 8A and fig. S14B). In contrast, B cell depletion increased expression of the regulatory cytokine IL-10 by CD4+ T cells in PBMCs from high-risk patients, suggesting that B cells in these patients were predominantly proinflammatory. Next, B cells from healthy volunteers were stimulated in the presence or absence of anti-TNF (fig. S15A). Anti-TNF treatment not only increased the IL-10/TNF ratio in B cells and individual B cell subsets, but also inhibited the expression of other proinflam-matory cytokines including IL-6, IL-12, and granulocyte-macrophage colony-stimulating factor (GM-CSF; Fig. 8B and figs. S15B and S16). B cells were then washed and cultured with activated autologous CD4+ T cells to examine B cell regulatory activity in an established in vitro assay (fig. S17A) (22, 24). Compared to untreated B cells,
Fig. 6. Forest plot of T1B IL-10/TNF ratio, TCMR, and patient subgroups. Patients combined from all three study cohorts were stratified by key clini-cal variables. The OR for TCMR was determined for each subgroup using logistic regression. The forest plot depicts odds ratios (ORs) for TCMR for each integer unit increase in the T1B IL-10/TNF ratio. The column to the right shows the ROC-AUC derived for the predictive ability of IL-10/TNF ratio in each patient subgroup to identify TCMR in the first posttransplant year. Error bars represent 95% CI for the ORs. MM, mismatch.
Cherukuri et al., Sci. Transl. Med. 13, eabe4929 (2021) 24 February 2021
S C I E N C E T R A N S L A T I O N A L M E D I C I N E | R E S E A R C H A R T I C L E
6 of 12
those treated with anti-TNF signifi-cantly increased IL-10 (P = 0.003) and decreased TNF (P = 0.003) expression by CD4+ T cells (Fig. 8C and fig. S17B). Last, we examined the effect of anti- TNF on differentiation of B cells into plasmablasts in vitro. TNF blockade significantly reduced plasmablast differ-entiation (P < 0.001), and the resulting plasmablasts expressed increased IL-10 (P < 0.001; Fig. 8, D and E, and fig. S18). TNF blockade also strongly reduced se-cretion of complement-fixing immuno-globulin G1 (IgG1) and IgG3 by the plasmablasts (Fig. 8F). Thus, TNF block-ade in vitro restored B cell regulatory activity, reduced differentiation of B cells into plasmablasts, skewed them toward IL-10–expressing regulatory cells, and inhibited the secretion of complement- fixing antibodies.
DISCUSSIONChronic allograft failure is a leading cause of renal allograft loss. Previous studies have shown that TCMR in the first year, particularly within the first 6 months, has a detrimental effect on long-term graft survival (25). Here, inclusion of surveil-lance biopsies to detect scTCMR at both early and late time points within the first year revealed that early TCMR that re-solved with treatment actually had a relatively small impact on graft survival. In contrast, patients with early TCMR that was recurrent or recalcitrant and patients with de novo late TCMR were at higher risk for graft loss. Most late TCMR is clinically silent and is already associated with increased allograft scarring. Thus, it is imperative to find predictive bio-markers that can identify these high-risk patients early enough so that preemptive therapy can be instituted.
In this study, we prospectively tested and validated the T1B IL-10/TNF ra-tio as a strong predictor of cTCMR and scTCMR in the first year. At 3 months, this biomarker identified high-risk patients, 60% of whom had early TCMR, which recurred in 50% despite antirejection therapy. Moreover, among the 40% with-out early TCMR, 74% had de novo late TCMR. In marked contrast, <10% of low-risk patients had either early or late rejec-tion. Standard-of-care immuno suppression is failing this high–immunological risk cohort, who subsequently exhibit decreased
Fig. 7. Association between T1B IL-10/TNF ratio and long-term clinical outcomes. Patients in the combined Training and Internal Validation Sets (A, C, E, and G) and in the External Validation Set (B, D, F, and H) were divided into high-risk (≤1.3) and low-risk groups (>1.6) based on their T1B IL-10/TNF ratio. eGFRs were compared using re-peated-measures modeling and Geisser-Greenhouse correction. (A) Mean eGFR values of high-risk versus low-risk patients in the combined Training and Internal Validation Sets (milliliters per minute). ^P = 0.005 and ^^P = 0.003. (B) Mean eGFR values of high-risk versus low-risk patients in the External Validation Set. #P = 0.02; ##P = 0.008; ###P = 0.01. (C and D) Overall graft survival for the combined Training and Internal Validation Sets (C) and External Validation Set (D). (E and F) Death-censored graft survival for the combined Training and Internal Validation Sets (E) and the External Validation Set (F). (G and H) Composite endpoint (CEP) comprised of death, graft loss, and im-pending graft loss (eGFR of <30 ml/min and decline in eGFR of >30%) for the combined Training and Internal Valida-tion Sets (G) and the External Validation Set (H). Survival analysis was done by Kaplan-Meier method, and curves were compared by log-rank test.
Cherukuri et al., Sci. Transl. Med. 13, eabe4929 (2021) 24 February 2021
S C I E N C E T R A N S L A T I O N A L M E D I C I N E | R E S E A R C H A R T I C L E
7 of 12
GFR and poorer graft survival whether or not they had early TCMR. Thus, this biomarker will allow introduction of truly preemptive therapy by identify-ing high-risk patients with an average lead time of about 8 months. Because the majority of all TCMR in the first year is subclinical and overwhelmingly occurs in high-risk patients, the T1B IL-10/TNF ratio may also inform the use of surveillance biopsies in renal transplantation.
The clinical utility of any biomarker relies on generalizability. The T1B IL-10/TNF ratio strongly predicts TCMR irrespective of donor type, HLA matching, DGF, DSA, induction immunosuppres-sion, calcineurin inhibitor (CNI) adher-ence, and whether or not surveillance biopsies were performed. Furthermore, the biomarker was not affected by op-portunistic viral infection. However, there are several limitations. Although the T1B IL-10/TNF ratio could predict both scTCMR and cTCMR with similar sen-sitivity and specificity, the ratio did not differ in patients according to grade of TCMR. Thus, the biomarker cannot be used to risk-stratify patients according to the severity of rejection. Regardless, the bio-marker did prognosticate renal transplant outcomes. Furthermore, the biomarker identifies patients at high risk for poor outcomes despite treatment of their re-jection episodes. However, the study was not designed to examine the effect of anti-rejection therapy on the biomarker. The observed rate of ABMR in this nonse-lected group of consecutive renal transplant recipients was 3%—similar to that reported in other studies of nonsensitized renal transplant recipients on tacrolimus (TAC)– based immunosuppression in the first posttransplant year (26–29). This low incidence of ABMR precluded our ability to determine whether the biomarker could differentiate between TCMR and ABMR. Last, although the biomarker is based on a cellular assay, the interpersonal and intrapersonal CVs were low (12 and 4%, respectively). The generalizability and low variability of the biomarker should allow for widespread application (30).
B cells produce antibodies that can contribute to allograft rejection (8, 31). However, B cells can also either augment or inhibit effector T cell responses in various disease settings, highlighting their role as both proinflammatory effector
Fig. 8. Effect of anti-TNF on regulatory B cell activity and in vitro plasmablast differentiation. (A) PBMCs ob-tained at 3 months from low-risk (n = 4) and high-risk patients (n = 4) were subjected to B cell depletion or were left undepleted, followed by anti-CD3 stimulation. Within each patient group (high and low risk), the change in expres-sion of each cytokine by CD4+ T cells after B cell depletion was compared to the baseline expression without B cell depletion. The percent change in CD4+ T cell cytokines with B cell depletion between low- and high-risk groups is depicted. (B) Analysis of the IL-10/TNF ratio in total B cells and individual B cell subsets from healthy volunteers (n = 9) stimulated for 24 hours either in the presence of isotype control antibody or anti-TNF antibody. (C) Analysis of the proportion of CD4 T cells producing IL-10 (left) and TNF (right) after anti-CD3 stimulation. CD4 T cells were cultured alone or cocultured with B cells in the presence of isotype control or anti-TNF antibody (n = 4 healthy vol-unteers). (D) B cell differentiation into plasmablasts (induced by culture with TLR7 agonist, R848, and recombinant human IL-2) in the presence of either isotype control or anti-TNF antibody (n = 17 patients 3 months after trans-plant). (E) Comparison of the proportion of plasmablasts expressing IL-10 generated as in (D). (F) Comparison of re-spective IgG subclass concentration in the cell culture supernatants by plasmablasts generated as in (D). Paired comparisons were analyzed by Wilcoxon signed-rank test. Comparison of multiple groups was done by Kruskal-Wallis test. Bars depict mean values with error bars representing SEM.
Cherukuri et al., Sci. Transl. Med. 13, eabe4929 (2021) 24 February 2021
S C I E N C E T R A N S L A T I O N A L M E D I C I N E | R E S E A R C H A R T I C L E
8 of 12
B cells (Beffs) and Bregs (32–36). In clinical transplantation, deple-tion of B cells in the peri-transplant period with rituximab (human-ized anti-CD20) markedly increased acute renal allograft rejection and worsened cardiac allograft vasculopathy, suggesting that Bregs play an important role in engraftment (37, 38). However, there ex-ists no specific marker to identify Bregs, and they are most commonly identified by their expression of IL-10. In mice, specific deletion of B cell–expressed IL-10 markedly increases the inflammatory response in vivo, and addition of anti–IL-10 blocks in vitro human Breg activity (22, 39). Various human B cell phenotypic subsets are reportedly enriched for IL-10 expression, including canonical B cell subsets, CD138+ plasmablasts, CD24hiCD27+ memory, CD25hiCD71hiCD73−, TNFR2+, TIM1+, and CD271+CD431+CD11b+ B cells; however, only a small proportion of B cells within each of these subpopulations actually expresses IL-10, and each comprises only a fraction of all IL-10+ B cells (17, 40–47). Although all canonical B cell subsets ex-press IL-10, TrB cells are the most enriched (22, 24). Canonical B cell subsets also express proinflammatory cytokines like TNF, demonstrating that individual B cell subsets contain both Bregs and Beffs. We have shown that “Breg activity” is best characterized by the ratio of IL-10/TNF because this provides a readout of the number of Bregs relative to proinflammatory Beffs in any given subset, and this correlates with their in vitro suppressor activity (22). Thus, TrB cells have the highest IL-10/TNF ratio and suppress autologous T cell proinflammatory cytokine expression in vitro. Whereas anti–IL-10 diminished the in vitro Breg activity of TrB cells, anti-TNF re-vealed the activity of Bregs within the naïve and memory B subsets. Thus, it is likely that all IL-10+ B cells are regulatory but that the ratio of IL-10/TNF expression within a given subset best identifies the balance between Bregs and Beffs (22). Why the regulatory B cell balance (IL-10/TNF ratio) within the T1B subset turns out to be the best predictive biomarker for renal allograft rejection and out-comes is not clear. TrB cells are short-lived immature B cells that either mature into naïve B cells or undergo apoptosis. However, it is possible that TrB cells maintain their original cytokine profile when they mature or are activated in immune or parenchymal tissues (46).
The T1B cytokine ratio is distinct from other biomarkers in transplantation in that it identifies an immunological imbalance that might be amenable to therapeutic manipulation. Supporting this, we demonstrated that TNF neutralization augments the T1B IL-10/TNF ratio and that these B cells exhibit increased in vitro Breg activity. Anti-TNF also inhibited plasma cell differentiation and suppressed complement-fixing antibody secretion. Moreover, it has been shown that treatment of rheumatoid arthritis patients with anti-TNF increases IL-10+ B cells in vivo, supporting the notion that TNF blockade may work through modulation of Breg-to-Beff ratios (48). Although data in transplantation are limited, anti-TNF successfully rescued a series of nine small bowel allograft recipients who had rejection resistant to both steroids and T cell depletion therapy with OKT3 antibody (49). Thus, we provide a rationale for the use of anti-TNF to improve clinical outcomes in immunologically high-risk renal transplant recipients by restoring Breg activity.
In conclusion, we identified an early immunological biomarker in renal transplant recipients that predicts subsequent TCMR and graft loss. By identifying high-risk patients before further damage and maturation of the immune response have occurred, this bio-marker could be used to guide surveillance biopsies and personalize immunosuppression in attempts to improve clinical course. The evidence that TNF blockade may reverse a Breg-to-Beff imbalance provides a
rationale for testing this therapeutic approach in high-risk kidney transplant patients.
MATERIALS AND METHODSStudy designThis is a prospective observational study of nonpreselected adult renal transplant recipients who underwent transplantation between January 2013 and December 2014 at the UPMC to examine the role of B cells and their cytokines as predictive biomarkers for allograft rejection and subsequent outcomes. The biomarker was validated in a further prospective cohort of patients transplanted in 2015 from the UPMC and in an independent cohort of patients transplanted between 2011 and 2014 at the Royal Free Hospital in London.Outcomes studyIn a prospective observational study, we initially examined allograft outcomes in all adult kidney transplant recipients at the UPMC be-tween 2013 and 2015 (n = 596; Fig. 1A). Unless medically contrain-dicated, patients underwent two surveillance biopsies at 3 and 12 months in addition to for-cause biopsies. Surveillance biopsies were not performed if patients had a for-cause biopsy within 1 month. On the basis of the timing, biopsies were classified as either early (0 to 4 months) or late (5 to 12 months). Of the 596 total patients, 468 (79%) had at least one biopsy in the first posttransplant year. A total of 138 of these had one biopsy (early or late), and 330 had paired early and late biopsies (71%). A total of 128 (21%) patients did not undergo any biopsies.Biomarker studyAll patients transplanted at the UPMC between 2013 and 2015 were approached to participate in a biorepository where PBMCs were cryopreserved at regular intervals and at the time of any biopsies. Of the 468 who had at least one biopsy, 244 (52%) consented to enroll in the biorepository and were used in the biomarker portion of this study (Fig. 2). Patients transplanted in 2013 and 2014 constituted the Training Set (n = 162). Four patients were excluded because they received prior rituximab or had no viable cells. Patients transplanted in 2015 comprised the Internal Validation Set (n = 82). A total of 327 biopsies were performed in the Training Set (for cause, 84; sur-veillance, 243) and 168 in the Internal Validation Set (for cause, 55; surveillance, 113). In the Training Set, 121 (77%) patients had paired early and late biopsies. In the Internal Validation Set, 53(64%) had paired early and late biopsies. Patients were followed until March 2020.
A total of 95 patients transplanted between May 2011 and October 2014 at the Royal Free Hospital, London, constituted the External Validation Set. All patients were followed for 5 years to assess graft outcomes and only underwent for-cause biopsies. The study proto-col was approved by the University of Pittsburgh Institutional Review Board (#PRO13060220, REN13040245/PRO12030552, and PRO14040614) and the U.K. National Research Ethics Committee (#10/H0711/36).
ImmunosuppressionInduction immunosuppression consisted of either Thymoglobulin (6 mg/kg total; UPMC) or Basiliximab (London) and methylpred-nisolone (500 mg). All patients underwent rapid 7-day prednisolone taper and were then maintained on mycophenolate mofetil and TAC (target trough concentrations: 8 to 12 ng/ml for 3 months and 6 to 10 ng/ml after 3 months). Patients with calculated panel reac-tive antibodies of >90% were also maintained on oral prednisolone

Cherukuri et al., Sci. Transl. Med. 13, eabe4929 (2021) 24 February 2021
S C I E N C E T R A N S L A T I O N A L M E D I C I N E | R E S E A R C H A R T I C L E
9 of 12
(5 mg/day). Banff 1A or 1B TCMR, whether clinical or subclinical, was treated with three doses of methylprednisolone (250 mg each). Banff ≥2A and steroid-resistant TCMR were treated with Thymo-globulin (maximum 6 mg/kg) over 4 to 5 days. Acute ABMR was treated with four to six treatments of plasmapheresis and intrave-nous IgG. Maintenance prednisolone (5 mg/day) was added for all patients with rejection.
MonitoringBlood was drawn at 0, 1, 3, 6, 9, and 12 months to monitor for DSA as well as BKV and CMV infections. DSA was assessed by One Lambda single antigen beads per the manufacturer’s instructions. An adjusted median fluorescence intensity of ≥1000 was used to detect DSA. CMV and BK were assessed by the hospital clinical laboratory based on nucleic acid detection.
B cell cytokines and functionPBMCs were separated from peripheral blood by Ficoll density cen-trifugation and cryopreserved at each center. For analysis, PBMC aliquots were thawed and assessed by flow cytometry. In the Training Set, various B cell subsets and their IL-10/TNF ratio were exam-ined longitudinally in 430 PBMC samples analyzed 1, 3, 6, and 12 months after transplant. On the basis of this, the T1B IL-10/TNF ratio was examined at 3 months in the validation sets.
Monoclonal antibodies and biologic reagentsAnti-human fluorochrome-conjugated monoclonal antibodies (mAbs) included BUV-737-CD19, PE-Cy7-CD3, BV421-CD38, BV605-CD24, BUV395-CD27, AF488-IgD, APC-IgM, PECy7-CD138, PE–IL-10, PE-Texas Red-IFN, and AF488-TNF from BD Biosciences. Functional-grade anti-CD3 (HIT3a) was from BD Biosciences, and chimeric anti-human TNF (infliximab) was from Janssen Pharma-ceuticals. Resiquimod (R848) and recombinant human IL-2 (rhIL-2) were from R&D Systems, and CpG-ODN-2006 was from InvivoGen.
Assessment of the IL-10/TNF ratioPBMCs were suspended in RPMI 1640 supplemented with 10% fetal bovine serum, 1% penicillin-streptomycin, and l-glutamine at 2.5 × 10⁶ cells/ml (complete RPMI) and stimulated for 24 hours on a monolayer of NIH 3T3 cells stably expressing CD40L and CpG-ODN2006 (10 g/ml; InvivoGen). CD40L-expressing 3T3 cell line was provided by G. Freeman from Dana-Farber Cancer Institute (50). Phorbol 12-myristate 13-acetate (PMA; 50 ng/ml), ionomycin (500 ng/ml), and brefeldin A were added for the last 5 hours of culture. Cells were stained with surface markers, fixed and permeabilized using the Cytofix/Cytoperm kit (BD Biosciences), and then stained for intracellular cytokines (IL-10 and TNF). Flow cytometry was performed using a BD LSRFortessa flow cytometer (Becton Dickinson), and data were analyzed using Kaluza software (Beckman Coulter). Cursors were set using isotype and fluorochrome-matched negative controls for intracellular staining. Total B cells were defined by sur-face expression as CD19+CD3−, and B cell subsets were further identified as CD24+++CD38+++ T1B cells, CD24++CD38++ transitional-2 B cells (T2B), CD24+CD38+ naïve cells, and CD24+++CD38− mem-ory cells. The gating strategies for individual T1B and T2B sub-sets, IL-10 and TNF expression, and the IL-10/TNF ratio by these subsets are shown in figs. S19 and S20 and have been described in previous studies (22, 23, 51). The T1 and T2 subsets were readily distinguishable because the more immature T1 subset repopulates
before the T2 subset after Thymoglobulin induction. Once estab-lished, the same gates were used in both validation cohorts.
B cell depletion and T cell cytokinesCD19+ B cells were depleted from PBMCs of high-risk (n = 4) and low-risk (n = 4) patients from the UPMC cohort 3 months after transplantation using immunomagnetic beads (STEMCELL Tech-nologies) per the manufacturer’s instructions. Nondepleted PBMCs or those depleted of CD19+ B cells were cultured in 96-well U-bottom tissue culture plates (Corning), coated with purified anti-human CD3 mAb (0.5 mg/ml) for 72 hours. PMA, ionomycin, and brefeldin A were added for the last 6 hours of the culture. After surface staining for CD4+ T cells and fixation, cells were permeabilized using the Cytofix/Cytoperm kit (BD Biosciences) and then stained for intra-cellular cytokines (IL-10, TNF, and IFN). CD4+ T cell cytokines with or without B cell depletion were analyzed using a BD LSRFortessa.
Effect of anti-TNF on B and T cell cytokine expressionPBMCs (2.5 × 10⁶ cells/ml) from healthy volunteers (n = 8) were stimulated for 24 hours on a monolayer of NIH 3T3 cells stably ex-pressing CD40L and CpG-ODN2006 (10 g/ml; InvivoGen) in the presence of anti-TNF mAb (infliximab, 125 mg/ml) or an isotype control (IgG1k). PMA (50 ng/ml), ionomycin (500 ng/ml), and brefeldin A were added for the last 5 hours of culture. IL-10 and TNF expression in B cells and subsets were analyzed as detailed in the “Assessment of the IL-10/TNF ratio” section.
To assess the effect of anti-TNF on B cell regulatory function, magnetically enriched B cells from four healthy volunteers were stimulated with anti-human CD40 mAb and CpG-ODN 2006 (10 mg/ml) for 24 hours in the presence or absence of anti-TNF (125 mg/ml). After 24 hours, both anti-TNF–treated and untreated B cells were washed three times in complete RPMI. Washed B cells were then cocultured 1:1 with magnetically purified CD4+ T cells in 96-well U-bottom tissue culture plates (Corning) coated with puri-fied anti-human CD3 mAb (0.5 mg/ml) for 72 hours. CD4+ T cell–expressed IL-10 and TNF were analyzed by intracellular staining as described in the “B cell depletion and T cell cytokines” section.
Plasmablast differentiationPBMCs (1 × 10⁶/ml) from 17 UPMC renal allograft recipients 3 months after transplantation were suspended in complete RPMI at 2.5 × 10⁶ cells/ml and stimulated for 6 days with rhIL-2 (1000 U/ml) and resiquimod (2.5 mg/ml) (52, 53). On day 6, an aliquot of cell culture supernatant was removed and cryopreserved for analysis of IgG subclasses by enzyme-linked immunosorbent assay per the manufacturer’s instructions (Invitrogen). After this, PMA (50 ng/ml), ionomycin (500 ng/ml), and brefeldin A were added to the cell cul-ture for 5 hours. The phenotype of the cultured cells was then assessed using anti-human mAbs for CD19, IgD, CD24, CD27, and CD38 followed by intracellular cytokine staining for IL-10.
OutcomesOutcomes were biopsy-proven rejection in the first posttransplant year, IFTA at 1 year, eGFR at 1 to 4 years, graft loss at 5 years, and a composite endpoint of graft loss or impending graft loss (eGFR of <30 ml/min and reduction in eGFR >30% from baseline) at 5 years. Biopsies were scored by transplant pathologists using Banff 2013 criteria to define TCMR or ABMR (54). Here, the term TCMR re-fers to Banff grade 1A rejection or greater. Diagnosis of cTCMR was
Cherukuri et al., Sci. Transl. Med. 13, eabe4929 (2021) 24 February 2021
S C I E N C E T R A N S L A T I O N A L M E D I C I N E | R E S E A R C H A R T I C L E
10 of 12
based on clinically indicated (for-cause) biopsies and scTCMR on surveillance biopsies (performed without evidence of renal dys-function). cTCMR rate was based on the total number of patients in the cohort, whereas scTCMR rate was based on the number of patients who underwent surveillance biopsies. eGFR was estimated by chronic kidney disease epidemiology collaboration (CKD EPI) equation (55).
Statistical analysisContinuous variables are presented as means ± SEM and categori-cal variables as percentages. Continuous variables were compared using Mann-Whitney U test. Multiple group comparison used anal-ysis of variance (ANOVA) with Dunnett’s post hoc correction or Kruskal-Wallis test. Chi-square test compared categorical variables. Nonparametric paired comparisons used Wilcoxon matched-pairs signed-rank test. Predicted probabilities and ORs for acute rejection were calculated using an unadjusted logistic regression. ROC curve analysis was used to obtain optimal sensitivity and specificity of the studied markers. Given the asymmetric nature of the outcome (TCMR), PRCs were used to assess the PPV of the T1B IL-10/TNF ratio at the given sensitivity.
Furthermore, patients from the Training Set and the two valida-tion sets were combined and stratified by key clinical variables including the following: age (classified as younger or older based on age greater or less than the median); gender (male or female); ethnicity (Caucasian or others); donor source [live versus deceased (including both brain-dead and circulatory-dead donors)]; HLA mismatches (classified as higher or lower based on values greater or less than the median); induction immunosuppression (Thymoglobulin or Basiliximab); DGF (DGF or primary graft function); DSA in the first posttransplant year (detected or not detected); serum creatinine at 3 months (classified as higher or lower based on values greater or less than the median); CMV (more than 5000 copies/ml) or BK viremia (more than 10,000 copies/ml) by polymerase chain reaction; and CNI adherence assessed by the measurement of CNI intra-patient variability (IPV), as previously described (56–58). A CNI-IPV cutoff value of >35% was used to define nonadherence, as described previously (27). OR and predicted probability for TCMR were cal-culated using T1B IL-10/TNF ratio at 3 months as a continuous variable by logistic regression and ROC curve analysis performed for each of the abovementioned strata.
Renal function assessed by eGFR was compared longitudinally between the high- and the low-risk patients using repeated-measures ANOVA with Geisser-Greenhouse correction. eGFR values at dif-ferent time points were compared between the groups by Sidak post hoc test. Random missing values of eGFR were addressed by multi-ple imputation (five imputations). Overall graft loss, death-censored graft loss, and a composite endpoint of graft loss and impending graft loss were analyzed by the Kaplan-Meier method, and survival curves were compared between high- and low-risk patients by log-rank test. Impending graft loss was defined as an eGFR of <30 ml/min and a >30% decline in eGFR from the baseline at 3 months (27). In a multivariable Cox proportional hazards model, the hazard for graft loss with each unit increase in the biomarker value was ana-lyzed independent of eGFR, DSA, and DGF (factors commonly associated with poor graft outcomes).
SUPPLEMENTARY MATERIALSstm.sciencemag.org/cgi/content/full/13/582/eabe4929/DC1
Fig. S1. TCMR and 5-year death-censored graft survival.Fig. S2. Longitudinal analysis of the proportion of total B cells, B cell subsets, and their IL-10/TNF ratios over time.Fig. S3. IL-10/TNF ratio in indicated B cell subsets at 3 months after transplant in patients with and without TCMR.Fig. S4. T1B IL-10/TNF ratio according to TCMR type or grade.Fig. S5. Rate of TCMR at various T1B IL-10/TNF ratio cutoffs in the Training Set.Fig. S6. PRCs for Training and Internal Validation Sets.Fig. S7. T1B IL-10/TNF ratio and TCMR in the External Validation Set.Fig. S8. TCMR concurrent with or subsequent to 3-month T1B IL-10/TNF ratio determination in the Training and Validation Sets.Fig. S9. T1B IL-10/TNF ratio in patients with and without DSAs.Fig. S10. T1B IL-10/TNF ratio in patients with and without opportunistic viral infections.Fig. S11. CV for the determination of B cell subsets and T1B IL-10/TNF ratio.Fig. S12. T1B IL-10/TNF ratio and IFTA at 1 year.Fig. S13. Association between T1B IL-10/TNF ratio and long-term clinical outcomes in patients without early TCMR.Fig. S14. The effect of B cell depletion on CD4+ T cell cytokines in high- and low-risk patients.Fig. S15. Effect of anti-TNF on B cell subset IL-10 and TNF expression.Fig. S16. Effect of anti-TNF on B cell subset IL-6, GM-CSF, and IL-12 expression.Fig. S17. Effect of anti-TNF on B cell regulatory activity.Fig. S18. Effect of anti-TNF treatment on B cell differentiation into plasmablasts ex vivo.Fig. S19. Gating strategy for T1B cells.Fig. S20. IL-10/TNF ratio in B cells and B cell subsets.Table S1. Baseline characteristics of the study cohort versus patients who did not participate.Table S2. Logistic regression, B cell parameters, and TCMR.Table S3. Baseline characteristics of the External Validation Set.Table S4. Multivariable analysis of T1B IL-10/TNF ratio and graft outcomes.Data file S1. Raw data for main figures and supplementary figures.
View/request a protocol for this paper from Bio-protocol.
REFERENCES AND NOTES 1. K. E. Lamb, S. Lodhi, H.-U. Meier-Kriesche, Long-term renal allograft survival in the United
States: A critical reappraisal. Am. J. Transplant. 11, 450–462 (2011). 2. S. Shishido, H. Asanuma, H. Nakai, Y. Mori, H. Satoh, I. Kamimaki, H. Hataya, M. Ikeda,
M. Honda, A. Hasegawa, The impact of repeated subclinical acute rejection on the progression of chronic allograft nephropathy. J. Am. Soc. Nephrol. 14, 1046–1052 (2003).
3. S. Gourishankar, R. Leduc, J. Connett, J. M. Cecka, F. Cosio, A. Fieberg, R. Gaston, P. Halloran, L. Hunsicker, B. Kasiske, D. Rush, J. Grande, R. Mannon, A. Matas, Pathological and clinical characterization of the 'troubled transplant': Data from the DeKAF study. Am. J. Transplant. 10, 324–330 (2010).
4. J. Kurtkoti, V. Sakhuja, K. Sud, M. Minz, R. Nada, H. S. Kohli, K. L. Gupta, K. Joshi, V. Jha, The utility of 1- and 3-month protocol biopsies on renal allograft function: A randomized controlled study. Am. J. Transplant. 8, 317–323 (2008).
5. A. Loupy, D. Vernerey, C. Tinel, O. Aubert, J.-P. D. van Huyen, M. Rabant, J. Verine, D. Nochy, J.-P. Empana, F. Martinez, D. Glotz, X. Jouven, C. Legendre, C. Lefaucheur, Subclinical rejection phenotypes at 1 year post-transplant and outcome of kidney allografts. J. Am. Soc. Nephrol. 26, 1721–1731 (2015).
6. D. N. Rush, P. Nickerson, J. R. Jeffery, R. M. McKenna, P. C. Grimm, J. Gough, Protocol biopsies in renal transplantation: Research tool or clinically useful? Curr. Opin. Nephrol. Hypertens. 7, 691–694 (1998).
7. B. Kaplan, J. Schold, H.-U. Meier-Kriesche, Poor predictive value of serum creatinine for renal allograft loss. Am. J. Transplant. 3, 1560–1565 (2003).
8. A. Loupy, C. Lefaucheur, D. Vernerey, C. Prugger, J.-P. D. van Huyen, N. Mooney, C. Suberbielle, V. Frémeaux-Bacchi, A. Méjean, F. Desgrandchamps, D. Anglicheau, D. Nochy, D. Charron, J.-P. Empana, M. Delahousse, C. Legendre, D. Glotz, G. S. Hill, A. Zeevi, X. Jouven, Complement-binding anti-HLA antibodies and kidney-allograft survival. N. Engl. J. Med. 369, 1215–1226 (2013).
9. M. Suthanthiran, J. E. Schwartz, R. Ding, M. Abecassis, D. Dadhania, B. Samstein, S. J. Knechtle, J. Friedewald, Y. T. Becker, V. K. Sharma, N. M. Williams, C. S. Chang, C. Hoang, T. Muthukumar, P. August, K. S. Keslar, R. L. Fairchild, D. E. Hricik, P. S. Heeger, L. Han, J. Liu, M. Riggs, D. N. Ikle, N. D. Bridges, A. Shaked; Clinical Trials in Organ Transplantation 04 (CTOT-04) Study Investigators, Trials in organ transplantation 04 study, urinary-cell mrna profile and acute cellular rejection in kidney allografts. N. Engl. J. Med. 369, 20–31 (2013).
10. S. Roedder, T. Sigdel, N. Salomonis, S. Hsieh, H. Dai, O. Bestard, D. Metes, A. Zeevi, A. Gritsch, J. Cheeseman, C. Macedo, R. Peddy, M. Medeiros, F. Vincenti, N. Asher, O. Salvatierra, R. Shapiro, A. Kirk, E. Reed, M. M. Sarwal, The kSORT assay to detect renal transplant patients at high risk for acute rejection: Results of the multicenter AART study. PLOS Med. 11, e1001759 (2014).
Cherukuri et al., Sci. Transl. Med. 13, eabe4929 (2021) 24 February 2021
S C I E N C E T R A N S L A T I O N A L M E D I C I N E | R E S E A R C H A R T I C L E
11 of 12
11. D. E. Hricik, P. Nickerson, R. N. Formica, E. D. Poggio, D. Rush, K. A. Newell, J. Goebel, I. W. Gibson, R. L. Fairchild, M. Riggs, K. Spain, D. Ikle, N. D. Bridges, P. S. Heeger; CTOT-01 consortium, Multicenter validation of urinary CXCL9 as a risk-stratifying biomarker for kidney transplant injury. Am. J. Transplant. 13, 2634–2644 (2013).
12. J. J. Friedewald, S. M. Kurian, R. L. Heilman, T. C. Whisenant, E. D. Poggio, C. Marsh, P. Baliga, J. Odim, M. M. Brown, D. N. Ikle, B. D. Armstrong, J. I. Charette, S. S. Brietigam, N. Sustento-Reodica, L. Zhao, M. Kandpal, D. R. Salomon, M. M. Abecassis; Clinical Trials in Organ Transplantation 08 (CTOT-08), Development and clinical validity of a novel blood-based molecular biomarker for subclinical acute rejection following kidney transplant. Am. J. Transplant. 19, 98–109 (2019).
13. W. Zhang, Z. Yi, K. L. Keung, H. Shang, C. Wei, P. Cravedi, Z. Sun, C. Xi, C. Woytovich, S. Farouk, W. Huang, K. Banu, L. Gallon, C. N. Magee, N. Najafian, M. Samaniego, A. Djamali, S. I. Alexander, I. A. Rosales, R. N. Smith, J. Xiang, E. Lerut, D. Kuypers, M. Naesens, P. J. O’Connell, R. Colvin, M. C. Menon, B. Murphy, A peripheral blood gene expression signature to diagnose subclinical acute rejection. J. Am. Soc. Nephrol. 30, 1481–1494 (2019).
14. W. Zhang, Z. Yi, C. Wei, K. L. Keung, Z. Sun, C. Xi, C. Woytovich, S. Farouk, L. Gallon, M. C. Menon, C. Magee, N. Najafian, M. D. Samaniego, A. Djamali, S. I. Alexander, I. A. Rosales, R. N. Smith, P. J. O’Connell, R. Colvin, P. Cravedi, B. Murphy, Pretransplant transcriptomic signature in peripheral blood predicts early acute rejection. JCI Insight 4, e127543 (2019).
15. J. Y. C. Yang, R. D. Sarwal, T. K. Sigdel, I. Damm, B. Rosenbaum, J. M. Liberto, C. Chan-On, J. M. Arreola-Guerra, J. Alberu, F. Vincenti, M. M. Sarwal, A urine score for noninvasive accurate diagnosis and prediction of kidney transplant rejection. Sci. Transl. Med. 12, eaba2501 (2020).
16. S. Fillatreau, C. H. Sweenie, M. J. McGeachy, D. Gray, S. M. Anderton, B cells regulate autoimmunity by provision of IL-10. Nat. Immunol. 3, 944–950 (2002).
17. K. Mohib, A. Cherukuri, D. M. Rothstein, Regulatory B cells and transplantation: Almost prime time? Curr. Opin. Organ Transplant. 23, 524–532 (2018).
18. C. Mauri, A. Bosma, Immune regulatory function of B cells. Annu. Rev. Immunol. 30, 221–241 (2012).
19. P. Neves, V. Lampropoulou, E. Calderon-Gomez, T. Roch, U. Stervbo, P. Shen, A. A. Kühl, C. Loddenkemper, M. Haury, S. A. Nedospasov, S. H. E. Kaufmann, U. Steinhoff, D. P. Calado, S. Fillatreau, Signaling via the MyD88 adaptor protein in B cells suppresses protective immunity during Salmonella typhimurium infection. Immunity 33, 777–790 (2010).
20. E. C. Rosser, C. Mauri, Regulatory B cells: Origin, phenotype, and function. Immunity 42, 607–612 (2015).
21. P. Shen, S. Fillatreau, Antibody-independent functions of B cells: A focus on cytokines. Nat. Rev. Immunol. 15, 441–451 (2015).
22. A. Cherukuri, D. M. Rothstein, B. Clark, C. R. Carter, A. Davison, M. Hernandez-Fuentes, E. Hewitt, A. D. Salama, R. J. Baker, Immunologic human renal allograft injury associates with an altered IL-10/TNF- expression ratio in regulatory B cells. J. Am. Soc. Nephrol. 25, 1575–1585 (2014).
23. A. Cherukuri, A. D. Salama, C. R. Carter, D. Landsittel, G. Arumugakani, B. Clark, D. M. Rothstein, R. J. Baker, Reduced human transitional B cell T1/T2 ratio is associated with subsequent deterioration in renal allograft function. Kidney Int. 91, 183–195 (2017).
24. P. A. Blair, L. Y. Noreña, F. Flores-Borja, D. J. Rawlings, D. A. Isenberg, M. R. Ehrenstein, C. Mauri, CD19(+)CD24(hi)CD38(hi) B cells exhibit regulatory capacity in healthy individuals but are functionally impaired in systemic Lupus Erythematosus patients. Immunity 32, 129–140 (2010).
25. P. A. Clayton, S. P. McDonald, G. R. Russ, S. J. Chadban, Long-term outcomes after acute rejection in kidney transplant recipients: An ANZDATA analysis. J. Am. Soc. Nephrol. 30, 1697–1707 (2019).
26. H. Ekberg, H. Tedesco-Silva, A. Demirbas, S. Vítko, B. Nashan, A. Gürkan, R. Margreiter, C. Hugo, J. M. Grinyó, U. Frei, Y. Vanrenterghem, P. Daloze, P. F. Halloran; ELITE-Symphony Study, Reduced exposure to calcineurin inhibitors in renal transplantation. N. Engl. J. Med. 357, 2562–2575 (2007).
27. A. Cherukuri, R. Mehta, A. Sharma, P. Sood, A. Zeevi, A. D. Tevar, D. M. Rothstein, S. Hariharan, Post-transplant donor specific antibody is associated with poor kidney transplant outcomes only when combined with both T-cell-mediated rejection and non-adherence. Kidney Int. 96, 202–213 (2019).
28. C. Puttarajappa, R. Shapiro, H. P. Tan, Antibody-mediated rejection in kidney transplantation: A review. J. Transplant 2012, 193724 (2012).
29. S. Davis, J. E. Cooper, Acute antibody-mediated rejection in kidney transplant recipients. Transplant. Rev. 31, 47–54 (2017).
30. Z. C. Cui, Allowable limit of error in clinical chemistry quality control. Clin. Chem. 35, 630–631 (1989).
31. C. Wiebe, I. W. Gibson, T. D. Blydt-Hansen, M. Karpinski, J. Ho, L. J. Storsley, A. Goldberg, P. E. Birk, D. N. Rush, P. W. Nickerson, Evolution and clinical pathologic correlations of de novo donor-specific HLA antibody post kidney transplant. Am. J. Transplant. 12, 1157–1167 (2012).
32. Q. Ding, M. Yeung, G. Camirand, Q. Zeng, H. Akiba, H. Yagita, G. Chalasani, M. H. Sayegh, N. Najafian, D. M. Rothstein, Regulatory B cells are identified by expression of TIM-1 and can be induced through TIM-1 ligation to promote tolerance in mice. J. Clin. Invest. 121, 3645–3656 (2011).
33. R. Li, A. Rezk, Y. Miyazaki, E. Hilgenberg, H. Touil, P. Shen, C. S. Moore, L. Michel, F. Althekair, S. Rajasekharan, J. L. Gommerman, A. Prat, S. Fillatreau, A. Bar-Or; Canadian B cells in MS Team, Proinflammatory GM-CSF-producing B cells in multiple sclerosis and B cell depletion therapy. Sci. Transl. Med. 7, 310ra166 (2015).
34. A. C. Lino, T. Dörner, A. Bar-Or, S. Fillatreau, Cytokine-producing B cells: A translational view on their roles in human and mouse autoimmune diseases. Immunol. Rev. 269, 130–144 (2016).
35. Q. Ding, K. Mohib, V. K. Kuchroo, D. M. Rothstein, TIM-4 identifies IFN--expressing proinflammatory B effector 1 cells that promote tumor and allograft rejection. J. Immunol. 199, 2585–2595 (2017).
36. A. Cherukuri, K. Mohib, D. M. Rothstein, Regulatory B cells: TIM-1, transplant tolerance, and rejection. Immunol. Rev., (2021).
37. M. R. Clatworthy, C. J. Watson, G. Plotnek, V. Bardsley, A. N. Chaudhry, J. A. Bradley, K. G. Smith, B-cell-depleting induction therapy and acute cellular rejection. N. Engl. J. Med. 360, 2683–2685 (2009).
38. R. C. Starling, B. Armstrong, N. D. Bridges, H. Eisen, M. M. Givertz, A. G. Kfoury, J. Kobashigawa, D. Ikle, Y. Morrison, S. Pinney, J. Stehlik, S. Tripathi, M. H. Sayegh, A. Chandraker; CTOT-11 Study Investigators, Accelerated allograft vasculopathy with rituximab after cardiac transplantation. J. Am. Coll. Cardiol. 74, 36–51 (2019).
39. K. Mohib, A. Cherukuri, Y. Zhou, Q. Ding, S. C. Watkins, D. M. Rothstein, Antigen-dependent interactions between regulatory B cells and T cells at the T:B border inhibit subsequent T cell interactions with DCs. Am. J. Transplant. 20, 52–63 (2020).
40. W. van de Veen, B. Stanic, G. Yaman, M. Wawrzyniak, S. Sollner, D. G. Akdis, B. Ruckert, C. A. Akdis, M. Akdis, IgG4 production is confined to human IL-10-producing regulatory B cells that suppress antigen-specific immune responses. J. Allergy Clin. Immunol. 131, 1204–1212 (2013).
41. O. Ticha, L. Moos, H. Wajant, I. Bekeredjian-Ding, Expression of tumor necrosis factor receptor 2 characterizes TLR9-driven formation of interleukin-10-producing B cells. Front. Immunol. 8, 1951 (2018).
42. O. Aravena, A. Ferrier, M. Menon, C. Mauri, J. C. Aguillon, L. Soto, D. Catalan, TIM-1 defines a human regulatory B cell population that is altered in frequency and function in systemic sclerosis patients. Arthritis Res. Ther. 19, 8 (2017).
43. D. O. Griffin, T. L. Rothstein, Human "orchestrator" CD11b(+) B1 cells spontaneously secrete interleukin-10 and regulate T-cell activity. Mol. Med. 18, 1003–1008 (2012).
44. Y. Iwata, T. Matsushita, M. Horikawa, D. J. Dilillo, K. Yanaba, G. M. Venturi, P. M. Szabolcs, S. H. Bernstein, C. M. Magro, A. D. Williams, R. P. Hall, E. W. St Clair, T. F. Tedder, Characterization of a rare IL-10-competent B-cell subset in humans that parallels mouse regulatory B10 cells. Blood 117, 530–541 (2011).
45. M. Chesneau, L. Michel, E. Dugast, A. Chenouard, D. Baron, A. Pallier, J. Durand, F. Braza, P. Guerif, D. A. Laplaud, J. P. Soulillou, M. Giral, N. Degauque, E. Chiffoleau, S. Brouard, Tolerant kidney transplant patients produce B cells with regulatory properties. J. Am. Soc. Nephrol. 26, 2588–2598 (2015).
46. M. Matsumoto, A. Baba, T. Yokota, H. Nishikawa, Y. Ohkawa, H. Kayama, A. Kallies, S. L. Nutt, S. Sakaguchi, K. Takeda, T. Kurosaki, Y. Baba, Interleukin-10-producing plasmablasts exert regulatory function in autoimmune inflammation. Immunity 41, 1040–1051 (2014).
47. A. Cherukuri, Q. Ding, A. Sharma, K. Mohib, D. M. Rothstein, Regulatory and effector B cells: A new path toward biomarkers and therapeutic targets to improve transplant outcomes? Clin. Lab. Med. 39, 15–29 (2019).
48. Z. Banko, J. Pozsgay, T. Gati, B. Rojkovich, I. Ujfalussy, G. Sarmay, Regulatory B cells in rheumatoid arthritis: Alterations in patients receiving anti-TNF therapy. Clin. Immunol. 184, 63–69 (2017).
49. U. A. Gerlach, M. Koch, H. P. Muller, W. Veltzke-Schlieker, P. Neuhaus, A. Pascher, Tumor necrosis factor alpha inhibitors as immunomodulatory antirejection agents after intestinal transplantation. Am. J. Transplant. 11, 1041–1050 (2011).
50. M. Naito, U. Hainz, U. E. Burkhardt, B. Fu, D. Ahove, K. E. Stevenson, M. Rajasagi, B. Zhu, A. Alonso, E. Witten, K. Matsuoka, D. Neuberg, J. S. Duke-Cohan, C. J. Wu, G. J. Freeman, CD40L-Tri, a novel formulation of recombinant human CD40L that effectively activates B cells. Cancer Immunol. Immunother. 62, 347–357 (2013).
51. A. Palanichamy, J. Barnard, B. Zheng, T. Owen, T. Quach, C. Wei, R. J. Looney, I. Sanz, J. H. Anolik, Novel human transitional B cell populations revealed by B cell depletion therapy. J. Immunol. 182, 5982–5993 (2009).
52. D. Pinna, D. Corti, D. Jarrossay, F. Sallusto, A. Lanzavecchia, Clonal dissection of the human memory B-cell repertoire following infection and vaccination. Eur. J. Immunol. 39, 1260–1270 (2009).
53. M. Lucia, S. Luque, E. Crespo, E. Melilli, J. M. Cruzado, J. Martorell, M. Jarque, S. Gil-Vernet, A. Manonelles, J. M. Grinyo, O. Bestard, Preformed circulating HLA-specific memory B cells predict high risk of humoral rejection in kidney transplantation. Kidney Int. 88, 874–887 (2015).
Cherukuri et al., Sci. Transl. Med. 13, eabe4929 (2021) 24 February 2021
S C I E N C E T R A N S L A T I O N A L M E D I C I N E | R E S E A R C H A R T I C L E
12 of 12
54. M. Haas, B. Sis, L. C. Racusen, K. Solez, D. Glotz, R. B. Colvin, M. C. R. Castro, D. S. R. David, E. David-Neto, S. M. Bagnasco, L. C. Cendales, L. D. Cornell, A. J. Demetris, C. B. Drachenberg, C. F. Farver, A. B. Farris III, I. W. Gibson, E. Kraus, H. Liapis, A. Loupy, V. Nickeleit, P. Randhawa, E. R. Rodriguez, D. Rush, R. N. Smith, C. D. Tan, W. D. Wallace, M. Mengel; Banff meeting report writing committee, Banff 2013 meeting report: Inclusion of c4d-negative antibody-mediated rejection and antibody-associated arterial lesions. Am. J. Transplant. 14, 272–283 (2014).
55. A. S. Levey, L. A. Stevens, C. H. Schmid, Y. L. Zhang, A. F. Castro III, H. I. Feldman, J. W. Kusek, P. Eggers, F. Van Lente, T. Greene, J. Coresh; CKD-EPI (Chronic Kidney Disease Epidemiology Collaboration), A new equation to estimate glomerular filtration rate. Ann. Intern. Med. 150, 604–612 (2009).
56. L. C. Borra, J. I. Roodnat, J. A. Kal, R. A. Mathot, W. Weimar, T. van Gelder, High within-patient variability in the clearance of tacrolimus is a risk factor for poor long-term outcome after kidney transplantation. Nephrol. Dial. Transplant. 25, 2757–2763 (2010).
57. A. Lindholm, S. Henricsson, M. Lind, R. Dahlqvist, Intraindividual variability in the relative systemic availability of cyclosporin after oral dosing. Eur. J. Clin. Pharmacol. 34, 461–464 (1988).
58. N. Shuker, T. van Gelder, D. A. Hesselink, Intra-patient variability in tacrolimus exposure: Causes, consequences for clinical management. Transplant. Rev. (Orlando) 29, 78–84 (2015).
Acknowledgments: We thank D. Metes, C. Macedo, B. Ramaswamy, and B. Elinoff (University of Pittsburgh) for contributions to the execution of the study. We thank R. Pike, L. Ambrose, and S. Workman (Royal Free Hospital, London, UK) for contributions that enabled the performance of the external validation of the biomarker. We thank G. J. Freeman (Dana-Farber
Cancer Institute) for providing the hCD40L-expressing 3T3 cell line obtained through a material transfer agreement. Funding: This work was supported by grants from the Roche Organ Transplant Research Fund (2015-2016), American Society of Transplantation (2017-2019), NIH R34 AI136782 (all awarded to D.M.R.), and National Institute for Health Research, UK (RCF2013/14-058, awarded to H.S.). Author contributions: D.M.R. conceived the study. D.M.R. and A.C. designed the study. D.M.R., A.C., A.D.S., R.J.B., F.G.L., and S.H. drafted the manuscript. D.L. is the study statistician. D.M.R., A.C., D.L., F.G.L., and S.H. analyzed and interpreted the data. A.C., K.M., C.M., and L.Z. conducted the experiments. A.T., R.M., S.H., M.H., A.D.S., and H.S. enrolled and followed up the patients. R.M. and H.S. managed clinical data. All authors were involved in reviewing the manuscript and approved the final version of the manuscript. Competing interests: D.M.R. serves on the scientific advisory board of Verici Dx. H.S. serves as a consultant for and holds shares in Quell Therapeutics. H.S. holds shares in Kuur Therapeutics. All other authors declare that they have no competing interests. Data and materials availability: All data associated with this study are present in the paper or the Supplementary Materials.
Submitted 26 August 2020Accepted 25 January 2021Published 24 February 202110.1126/scitranslmed.abe4929
Citation: A. Cherukuri, A. D. Salama, R. Mehta, K. Mohib, L. Zheng, C. Magee, M. Harber, H. Stauss, R. J. Baker, A. Tevar, D. Landsittel, F. G. Lakkis, S. Hariharan, D. M. Rothstein, Transitional B cell cytokines predict renal allograft outcomes. Sci. Transl. Med. 13, eabe4929 (2021).
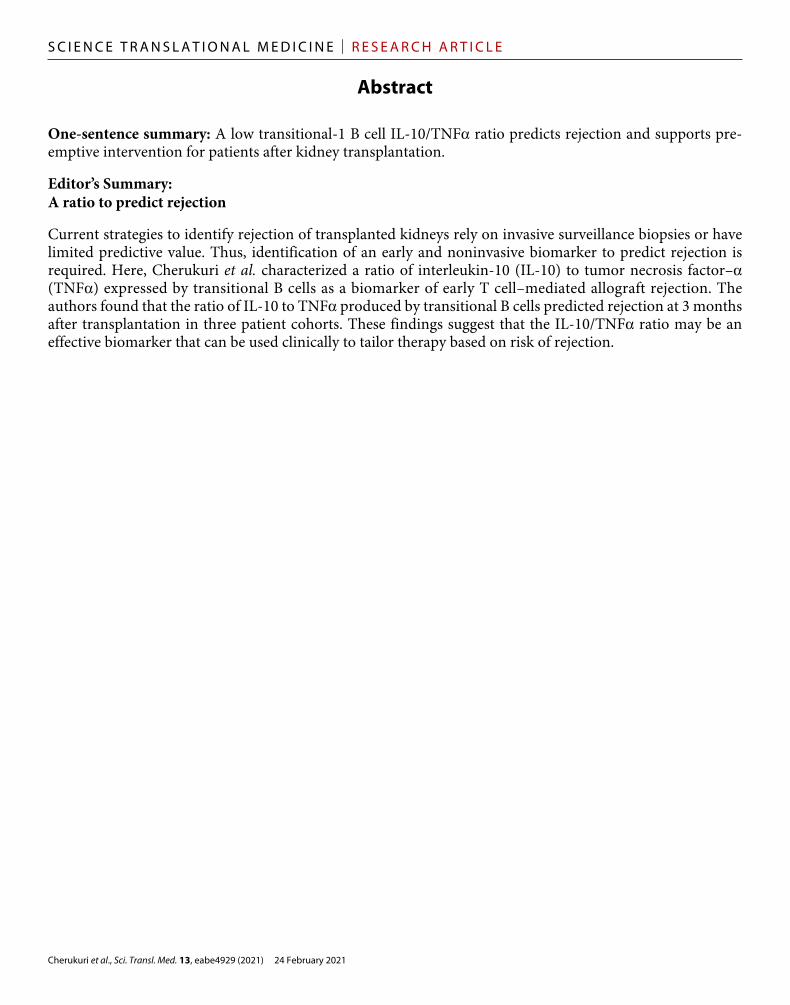
Cherukuri et al., Sci. Transl. Med. 13, eabe4929 (2021) 24 February 2021
Abstract
One-sentence summary: A low transitional-1 B cell IL-10/TNF ratio predicts rejection and supports pre-emptive intervention for patients after kidney transplantation.
Editor’s Summary:A ratio to predict rejection
Current strategies to identify rejection of transplanted kidneys rely on invasive surveillance biopsies or have limited predictive value. Thus, identification of an early and noninvasive biomarker to predict rejection is required. Here, Cherukuri et al. characterized a ratio of interleukin-10 (IL-10) to tumor necrosis factor– (TNF) expressed by transitional B cells as a biomarker of early T cell–mediated allograft rejection. The authors found that the ratio of IL-10 to TNF produced by transitional B cells predicted rejection at 3 months after transplantation in three patient cohorts. These findings suggest that the IL-10/TNF ratio may be an effective biomarker that can be used clinically to tailor therapy based on risk of rejection.
S C I E N C E T R A N S L A T I O N A L M E D I C I N E | R E S E A R C H A R T I C L E

![Kidney Transplantation (Renal Transplantation) Auto Saved]](https://static.fdocuments.net/doc/165x107/577d22b31a28ab4e1e9807d7/kidney-transplantation-renal-transplantation-auto-saved.jpg)