Transparency as a key to affordable finance...
44
Transparency as a key to providing affordable finance in low income communities A view from the UK Jennifer Tankard Director, Community Investment Coalition Director, Advocacy & Research, CDF @BankingBetter
Transcript of Transparency as a key to affordable finance...

Transparency as a key to providing affordable finance in low income
communities
A view from the UKJennifer Tankard
Director, Community Investment CoalitionDirector, Advocacy & Research, CDF@BankingBetter

About the Community Investment Coalition
A partnership of national organisations, campaigning to increaseaccess to affordable finance for all communities.
5 campaign aims:•More transparency;•More diversity of providers;•More innovation;•Sustainable local economic growth;
•Better financial literacy.

Funded by partner contributions and charitable donations.

Financial Exclusion in the UK
• 1.4 million people do not have a bank account.
• Consumer debt has trebled since 1993, reaching £158 billion in 2013.
• 2 million people are engaged with a debt repayment plan.
• A fifth of households have no insurance protections.
• 8 million households have no savings.

Financial Exclusion in the UK


Lack of competition in financial services
Market share of personal current account market in the UK, 2014
[Source: Reuters]

Lack of competition in financial services
Market share of business current account market in the UK, 2014
[Source: Reuters]

Alternatives?
• Credit Unions – membership organisationsApproximately 400 in the UK; Membership in Great Britain:
3%; Compared to: 76% in Ireland; 10% in Poland; 6% in Lithuania.
• Community Development Finance Institutions (CDFIs) – not for profits serving poor communities
Approximately 60 CDFIs in the UK. Lent £173 million to 56,200 businesses, social enterprises, individuals & homeowners in 2014.
• Peer-to-Peer LendersLent £1.23 billion to 140,000 businesses & individuals in
2014. Sector expected to double in size every six months for foreseeable future.

Mind the Finance Gap(Sponsored by RBS Group)
• There is a current potential annual demand for community finance in the UK of up to £6.75 billion, yet sector has only been able to lend £0.7 billion.
• Including: – £1.3 billion for business lending– £3.5 billion for personal lending
• Growing a sustainable community finance sector to meet unmet demand requires a partnership of public, private and social investors.

The case for data transparency
Data disclosure by financial service providers can help to:
•Identify overall availability of banking services in deprived communities.
•Allow for more effective targeting of scarce resources to deprived areas by government, economic regulators & social investors.
•Enable cross referencing with other measures of deprivation at the local level to better inform local economic & community development strategies.

The American Experience
Community Reinvestment Act (CRA)•Introduced in 1977 to “help meet the credit needs of the communities in which they operate, including low & moderate income neighbourhoods, consistent with safe & sound banking operations”.
•Requires that institutions must ensure access to financial services in any community where they take deposits.
•The performance of financial institutions is assessed on this basis & this assessment is supported by the release of information concerning their lending patterns & service provision.
•Regulatory changes in 1989, 1991 and 1995.

The CRA’s impact
• Numerous studies have indicated that the CRA has been effective in encouraging financial institutions to lend to redlined neighbourhoods.
• Lending to low & moderate income & minority borrowers increased at a faster pace than lending to higher-income borrowers.
• United States Department of the Treasury found that the CRA accounted for up to 20% of the growth in low & moderate-income lending among CRA lenders.

• The performance of financial institutions is assessed on this basis, and this assessment is supported by the release of information concerning their lending patterns & service provision.
• CRA also heavily leans on federal laws such as the Home MortgageDisclosure Act (HMDA). Research by the University of Massachusetts Boston showed that Black & Latino borrowers were less likely to be granted prime home-purchase loans, but were also respectively 3.1 times & 2.5 times more likely than their white counterparts to receive high-APR loans.
The CRA’s impact

• Argued for the need for transparency to increase competition & tackle financial exclusion by supporting targeted intervention.
• Backed by politicians from all political parties in Parliament, the Church of England & small business representatives.
• Banks & the British Bankers Association (BBA) strongly against data disclosure.
• Used arguments around data protection, legacy IT infrastructure & that no one would use the data.
Securing a voluntary disclosure framework in the UK
UK Progress
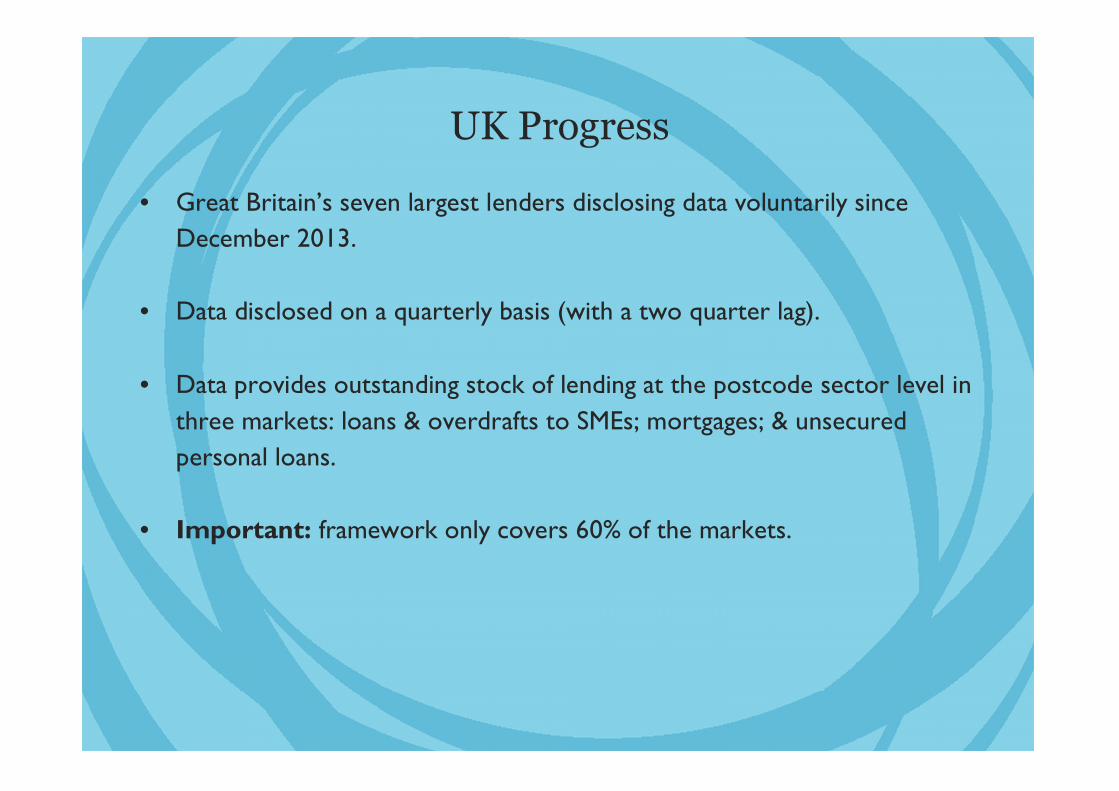
• Great Britain’s seven largest lenders disclosing data voluntarily since December 2013.
• Data disclosed on a quarterly basis (with a two quarter lag).
• Data provides outstanding stock of lending at the postcode sector level in three markets: loans & overdrafts to SMEs; mortgages; & unsecured personal loans.
• Important: framework only covers 60% of the markets.

What is a postcode sector?
• 9,000 sectors in UK.• Not uniform in size or population.• Not coterminous with other boundaries.

Announcement of voluntary framework
“The government is committed to creating a strong & safer bankingsystem that serves the UK economy…..businesses will be able to see
exactly where the major banks are lending – up to within a few streets of their premises.”
“It is a major step forward in terms of transparency & should encourage competition by helping smaller lenders to identify gaps in the market & allowing businesses to hold their local bank to account
where they aren’t lending.”
Danny Alexander, Chief Secretary to the Treasury, July 2013

Analysis of the data
• Community Investment Coalition - together with Big Society Capital, Citi & Unity Trust Bank - commissioned Coventry & Newcastle Universities to analyse the first three tranches of data.
• Report ‘Tackling Financial Exclusion: Data Disclosure and Area-Based Lending Data’published November 2014.

Using the data jointly published by the British Bankers’ Association (BBA) & the 7 lenders.
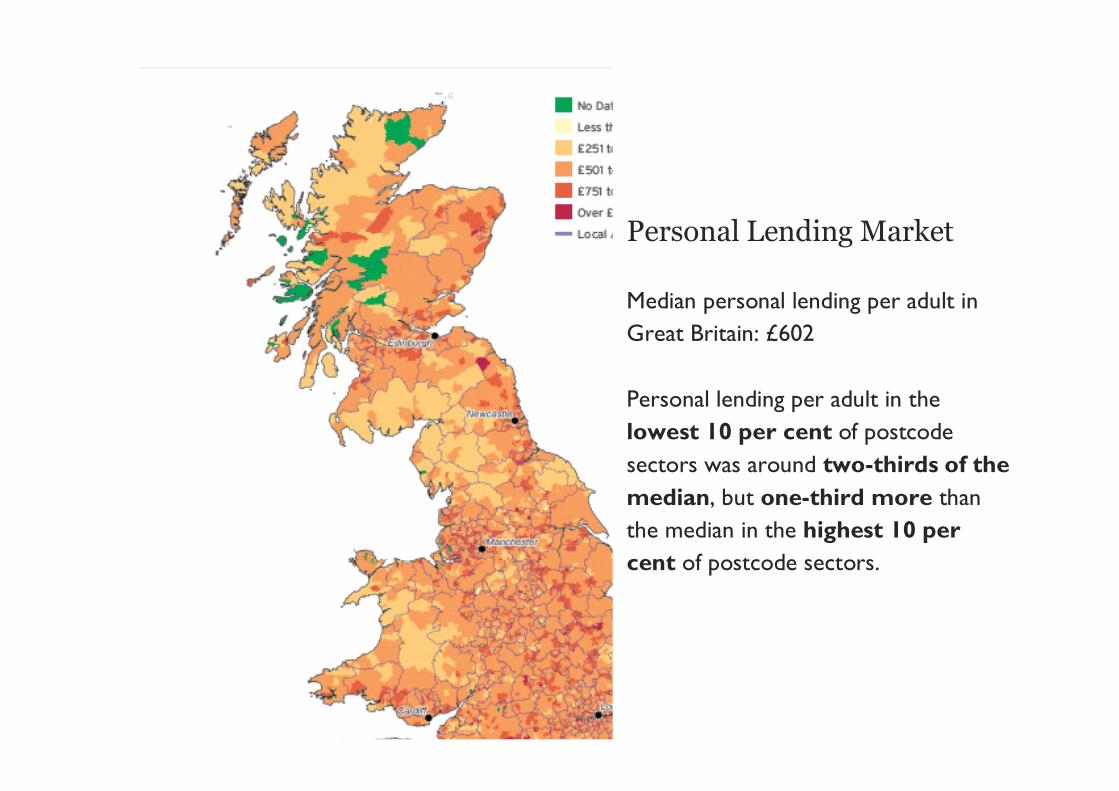
Personal Lending Market
Median personal lending per adult in Great Britain: £602
Personal lending per adult in the lowest 10 per cent of postcode sectors was around two-thirds of the median, but one-third more than the median in the highest 10 per cent of postcode sectors.
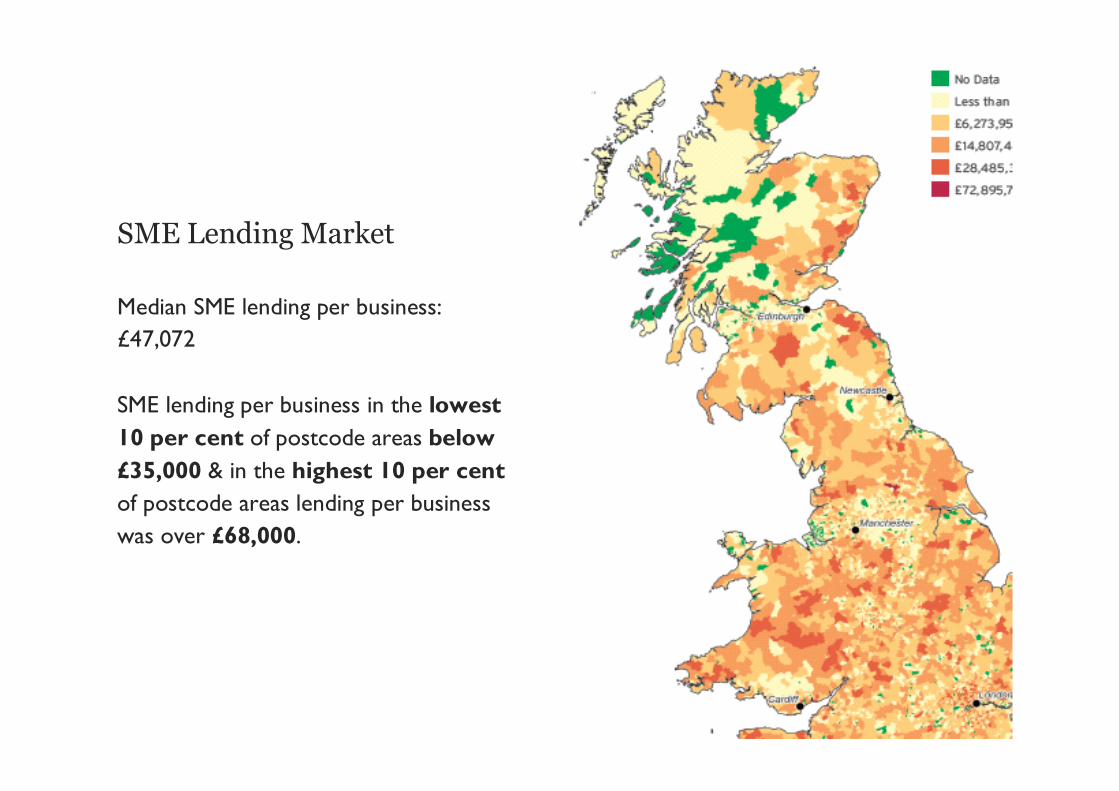
SME Lending Market
Median SME lending per business: £47,072
SME lending per business in the lowest 10 per cent of postcode areas below £35,000 & in the highest 10 per cent of postcode areas lending per business was over £68,000.

However:
•The existing data sets need to be strengthened & broadened to allow detailed & insightful analysis of which of the UK’s communities are underserved by the UK’s main high street banks.
•More variables must be disclosed including: the total number of transactions; individual loan amounts; characteristics of borrowers (e.g. gender and ethnicity) & businesses (employment and turnover).
•All financial providers should disclose data, so long as this does not act as a barrier to entry.
Analysis of the data

“We do believe that the lending data will promote greater competition & enable smaller lenders – both banks & non banks – to see where
there is a lack of lending & pursue new businesses in these areas. In particular, it will highlight those more deprived areas where larger
banks are not willing to lend. This will enable challenger banks, smaller building societies, credit unions & CDFIs to move into these
areas.
“..we expect more lenders including banks, building societies, credit unions & other types of finance providers to sign up to publishing
their data in the future.”
Andrea Leadsom, Economic Secretary to the Treasury, 2014
Government commitments

How is the data used to provide finance tolow income communities?
Analysis at the local level•Birmingham City Council in 2014
•Birmingham is…
– the UK’s second largest city (1.1 million people).– the largest local authority (municipality) in Europe.

BCC Mapping of data
• This maps aggregated data across Birmingham.
• Darker shades = more lending.
• Lighter shades = less lending

Comparing Birmingham to England’s averages

Informing policy
• There are lists of postcode sector with a total loan outstanding in each area.
• But, there is no data for the average loan value.
• So, you create an average per adult.
• Use population figures from the UK census to calculate this.

The result

• Birmingham City Council chose to correlate the data against deprivation or other outcomes.
• Important: that any data is at postcode sector level – too high to give us the granularity needed to really understand where the ‘credit deserts’ are.
Using the data to inform policy

Lending vs. Deprivation

Lending vs. Deprivation

How is the data used to provide finance to low income communities?
Research by Nottingham University
Tackling high cost credit providersFrom Bank Branches to Payday Loan Shops: The changing geography of access to credit
•Location of branches of major banks & building societies at four survey points (1989, 1995, 2003 and 2012).
•Location of high-cost, alternative financial service providers’ (AFSPs) branches in 2013 (defined as companies providing one of the following financial services: payday loans, cheque cashing, pawn broking & logbook loans).

Scale of bank and building society branch closures

Geographically uneven

Postcode districts with as many or more high-cost lenders as bank branches

What did CIC want to achieve?
• To tackle financial exclusion by providing affordable finance to low income communities through targeted intervention & increasing competition & diversity.
• Only possible by having transparency of financial services markets.
• Transparency allows us to cut through the banks ‘spin’ & build an evidence base to identify under-served markets, market opportunities & areas where the markets are unlikely to meet local financial needs (unless they are high cost credit providers exacerbating debt and financial exclusion).

What has CIC achieved?
• Most transparent financial services sector in the world, after the USA.
• Changed the debate – ‘No one wants this’ – ‘How can we improve the data’ and ‘How can we ensure more people use it / becomes more embedded in policy making’.
• Accepted by all political parties as part of status quo.
• A number of high profile / highly regarded reports referenced the data, its value but need for data improvements.
• Even the banks are less hostile, seeing it as helping to restore trust.
• Other providers – credit unions & CDFIs looking to join the framework.

Community Investment Coalition online
www.communityinvestment.org.uk

Useful links
• CIC’s main data disclosure page: http://www.communityinvestment.org.uk/?page_id=341
• CIC resources (including factsheets, reports and consultation submissions): http://www.communityinvestment.org.uk/?page_id=161
• CIC’s monthly newsletter: http://www.communityinvestment.org.uk/?page_id=410
• Conversations about financial exclusion: https://www.youtube.com/watch?v=KGuf4Lkqvr8
• Federal Reserve Bank of San Francisco (resource for performance of Californian banks): http://www.frbsf.org/communitydevelopment/initiatives/communityreinvestmentact/

Community Investment Coalition onlineTwitter: @BankingBetter

Thank you for listening
Questions?