Transparency and Corruption in Mineral Abundant...
23
Transparency and Corruption in Mineral Abundant Economies – Evidence from T&T Dr Roger Hosein Senior Lecturer and Coordinator of the Trade and Economics Development Unit UWI St Augustine
Transcript of Transparency and Corruption in Mineral Abundant...
Transparency and Corruption in Mineral Abundant Economies –
Evidence from T&T
Dr Roger Hosein
Senior Lecturer and Coordinator of the Trade
and Economics Development Unit
UWI St Augustine
Format of Presentation
• Economic issues linked to oil rents and how in particular it can sprout a greater level of corruption in the economy
• The effects of corruption on citizens
• The effect of transparency on corruption
• EITI and corruption
Introduction
• Hydrocarbons are in particular a peculiar commodity, it isowned by the nationals of the nation state where it exists,but it is also the anchor behind industrialization at theinternational level. It is a commodity that is non‐renewable and it is associated with volatile prices. Theindustry as a whole is also characterised by a high degreecapital intensity. The hydrocarbon sector also tends to beenclave, attracts vast amounts of FDI, and is associatedwith at times, very high levels of rents.
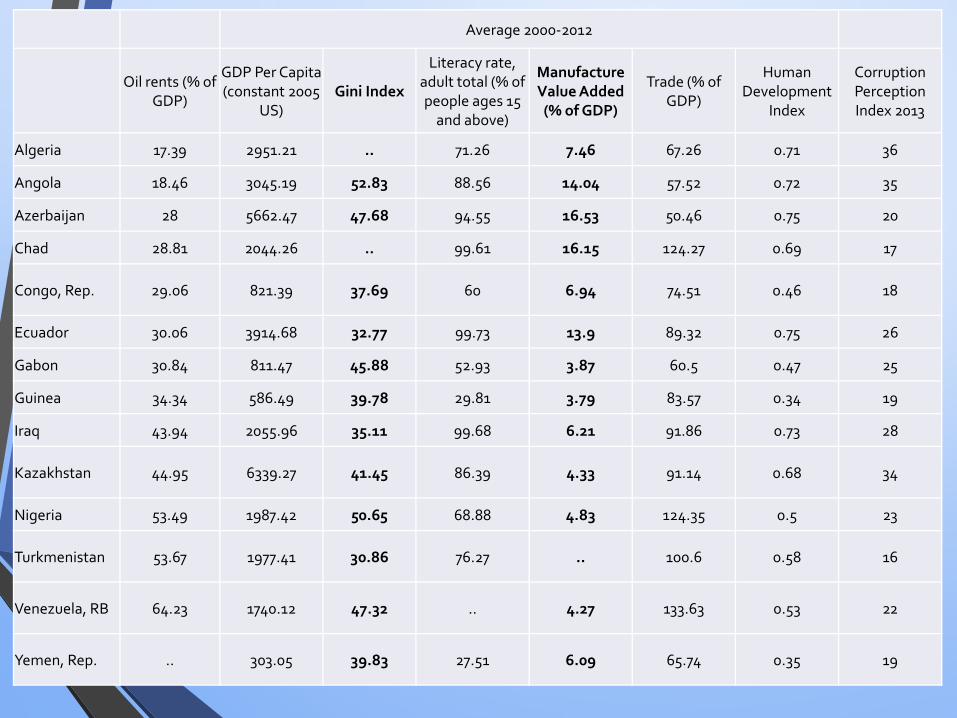
Average 2000‐2012
Oil rents (% of GDP)
GDP Per Capita(constant 2005
US)
Gini Index
Literacy rate, adult total (% ofpeople ages 15 and above)
Manufacture Value Added (% of GDP)
Trade (% of GDP)
Human Development
Index
Corruption Perception Index 2013
Algeria 17.39 2951.21 .. 71.26 7.46 67.26 0.71 36
Angola 18.46 3045.19 52.83 88.56 14.04 57.52 0.72 35
Azerbaijan 28 5662.47 47.68 94.55 16.53 50.46 0.75 20
Chad 28.81 2044.26 .. 99.61 16.15 124.27 0.69 17
Congo, Rep. 29.06 821.39 37.69 60 6.94 74.51 0.46 18
Ecuador 30.06 3914.68 32.77 99.73 13.9 89.32 0.75 26
Gabon 30.84 811.47 45.88 52.93 3.87 60.5 0.47 25
Guinea 34.34 586.49 39.78 29.81 3.79 83.57 0.34 19
Iraq 43.94 2055.96 35.11 99.68 6.21 91.86 0.73 28
Kazakhstan 44.95 6339.27 41.45 86.39 4.33 91.14 0.68 34
Nigeria 53.49 1987.42 50.65 68.88 4.83 124.35 0.5 23
Turkmenistan 53.67 1977.41 30.86 76.27 .. 100.6 0.58 16
Venezuela, RB 64.23 1740.12 47.32 .. 4.27 133.63 0.53 22
Yemen, Rep. .. 303.05 39.83 27.51 6.09 65.74 0.35 19
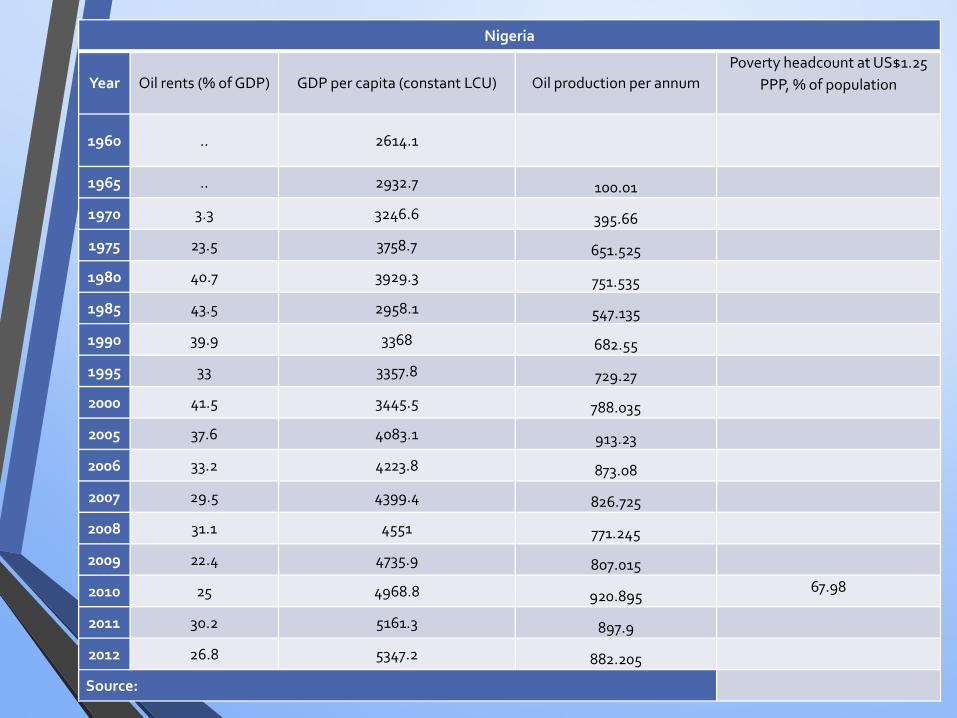
Nigeria
Year Oil rents (% of GDP) GDP per capita (constant LCU) Oil production per annumPoverty headcount at US$1.25
PPP, % of population
1960 .. 2614.1
1965 .. 2932.7 100.01
1970 3.3 3246.6 395.66
1975 23.5 3758.7 651.525
1980 40.7 3929.3 751.535
1985 43.5 2958.1 547.135
1990 39.9 3368 682.55
1995 33 3357.8 729.27
2000 41.5 3445.5 788.035
2005 37.6 4083.1 913.23
2006 33.2 4223.8 873.08
2007 29.5 4399.4 826.725
2008 31.1 4551 771.245
2009 22.4 4735.9 807.015
2010 25 4968.8 920.895 67.98
2011 30.2 5161.3 897.9
2012 26.8 5347.2 882.205
Source:
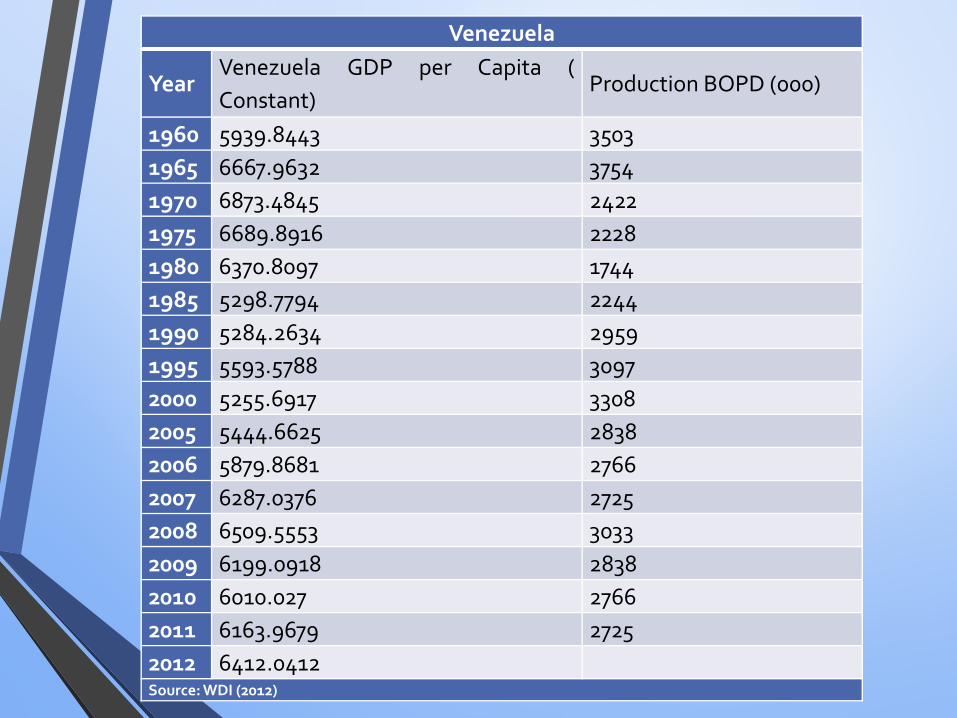
Venezuela
YearVenezuela GDP per Capita (Constant)
Production BOPD (000)
1960 5939.8443 35031965 6667.9632 37541970 6873.4845 24221975 6689.8916 22281980 6370.8097 17441985 5298.7794 22441990 5284.2634 29591995 5593.5788 30972000 5255.6917 33082005 5444.6625 28382006 5879.8681 27662007 6287.0376 27252008 6509.5553 30332009 6199.0918 28382010 6010.027 27662011 6163.9679 27252012 6412.0412Source:WDI (2012)
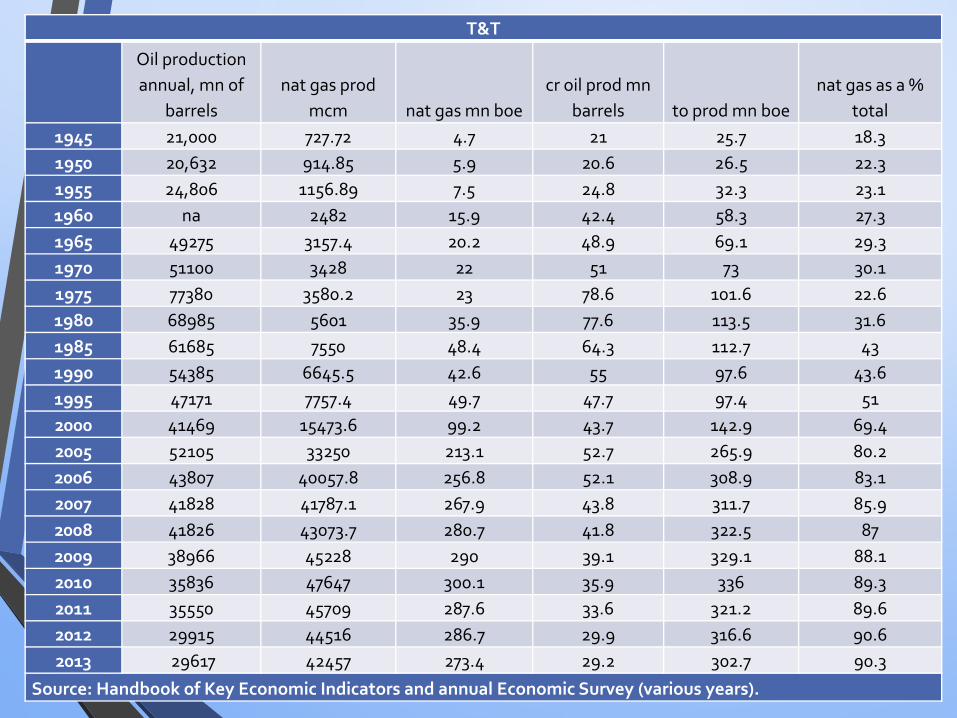
T&T
Oil production annual, mn of
barrelsnat gas prod
mcm nat gas mn boecr oil prod mn
barrels to prod mn boenat gas as a %
total1945 21,000 727.72 4.7 21 25.7 18.31950 20,632 914.85 5.9 20.6 26.5 22.31955 24,806 1156.89 7.5 24.8 32.3 23.11960 na 2482 15.9 42.4 58.3 27.31965 49275 3157.4 20.2 48.9 69.1 29.31970 51100 3428 22 51 73 30.11975 77380 3580.2 23 78.6 101.6 22.61980 68985 5601 35.9 77.6 113.5 31.61985 61685 7550 48.4 64.3 112.7 431990 54385 6645.5 42.6 55 97.6 43.61995 47171 7757.4 49.7 47.7 97.4 512000 41469 15473.6 99.2 43.7 142.9 69.42005 52105 33250 213.1 52.7 265.9 80.22006 43807 40057.8 256.8 52.1 308.9 83.12007 41828 41787.1 267.9 43.8 311.7 85.92008 41826 43073.7 280.7 41.8 322.5 872009 38966 45228 290 39.1 329.1 88.12010 35836 47647 300.1 35.9 336 89.32011 35550 45709 287.6 33.6 321.2 89.62012 29915 44516 286.7 29.9 316.6 90.62013 29617 42457 273.4 29.2 302.7 90.3
Source: Handbook of Key Economic Indicators and annual Economic Survey (various years).
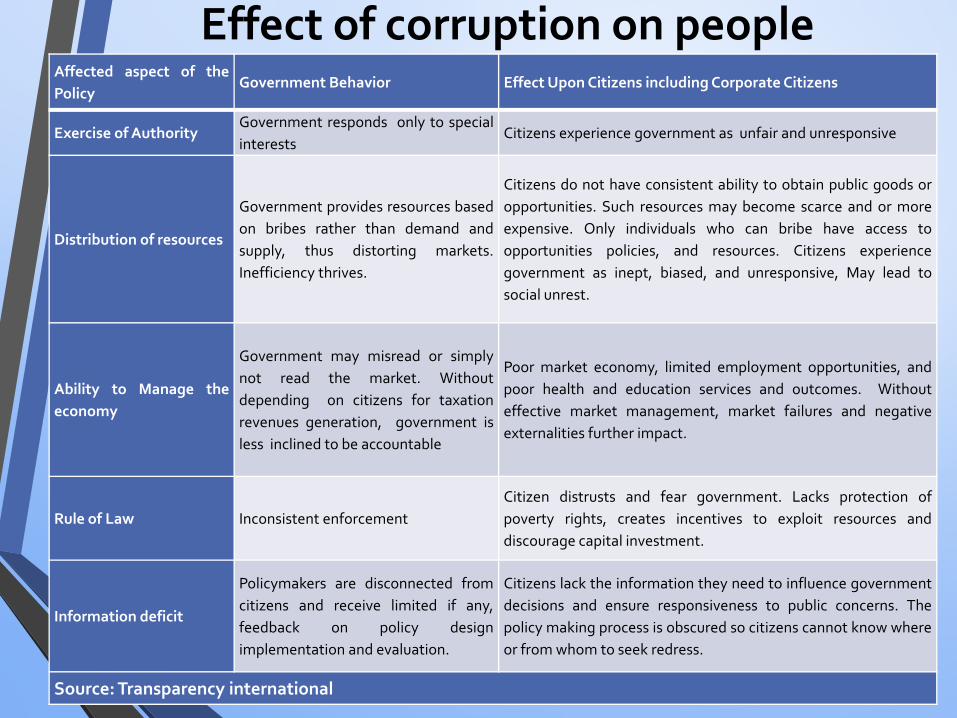
Effect of corruption on peopleAffected aspect of thePolicy
Government Behavior Effect UponCitizens includingCorporate Citizens
Exercise of AuthorityGovernment responds only to specialinterests
Citizens experience government as unfair and unresponsive
Distribution of resources
Government provides resources basedon bribes rather than demand andsupply, thus distorting markets.Inefficiency thrives.
Citizens do not have consistent ability to obtain public goods oropportunities. Such resources may become scarce and or moreexpensive. Only individuals who can bribe have access toopportunities policies, and resources. Citizens experiencegovernment as inept, biased, and unresponsive, May lead tosocial unrest.
Ability to Manage theeconomy
Government may misread or simplynot read the market. Withoutdepending on citizens for taxationrevenues generation, government isless inclined to be accountable
Poor market economy, limited employment opportunities, andpoor health and education services and outcomes. Withouteffective market management, market failures and negativeexternalities further impact.
Rule of Law Inconsistent enforcementCitizen distrusts and fear government. Lacks protection ofpoverty rights, creates incentives to exploit resources anddiscourage capital investment.
Information deficit
Policymakers are disconnected fromcitizens and receive limited if any,feedback on policy designimplementation and evaluation.
Citizens lack the information they need to influence governmentdecisions and ensure responsiveness to public concerns. Thepolicy making process is obscured so citizens cannot know whereor fromwhom to seek redress.
Source: Transparency international
Transparency and corruption in resource rich economies
• Transparency is a conduit through which many of the ills in a society can be addressed; indeed Haufles (2010) has referred to transparency as the “Swiss army knife of policy”.
• Transparency can:
• enhance levels of trust in society,
• Strengthen institutions in the community,
• enhance the legitimacy of the entire economic regime,
• enhance the efficiency of the political regime,
• ensure that public and private officials demonstrate a greater element of accountability, Haufles (2010).
The Role of the Press• In theory, corruptionmay be explained by three types of determinants,• Internal controls ‐ which refer to the various built in mechanisms within
the system. Corruption pervades more in environments where there arenot explicit standards, so the bureaucrat has decision making flexibilityand is compounded when the bureaucrat is improperly supervised.When internal controls are weak and employment and promotion areinfluenced more by nepotism than merit, then corruption can becomemore pervasive. Corruption also tends to be higher when public sectorwages are much lower in the private sector.
• External control mechanisms can take many forms, but in moredeveloped economies usually take the form of the judiciary systemalthough in places like Singapore it has taken the form of citizenCommitteeswhich allow citizens to express their grievances.
• The literature has also indicated some indirect determinants ofcorruption to include Culture. One researcher, Lee (1986) noted thatwhen an economy embraced a culture of “bureaucratic elitism” it hadthe capacity to precipitate a disassociation of civil servants from therest of the economy.
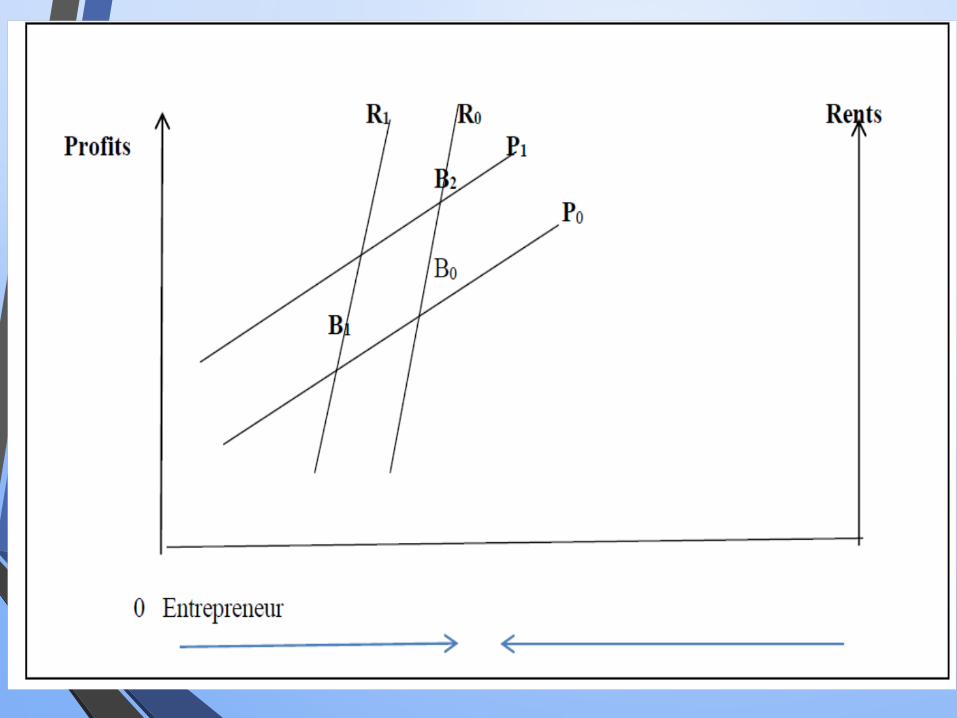
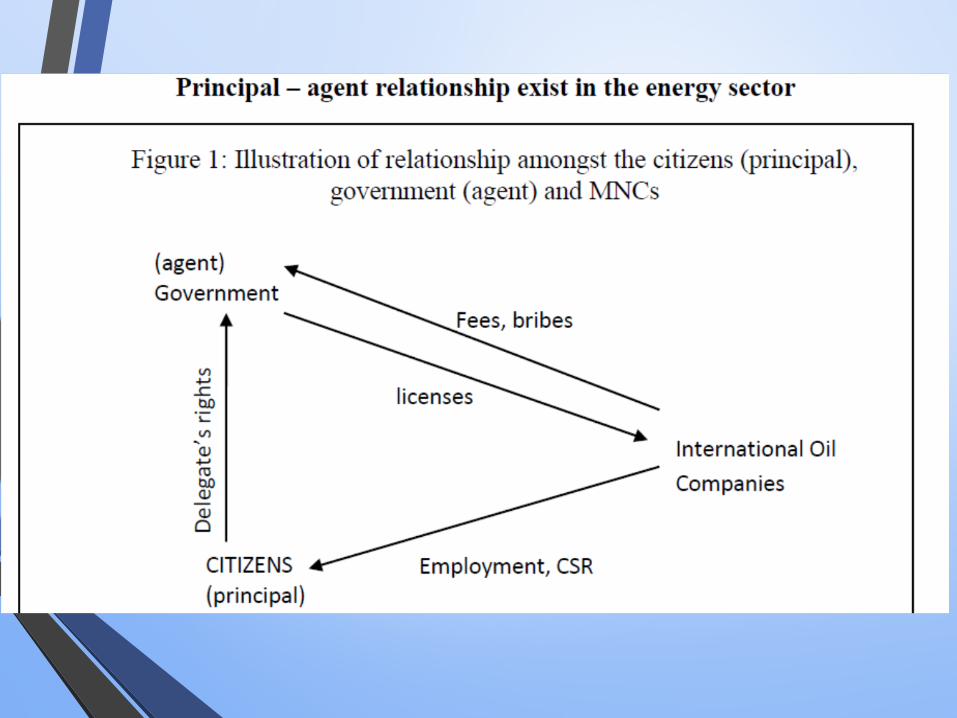
The Principal Agent Problem• The principal agent problem is a familiar one in economicsand occurs when one entity (the agent) has to makedecisions on behalf of another entity (the principal). Thereason for the emergence of the principal agent dilemmais that sometimes the agent is motivated to operate onhis/her own interest, rather than serve those of theprincipal. The typical principal agent problem occurs wheninformation asymmetry exists and the principal and theagent have different interests. With informationasymmetry benefiting the agent, it is not easy for theprincipal to determine if the agent is optimally acting inits interest and to bridge the information gap is costly.When the agent deviates from the principal’s interest,there is mounting agent costs and a conflict of interest.
The Principal Agent Problem
•
The extractive industry sector has a variety ofprincipal agent problems. The principals are thepeople of the economy, who own the sovereignwealth and the agent is the government. Thereis room here for principal agent problems, whendeals are non‐transparent and shaky, asministers can take bribes etc. from firms at amuch higher level than any random citizen canprovide.
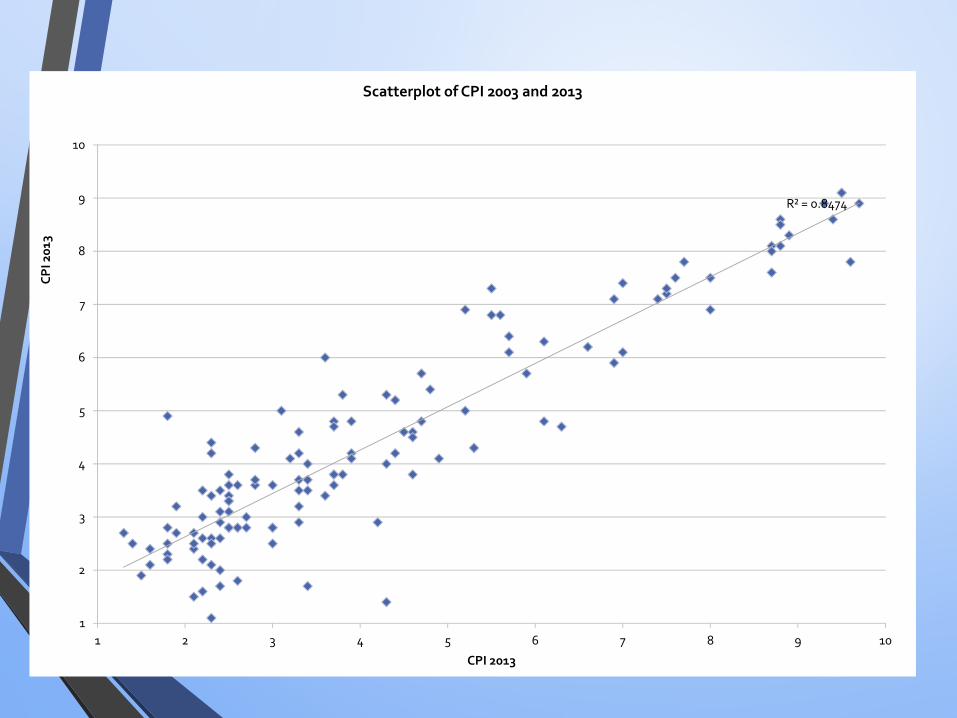
R² = 0.8474
1
2
3
4
5
6
7
8
9
10
1 2 3 4 5 6 7 8 9 10
CPI 2
013
CPI 2013
Scatterplot of CPI 2003 and 2013

R² = 0.172
0
10
20
30
40
50
60
70
80
90
100
0 10 20 30 40 50 60 70 80 90
CPT 20
13
Oil rents as a % of GDP
Scatterplot between CPI 2013 and oil rents as a % of GDP
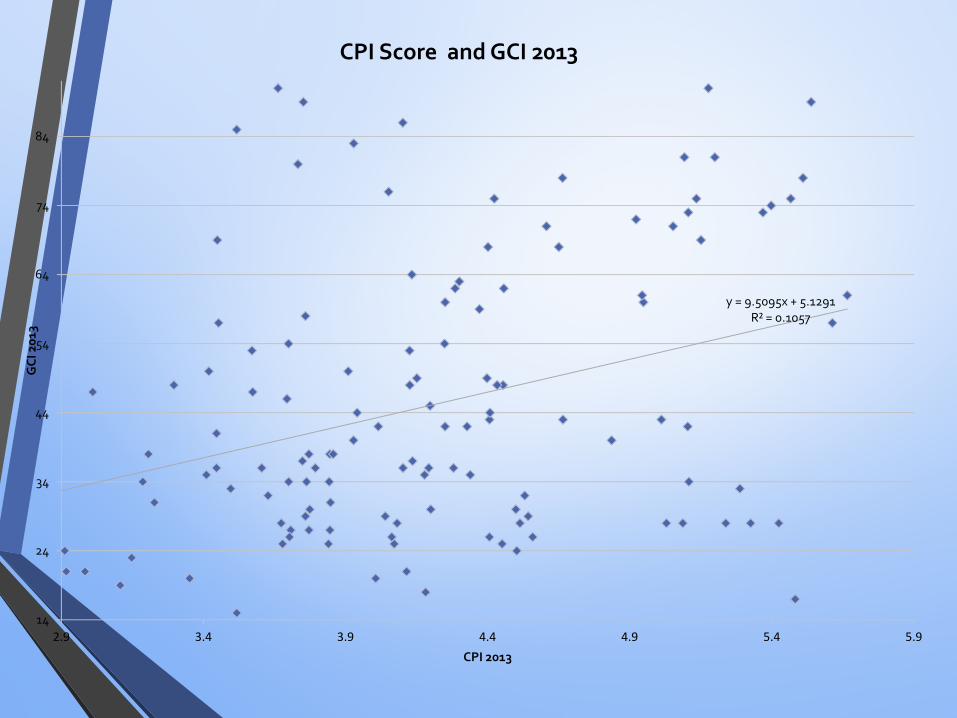
y = 9.5095x + 5.1291R² = 0.1057
14
24
34
44
54
64
74
84
2.9 3.4 3.9 4.4 4.9 5.4 5.9
GCI 201
3
CPI 2013
CPI Score and GCI 2013
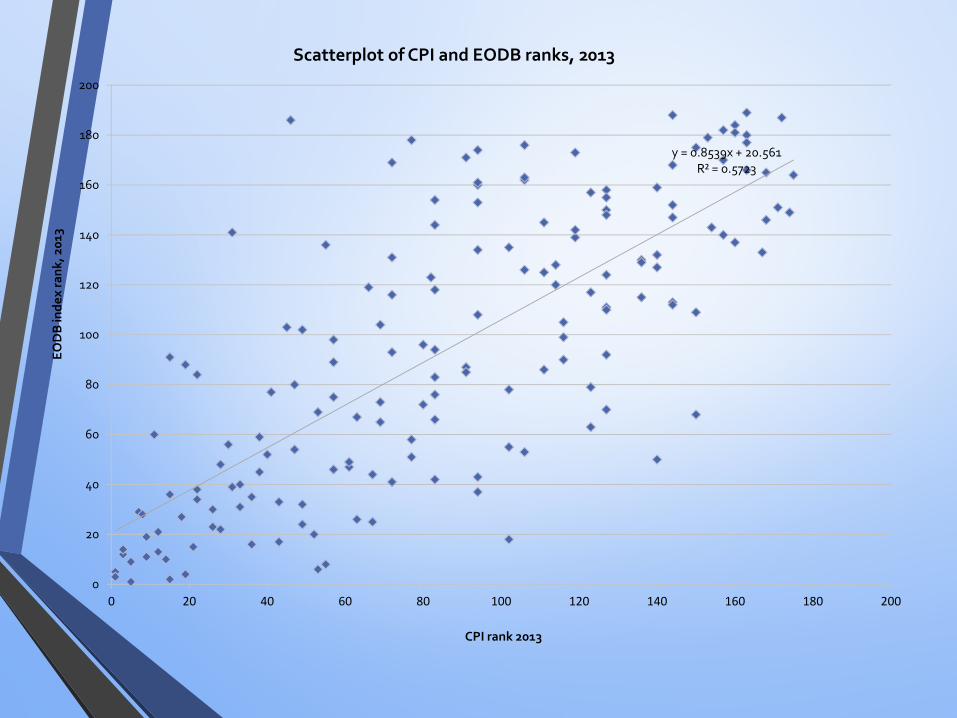
y = 0.8539x + 20.561R² = 0.5723
0
20
40
60
80
100
120
140
160
180
200
0 20 40 60 80 100 120 140 160 180 200
EODB in
dex rank
, 201
3
CPI rank 2013
Scatterplot of CPI and EODB ranks, 2013
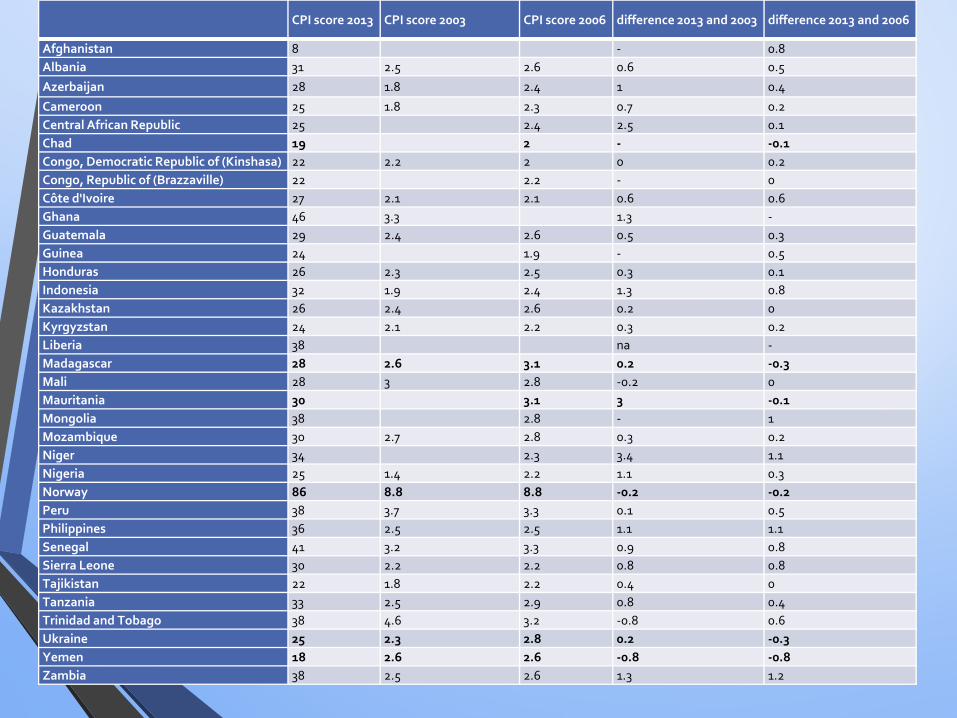
CPI score 2013 CPI score 2003 CPI score 2006 difference 2013 and 2003 difference 2013 and 2006
Afghanistan 8 ‐ 0.8Albania 31 2.5 2.6 0.6 0.5Azerbaijan 28 1.8 2.4 1 0.4Cameroon 25 1.8 2.3 0.7 0.2Central African Republic 25 2.4 2.5 0.1Chad 19 2 ‐ ‐0.1Congo, Democratic Republic of (Kinshasa) 22 2.2 2 0 0.2Congo, Republic of (Brazzaville) 22 2.2 ‐ 0Côte d'Ivoire 27 2.1 2.1 0.6 0.6Ghana 46 3.3 1.3 ‐Guatemala 29 2.4 2.6 0.5 0.3Guinea 24 1.9 ‐ 0.5Honduras 26 2.3 2.5 0.3 0.1Indonesia 32 1.9 2.4 1.3 0.8Kazakhstan 26 2.4 2.6 0.2 0Kyrgyzstan 24 2.1 2.2 0.3 0.2Liberia 38 na ‐Madagascar 28 2.6 3.1 0.2 ‐0.3Mali 28 3 2.8 ‐0.2 0Mauritania 30 3.1 3 ‐0.1Mongolia 38 2.8 ‐ 1Mozambique 30 2.7 2.8 0.3 0.2Niger 34 2.3 3.4 1.1Nigeria 25 1.4 2.2 1.1 0.3Norway 86 8.8 8.8 ‐0.2 ‐0.2Peru 38 3.7 3.3 0.1 0.5Philippines 36 2.5 2.5 1.1 1.1Senegal 41 3.2 3.3 0.9 0.8Sierra Leone 30 2.2 2.2 0.8 0.8Tajikistan 22 1.8 2.2 0.4 0Tanzania 33 2.5 2.9 0.8 0.4Trinidad and Tobago 38 4.6 3.2 ‐0.8 0.6Ukraine 25 2.3 2.8 0.2 ‐0.3Yemen 18 2.6 2.6 ‐0.8 ‐0.8Zambia 38 2.5 2.6 1.3 1.2
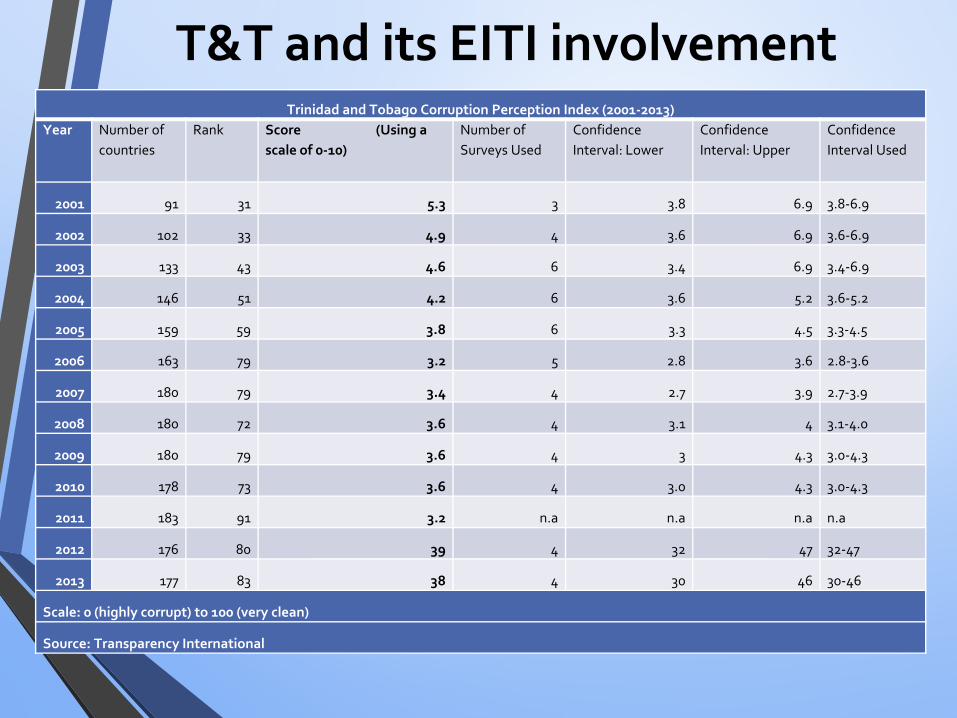
T&T and its EITI involvementTrinidad and Tobago Corruption Perception Index (2001‐2013)
Year Number of countries
Rank Score (Using a scale of 0‐10)
Number of Surveys Used
Confidence Interval: Lower
Confidence Interval: Upper
Confidence Interval Used
2001 91 31 5.3 3 3.8 6.9 3.8‐6.9
2002 102 33 4.9 4 3.6 6.9 3.6‐6.9
2003 133 43 4.6 6 3.4 6.9 3.4‐6.9
2004 146 51 4.2 6 3.6 5.2 3.6‐5.2
2005 159 59 3.8 6 3.3 4.5 3.3‐4.5
2006 163 79 3.2 5 2.8 3.6 2.8‐3.6
2007 180 79 3.4 4 2.7 3.9 2.7‐3.9
2008 180 72 3.6 4 3.1 4 3.1‐4.0
2009 180 79 3.6 4 3 4.3 3.0‐4.3
2010 178 73 3.6 4 3.0 4.3 3.0‐4.3
2011 183 91 3.2 n.a n.a n.a n.a
2012 176 80 39 4 32 47 32‐47
2013 177 83 38 4 30 46 30‐46
Scale: 0 (highly corrupt) to 100 (very clean)
Source: Transparency International
Concluding Remarks • The EITI focuses in T&T on the amount of revenues collected by
the state from various extractive sector companies and whilstthis is useful the use of these resources is where in a democracylike T&T a lot of the corruption can take place. Indeed it is felt insome quarters that there is a tendency by government toreduce the amount of money going into the Heritage andStabilization Fund (HSF) by pitching at a high budgeted priceof oil. (The Heritage and Stabilization Fund was setup in T&Twith the passing of the H&F act No. 6 in March, 2007. The higherthe budgeted price of oil in relation to the actual price of oil, thelower the amount that goes into the Fund).
• The EITI should focus not only on upstream companies butmidstream and downstream energy sector companies. ThusAtlantic, one of the biggest company in T&T by some criteriawas not included. This is a serious omission and the EITI woulddo well to make such an inclusion in future .
Concluding Remarks • There is perhaps the need for a training seminar for media
representation on the state of the energy sector in the T&T economy.This will enhance their capacity to scientifically comment on the factsin a responsible manner. This in turn will widen the block ofinformation that filters down to the average person on the street,reduce information gaps and help people in general to make moreinformed judgements and comments in holding their leadersaccountable.
• The EITI assumes the existence of a vibrant civil society grouping thatcan look at the output of the EITI report andmake meaningful use of it.In this regard what is required to complement the EITI report inTrinidad and Tobago is to provide training seminars for these variouscivil society institutions with a strong block of training so as tostrengthen their absorptive capacity for information related to theenergy sector. Reducing information asymmetry for this group willyield a greater impact in the fight for transparency against corruption.

• Thank you
•Questions and comments