Transmission ten year Development Plan 2012 to 2021 - Eskom
76
(Public Version) Transmission Ten-Year Development Plan 2012-2021
Transcript of Transmission ten year Development Plan 2012 to 2021 - Eskom

(Public Version)
Transmission Ten-YearDevelopment Plan
2012-2021

Transmission Ten-Year Plan 2012-2021
Foreword by Divisional Executive
A reliable transmission network with adequate capacity
to meet customer needs is a necessary condition for the
provision of a reliable electricity supply to South Africa,
and to support the Government’s initiatives to create
jobs, provide quality education and health care, and
uplift previously disadvantaged communities. To remain
reliable, the transmission system requires not only
maintenance, but must also be developed and extended
to meet changing customer needs or connect new loads
or power stations to the network.
The National Energy Regulator of South Africa
(NERSA), has published the rules governing investment
in the Transmission network in the Grid Code. Eskom,
as the licensed Transmission Network Service Provider,
plans the network according to this Code, and subject
to funding and other resource constraints, builds the
network according to these plans. Where insufficient
funds are available to develop the network, a consistent
set of rules is applied to prioritise projects and allocate
funding in such a way that the maximum benefit is gained
for Eskom and South Africa.
The major focus of the plans is to ensure that the
new power stations currently under construction are
integrated into the network and that there is minimum
infrastructure to meet prescribed reliability criteria.
Funding constraints mean that the time it will take to
meet the full requirements of the Grid Code could be
as late as 2020. A new challenge will be the integration
of renewable energy stations (wind, solar photovoltaic,
solar thermal, etc.) into the network, to help meet South
Africa’s commitment to reduce carbon emissions.
The total cost of the projects included in this plan, up
to and including 2021, is estimated at R 171 billion in
nominal terms. South Africa cannot prosper and grow
without a reliable supply of electricity. Hence there is a
need for stakeholders to understand what is required
to ensure a reliable and secure supply and what
investment levels are required to achieve it. I hope that
this document will assist in this dialogue, and I welcome
comments and queries on the content and format.
I would also like to take this opportunity to thank
the team that has worked and continues to work on
the development of these plans. It is a difficult and
complex process, requiring extensive consultation and
multiple iterations.
Mongezi Ntsokolo
October 2011
i

© Eskom 2011
The purpose of publishing the Transmission Ten-Year
Plan is to inform stakeholders about the proposed
developments in the Eskom transmission network.
These plans are subject to change as and when better
technical solutions are identified or when more accurate
developmental information becomes available. The
information contained in Transmission’s Ten-Year Plan
should therefore not be used for any other purpose
other than for sharing this information.
The contents of this document do not constitute
advice and Eskom makes no representations regarding
the suitability of using for any purpose the information
contained in this document. All such information is
provided “as is” without warranty of any kind and is
subject to change without notice. The entire risk arising
from its use remains with the recipient. In no event shall
Disclaimer
ii
Eskom be liable for any direct, consequential, incidental,
special, punitive or any other damages whatsoever,
including but not limited to damages for loss of business
profits, business interruption or loss of business
information.
Although the Transmission Ten-Year Plan is updated
periodically, Eskom makes no representation or warranty
as to the accuracy, reliability, validity or completeness
of the information contained in this document. Eskom
does, however, endeavour to release plans based on
the best available information at its disposal at all times
to ensure that stakeholders are kept informed about
developments in the transmission network. Therefore
the information contained in this document represents
the most up-to-date information that was available at
the time it was released
Eskom Holdings is a vertically integrated company
licensed to generate, transmit and distribute electricity
in South Africa. The Transmission Division of Eskom
Holdings has the responsibility of developing the
transmission network. The publication of the Transmission
Ten-Year Plan is to inform stakeholders about Eskom’s
plans for the development of the transmission network.
This publication fulfils the requirements of the South
African Grid Code, which requires the Transmission
Network Service Provider (TNSP) to publish plans
annually on how the network will develop. This is the
fourth publication of the Transmission Ten-Year Plan.
A public forum will be held with identified stakeholders
to disseminate further and get feedback on the
contents of this plan. These comments will be taken
into account when the plan is revised. This publication
contains information about projects intended to extend
or reinforce the transmission system, which have been
completed in the past year, as well as about projects
which are planned for the next ten years.
Executive Summary
The transmission network is the primary network of
interest covered in this publication. This covers electrical
networks with voltages ranging from 220 kV to 765 kV
and the transmission substations where these networks
terminate. A few 88-kV and 132-kV electrical networks
are included due to their strategic nature.

Transmission Ten-Year Plan 2012-2021
The projects covered in this document include the
generation integration projects required to ensure that the
network is adequate to evacuate and dispatch power
from the source to the load centres. The publication also
includes the plans for strengthening the transmission
network that is required to carry the power from
the new power stations, and the reliability projects
required to ensure that the reliability and adequacy of
the transmission network are sustained as load demand
increases on the network.
The estimated rand value of the planned projects
is approximately R171 billion in the next ten years,
of which approximately R4 billion is for customer
related projects; R27 billion for generation integration
projects, and approximately R140 billion is related to
reliability projects. The costs given in the document
are, in general, high-level estimates and can change
as global economic conditions change; that is, costs
are sensitive to fluctuations in foreign exchange and
commodity prices and to global demand.
In general, the impact of reliability projects on the
customers is to improve availability of supply under
normal and contingency operating conditions, whereas
customer and generation integration projects allow
generating plant and the load to be optimally connected
to the network.
Eskom Transmission also undertakes capital expenditure
in respect of the refurbishment of ageing infrastructure,
facilities, production equipment and strategic capital
spares. Facilities consist of buildings located at sites other
than substations, which Transmission uses for offices, the
operation and control of the system, or as maintenance
depots and workshops. Production equipment consists
of office furniture and equipment, computer hardware
and software, tools and other equipment used by
maintenance staff and vehicles. Strategic capital spares
are items not available from suppliers ex stock; for
example, large power transformers, circuit breakers, etc.
that are kept as a strategic stock to allow units which fail
in service and cannot be repaired on site, to be replaced
as soon as practicable, thereby minimising the risk that
customers may experience a lengthy outage.
Projects dealing with the refurbishment of ageing
infrastructure, facilities, production equipment and
strategic capital spares are not explained in greater
detail in this document, but a summary of their costs
appears in the chapter dealing with capital expenditure.
iii

© Eskom 2011
FOREWORD BY DIVISIONAL EXECUTIVE i
DISCLAIMER ii
EXECUTIVE SUMMARY ii
TABLE OF CONTENTS iv
ABBREVIATIONS vii
1. INTRODUCTION 1
1.1 Context of the Transmission Ten-Year Plan 1
1.2 Structure of the document 1
2. LOAD DEMAND FORECAST AND GENERATION SCENARIOS 2
2.1 Load Forecast 2
2.2 Generation Assumptions 3
Omissions from previous TDP Generation assumptions 6
Embedded Generation 7
Demand Side Management programmes 7
Imported power options 7
Discussion on impact of differences between the final 2010 IRP and the draft 2010 IRP on the TDP 8
3. MAJOR FACTOR CHANGES FROM PREVIOUS TDP 9
3.1 Generation Load Forecast 9
3.2 Generation Assumptions 10
4. COMPLETED PROJECTS SINCE LAST TDP 10
4.1 Completed generation integration projects 10
4.2 Update on transmission reliability 10
4.3 Grid Connections Applications 12
5. NATIONAL OVERVIEW 13
6. BREAKDOWN OF THE TDP PROJECTS BY GRID 16
6.1 Central Grid 16
6.2 East Grid 21
6.3 North Grid 26
6.4 North East Grid 31
6.5 North West Grid 37
6.6 South Grid 42
6.7 West Grid 47
6.8 A plan for wind and solar 52
6.9 Strategic Servitudes Under Investigation 54
7. CAPITAL EXPENDITURE PLAN 55
8. CONCLUDING REMARKS 56
Table of Contents
iv

Transmission Ten-Year Plan 2012-2021
APPENDICES
Appendix A: Generation Assumptions 58
Appendix B: Costing Details 59
Appendix B2A: Costing for Central Grid Projects 59
Appendix B2B: Costing for East Grid Projects 60
Appendix B2C: Costing for West Grid Projects 61
Appendix B2D: Costing for South Grid Projects 62
Appendix B2E: Costing for North East Grid Projects 63
Appendix B2F: Costing for North West Grid Projects 64
Appendix B2G: Costing for North Grid Projects 65
Appendix C: Publication Team 66
Appendix D: Contact Details 66
TABLE OF FIGURES
Figure 2.1: The Eskom Transmission System demand forecast 3
Figure 2.2: Power station capacity introduction by year 8
Figure 2.3: Planned Power Station Capacity by 2021 9
Figure 5.1: Map showing relative location of the major TDP scheme projects 13
Figure 6.1: Current Central Grid network and CLNs 16
Figure 6.2: Central Grid network diagram 20
Figure 6.3: Current East Grid network and CLNs 21
Figure 6.4: East Grid geographical network diagram 25
Figure 6.5: Current North Grid network and CLNs 26
Figure 6.6: North Grid geographical network diagram 30
Figure 6.7: Current North East Grid network and CLNs 31
Figure 6.8: North-East Grid network diagram 36
Figure 6.9: Current North West Grid network and CLNs 37
Figure 6.10: North West Grid geographical network diagram 41
Figure 6.11: Current South Grid network and CLNs 42
Figure 6.12: The South Grid network diagram 46
Figure 6.13: Current West Grid network and CLNs 47
Figure 6.14: West Grid geographical network diagram 51
Figure 6.15: Map of TDP scheme projects including a plan for wind and solar generation 54
v

© Eskom 2011
LIST OF TABLES
Table 4.1: Connection Applications Quoted and Accepted 12
Table 5.1: Major TDP transmission assets expected to be installed 14
Table 6.1: Central Grid CLN load forecast and percentage load increases 17
Table 6.2: New transmission assets for the Central Grid 17
Table 6.3: East Grid CLN load forecast and percentage load increase 21
Table 6.4: East Grid new transmission assets 22
Table 6.5: North Grid CLN load forecast and percentage load increases 26
Table 6.6: North Grid new transmission assets 27
Table 6.7: North East Grid CLN load forecast and percentage load increases 31
Table 6.8: Cumulative TDP transmission assets for the North East Grid 32
Table 6.9: North West Grid CLN load forecast and percentage load increases 37
Table 6.10: Cumulative assets for North West grid 38
Table 6.11: South Grid CLN load forecast and percentage load increases 42
Table 6.12: Cumulative TDP transmission assets for the South Grid 43
Table 6.13: West Grid CLN loads and percentage load increases 47
Table 6.14: Cumulative TDP transmission assets for the West Grid 48
Table 7.1: Capital Expenditure (10 Year Plan) for different categories of projects 55
Table 7.2: Capital Expenditure per project type 56
vi

Transmission Ten-Year Plan 2012-2021
Abbreviations
CLN (Customer Load Network)
The network within a specific geographical area, which
in turn is a subdivision of a Grid, e.g. Johannesburg CLN
falls within the Central Grid
TNSP (Transmission Network Service Provider)
A legal entity that is licensed to own, operate, and
maintain a transmission network
MW (Megawatts)
A million watts – a watt is a unit of electrical power
production or demand
MVAr (Megavolt-ampere reactive)
A million volt-amperes reactive – a volt-ampere reactive
is a unit of the electrical power required to maintain
electromagnetic fields
MVA (Megavolt-ampere)
A million volt-amperes of apparent power, being the
vector sum of real power (MW) and reactive power
(MVAr)
NERSA (National Energy Regulator of South Africa)
The body established by an Act of Parliament to regulate
the production, sale, and pricing of electricity, liquid fuels,
and fuel gas in South Africa
MTS – Main Transmission Substation
These are substations owned and operated by a TNSP
RTS – Return to Service
A previously mothballed Power Station undergoing re-
commissioning
REFIT – Renewable Energy Feed in Tariff
The NERSA promulgated tariffs payable to producers of
renewable energy
IPP – Independent Power Producer
These are power stations owned by independent
parties other than Eskom
TDP – Transmission Development Plan
A development plan produced annually by Grid Planning
detailing how the network will develop in the next
ten years. This comprises the proposed new projects
listed in this document as well as the customer projects
omitted from this document owing to their commercial
sensitivity
OCGT – Open Cycle Gas Turbine
Combustion turbine fuelled by liquid fuel or gas, used to
drive a generator
CCGT – Combined Cycle Gas Turbine
OCGT fitted with a waste heat recovery boiler and
steam turbines to increase electricity output by using
the combustion turbine’s exhaust gases to raise steam
HVDC – High Voltage Direct Current
IQ – Indicative Quote
Quotation giving a non-binding indication of the order
of magnitude costs
FQ – Feasibility Quote
Quotation giving customers costs and scope at a 65%
accuracy level
BQ – Budget Quote
Quotation giving customers costs and scope at an 85%
accuracy level
TOSP – Time of System Peak
vii

© Eskom 2011
1. Introduction
1.1 CONTEXT OF THE TRANSMISSION TEN-
YEAR PLAN
Eskom Holdings is the biggest producer of electricity
in South Africa; it also transmits electricity via a
transmission network which supplies electricity at high
voltages to a number of key customers and distributors.
Eskom is a vertically integrated company licensed
to generate, transmit and distribute electricity. The
transmission licence is held by Eskom Transmission, the
transmission network service provider (TNSP). Planning
the transmission network is the responsibility of the
Grid Planning Department in the Transmission Division.
The TNSP is required to abide by the regulatory
requirements to publish a document annually, detailing
the plans for the way that the transmission network
will develop in the next five years. The requirements
furthermore stipulate that the published document
should include –
• the acquisition of servitudes for strategic purposes;
• a list of planned investments, including costs;
• diagrams displaying the planned changes to the
transmission system (TS);
• an indication of the impact on customers in terms
of service quality and cost; and
• any other information as specified by NERSA from
time to time.
A further requirement is that the TNSP should hold
public forums to share such plans with stakeholders in
order to facilitate a joint planning process with them.
The third ten-year plan was published early in 2011;
this is the fourth publication based on the TDP for
2012 to 2021 (also called the 2011 TDP internally to
Eskom) which was finalised internally during the latter
part of 2011.
1.2 STRUCTURE OF THE DOCUMENT
The document is structured in the following manner:
Chapter 2 deals with the electricity demand forecast
and generation assumptions. The demand forecast
determines how the network is planned and it
contextualises the planning activity whereas the
generation assumptions outline the generation build
that informs some of the planned transmission network,
as a significant transmission network is required to
evacuate power from the power stations to the load.
Chapter 3 focuses on the major changes that have
occurred since the completion of the previous published
ten-year plan. The changes that occurred include the
enhancement of geospatial forecasting, which improves
the forecasting of load at a spatial level, and the changes
from the previous generation assumptions to the ones
informing this plan.
Chapter 4 focuses on projects that have been
completed in the past year and the impact they have
had on network reliability. This is partly to demonstrate
the value of the projects as they are completed and to
also inform stakeholders about the progress made with
projects thus far.
1

Transmission Ten-Year Plan 2012-2021
Chapter 5 deals with the national overview, which
gives a high-level explanation of the planned
transmission infrastructure. This is intended to give
a snapshot of the major projects that are planned
for the entire period of the Ten-Year Plan and a
high-level summary of the installed transmission
infrastructure.
Chapter 6 focuses in detail on the planned projects and
the impact they will have on the network. Generation
integration and reliability projects are discussed per
Grid. In both instances, sites and servitudes are required
to accommodate substations and lines respectively. In
either case, the National Environmental Management
Act requires Eskom to conduct an Environmental Impact
Assessment (EIA) and obtain environmental approval,
which includes consultation with affected stakeholders,
prior to construction.
Chapter 7 deals with the capital expenditure of the ten-
year plan.
Chapter 8 deals with various conclusions based on the
content of this document.
2. Load Demand Forecast and Generation Scenarios
2.1 LOAD FORECAST
Load forecasting is a fundamental requirement for a
Transmission planning cycle. The availability of sufficient
transmission network capacity in any country is important
for economic growth. Grid Planning, in consultation with
the relevant Distribution Regions, compiles a forecast
per point of supply for the network computer model.
A number of improvements have been made to the
forecast for this TDP. The most notable improvement is
the enhanced spatial format of the forecast as well as a
link to the economic forecast for the country in terms
of Gross Value Added (GVA) estimates.
At the Combined Forecasting Forum held in June
2010, forecasts were discussed with all parties and it
was agreed that the Balanced Base Line System Demand
at the time of System Peak (illustrated by the 2011
TDP forecast in Figure 2-1 below) and its associated
point of supply and area forecasts would be used for
transmission planning purposes by the Grid Planning
Department for the Transmission Development Plan
(TDP) network studies for the period 2012 to 2021.
The expected peak demand for 2021 is 55,7 GW.
2

© Eskom 2011
The 2011 TDP forecast is marginally higher than the
2010 TDP forecast between the years 2011 to 2018.
This is fundamentally because of the more positive
signs of economic recovery from the recent economic
recession. It is also attributed to more accurate
forecasting linked to spatial forecasting techniques and
economic sector growth. This forecast also assumes
maximum load usage by existing customers. For the
purposes of the TDP, loads are allocated to a CLN
according to the location of the transmission substation
supplying them, even if they are physically located in a
different CLN.
2.2 GENERATION ASSUMPTIONS
Please note that the Generation assumption for this
TDP was prepared in the latter part of 2010. The
existing generation capacity was included as fully
installed generation capacity in the year of the study.
Power import from Cahora Bassa was modelled at a
maximum of 1 200 MW. The future approved power
plant integration projects were incorporated in the year
in which they are expected to be commissioned.
The draft IRP 2010 was published for public consultation
in the latter part of 2010. The official release of the
final IRP 2010 was expected early in 2011. In order
to comply with the TDP process timelines, an assumed
generation rollout has been detailed based on the
draft IRP 2010 document. This draft document was
anticipated to be in line with the IRP. The generation
plan in this report was then compared with the official
IRP and any significant variances were highlighted.
In order to achieve the proposed draft IRP 2010 Plan, a
number of assumptions had to be made about the size
and location of the future planned generation plant. The
details of this plan are discussed below:
Return to Service stations
The Return-to-Service (RTS) units at the Grootvlei
and Komati Power Stations are approved projects. They
have been delayed compared to the timing expected
in the last TDP. It is now assumed that Grootvlei will be
completed in time for the 2011 system peak, with units
5 and 6 taken into service as per schedule. Komati will
be completed in time for the 2012 system peak with
units 4, 5 and 6 for the 2011 system peak and the last
three units, units 1, 2 and 3, completed in time for the
2012 system peak.
Figure 2.1: The Eskom Transmission System Demand Forecast
3

Transmission Ten-Year Plan 2012-2021
DoE OCGT power stations
The IRP indicates that the Department of Energy (DoE)
will implement the two OCGT power stations by 2013,
two years later than indicated in the previous TDP. It is
assumed that they will be completed in time for the
2013 system peak. These are assumed to be located
as previously proposed by the DoE, namely one close
to the Dedisa MTS and the other close to the Avon
MTS. They will be based on 147-MW units and will be
modelled as follows:
• 2 x 147 MW units at Dedisa
• 5 x 147 MW units at Avon
These will be treated as peaking plant in the TDP
studies, where they will only be used under contingency
conditions or if required during system peak. For the
integration studies, however, they will be studied at full
output under the local Grid peak conditions to ensure
that all the power can be evacuated.
Ingula pumped storage
The Ingula pumped-storage power station is an
approved project. The project has been delayed and it
is now assumed that units 1 and 2 will be completed in
time for the 2014 system peak and units 3 and 4 in time
for the 2015 system peak as per the project schedule.
Base Load Coal (Medupi and Kusile)
The Base Load Coal power stations at Medupi and
Kusile are approved projects. Both projects have been
delayed, however, particularly Kusile, and the assumption
is now that the new units will be completed between
2013 and 2019 as per the project schedules and in line
with the IRP.
No further base load coal-fired power stations were
expected for the TDP period of 2012 to 2021.
Co-generation Projects and MTPPP
There are a number of initiatives to introduce co-
generation projects into the Eskom power system.
These have the effect of essentially reducing the demand
at the point on the network where these co-generation
plants are connected, but the network still has to be able
to supply the load if the co-generation plant is not in
service. As a result, the co-generation plants do not have
a significant impact on the network capacity design. In
certain cases the co-generation may exceed the local load
and then the power transfer into the system will have to be
accommodated. These will have to be treated on a case-
by-case basis to determine whether they will have a
significant impact on the network. For these reasons, co-
generation projects are not considered in the TDP studies.
4

© Eskom 2011 5
One specific programme is the MTPPP programme
which offers PPA contracts to any generators that fall
below a certain price level. The expected level of the
MTPPP generation in the IRP is around 400 MW. Apart
from one large co-generation project and one medium-
size co-generation project, the rest are all below 20
MW. Effectively these are all co-generation projects
and therefore will not be included in the transmission
network model and the TDP studies. Instead they will
be treated on a case-by-case basis as specified above.
A further 1 050 MW of co-generation plant is included
in the draft IRP 2010 from 2013 to 2015. There is no
indication of plant sizes or where these plants will be
located. Based on the studies for the proposed SASOL
co-generation plant, three 200-MW units will be assumed
to be located at Sol B as per the studies. The rest will
be ignored until there is clarity about the programme.
REFIT Renewable Generation and Wind Generation
The REFIT programme was to be going out for
procurement at the time of preparing these Generation
assumptions. REFIT was to offer special tariffs for the
following renewables:
• Wind
• Small hydro
• Landfill gas
• Concentrated solar
The first phase of REFIT generation was set at 1 025
MW, with 700 MW allocated to wind generation and
100 MW allocated to the Eskom wind farm, Sere.
The 700-MW REFIT Wind may be a small number
of large wind farms or a large number of small wind
farms. This makes it difficult to model in the transmission
network files. Based on the location of wind and
applications for wind generation connection, decided
decision was made to model the 700 MW as five
representative wind farms, namely two of 100 MW, two
of 150 MW and a single 200-MW wind farm. They will
be connected directly to the 132-kV busbars of existing
MTS substations.
The six MTS substations are the following:
• Juno (2012) 100 MW (Eskom wind farm)
• Poseidon (2012) 200 MW
• Grassridge (2013) 100 MW
• Delphi (2013) 100 MW
• Aurora (2014) 150 MW
• Droerivier (2014) 150 MW
Subsequent to the REFIT, the draft IRP2010 provides
for another 3 200 MW of wind generation. This will
be modelled as a number of 200-MW wind farms at
different points on the network. In all cases, except
Kappa, the wind farms will be a single 200-MW unit
connected at the 132-kV busbar. In the case of Kappa,
it will be connected directly to the 400-kV busbar. The
list of sites and number of units with the year expected
is shown in Table 1.
Without information about the actual location and
size of the wind farms, it is difficult to determine the
exact transmission requirements for the TDP. Taking into
account that the normal average load factor of wind
farms is of the order of 35%, this means that they will
not have a significant impact on the capacity design of
the network. The impact will be very localised and it
is proposed that all wind farm applications should be
handled on a case-by-case basis.
It is useful, however, to include some wind generation
in the TDP studies under certain operating conditions.
For the purposes of the TDP studies, it is proposed that
wind generation should be studied under the following
operating conditions:
• For the base case Time-of-System peak, all wind
generators to be set at 15% output.
• Zero output to be tested at the local Time-of-Grid
peak.
• Full 100% output to be tested at the local Time-
of-Grid peak.
• Full 100% output to be tested at the local Time-of-
Grid low load.
Transmission Ten-Year Plan 2012-2021 6
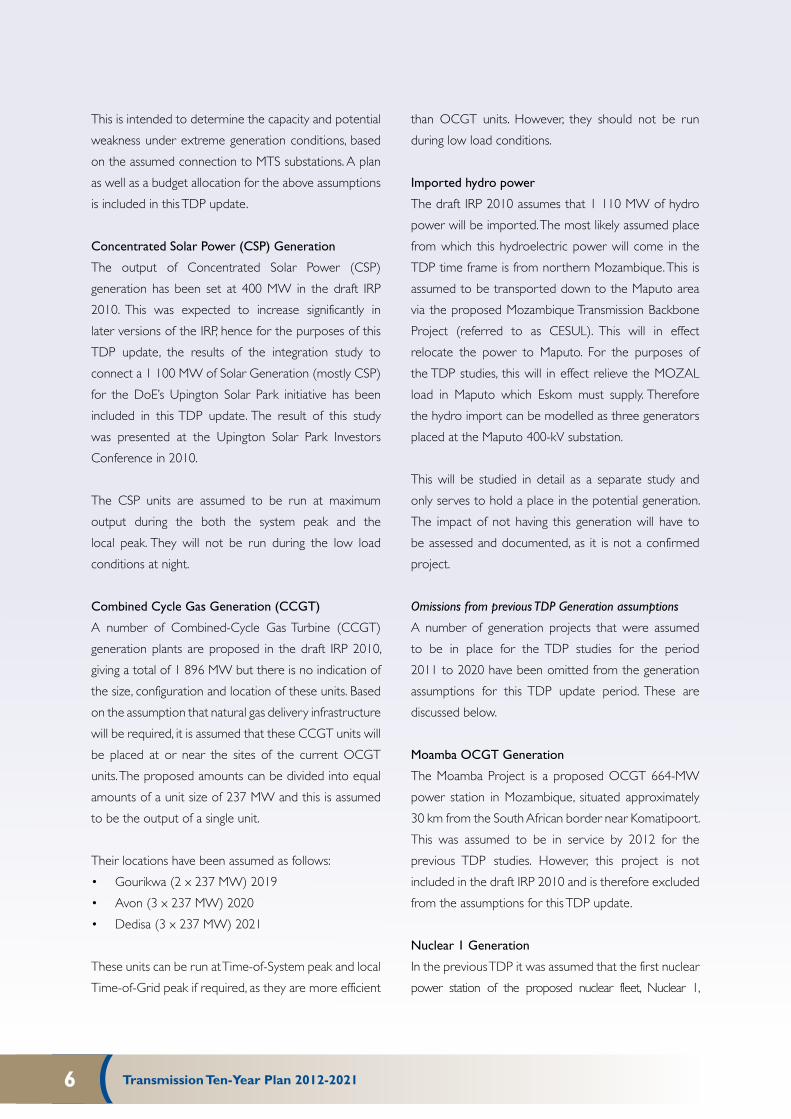
This is intended to determine the capacity and potential
weakness under extreme generation conditions, based
on the assumed connection to MTS substations. A plan
as well as a budget allocation for the above assumptions
is included in this TDP update.
Concentrated Solar Power (CSP) Generation
The output of Concentrated Solar Power (CSP)
generation has been set at 400 MW in the draft IRP
2010. This was expected to increase significantly in
later versions of the IRP, hence for the purposes of this
TDP update, the results of the integration study to
connect a 1 100 MW of Solar Generation (mostly CSP)
for the DoE’s Upington Solar Park initiative has been
included in this TDP update. The result of this study
was presented at the Upington Solar Park Investors
Conference in 2010.
The CSP units are assumed to be run at maximum
output during the both the system peak and the
local peak. They will not be run during the low load
conditions at night.
Combined Cycle Gas Generation (CCGT)
A number of Combined-Cycle Gas Turbine (CCGT)
generation plants are proposed in the draft IRP 2010,
giving a total of 1 896 MW but there is no indication of
the size, configuration and location of these units. Based
on the assumption that natural gas delivery infrastructure
will be required, it is assumed that these CCGT units will
be placed at or near the sites of the current OCGT
units. The proposed amounts can be divided into equal
amounts of a unit size of 237 MW and this is assumed
to be the output of a single unit.
Their locations have been assumed as follows:
• Gourikwa (2 x 237 MW) 2019
• Avon (3 x 237 MW) 2020
• Dedisa (3 x 237 MW) 2021
These units can be run at Time-of-System peak and local
Time-of-Grid peak if required, as they are more efficient
than OCGT units. However, they should not be run
during low load conditions.
Imported hydro power
The draft IRP 2010 assumes that 1 110 MW of hydro
power will be imported. The most likely assumed place
from which this hydroelectric power will come in the
TDP time frame is from northern Mozambique. This is
assumed to be transported down to the Maputo area
via the proposed Mozambique Transmission Backbone
Project (referred to as CESUL). This will in effect
relocate the power to Maputo. For the purposes of
the TDP studies, this will in effect relieve the MOZAL
load in Maputo which Eskom must supply. Therefore
the hydro import can be modelled as three generators
placed at the Maputo 400-kV substation.
This will be studied in detail as a separate study and
only serves to hold a place in the potential generation.
The impact of not having this generation will have to
be assessed and documented, as it is not a confirmed
project.
Omissions from previous TDP Generation assumptions
A number of generation projects that were assumed
to be in place for the TDP studies for the period
2011 to 2020 have been omitted from the generation
assumptions for this TDP update period. These are
discussed below.
Moamba OCGT Generation
The Moamba Project is a proposed OCGT 664-MW
power station in Mozambique, situated approximately
30 km from the South African border near Komatipoort.
This was assumed to be in service by 2012 for the
previous TDP studies. However, this project is not
included in the draft IRP 2010 and is therefore excluded
from the assumptions for this TDP update.
Nuclear 1 Generation
In the previous TDP it was assumed that the first nuclear
power station of the proposed nuclear fleet, Nuclear 1,

© Eskom 2011 7
would be in service in 2019. The Nuclear 1 site selected
for the purposes of the TDP studies was the Thuyspunt
site near Port Elizabeth, but in the draft IRP 2010, the
Nuclear 1 power station is only expected in 2022. It
is therefore excluded from the TDP period of 2012
to 2021. It should be borne in mind though, that
if the target date of 2022 is to be met, some of the
transmission lines for the integration may have to be in
place by 2021 or earlier for commissioning tests.
Coal 3 Generation
In the previous TDP studies, an additional base load
coal-fired power station was required to meet the
expected load demand. This was assumed to be the
proposed Coal 3 power station at Lephalale, close to
the Medupi site. The first unit would have come on line
in 2017, but the draft IRP 2010 does not include this
coal-fired power station. Accordingly, it is excluded from
this TDP update.
Embedded Generation
There are a number of embedded municipal
generation power plants in the network, such as Kelvin
in Johannesburg and Rooiwal in Tshwane. These have
been accounted for in the load demand forecast and
are assumed to be available. No communication is
known with regard to these embedded generation
plants increasing output, reducing output or shutting
down within the TDP period. In the IRP there are
allocations for some generation reduction, but there
is no correlation with or allocation to specific power
station units. Therefore these reductions will be ignored
for the purposes of the transmission network model.
Changes to the embedded generation will only be
accounted for and included in the TDP studies if there
is a high level of confidence in such changes.
Demand Side Management programmes
The draft 2010 IRP has a large component of Demand
Side Management (DSM) which is proposed to exceed
3 000 MW by 2021 but no details are provided on
how and more importantly where this DSM will be
achieved. The transmission grid is still required to be
able to supply the projected load demand in case the
DSM does not materialise. Accordingly, the DSM is not
considered for the purposes of the TDP studies for the
period 2012 to 2021.
Imported power options
Several generation project opportunities in the
Southern African region are currently being actively
investigated and pursued by Eskom to identify which
projects could be economically and strategically justified.
However, the draft 2010 IRP does not consider any
significant levels of new imported power by 2021 other
than a potential import of hydroelectricity totalling 1
110 MW between 2020 and 2021. For the purposes of
the TDP studies, this import has been assumed to come
from Mozambique, based on whether the proposed
Mozambique backbone project (referred to as the
CESUL project) will be in place and delivering hydro
power to Maputo. The power will therefore effectively
be imported from the Maputo area.
Potential imported power projects will be treated as
separate sensitivity analysis studies in the 20 to 30-
year transmission strategic grid studies. Any promising
imported power projects can then be included and
incorporated in future TDP updates, once a sufficient
level of confidence in the timing and implementation
has been attained.

Transmission Ten-Year Plan 2012-2021 8
Discussion on impact of differences between the final
2010 IRP and the draft 2010 IRP on the TDP
The TDP process overlaps the IRP process. The
generation assumptions for this TDP update were based
on the Draft 2010 IRP.
Two major differences were noticed between the two
plans for the TDP period:
• There was an addition of 3 000 MW of Solar PV.
• There was an addition of 750 MW of coal
generation in the later part of the period.
It can be assumed that the Solar PV will be dispersed
in small amounts around the country, most probably
connected to the Distribution networks. This spread
and the fact that Solar PV will not generate at the
Time–of-System peak (which is at night around 20:00),
mean that the existing plan is still valid. The daytime
peaks of this generation and lower loading conditions
will have to be tested in future updates of the TDP.
It is anticipated at this stage, however, that this scenario
will have only a marginal impact on the design of the
network or this plan.
The plan will have to be updated in future to
accommodate for the 750 MW of coal-fired generation,
depending on its location and likelihood. There are
Transmission plans for Coal 3 (now deferred) but
certain Transmission Projects for Coal 3 may need to be
brought forward (in future TDP updates) if the 750 MW
materialises or is likely to materialise in the Waterberg
(close to Medupi Power Station) area.
New generation summary
A summary of the new plant and the year that the last
unit at the power station will become commercially
available appear in Appendix A. These generation
units were assumed to be in service at the expected
dates. This is graphically illustrated in Figure 2 2 and
Figure 2 3 below.
Figure 2.2: Power station capacity introduction by year

© Eskom 2011
Figure 2.3: Planned Power Station Capacity by 2021
9
There have been some changes in the factors influencing
the selection and timing of projects for the TDP from
the previous TDP. The main factor was related to an
even better understanding of the geospatial load centres
and forecast, and the potential generation scenarios.
These two factors are briefly discussed in this section as
background to the motivation of the projects and their
timing in the TDP.
3.1 GEOSPATIAL LOAD FORECAST
The economic crisis had a significant impact on the
demand for electricity in late 2008 and early 2009.
Hence the load forecast presented in this report
indicates a relatively larger system load demand than
the load forecast presented last year.
The 2011 TDP forecast is marginally higher than the
2010 TDP forecast between the years 2011 to 2018.
This is fundamentally due to more positive signs
of economic recovery from the recent economic
recession. It is also attributed to more accurate
forecasting linked to geospatial forecasting techniques
and economic sector growth. This forecast also assumes
maximum load usage (contracted values) by existing
customers. For the purposes of the TDP, loads are
allocated to a CLN according to the location of the
transmission substation supplying them, even if they are
physically located in a different CLN.
Some of the load has moved between substations
and the need for new substations has been identified.
3. Major Factor Changes from previous TDP

Transmission Ten-Year Plan 2012-2021 10
As a result of the improved distribution of the demand
forecast, a number of new projects are required within
the TDP period as well as a need to reconfigure or re-
phase several of the projects identified in the previous
TDP. These changes were undertaken in consultation
with the Transmission Grids, Distribution and the major
Metro authorities.
3.2 GENERATION ASSUMPTIONS
The major change in the generation assumptions from
the previous TDP is the inclusion of Wind Generation,
Solar CSP, Co-Gen and CCGTs. A plan is also included
for Wind and Solar integration.
The Coal 3 generation that would be in the Waterberg
area close to Medupi is assumed to have been deferred
in this plan. The integration of the first units at Coal 3
involved building the new Delta 765/400-kV substation
This chapter contains a list of projects completed
since the last TDP. A project may consist of a number
of sub-projects, which may be placed into commercial
operation before the entire project is completed. This is
done to ensure that the network and customers enjoy
the benefits of the new assets as soon as practicable.
4.1 COMPLETED GENERATION INTEGRATION
PROJECTS
According to the Transmission Ten-Year Plan 2011-
2020, the anticipation was that the RTS of some power
stations would be completed in 2010. Parts of some
of these projects have since been completed, and the
resultant benefits are being realised. The completion
status of these projects is as follows:
• Grootvlei RTS: 5 of the 6 units have been
commissioned. The remaining unit has not yet
been completed.
and energising the Delta-Epsilon lines at 765-kV. It
is proposed that two HVDC schemes with an
HVDC converter station in the vicinity of Coal 3
should be implemented to cater for the final
configuration of six 750-MW units. The HVDC lines
will connect to HVDC rectifier terminal stations in
Gauteng and KwaZulu-Natal (Central and East Grids).
The entire scheme for Coal 3 has been deferred, but
parts of this scheme could be brought forward in future
TDP updates if required.
Nuclear 1 is also considered as being deferred in this
plan to 2022, and would be located at the Thuyspunt
site. Although the integration (400-kV local integration
and 765-kV backbone strengthening) for this power
station has been removed from this TDP period, some
project work will be required earlier and the budget for
this work is included in the Capital Plan presented later
in this report.
4. Completed Projects since last TDP
• Komati RTS: 3 of the 9 units have been
commissioned. The remaining 6 units have not
been completed. There are 2 units that are planned
to be commissioned by year-end.
4.2 UPDATE ON TRANSMISSION RELIABILITY
This section discusses all the projects reflected in the
Transmission Ten-Year Plan 2011 2020 which were
due for commissioning in 2011. Over and above them,
certain other projects were not mentioned in that plan
(because they were nearing completion) and have been
concluded since then.
Central Grid
The installation of the transformers at the Eiger
substation has been completed. The Croydon
transformer is planned to be completed by year-end.

© Eskom 2011 11
The following projects were planned to be commissioned
in 2011:
• Decommissioning of the Apollo 400-kV fault-
limiting reactors
• Hera-Bernina 275-kV Link closed (uprate of
breakers)
• Glockner Ext 3rd 800-MVA 400/275-kV transformer
• Glockner-Etna 1st 400-kV line (operate @ 275-kV)
• Glockner-Etna 2nd 400-kV line (operate @ 275-kV)
The Glockner transformer has been completed but the
remaining projects have not yet been completed.
Western Grid
No projects were planned to be commissioned in 2011.
East Grid
No projects were planned to be commissioned in 2011.
North East Grid
The Duvha-Leseding 1st 400-kV line has been completed.
The project for the installation of additional
transformation capacity at the Malelane substation has
not been completed. The Zeus 400-kV by-pass (to
create new Camden-Sol 1st & 2nd 400-kV lines) is
planned to be completed by year-end.
North Grid
The Spencer 1st 275 kV line has been completed.
The following projects were planned to be commissioned
in 2011:
• Dinaledi-Spitskop 1st 400-kV line
• Medupi-Spitskop 1st 400-kV line
• Medupi-Spitskop 2nd 400-kV Line
• Pelly 2nd 20 MVA 132/22-kV transformer
The above lines projects have not been completed
and are planned to be commissioned in 2012. The Pelly
transformer has been deferred to 2014 in this new plan.
South Grid
No projects were planned to be commissioned in 2011.
North West Grid
The following projects that planned to be commissioned
in 2011:
• Mercury-Perseus 1st 765-kV (Operate @ 400 kV)
• Series Compensation on Alpha-Beta 1st and 2nd
765-kV lines
• Series Compensation on Mercury-Perseus 1st
765-kV line
• Ferrum Ext 132-kV 1 x 72 MVAr shunt capacitors
• Olien Ext 132-kV 2 x 36 MVAr shunt capacitors
The shunt capacitor projects have been completed. The
line and series capacitor projects are planned to be
completed in 2013.

Transmission Ten-Year Plan 2012-2021
4.3 GRID CONNECTIONS APPLICATIONS
Table 4.1 outlines the number of Indicative Quotations
(IQs), Feasibility Quotations (FQs) and Budget
Quotations (BQs) that have been processed during
the period January 2011 to July 2011. These are as
a result of applications for grid connections, as per the
Grid Code.
As shown in Table 4.1 below, the number of customer
applications for grid connections processed for the
seven-month period is fairly high, indicating high
12
Grid Indicative Quotations Feasibility Quotations Budget Quotations
Issued Issued Accepted Issued Accepted
Central 0 3 3 1 2
East 2 4 0 0 0
North East 1 4 3 6 1
North West 2 2 0 0 0
North 6 6 6 7 3
South 7 3 3 4 1
West 19 4 2 0 0
Total 37 26 17 18 7
% Acceptance 65% 39%
Table 4.1: Connection Applications Quoted and Accepted
connection requirements due to increasing load and
generation activity. The acceptance rates for budget
quotations are fairly low, however. Further analysis and
consultation with customers are required to understand
the opportunities that would improve this acceptance
rate. A large number of Indicative Quote applications
(most of the 37 applications above) were received
to connect Renewable Energy Generation onto the
Transmission Grid. The number of applications received
from January 2010 to July 2011 totals 72, also mostly
due to Renewable Energy Generation applications
linked to REFIT.

© Eskom 2011 13
The map in Figure 5 1 below shows a high-level view
of the major TDP scheme projects. The relative location
of the new transmission lines and the associated MTS
substations are indicated schematically in the figure.
Figure 5.1: Map showing relative location of the major TDP scheme projects
The major new assets that have either been approved
or it is proposed should be added to the transmission
system over the next ten years are summarised in Table
5.1 on the following page.
5. National Overview

Transmission Ten-Year Plan 2012-2021 14
Table 5.1: Major TDP transmission assets expected to be installed
TDP New Assets Total
HVDC Lines (km)
765kV Lines (km)
400kV Lines (km)
275kV Lines (km)
0
4,430
7,830
501
Transformers 250MVA+
Transformers <250MVA
Total installed MVA
119
25
73,985
Capacitors
Total installed MVAr
19
2,094
Reactors
Total installed MVAr
55
12,603
Significant lengths of new transmission lines are being
added to the system: over 4 000 km of 765-kV and over
7 800 km of 400-kV lines have either been approved
or proposed over the 10-year TDP period. This addition
is mainly due to the major network reinforcements
required for the supply to the Cape (South and West
Grids) and KwaZulu-Natal (East Grid). The integration
of the new Medupi Power Station in the developing
Limpopo West Power Pool (Medupi is close to
Matimba) also requires significant lengths of transmission
line as it is a long distance away from the main load
centres. Additional 765-kV lines and HVDC lines that
were required in the previous TDP to export the power
from Coal 3 in the same area directly to load centres,
have been deferred or removed from this TDP period
because Coal 3 has been deferred in the IRP. Lines that
were required for local and backbone strengthening for
Nuclear 1 (at Thyspunt) were also removed from this
TDP period.
The large length of 400-kV transmission line is also the
result of the development of a more meshed transmission
400-kV network to provide greater reliability and thus
improve the levels of network security
These new transmission lines form part of the long-
term strategy to develop a main transmission backbone
from which regional power corridors can be supported.
These power corridors will connect generation pools
to one another and to the major load centres in the
country. This backbone and regional power corridor
network structure will allow the increasing system
demand to be supplied and the power from new
power stations to be integrated more efficiently into
the transmission network and distributed where
required, both under system-healthy and system-
contingency conditions.
The development of the transmission backbone and the
associated regional power corridors were reviewed as
part of the Strategic Grid Study which considered the
potential development scenarios beyond the 10-year
horizon of the TDP until 2030. The objective of this
strategic study was to align the transmission network
with the requirements of the generation future options
and those of the growing and future load centres. This
Strategic Grid Study has enabled the 10-Year TDP to be
aligned with the future long-term development of the
whole Eskom system.

© Eskom 2011 15
The addition of over 73 000 MVA of transformer
capacity to the transmission system is an indication
of the increase in load demand and in the firm
capacity requirements of the customers. This figure
also includes the transformation capacity required
to integrate Renewable Energy Generation.
Approximately 2 000 MVars of capacitive support
are required to support areas of the network under
contingency conditions to ensure that the required
voltage levels are maintained. They also improve
system efficiency by reducing network losses.
Approximately 12 500 MVArs of reactors are a
direct result of the long lengths of the 765-kV
and the 400-kV transmission lines that will be
constructed over this period. A number of series
compensation projects are also required on the
765-kV and 400-kV lines in order to improve the
power transfer capability of the Cape power corridors.
Two new SVCs are proposed for supporting the
Northern Cape (West Grid) and the proposed
Sishen-Saldanha Spoornet expansion, namely a +200/-
100 MVAr SVC at Aries and a smaller one of +45/-
100 MVars at Garona. Two additional SVCs have
been added, owing to Wind and Solar generation
Integration requirements. SVCs are required to
manage the voltage variation on the Transmission Grid.
Some projects have associated distribution projects
to enable customers to benefit from them. For
example, a new MTS substation may require
distribution infrastructure to link it to the existing
distribution network or to connect new bulk loads.
Distribution infrastructure and individual feeder
bays to connect distribution infrastructure or bulk
loads are not individually included in this report.

Transmission Ten-Year Plan 2012-2021 16
6.1 CENTRAL GRID
The Central Grid consists of four customer load networks (CLNs), namely Johannesburg, Vaal Triangle, West Rand and
Nigel. The current transmission network and CLNs are shown in Figure 6 1 below.
6. Breakdown of the TDP Projects by Grid
Figure 6.1: Current Central Grid network and CLNs
The expected peak CLN demands by 2021 at TOSP and the average percentage load increase for the
period for each CLN are given in Table 6 1 on the following page.

© Eskom 2011 17
The TDP schemes for the Central Grid consist of extending the 275-kV network (built at 400-kV insulation level to
allow for future upgrading to 400 kV) and the installation of additional transformers at existing substations, as well as
the construction of new substations. The increase in transmission assets by the end of 2016 and end of 2021 and the
cumulative total are shown in Table 6-2.
Table 6.1: Current Central Grid network and CLNs
CLNForecast Load (MW)
2012 2017 2021Ave. annual % load increase
Johannesburg 4847 5586 6188 3%
West Rand 2076 2892 3086 4%
Nigel 1854 2016 2165 2%
Vaal Triangle 1636 1779 1856 2%
Transmission assetsfor Central Grid
New assets expected in 2012 - 2016
New assets expected in 2017- 2021
Total newassets expected
Total kms of line 579 234 813
765kV Lines (km)
400kV Lines (km)
275kV Lines (km)
0
539
40
0
234
0
0
773
40
Total installedTransformer MVA
2925 4545 7470
Transformers (no. of) 8 10 18
Capacitors (no. of) 2 0 2
Reactors (no. of) 0 0 0
Table 6.2: New transmission assets for the Central Grid

Transmission Ten-Year Plan 2012-2021 18
Sub-project Name TDP Scheme Project GridNew expected
year
Benburg Ext 3rd 250 MVA 275/132 kV Benburg Ext 3rd 250 MVA 275/132 kV Central 2014
Demeter Ext 400/88-kV transformation (1st, 2nd and 3rd 315-MVA transformers and 400-kV busbar)
Demeter 400-kV integration Central 2017
Loop in Pluto-Verwoerdburg 400 kV into Demeter
Demeter 400-kV integration Central 2017
Esselen-North Rand 1st 275-kV line upgrade (existing 132 kV)
Johannesburg East strengthening – Phase 1B
Central 2015
North Rand Ext 1st 500 MVA 275/132-kV transformer (line Banked) and Esselen 275-kV busbar rearrangement
Johannesburg East strengthening – Phase 1B
Central 2015
Esselen-North Rand 2nd 275-kV line upgrade (existing 132 kV)
Johannesburg East strengthening – Phase 2
Central 2016
North Rand Ext 2nd 500 MVA 275/132-kV transformer and 275-kV busbar establishment
Johannesburg East strengthening – Phase 2
Central 2016
Jupiter B 275-kV Loop-ins (Prospect-Sebenza 1 & 2, Jupiter-Prospect 1, Jupiter-Fordsburg 1)
Johannesburg East strengthening – Phase 3 A-D
Central 2014
Apollo-Esselen 1st 400 kV (energised @ 275 kV)
Johannesburg East strengthening – Phase 3 A-D
Central 2014
Matla-Jupiter B 1st 400-kV line (operated @ 275 kV)
Johannesburg East strengthening – Phase 3 A-D
Central 2014
Matla-Jupiter B 2nd 400-kV line (operated @ 275 kV)
Johannesburg East strengthening – Phase 3 A-D
Central 2014
Prospect-Sebenza 1st 275-kV line (energise existing 88-kV line)
Johannesburg East strengthening – Phase 3 A-D
Central 2014
Prospect-Sebenza 2nd 275-kV line (energise existing 88-kV line at 275 kV)
Johannesburg East strengthening – Phase 3 A-D
Central 2014
Jupiter B 275-kV switching station Johannesburg East strengthening – Phase 3 A-D
Central 2014
North Rand-Sebenza 1st 275-kV line (Sebenza bays are GIS)
Johannesburg East strengthening – Phase 3 E-F
Central 2017
North Rand-Sebenza 2nd 275kV line (Sebenza bays are GIS)
Johannesburg East strengthening – Phase 3 E-F
Central 2017
Sebenza substation (400-kV busbar operated @ 275 kV )
Johannesburg East strengthening – Phase 3 E-F
Central 2017
Lepini Ext 275 kV 2 x 150 Mvar capacitors
Johannesburg North – Phase 2a Central 2012
Apollo-Lepini 1st 275-kV line Johannesburg North – Phase 2b Central 2013
Craighall-Craighall B-Sebenza 1st 400-kV line (operated @ 275 kV) (reuse existing Delta-Kelvin 88-kV servitude)
Johannesburg strengthening Central 2023
The following projects are planned for the 2012 to 2021 period:

© Eskom 2011 19
Sub-project Name TDP Scheme Project GridNew expected
year
Craighall B 400/88-kV GIS Substation Johannesburg strengthening Central 2023
Kookfontein Ext 3rd 315 MVA 275/88-kV transformer and 3rd Glockner-Kookfontein 275-kV line establishment
Kookfontein Phase 2 Central 2014
Kyalami 400-kV loop-in (Kusile-Lulamisa 1st 400 kV)
Kyalami integration Central 2017
Kyalami 400/132-kV substation (1st & 2nd 500 MVA transformers) (All bays are GIS)
Kyalami integration Central 2017
Decommissioning of the Apollo 400-kV fault-limiting reactors
Reactive power support for Johannesburg
Central 2012
Simmerpan ext 275/132-kV transformation (2 x 250 MVA)
Simmerpan 275/132-kV substation Central 2021
Jupiter B-Simmerpan 1st & 2nd 275-kV lines (uprate of 88-kV lines)
Simmerpan 275/88-kV substation Central 2016
Simmerpan 275/88-kV substation (expand existing Dx station)
Simmerpan 275/88-kV substation Central 2016
Quattro 275/88kV substation (1st and 2nd 315-MVA transformers) (400/88-kV construction)
Soweto strengthening Phase 1 – 275 kV Central 2014
Etna-Quattro 1st and 2nd 400-kV lines (energised @ 275 kV)
Soweto strengthening Phase 1 – 275 kV Central 2014
Quattro 275/132-kV substation (1st and 2nd 500-MVA transformers) (400/132-kV construction)
Soweto strengthening Phase 2 – 275/132 kV
Central 2016
Etna-Glockner 1st & 2nd 400-kV lines upgrade
West Rand strengthening – Phase: Etna 400 kV
Central 2022
Etna Ext 400/275-kV transformation (2 x 800 MVA)
West Rand strengthening – Phase: Etna 400 kV
Central 2017
Glockner-Hera 1st 400-kV line West Rand strengthening – Phase: Glockner and Hera 400 kV
Central 2022
Westgate B 400/132-kV substation (1st 500-MVA transformer)
West Rand strengthening – Phase: Westgate B and Taunus 400 kV
Central 2019
Hera-Westgate B 1st 400-kV line West Rand strengthening – Phase: Westgate B and Taunus 400 kV
Central 2019
Taunus-Westgate B 1st 400-kV line West Rand strengthening – Phase: Westgate B and Taunus 400 kV
Central 2019
Etna-Taunus 1st 400-kV line (energised @ 275 kV)
West Rand strengthening – Phase: Westgate B and Taunus 400 kV
Central 2022
Taunus Ext 400/132-kV transformation (1 x 500 MVA)
West Rand strengthening – Phase: Westgate B and Taunus 400 kV
Central 2022

Transmission Ten-Year Plan 2012-2021 20
Changes compared to the 2010 TDP:
Removed from the TDP:
• Siluma 275/88-kV MTS integration removed due to insufficient motivation for the project.
New projects/schemes in the TDP:
• Olympus 3rd 275/132 kV 250-MVA transformer: Customer request.
Modified:
• Decommissioning of the Apollo 400-kV fault-limiting reactors and changed to by-passing the Apollo 400-kV fault-
limiting reactors.
• Johannesburg East strengthening – Phase 3 A-D: Johannesburg East strengthening – Phase 3B was cancelled and
2 x 275-kV new Matla-Jupiter B lines (400 kV built) are to be established.
• West Rand strengthening: Hera – Westgate B 400 kV and new Westgate B 400 kV S/S were changed to 1st 500
MVA; 400/132-kV transformer at Westgate, fed from a double circuit line from Hera.
• Vaal strengthening – Phase 3 time-lines were moved to 2022 from 2017 and scope has increased to accommodate
a strategic 400-kV servitude from Westgate to Taunus (via Princess) to Etna.
Figure 6.2: Central Grid network diagram
A network diagram of the major projects in the Central Grid is shown in Figure 6 2 below:

© Eskom 2011
6.2 EAST GRID
The East Grid consists of four CLNs namely, Ladysmith, Newcastle, Empangeni and Pinetown. The current transmission
network and CLNs are shown in Figure 6.3 below.
Figure 6.3: Current East Grid network and CLNs
The expected peak CLN demands by 2021 at TOSP and the average percentage load increase for the period for each
CLN are given in Table 6 3 below.
Table 6.3: East Grid CLN load forecast and percentage load increase
CLNForecast load (MW) Ave. annual %
load increase2012 2017 2021
Ladysmith and Newcastle 1 293 1 445 1 593 2%
Empangeni 2 335 2 571 2 931 3%
Pinetown 3 462 3 806 4 462 3%
The TDP scheme projects for the East Grid consist primarily of strengthening the 400-kV networks that transmit
power to the Empangeni and Pinetown CLNs and the introduction of 765 kV. In addition to the above TDP scheme
projects, other projects are listed in the project summary, which are required to strengthen the network.
21

Transmission Ten-Year Plan 2012-2021 22
Table 6.4: East Grid new transmission assets
The increase in transmission assets by the end of 2016 and end of 2021 and the cumulative total are shown in
Table 6 4.
Transmission Assetsfor Eastern Grid
New assets expected in 2012 - 2016
New assets expected in 2017 - 2021
Total new assets expected
Total kms of line 1 487 385 1 872
765kV Lines (km)
400kV Lines (km)
275kV Lines (km)
490
992
5
280
105
0
770
1 097
5
Total installedTransformer MVA
10 795 6 050 16 845
Transformers (no. of) 13 6 19
Capacitors (no. of) 0 0 0
Reactors (no. of) 6 2 8
Sub-project Name TDP Scheme Project GridNew expected
year
Ariande-Venus 2nd 400-kV line Ariadne-Venus 2nd 400-kV line East 2015
Assmang 400/132-kV substation Assmang MTS East 2016
Loop into Assmang 400/132-kV substation the Mersey – Hector 400-kV line
Assmang MTS East 2016
Avon Ext 3rd 250 MVA 275/132-kV transformer
Avon Ext 3rd 250 MVA 275/132-kV transformer
East 2014
Invubu Ext 1st and 2nd 500 MVA 400/132-kV transformers
Empangeni local network strengthening East 2016
Umfolozi-Theta (Mbewu) 765-kV line (operate @ 400 kV)
Empangeni strengthening – Phase 2 East 2016
Invubu-Theta (Mbewu) 2nd 400-kV line Empangeni strengthening – Phase 2 East 2016
Theta (Mbewu) 400-kV loop-ins (Athene-Umfolozi 1st 400 kV & Invubu-Umfolozi 1st 400-kV line)
Empangeni strengthening – Phase 2 East 2016
Theta (Mbewu) 400-kV switching station Empangeni strengthening – Phase 2 East 2016
Camden-Theta (Mbewu) 1st 765-kV line (operated @ 765 kV)
Empangeni strengthening – Phase 4 East 2017
The following projects are planned for the 2012 to 2021 period:

© Eskom 2011 23
Sub-project Name TDP Scheme Project GridNew expected
year
Camden Ext 765/400-kV transformation Empangeni strengthening – Phase 4 East 2017
Theta (Mbewu) Ext 2nd 765/400-kV transformation
Empangeni strengthening – Phase 4 East 2017
Ariadne-Eros 2nd 400-kV line Eros reinforcement – Ariadne-Eros 400 kV East 2015
Eros-Vuyani 1st 400-kV line Greater East London strengthening – Phase 1: Eros-Mthatha & SS
East 2013
Hector Ext 4th 800 MVA 400/275-kV transformer
Hector Ext 4th 800 MVA 400/275-kV transformer
East 2018
Incandu Ext 3rd 315 MVA 400/132-kV transformer
Incandu Ext 3rd 315 MVA 400/132-kV transformer
East 2014
Ingula 400-kV loop in (Majuba-Venus 1st 400-kV line)
Ingula Pumped Storage P/S integration East 2013
Ingula-Venus 2nd 400-kV line Ingula Pumped Storage P/S integration East 2013
Ingula 400-kV busbar establishment (integration of P/S gens)
Ingula Pumped Storage P/S integration East 2013
Hector-Klaarwater 3rd 275 kV (extend Georgedale-Klaarwater and bypass Georgedale)
Klaarwater reinforcement – Phase 1 East 2016
Hector-Klaarwater 1st 400 kV (operated @ 275 kV)
Klaarwater reinforcement – Phase 2 East 2017
Lambda-Theta (Mbewu) 765-kV line (extend Majuba-Theta (Mbewu) 765-kV line)
KZN 765-kV integration East 2016
Theta (Mbewu) Ext 765/400-kV transformation
KZN 765kV integration East 2016
2 X Majuba – Lambda 400-kV lines KZN 765kV integration East 2016
Lambda 400/765-kV substation and transformation
KZN 765-kV integration East 2016
Lambda-Sigma (Isundu) 765kV line (extend Majuba-Sigma (Isundu) 765kV line)
KZN 765-kV integration East 2016
Sigma (Isundu) Ext 765/400-kV transformation
KZN 765-kV integration East 2016
Mersey Ext 3rd 250 MVA 275/132-kV transformer
Mersey Ext 3rd 250 MVA 275/132-kV transformer
East 2017
Normandie Ext 2nd 250 MVA 400/132-kV transformer
Normandie Ext 2nd 250 MVA 400/132-kV transformer
East 2013
Mersey-Ottawa 1st 400 kV (operated @ 275 kV)
Ottawa reinforcement East 2017
Sigma (Isundu)-Theta (Mbewu) 1st and 2nd 400-kV line
Pinetown – Empangeni interconnection East 2016

Transmission Ten-Year Plan 2012-2021 24
Sub-project Name TDP Scheme Project GridNew expected
year
Majuba-(via Venus)-Sigma (Isundu) 1st 765-kV line (operated @ 400 kV)
Pinetown strengthening – Phase 1 East 2016
Hector-Sigma (Isundu) 1st 400-kV line Pinetown strengthening – Phase 1 East 2016
Hector-Sigma (Isundu) 2nd 400-kV line Pinetown strengthening – Phase 1 East 2016
Oribi 400/132-kV substation South Coast strengthening East 2020
Loop into Oribi 400/132-kV substation the Ariadne-Eros 2nd 400-kV line
South Coast strengthening East 2020
Spoornet coal-line upgrade (Natal) Spoornet coal-line upgrade (Natal) East 2014
Changes compared to the 2010 TDP:
Changes in the execution dates for the expansion projects affect the power transfers into the Empangeni and Pinetown
CLNs. Network analysis studies show that this could be mitigated by improving the power factor of eThekwini
Electricity from 0,9 to at least 0,95. At present eThekwini Electricity is already engaged in improving the power
factor. They have installed/reinstated capacitor banks at the Klaarwater and Durban North substations and optimised
transformer tap-changer positions in the 132-kV network. Additional capacitor banks are planned for installation in
the network in 2013.
There are no new network risks. The plans as they currently stand are still valid and address the identified gaps.

© Eskom 2011 25
Figure 6.4 East Grid geographical network diagram
A geographical network diagram indicating the major projects in the East Grid for the ten-year period is shown in
Figure 6 4.

Transmission Ten-Year Plan 2012-2021 26
6.3 NORTH GRID
The North Grid consists of five CLNs, namely Waterberg, Rustenburg, Lowveld (northern part), Bela-Bela (formerly Warmbad) and Polokwane. The current transmission network and CLNs are shown in Figure 6 5 below.
Figure 6.5: Current North Grid network and CLNs
The expected peak CLN demands by 2021 at TOSP and the average percentage load increase for the period for each CLN are given in Table 6 5 below.
Table 6.5: North Grid CLN load forecast and percentage load increases
CLNForecast load (MW) Ave. annual %
load increase2012 2017 2021
Waterberg 680 801 1 085 8%
Rustenburg 1 763 2 305 2 399 3%
Lowveld North 1 708 2 698 2 931 6%
Bela-Bela (Warmbad) 642 832 895 4%
Polokwane 1 144 1 751 1 935 6%

© Eskom 2011 27
The Northern Grid load growth is mainly due to the platinum group metals (PGM) and ferrochrome mining and
processing activities located in the Rustenburg, Polokwane and Steelpoort areas.
The TDP Scheme Projects for the Northern Grid consist of extending the 400-kV and 275-kV networks as well as
establishing the 765-kV network, integrating the Medupi Power Station and installing additional transformers at existing
and new substations.
The increase in transmission assets by the end of 2016 and the end of 2021 and the cumulative total are shown in
Table 6 6.
Table 6.6 North Grid new transmission assets
Transmission Assets for Northern Grid
New assets expected in 2012 - 2016
New assets expected in 2017 - 2021
Total new assets expected
Total kms of line 1 950 490 2 440
765kV Lines (km)
400kV Lines (km)
275kV Lines (km)
200
1 600
150
0
490
0
200
2 090
150
Total installedTransformer MVA
4 635 1 500 6 135
Transformers (no. of) 12 4 16
Capacitors (no. of) 0 0 0
Reactors (no. of) 2 2 4

Transmission Ten-Year Plan 2012-2021 28
Sub-project Name TDP Scheme Project GridNew expected
year
Brits West loop-in (Dinaledi-Spitskop 1st 400 kV)
Brits 400 kV reinforcement North 2017
Brits West substation 400/132 kV Brits 400 kV reinforcement North 2017
Brits West-Dinaledi 2nd 400 kV Brits 400-kV reinforcement North 2017
Dinaledi 3rd 500 MVA 400/132-kV transformer
Dinaledi 3rd 500 MVA 400/132-kV transformer
North 2014
Dwaalboom 132-kV switching station Dwaalboom 132-kV switching station North 2013
Acornhoek upgrade 2 x 125 MVA 275/132-kV transformers
Foskor & Acornhoek 275/132-kV trans-formation upgrades
North 2014
Foskor 3rd 250 MVA 275/132-kV transformer
Foskor & Acornhoek 275/132-kV trans-formation upgrades
North 2014
Foskor-Merensky 2nd 275-kV line Foskor & Acornhoek 275/132-kV trans-formation upgrades
North 2016
Dinaledi-Spitskop 1st 400-kV line Medupi integration (Alpha) Phase 1A: Spitskop and Dinaledi
North 2012
Dinaledi-Spitskop 2nd 400-kV line Medupi integration (Alpha) Phase 1A: Spitskop and Dinaledi
North 2013
Medupi-Spitskop 1st 400-kV line Medupi integration (Alpha) Phase 1A: Spitskop and Dinaledi
North 2012
Medupi-Spitskop 2nd 400-kV Line Medupi integration (Alpha) Phase 1A: Spitskop and Dinaledi
North 2012
Medupi-Marang 1st 400 kV Medupi integration (Alpha) Phase 1B: Marang
North 2012
Medupi-Ngwedi (Mogwase) 1st 400-kV line
Medupi integration (Charlie) Phase 2A: Mogwase
North 2014
Ngwedi (Mogwase) 400-kV loop in (Matimba-Midas 1st 400 kV)
Medupi integration (Charlie) Phase 2A: Mogwase
North 2014
Ngwedi (Mogwase) 400/132-kV substation (2 x 500 MVA transformers)
Medupi integration (Charlie) Phase 2A: Mogwase
North 2014
Medupi-Ngwedi (Mogwase) 1st 765-kV line (energised at 400 kV)
Medupi integration (Charlie) Phase 2A: Mogwase
North 2016
Burotho (Mokopane) 400-kV loop-in (Matimba-Witkop 1st 400-kV line)
Medupi integration (Charlie) Phase 2B: Mokopane
North 2014
Burotho(Mokopane) 400/132-kV substation (2 x 500 MVA transformers)
Medupi integration (Charlie) Phase 2B: Mokopane
North 2014
Medupi-Burotho(Mokopane) 1st 400-kV line
Medupi integration (Charlie) Phase 2B: Mokopane
North 2014
Burotho(Mokopane)-Witkop 2nd 400-kV line
Medupi integration (Mmamabula) Phase 3C: Mokopane
North 2014
The following projects are planned for the 2012 to 2021 period:

© Eskom 2011 29
Sub-project Name TDP Scheme Project GridNew expected
year
Nzhelele-Tabor 1st 400-kV line Nzhelele 400-kV reinforcement North 2017
Nzhelele 400/132-kV substation (1st & 2nd 250 MVA)
Nzhelele 400-kV reinforcement North 2017
Burotho (Mokopane)-Nzhelele 1st 400-kV line
Nzhelele 400-kV reinforcement North 2017
Pelly 2nd 20MVA 132/22-kV transformer
Pelly 132/22-kV transformation upgrade North 2014
Bighorn 2nd 800 MVA 400/275-kV transformer
Rustenburg transformation reinforce-ment
North 2012
Tabor Ext 1st 500 MVA 400/132-kV transformer
Tabor and Spencer reinforcement – Phase 2
North 2012
Tabor-Witkop 1st 400kV line Tabor and Spencer Reinforcement – Phase 2
North 2012
Trident 3rd 315 MVA 275/88-kV transformer
Trident 275/88-kV transformation upgrade
North 2014
Changes compared to the 2010 TDP:
The following projects linked to Coal 3 have been deferred:
• Medupi-Delta 2nd 400-kV line (link to Mmamabula-Delta 1st 400-kV line)
• Medupi-Delta 1st 400-kV line (link to Delta-Epsilon 1st 400-kV line)
• Delta 400-kV switching station (future 765-kV transformation)
• Mmamabula-Delta 1st 400-kV line (link to Medupi-Delta 2nd 400-kV line)
• Mmamabula-Delta 2nd 400-kV line (link to Delta-Epsilon 2nd 765kV line @ 400 kV)
• Delta-Epsilon 1st 765-kV line (energised @ 400 kV) (link to Medupi-Delta 1st 400-kV line)
• Mmamabula-Delta 3rd 400-kV line (link to Delta-Witkop 1st 400-kV line)
• Delta-Epsilon 2nd 765-kV line (energised @ 400 kV) (link to Mmamabula-Delta 2nd 400-kV line)
• Delta Ext 765/400-kV transformation (1st and 2nd 2 000 MVA transformers)
• Delta-Epsilon 1st 765-kV line (energised @ 765 kV)
• Delta-Epsilon 2nd 765-kV line (energised @ 765 kV)
• Coal 3-Delta 1st 400-kV line
• Coal 3-Delta 2nd 400-kV line
• Coal 3-Delta 3rd 400-kV line
• Coal 3-HVDC Terminal A 1st 400-kV line
• Delta-HVDC Terminal A 1st 400-kV line
• Delta-HVDC Terminal A 2nd 400-kV line
• HVDC Terminal A (Lephalale)
• HVDC 800-kV line 1 (Lephalale-Jupiter B)
• Coal 3-HVDC Terminal A 2nd 400-kV line
• Coal 3-HVDC Terminal A 3rd 400-kV line
• HVDC 800-kV line 2 (Lephalale-Durban)

Transmission Ten-Year Plan 2012-2021 30
The following new projects are recommended:
• Trident 3rd 315 MVA 275/88-kV transformer
• Pelly 2nd 20 MVA 132/22-kV transformer
• Dinaledi 3rd 500 MVA 400/132-kV transformer
• Borutho-Nzhelele 400-kV line instead of the Medupi-Nzhelele 400-kV line
A network diagram of the major projects in the North Grid is shown in Figure 6.6 below.
Figure 6.6: North Grid geographical network diagram

© Eskom 2011 31
6.4 NORTH EAST GRID
The North East Grid consists of four CLNs, namely Highveld North, Highveld South, Lowveld (southern part) and
Pretoria. The current transmission network and CLNs are shown in Figure 6 7 below.
Figure 6.7: Current North East Grid network and CLNs
The expected peak CLN demands by 2021 at TOSP and the average percentage load increase for the period for each
CLN are given in Table 6.7 below.
Table 6.7: North East Grid CLN load forecast and percentage load increases
CLNForecast load (MW) Ave. annual %
load increase2012 2017 2021
Highveld North 2 347 2 680 3 270 4%
Highveld South 1 127 2 032 2 062 7%
Lowveld 1 708 2 698 2 931 6%
Pretoria 2 254 2 544 2 938 4%

Transmission Ten-Year Plan 2012-2021 32
The TDP schemes for the North East Grid consist of extending the 400-kV network, the integration of the Kusile
Power Station and the installation of additional transformers at existing and any new substations added. The increase
in transmission assets by the end of 2016 and the end of 2021 and the cumulative total are shown in Table 6.8.
Table 6.8: Cumulative TDP transmission assets for the North East Grid
Transmission assets for North-East Grid
New assets expected in 2012 - 2016
New assets expected in 2017 - 2021
Total new assets expected
Total kms of line 864 90 954
765kV Lines (km)
400kV Lines (km)
275kV Lines (km)
0
768
96
0
90
0
0
858
96
Total installedTransformer MVA
8 850 5 365 14 215
Transformers (no. of) 21 8 29
Capacitors (no. of) 3 0 3
Reactors (no. of) 0 0 0
Sub-project Name TDP Scheme Project GridNew expected
year
Alpha Ext 4th 765/400-kV 2 000-MVA transformer
Alpha Ext 4th 765/400-kV transformer N-East 2018
Terminal equipment replacement (Apollo-Kendal, Duvha-Minerva, Minerva-Vulcan, Prairie-Marathon1 & 2)
Highveld North terminal equipment upgrade
N-East 2012
Rockdale 132-kV breakers upgrading Highveld North-West and Lowveld North reinforcement – Phase 1
N-East 2013
Arnot-Kendal 400-kV line loop in-out Rockdale B
Highveld North-West and Lowveld North reinforcement – Phase 1
N-East 2013
Rockdale B 400/132-kV substation (1st & 2nd 500 MVA 400/132-kV transformers)
Highveld North-West and Lowveld North reinforcement – Phase 1
N-East 2013
Marble Hall-Rockdale B 1st 400-kV line Highveld North-West and Lowveld North reinforcement – Phase 2
N-East 2014
The following projects are planned for the 2012 to 2021 period:

© Eskom 2011 33
Sub-project Name TDP Scheme Project GridNew expected
year
Marble Hall-Tubatse ( Steelpoort ) 1st 400-kV line
Highveld North-West and Lowveld North reinforcement – Phase 2
N-East 2014
Marble Hall 400/132-kV substation (1st & 2nd 500 MVA 400/132-kV transformers)
Highveld North-West and Lowveld North reinforcement – Phase 2
N-East 2014
Tubatse 400-kV loop-in (Duvha-Leseding 1st 400-kV line)
Highveld North-West and Lowveld North reinforcement – Phase 2
N-East 2014
Tubatse 400-kV switching station Highveld North-West and Lowveld North reinforcement – Phase 2
N-East 2014
Rockdale B 400/132-kV substation extension (3rd 500 MVA 400/132-kV transformer)
Highveld North-West and Lowveld North reinforcement – Phase 3
N-East 2017
Rockdale B 400/132-kV substation extension (4th 500 MVA 400/132-kV transformer)
Highveld North-West and Lowveld North reinforcement – Phase 4
N-East 2021
Sol B 400-kV loop in (Kriel-Tutuka 1st 400-kV line)
Highveld South reinforcement N-East 2014
New Sol B 400/132-kV substation (1st, 2nd, 3rd and 4th 500 MVA transformers)
Highveld South reinforcement N-East 2014
Sol B turn in (Kriel-Zeus 1st 400 kV to form new Kriel-Sol B 2nd 400-kV line)
Highveld South reinforcement N-East 2014
Kruispunt 275-kV loop-in (Komati-Matla 1st 275-kV line)
Kruispunt reinforcement N-East 2013
Kusile 400-kV loop-in (Duvha-Minerva 1st 400-kV line)
Kusile integration – Phase 1: 400-kV loop-ins
N-East 2012
Kusile 400-kV busbar HV yard establishment (integration of P/S gens)
Kusile integration – Phase 1: 400-kV loop-ins
N-East 2012
Vulcan 400-kV bypass and reconfiguration (loop in Duvha-Kendal 1st 400-kV line and loop out Arnot-Vulcan 1st 400-kV lines to form Duvha-Vulcan 2nd 400 kV and Arnot-Kendal 1st 400 kV)
Kusile integration – Phase 1: 400-kV loop-ins
N-East 2012
Kusile-Lulamisa 1st 400-kV line Kusile integration – Phase 2: Lulamisa N-East 2014
Kusile 400 kV by-pass Duvha Kusile integration – Phase 3A: 400-kV Duvha by-pass
N-East 2013
Kusile 400-kV loop-in (Apollo-Kendal 1st 400-kV line)
Kusile integration – Phase 3B: 400-kV loop-in
N-East 2013
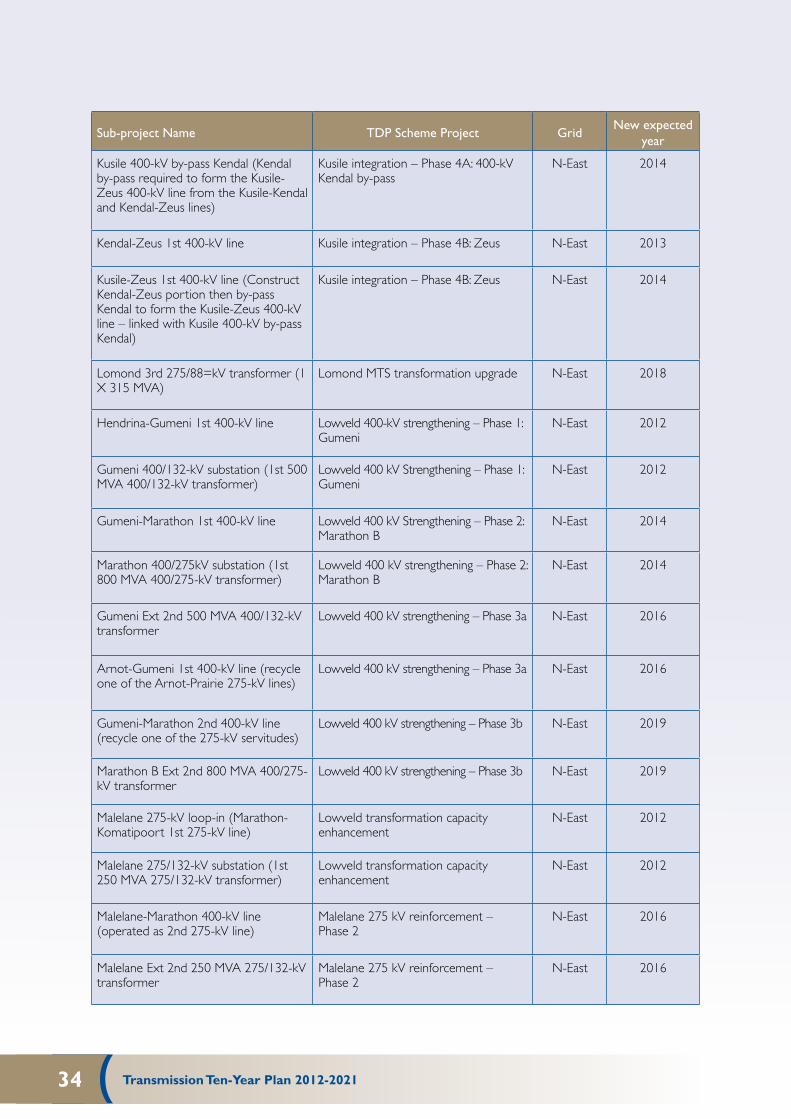
Transmission Ten-Year Plan 2012-2021 34
Sub-project Name TDP Scheme Project GridNew expected
year
Kusile 400-kV by-pass Kendal (Kendal by-pass required to form the Kusile-Zeus 400-kV line from the Kusile-Kendal and Kendal-Zeus lines)
Kusile integration – Phase 4A: 400-kV Kendal by-pass
N-East 2014
Kendal-Zeus 1st 400-kV line Kusile integration – Phase 4B: Zeus N-East 2013
Kusile-Zeus 1st 400-kV line (Construct Kendal-Zeus portion then by-pass Kendal to form the Kusile-Zeus 400-kV line – linked with Kusile 400-kV by-pass Kendal)
Kusile integration – Phase 4B: Zeus N-East 2014
Lomond 3rd 275/88=kV transformer (1 X 315 MVA)
Lomond MTS transformation upgrade N-East 2018
Hendrina-Gumeni 1st 400-kV line Lowveld 400-kV strengthening – Phase 1: Gumeni
N-East 2012
Gumeni 400/132-kV substation (1st 500 MVA 400/132-kV transformer)
Lowveld 400 kV Strengthening – Phase 1: Gumeni
N-East 2012
Gumeni-Marathon 1st 400-kV line Lowveld 400 kV Strengthening – Phase 2: Marathon B
N-East 2014
Marathon 400/275kV substation (1st 800 MVA 400/275-kV transformer)
Lowveld 400 kV strengthening – Phase 2: Marathon B
N-East 2014
Gumeni Ext 2nd 500 MVA 400/132-kV transformer
Lowveld 400 kV strengthening – Phase 3a N-East 2016
Arnot-Gumeni 1st 400-kV line (recycle one of the Arnot-Prairie 275-kV lines)
Lowveld 400 kV strengthening – Phase 3a N-East 2016
Gumeni-Marathon 2nd 400-kV line (recycle one of the 275-kV servitudes)
Lowveld 400 kV strengthening – Phase 3b N-East 2019
Marathon B Ext 2nd 800 MVA 400/275-kV transformer
Lowveld 400 kV strengthening – Phase 3b N-East 2019
Malelane 275-kV loop-in (Marathon-Komatipoort 1st 275-kV line)
Lowveld transformation capacity enhancement
N-East 2012
Malelane 275/132-kV substation (1st 250 MVA 275/132-kV transformer)
Lowveld transformation capacity enhancement
N-East 2012
Malelane-Marathon 400-kV line (operated as 2nd 275-kV line)
Malelane 275 kV reinforcement – Phase 2
N-East 2016
Malelane Ext 2nd 250 MVA 275/132-kV transformer
Malelane 275 kV reinforcement – Phase 2
N-East 2016

© Eskom 2011 35
Sub-project Name TDP Scheme Project GridNew expected
year
Malelane 132 kV, 72-MVar Capacitor bank Malelane 275 kV reinforcement – Phase 2 N-East 2016
Phoebus 400/275/132-kV substation (1st & 2nd 400 MVA 400/275-kV transformer)
Tshwane reinforcement – Phoebus Phase 1
N-East 2016
Phoebus Ext 400/132-kV transformation (1st 250 MVA 400/132-kV transformer)
Tshwane reinforcement – Phoebus Phase 1
N-East 2016
Pelly-Phoebus 1st 275-kV line (energise Hangklip-Pelly 132-kV line)
Tshwane reinforcement – Phoebus Phase 1
N-East 2016
Phoebus 400-kV loop-in (Apollo-Dinaledi 1st 400-kV line)
Tshwane reinforcement – Phoebus Phase 1
N-East 2016
Phoebus-Mabopane-Garankuwa 132-kV line upgrading
Tshwane reinforcement – Phoebus Phase 2
N-East 2016
Dinaledi-Phoebus 1st 132-kV line (twin Kingbird)
Tshwane reinforcement – Phoebus Phase 3
N-East 2016
Apollo-Pluto 400-kV loop in-out Verwoerdburg
Tshwane reinforcement – Verwoerdburg Phase 1
N-East 2013
Verwoerdburg 400/132-kV substation (1st & 2nd 250 MVA transformers)
Tshwane reinforcement – Verwoerdburg Phase 1
N-East 2013
Phoebus-Kwagga 1st 275-kV line Tshwane reinforcement – Verwoerdburg Phase 2
N-East 2016
Dinaledi-Anderson 1st 400-kV line Tshwane reinforcement – Verwoerdburg Phase 2
N-East 2016
Anderson 400/132-kV substation (1st & 2nd 250-MVA transformers)
Tshwane reinforcement – Verwoerdburg Phase 2
N-East 2016
Verwoerdburg 400/132-kV substation (3rd 250-MVA transformer)
Tshwane reinforcement – Verwoerdburg Phase 2
N-East 2017
Wildebees 400/132-kV substation (Customer 250 MVA transformers)
Tshwane reinforcement – Wildebees Phase 1
N-East 2014
Wildebees 400-kV loop in-out (Apollo-Dinaledi 1st 400 kV)
Tshwane reinforcement – Wildebees Phase 1
N-East 2014
Tubatse-Senakangwedi 1st 400-kV line Tubatse strengthening scheme – Phase 1 N-East 2016
Arnot-Merensky 400-kV loop-in to Senakangwedi
Tubatse strengthening scheme – Phase 1 N-East 2016
Senakangwedi 400/275 kV (1 X 800 MVA) Tubatse strengthening scheme – Phase 1 N-East 2016
Senakangwedi 400/132-kV substation (2 X 500 MVA)
Tubatse strengthening scheme – Phase 2 N-East 2020
Senakangwedi Ext 275-kV shunt cap Xstrata Phase 2 customer project – Transmission reinforcement
N-East 2012

Transmission Ten-Year Plan 2012-2021 36
Changes compared to the 2010 TDP:
Tshwane Reinforcement Phases 1 and 2 have been taken as cancelled for the 2012 – 2021 TDP due to the change in key assumptions (load forecast and Tshwane’s network development plans).
The Marble Hall Mokopane 400-kV line has been cancelled for the 2012 – 2021 TDP for the following reason:• The planned Marble Hall MTS integration plans would be able to support the forecast load at Marble Hall without
the Marble Hall-Mokopane 400-kV line, according to the latest network optimisation study.
The Marble Hall-Mokopane 400-kV line may be required if the planned future coal-fired power stations, Coal 3 and Coal 4, go ahead in the Northern Grid.
The following new projects are recommended:• Malelane 132-kV, 72-MVar capacitor bank• Arnot-Merensky 400-kV loop-in to Senakangwedi• Senakangwedi 400/275-kV (1 X 800 MVA) • Senakangwedi 400/132-kV substation (2 X 500 MVA)• Rockdale B 400/132-kV substation extension (3rd 500 MVA 400/132-kV transformer)• Rockdale B 400/132-kV substation extension (4th 500 MVA 400/132-kV transformer)• Lomond 3rd 275/88-kV transformer (1 X 315 MVA)• Terminal equipment replacement (Apollo-Kendal, Duvha-Minerva, Minerva-Vulcan, Prairie-Marathon1 & 2)
Figure 6.8: North-East Grid network diagram
A network diagram of the major projects in the North East Grid is shown in Figure 6.8 below.

© Eskom 2011 37
6.5 NORTH WEST GRID
The North-West Grid is composed of four CLNs, namely Bloemfontein, Carletonville, Kimberley and Welkom. The current transmission network and CLNs are shown in Figure 6.9 below.
Figure 6.9: Current North West Grid network and CLNs
The 765-kV network is primarily used for the transportation of power through the grid to the Cape. The projects for the North West Grid are mainly the introduction of 400-kV lines and transformation to support or relieve the 275-kV networks. The load growth in the grid is shown in Table 6.9 below.
Table 6.9: North West Grid CLN load forecast and percentage load increases
CLNForecast load (MW)
Ave. annual % load increase2012 2017 2021
Bloemfontein 471 519 554 2%
Carletonville 1580 1558 1574 0.05%
Kimberley 547 1 084 1 242 9%
Welkom 887 911 929 0,5%

Transmission Ten-Year Plan 2012-2021 38
The North West Grid includes the 765 kV integration required for the Cape Corridor and 400 kV integration to enable load growth in the local areas. It also includes a plan to integrate 1 100 MW of solar generation in the Upington area.
The increase in transmission assets by the end of 2016 and the end of 2021 and the cumulative total are shown in Table 6.10.
Table 6.10: Cumulative assets for North West Grid
Transmission assets for North West Grid
New assets expected in 2012 - 2016
New assets expected in 2017 - 2021
Total new assets expected
Total kms of line 2 370 875 3 245
765kV Lines (km)
400kV Lines (km)
275kV Lines (km)
970
1 290
110
870
5
0
1 840
1 295
110
Total installedTransformer MVA
7 080 1 000 8 080
Transformers (no. of) 16 2 18
Capacitors (no. of) 6 1 7
Reactors (no. of) 10 4 14
Sub-project Name TDP Scheme Project GridNew expected
year
Everest-Merapi 275-kV line Bloemfontein strengthening N-West 2016
Merapi Ext 3rd 250 MVA 275/132-kV transformer
Bloemfontein strengthening N-West 2016
Mercury-Perseus 1st 765 kV (operate @ 400 kV)
Cape Corridor Phase 2: Zeus-Hydra 765-kV integration
N-West 2013
Beta-Perseus 1st 765-kV line Cape Corridor Phase 2: Zeus-Hydra 765-kV integration
N-West 2013
The following projects are planned for the 2012 to 2021 period:

© Eskom 2011 39
Sub-project Name TDP Scheme Project GridNew expected
year
Gamma-Perseus 1st 765-kV line Cape Corridor Phase 2: Zeus Hydra 765-kV Integration
N-West 2013
Zeus-Mercury 1st 765-kV line (to form Zeus-Perseus 1st 765-kV) (by-pass Mercury)
Cape Corridor Phase 2: Zeus-Hydra 765-kV integration
N-West 2013
Perseus Ext 765/400-kV transformation Cape Corridor Phase 2: Zeus-Hydra 765-kV integration
N-West 2013
Relocate Beta-Hydra 765-kV line to form Perseus-Hydra 1st 765-kV line
Cape Corridor Phase 2: Zeus-Hydra 765-kV integration
N-West 2013
Series compensation on Alpha-Beta 1st and 2nd 765-kV lines
Cape Corridor Phase 3: 765-kV series capacitors (NOH)
N-West 2013
Series compensation on Mercury-Perseus 1st 765-kV line
Cape Corridor Phase 3: 765-kV series capacitors (NOH)
N-West 2013
Series compensation on Zeus-Mercury 1st 765-kV line
Cape Corridor Phase 3: 765-kV series capacitors (NOH)
N-West 2013
Series compensation on Zeus-Perseus 1st 765-kV line
Cape Corridor Phase 4: 2nd Zeus- Perseus-Gamma-Omega 765-kV line
N-West 2020
Gamma-Perseus 2nd 765-kV line Cape Corridor Phase 4: 2nd Zeus- Perseus-Gamma-Omega 765-kV line
N-West 2020
Zeus-Perseus 2nd 765-kV line (most direct line)
Cape Corridor Phase 4: 2nd Zeus- Perseus-Gamma-Omega 765-kV line
N-West 2020
Kronos 400/132-kV transformation Garona strengthening N-West 2014
Kronos-Cuprum 1st & 2nd 132 kV Garona strengthening N-West 2014
Ferrum-Mookodi (Vryburg) 1st 400-kV line
Kimberley 400-kV strengthening – Phase 2
N-West 2013
Ferrum Ext 1st & 2nd 500 MVA 400/132-kV transformers
Kimberley 400-kV strengthening – Phase 2
N-West 2013
Mercury-Mookodi (Vryburg) 1st 400-kV line
Kimberley 400-kV strengthening – Phase 2
N-West 2013
Mookodi (Vryburg) 400/132-kV substation (1st and 2nd 250 MVA 400/132-kV transformers)
Kimberley 400-kV strengthening – Phase 2
N-West 2013
Hermes-Mookodi (Vryburg) 1st 400-kV line
Kimberley strengthening – Phase 3 N-West 2016
Ferrum-Mookodi (Vryburg) 2nd 400-kV line (via Hotazel)
Kimberley strengthening – Phase 3 N-West 2016

Transmission Ten-Year Plan 2012-2021 40
Sub-project Name TDP Scheme Project GridNew expected
year
Hotazel 400-kV loop-in (Ferrum- Mookodi (Vryburg) 2nd 400-kV line)
Kimberley strengthening – Phase 3 N-West 2019
Hotazel 400/132-kV substation (1st and 2nd 2 500 MVA 400/132-kV transformers)
Kimberley strengthening – Phase 3 N-West 2019
Hotazel Ext 132 kV 1st 36 MVAr capacitor
Kimberley strengthening – Phase 3 N-West 2020
Theseus Ext 400 kV 1st 100 MVAr reactor
Kimberley strengthening – Phase 3 N-West 2019
Phase 1: Sishen-Saldanha Spoornet new traction stations (1 x 275/50-kV substation with 2 x 40 MVA transformers)
Sishen-Saldanha full solution (supply for new Spoornet Traction)
N-West 2012
Garona Ext 275-kV SVC Sishen-Saldanha full solution (supply for new Spoornet Traction)
N-West 2012
Watershed 275/132-kV substation 250 MVA 275/132-kV transformers
Watershed strengthening N-West 2014
Aries-Upington 1st & 2nd 400-kV lines Upington strengthening – Phase 1 N-West 2016
Ferrum-Upington 1st 400-kV line Upington strengthening – Phase 1 N-West 2016
Nieuwehoop-Upington 1st 400-kV line Upington strengthening – Phase 1 N-West 2016
Upington 5x 500MVA 400/132-kV transformation
Upington strengthening – Phase 1 N-West 2016
Watershed MTS 132-kV reactive power compensation
Watershed strengthening N-West 2014
Watershed MTS 88-kV reactive power compensation
Watershed strengthening N-West 2014
Changes compared to the 2010 TDP:
The following projects have been deferred:
• Perseus-KDS 400-kV line
• KDS 400/132-kV transformation
• Garona132-kV reactive power compensation
• Gamma-Perseus 3rd 765-kV line
• Epsilon-Perseus 1st 765-kV line
• KDS-Olien 400-kV line
• Olien 1st 250 MVA 400/132-kV transformation
• Garona Ext 1st 125 MVA 400/132-kV transformer

© Eskom 2011 41
The following new projects are recommended:
• Hortazel Ext 132 kV 1st 36 MVAr capacitor
• Aries-Upington 1st & 2nd 400-kV lines
• Ferrum-Upington 1st 400-kV line
• Nieuwehoop-Upington 1st 400-kV line
• Upington 5 x 500 MVA 400/132-kV transformation
• Theseus Ext 400 kV 1st 100 MVAr reactor
A network diagram of the major projects in the North West Grid is shown in Figure 6.10 below.
Table 6.10: North West Grid geographical network diagram

Transmission Ten-Year Plan 2012-2021 42
Figure 6.11: Current South Grid network and CLNs
6.6 SOUTH GRID
The South Grid consists of the area to the south-eastern side of the Hydra substation, which area predominantly falls
inside the boundary of the Eastern Cape Province. It comprises three Customer Load Networks (CLNs), namely Port
Elizabeth, East London and the Karoo. The current transmission network and CLNs are shown in Figure 6.11 below.
The expected peak demands by 2021 as well as the average percentage load increase for the period, for each CLN,
are given in Table 6.11 below.
Table 6.11: South Grid CLN load forecast and percentage load increases
CLNForecast load (MW)
Ave. annual % load increase2012 2017 2021
Karoo 260 300 308 2%
East London 620 742 852 5%
Port Elizabeth 977 1 533 1 916 8%

© Eskom 2011 43
The TDP schemes for the South Grid consist of the integration of the DME OCGT power station at Dedisa, the
reinforcement of the greater Port Elizabeth metro area including the Coega IDZ, and the Greater East London
strengthening scheme, which includes the integration of the Vuyani 400/132-kV substation at Mthatha to supply the
central and southern Transkei area. If the first Nuclear 1 unit materialises at Thuyspunt in 2022, three additional 400-
kV lines would be required to link it to Grassridge and Dedisa via the new Port Elizabeth 400/132-kV substation.
The integration for Thuyspunt has been excluded from this TDP as it falls outside the planning period. The increase in
transmission assets by the end of 2016 and the end of 2021 as well as the cumulative total are shown in Table 6.12.
Table 6.12: Cumulative assets for the South Grid
Transmission assets for Southern Grid
New assets expected in 2012 - 2016
New assets expected in 2017 - 2021
Total new assets expected
Total kms of line 931 760 1 691
765kV Lines (km)
400kV Lines (km)
275kV Lines (km)
560
371
0
760
0
0
1 320
371
0
Total installedTransformer MVA
1 295 6 500 7 795
Transformers (no. of) 9 8 17
Capacitors (no. of) 4 0 4
Reactors (no. of) 4 5 9

Transmission Ten-Year Plan 2012-2021 44
Sub-project Name TDP Scheme Project GridNew expected
year
Gamma Ext 765-kV busbar establishment
Cape Corridor Phase 2: Gamma-Omega 765-kV integration
South 2013
Gamma-Kappa 1st 765-kV line Cape Corridor Phase 2: Gamma-Omega 765-kV integration
South 2013
Gamma Ext 2nd 400 MVar 765-kV busbar reactor
Cape Corridor Phase 2: Kappa 765-kV integration
South 2013
Hydra-Gamma 1st 765-kV line Cape Corridor Phase 3: 765-kV series capacitors (NOH)
South 2013
Gamma-Kappa 2nd 765-kV line Cape Corridor Phase 4: 2nd Zeus-Perseus-Gamma-Omega 765-kV line
South 2020
Delphi 3rd 120 MVA 400/132-kV transformer
Delphi 3rd 120 MVA 400/132-kV transformer
South 2014
Ruigevallei-Hydra derate 220-kV line to 132-kV
Gariep network strengthening South 2013
Grassridge 132-kV equipment upgrade (fault level requirements)
Grassridge 132-kV equipment upgrade (fault level requirements)
South 2017
Grassridge Ext 3rd 400/132-kV 500 MVA transformer and busbar upgrade
Grassridge-Dedisa strengthening South 2017
Dedisa Ext 3nd 500 MVA 400/132-kV transformer
Grassridge-Dedisa strengthening South 2018
Grassridge-Dedisa 1st 132-kV line Grassridge-Dedisa strengthening South 2014
Vuyani (Mhatha) 400/132-kV substation (1st and 2nd 250 MVA)
Greater East London strengthening – Phase 1: Eros-Mthatha & SS
South 2012
Neptune-Vuyani 1st 400-kV line Greater East London strengthening – Phase 2: Neptune-Mthatha & SS
South 2012
Poseidon-Neptune 1st 400-kV line Greater East London strengthening – Phase 3
South 2015
Pembroke B 400/132-kV substation Greater East London strengthening – Phase 3
South 2017
Hydra 400 & 132-kV equipment upgrade (fault level requirements)
Hydra 400 & 132-kV equipment upgrade (fault level requirements)
South 2017
Pembroke B loop-in and out Poseidon-Neptune 1st 400kV line
N-East 2016
Delphi Ext 400 kV 1st 100 MVAr capacitor
PE Phase 3: Poseidon, Delphi, Grassridge and Dedisa shunt compensation
South 2015

© Eskom 2011 45
Sub-project Name TDP Scheme Project GridNew expected
year
Grassridge Ext 400 kV 1st 100 MVAr capacitor
PE Phase 3: Poseidon, Delphi, Grassridge and Dedisa shunt compensation
South 2015
Poseidon Ext 400 kV 1st 100 MVAr capacitor
PE Phase 3: Poseidon, Delphi, Grassridge and Dedisa shunt compensation
South 2015
Dedisa Ext 400 kV 1st 100 MVAr capacitor
PE Phase 3: Poseidon, Delphi, Grassridge and Dedisa shunt compensation
South 2015
Pembroke 3rd 90 MVA 220/66-kV transformer (dual ratio 220/132/66 kV)
Pembroke 3rd 90MVA 220/66-kV transformer (dual ratio 220/132/66kV)
South 2014
Gamma Ext 765-kV busbar extension Southern Grid – Phase 3: 1st Gamma Grassridge 765-kV line
South 2017
Gamma-Grassridge 1st 765kV line Southern Grid – Phase 3 : 1st Gamma Grassridge 765-kV line
South 2017
Grassridge Ext 765/400kV transformation
Southern Grid – Phase 3: 1st Gamma Grassridge 765-kV line
South 2017
Buffalo, Pembroke, Roodekuil and Ruigtevallei transformer LV supply normalisation
Southern Grid – transmission transformer normalisation
South 2014
Changes compared to the 2010 TDP:
The following projects have been deferred:
• Thyspunt-Dedisa 1st 400-kV line
• Thyspunt-Grassridge 1st 400-kV line
• Thyspunt HV yard
• Grassridge-Port Elizabeth 2nd 400-kV line
• Thyspunt-Port Elizabeth 1st 400-kV line
• Thyspunt-Port Elizabeth 2nd 400-kV line
The following new projects are recommended:
• Dedisa Ext 3nd 500 MVA 400/132-kV transformer
• Grassridge-Dedisa 1st 132-kV line
• Ruigevallei-Hydra derate 220-kV line to 132 kV
• Delphi 3rd 120 MVA 400/132-kV transformer
• Pembroke 3rd 90 MVA 220/66-kV transformer (dual ratio 220/132/66 kV)
• Hydra 400 & 132-kV equipment upgrade (fault level requirements)
• Grassridge 132-kV equipment upgrade (fault level requirements)

Transmission Ten-Year Plan 2012-2021 46
The geographical network of the South Grid is shown in Figure 6.12 below.
Figure 6.12: The South Grid network diagram

© Eskom 2011 47
6.7 WEST GRID
The West Grid consists of four CLNs, namely Peninsula, Southern Cape, West Coast and Namaqualand. The current transmission network and CLNs are shown in Figure 6.13 below.
Figure 6.13: Current West Grid network and CLNs
The Western Cape customer base consists of consumers within the borders of South Africa, as well as international customers (NamPower and Skorpion in Namibia). The expected peak demands by 2021 and the average percentage load increase for the period for each CLN are given in Table 6.13 below.
Table 6.13: West Grid CLN load forecast and percentage load increases
CLNForecast load (MW)
Ave. annual % load increase2012 2017 2021
Namaqualand 129 181 197 4%
West Coast 479 526 550 2%
Southern Cape 905 1 008 1 104 2%
Peninsula 2 858 3 474 3 766 4%

Transmission Ten-Year Plan 2012-2021 48
Included in the TDP studies is the forecast export to Namibia via the 400-kV and 220-kV interconnections. The
export amount has been assumed to remain constant over the TDP period.
The TDP schemes for the West Grid consist of extending the 400-kV network and introducing 765-kV injection
at two points, namely Omega and Kappa. There is also the installation of additional transformers at existing and
new substations.
The increase in transmission assets by the end of 2016 and the end of 2021 and the cumulative total are shown
in Table 6.14.
Table 6.14: Cumulative TDP transmission assets for the West Grid
Transmission assets for Western Grid
New assets expected in 2012 - 2016
New assets expected in 2017 - 2021
Total new assets expected
Total kms of line 838 908 1 746
765kV Lines (km)
400kV Lines (km)
275kV Lines (km)
450
588
100
150
758
0
300
1 346
100
Total installedTransformer MVA
7 820 5 625 13 445
Transformers (no. of) 17 9 26
Capacitors (no. of) 3 0 3
Reactors (no. of) 14 6 20

© Eskom 2011 49
Sub-project Name TDP Scheme Project GridNew expected
year
Blanco 400-kV line loop-in (Proteus-Droerivier 1st 400-kV line)
Blanco Substation Establishment (2 x 500 MVA 400/132-kV TRFRs)
West 2018
Blanco 400/132-kV Substation (1st and 2nd 500 MVA transformers)
Blanco Substation Establishment (2 x 500 MVA 400/132kV TRFRs)
West 2018
Omega 400kV Loop-in (Koeberg-Muldersvlei 400-kV line)
Cape Corridor Phase 2: Gamma-Omega 765-kV integration
West 2014
Kappa-Omega 1st 765-kV line Cape Corridor Phase 2: Gamma-Omega 765-kV integration
West 2014
Omega 765/400-kV substation Cape Corridor Phase 2: Gamma-Omega 765-kV integration
West 2014
Kappa 400-kV loop-ins (Droerivier-Bacchus & Droerivier-Muldersvlei 400-kV lines)
Cape Corridor Phase 2: Kappa 765-kV integration
West 2013
Kappa Ext 400-kV 100 MVAr shunt reactor
Cape Corridor Phase 2: Kappa 765-kV integration
West 2013
Kappa 765/400-kV substation Cape Corridor Phase 2: Kappa 765-kV integration
West 2013
Kappa-Omega 2nd 765-kV line (recycle Bacchus-Muldersvlei and Bacchus-Kappa 400-kV lines)
Cape Corridor Phase 4: 2nd Zeus-Perseus-Gamma-Omega 765-kV line
West 2020
Omega Ext 2nd 2 000 MVA 765/400-kV transformer
Cape Corridor Phase 4: 2nd Zeus-Perseus-Gamma-Omega 765-kV line
West 2020
Droerivier-Proteus 2nd 400-kV line Droerivier-Proteus 2nd 400-kV line West 2018
Firgrove 400-kV line loop-in (Palmiet-Stikland 1st 400-kV line)
Firgrove substation Establishment (2 x 500 MVA 400/132-kV TRFRs)
West 2013
Firgrove 400/132-kV substation (1st and 2nd 500 MVA transformers)
Firgrove substation establishment (2 x 500 MVA 400/132-kV TRFRs)
West 2013
Ankerlig 132-kV loop-in Koeberg-Dussenberg 132-kV line
Gas 1 off-site relocation to Ankerlig West 2013
Houwhoek 400-kV line loop-in (Palmiet-Bacchus 1st 400-kV line)
Houwhoek substation establishment (2 x 500 MVA 400/132-kV TRFRs)
West 2018
Houwhoek 400/132-kV substation (1st and 2nd 500 MVA transformers)
Houwhoek substation establishment (2 x 500 MVA 400/132-kV TRFRs)
West 2018
The following projects are planned for the 2012 to 2021 period:

Transmission Ten-Year Plan 2012-2021 50
Sub-project Name TDP Scheme Project GridNew expected
year
Mitchells Plain 400/132-kV substation (1st and 2nd 500 MVA transformers)
Mitchells Plain 400-kV substation West 2016
Firgrove-Mitchells Plain 1st 400-kV line Mitchells Plain 400-kV substation West 2016
Firgrove-Mitchells Plain 2nd 400-kV line Mitchells Plain 400-kV substation West 2016
Muldersvlei Ext 3rd 500 MVA 400/132-kV transformer & 132-kV series reactors
Muldersvlei Ext 3rd 500 MVA 400/132-kV transformer & 132-kV series reactors
West 2014
Aggeneis-Paulputs 2nd 220-kV line N Cape reinforcement: Ageneies-Paulputs 2nd 220 kV
West 2016
Aggeneis-Helios 1st 400-kV line N Cape reinforcement: Aggeneis-Helios 1st 400 kV
West 2016
Aggeneis-Oranjemond 2nd 220-kV line (built at 400 kV)
N Cape reinforcement: Aggeneis-Oranjemond 2nd 220 kV
West 2016
Aries Ext 400 kV 1st SVC N Cape reinforcement: Aries SVC West 2016
Ferrum-Garona 1st 400-kV line N Cape reinforcement: Ferrum-Garona-Nieuwehoop 400 kV
West 2017
Garona-Nieuwehoop 1st 400-kV line N Cape reinforcement: Ferrum-Garona-Nieuwehoop 400 kV
West 2017
Paulputs Ext 2nd 125 MVA 220/132-kV transformer
Paulputs Ext 2nd 125 MVA 220/132-kV transformer
West 2017
Philippi Ext 3rd 500 MVA 400/132-kV transformer
Philippi Ext 3rd 500 MVA 400/132-kV transformer
West 2014
Aries-Nieuwehoop 1st 400-kV line Sishen-Saldanha Full Solution (supply for new Spoornet traction)
West 2016
Series compensation of 400-kV lines (reconfiguration of Northern Cape capacitors)
Sishen-Saldanha Full Solution (supply for new Spoornettraction)
West 2016
Sishen-Saldanha Spoornet new traction stations (4 sites with 8 transformers stepping down to 50 kV)
Sishen-Saldanha Full Solution (supply for new Spoornet traction)
West 2016

© Eskom 2011 51
Changes compared to the 2010 TDP:
The following new projects are recommended:
• Houwhoek 400-kV line loop-in (Palmiet-Bacchus 1st 400-kV line)
• Blanco 400-kV line loop-in (Proteus-Droerivier 1st 400-kV line)
• Houwhoek 400/132-kV substation (1st and 2nd 500 MVA transformers)
• Blanco 400/132-kV substation (1st and 2nd 500 MVA transformers)
A diagram of the major projects in the West Grid is shown in Figure 6.14 below.
Figure 6.14: West Grid geographical network diagram

Transmission Ten-Year Plan 2012-2021 52
6.8 A PLAN FOR WIND AND SOLAR
A plan is contained in this TDP update to include the integration of wind and solar generation based on the assumptions
of the location and size made in Section 2.2 above of the generation assumptions. It should be noted that this is merely
an assumption at this stage, especially as regards to the locations selected for the wind farms which are next to existing
Transmission substations. The Upington Solar Park can be assumed to be more accurate, considering that the area
represents some of the highest sources of solar radiation in the country. The main reason for producing this plan at
this stage was to compile a financial budget for this type of generation integration for the Transmission Ten-Year Supply
Plan. The TDP will be updated annually with more accurate information on the location and size of new wind and solar
generation facilities, based on the Connection Quotation applications received.
The following projects result from this plan:
Sub-project Name TDP Scheme Project GridNew expected
year
Aries-Upington 1st & 2nd 400-kV lines Upington strengthening – Phase 1 N-West 2016
Ferrum-Upington 1st 400-kV line Upington strengthening – Phase 1 N-West 2016
Nieuwehoop-Upington 1st 400-kV line Upington strengthening – Phase 1 N-West 2016
Upington 5x 500 MVA 400/132-kV transformation
Upington strengthening – Phase 1 N-West 2016
Juno Ext 132-kV feeder bay (wind) Juno Wind Phase 1 West 2012
Delphi Ext 132-kV feeder bay (wind) Delphi Wind Phase 1 South 2013
Aurora Ext 132-kV feeder bay (wind) Aurora Wind Phase 1 West 2014
Aurora Ext 2 X 132-kV feeder bay (wind)
Aurora Wind Phase 2 West 2017
Droerivier Ext 132-kV feeder bay (wind)
Droerivier Wind Phase 1 West 2014
Droerivier Ext 2 X 132-kV feeder bay (wind)
Droerivier Wind Phase 3 West 2019
Delphi Ext 1st 400-kV SVC Delphi Wind Phase 2 South 2019
Bacchus Ext 2 X 132-kV feeder bay (wind)
Bacchus Wind Phase 1 West 2016
Bacchus Ext 2 X 132-kV feeder bay (wind)
Bacchus Wind Phase 2 West 2019
Grassridge Ext 132-kV feeder bay (wind)
Grassridge Wind Phase 1 South 2013
Hydra Ext 132-kV feeder bay (wind) Hydra Wind Phase 1 South 2017
Nama Ext 220-kV feeder bay (wind) Nama Wind Phase 1 West 2018

© Eskom 2011 53
Sub-project Name TDP Scheme Project GridNew expected
year
Gromis Ext 220-kV SVC Nama Wind Phase 1 West 2018
Merapi Ext 2 X 132-kV feeder bay (wind)
Merapi Wind Phase 1 N-West 2019
Grassridge Ext 2 X 132-kV feeder bay (wind)
Grassridge Wind Phase 2 South 2016
Grassridge Ext 2 X 132-kV feeder bay (wind)
Grassridge Wind Phase 3 South 2019
Poseidon Ext 1 X 132-kV & 66-kV feeder bay (wind)
Poseidon Wind Phase 1 South 2012
Poseidon Ext 400/132-kV (1 X 500 MVA) substation (edicated 132-kV supply for new wind integration)
Poseidon Wind Phase 2 South 2016
Delphi Ext 400/132-kV (1 X 500 MVA) substation (dedicated 132-kV supply for new wind integration)
Delphi Wind Phase 2 South 2019
Kappa Ext 400/132-kV (1 X 500 MVA) substation (new dedicated 132-kV supply for new wind integration)
Kappa Wind Phase 1 West 2016
Droerivier Ext 400/132-kV (1 X 500 MVA) substation (dedicated 132-kV supply for new wind integration)
Droerivier Wind Phase 2 West 2017
Hydra Ext 400/132-kV (1 X 500 MVA) substation (dedicated 132-kV supply for new wind integration)
Hydra Wind Phase 2 South 2018
Gromis Ext 400/132-kV (1 X 500 MVA) substation (dedicated 132-kV supply for new wind integration)
Gromis Wind Phase 1 West 2018
Juno-Gromis 1st 400-kV line Gromis Wind Phase 1 West 2018
Juno Ext 400/132-kV (1 X 500 MVA) substation (dedicated 132-kV supply for new wind integration)
Juno Wind Phase 2 West 2017

Transmission Ten-Year Plan 2012-2021 54
A diagram of the major projects in the West Grid is shown in Figure 6.15 below.
Figure 6.15: Map of TDP scheme projects including a plan for wind and solar generation
This plan resulted in a lot of simple feeder-bay requirements at most of the selected Transmission stations initially,
as there is spare capacity. As this capacity runs out, new transformers will have to be added to ensure Grid Code
Criteria are met. A 400-kV line will be required between the Juno and Gromis substations as the 220-kV network in
the Northern Cape runs out of capacity. Two SVCs have been placed on the system in order to ensure the voltage
requirements are met. One was placed at the Gromis substation and the other at the Delphi substation.
6.9 STRATEGIC SERVITUDES UNDER INVESTIGATION
All the line projects and new substation projects that are proposed in the document need to go through a full
environmental impact assessment (EIA) process before implementation. This process includes public participation
meetings, which are advertised in the media. The concerns of the public and affected parties are addressed at the
public participation meetings. Eskom Holdings will not commence the construction of any line or substation unless the
EIA process (Record of Decision signed and servitudes acquired) has been concluded.
The proposed lines shown in various schematics in this document give an estimation of where the various proposed
lines will run. The outcome of the EIA process will determine the exact position of the lines. The projects in this
document are at various stages of the EIA process.

© Eskom 2011 55
The total capital expenditure for Transmission including expansion, refurbishment, facilities, production equipment,
and land acquisition project costs amount to R 209.9 billion. This summary is shown in Table 7 1. It is clear that the
majority of the cost will be related to expansion because this relates directly to the strengthening of the network to
accommodate new customers as well as new generation.
7. Capital Expenditure Plan
Table 7.1: Capital Expenditure (10 Year Plan) for different categories of projects
Categories FY12-21
Expansion 170,888
Refurbishment 17,363
Capital Spares 5,729
L&R 8,134
OTHER 7,021
Production Equipment 744
Total 209,879
Refurbishment and land acquisition projects are the second and third-most expensive items in the capital expenditure,
respectively. Refurbishment is required to prolong the life of assets and land acquisition projects are required to
purchase the land in which to build the expansion assets.
The summary of expansion capital expenditure per project type required to realise this ten-year plan is shown in
Table 7.2. The total expenditure is expected to be approximately of R 171 billion, this is approximately R 5 billion higher
than the previous ten-year plan. The main reasons for this variance are as follows:
• A provision was added covering the 2021 (a new year in the planning window) year list of projects.
• Project cost escalations due to re-phasing.
• The net effect of new projects added and existing projects deferred.

Transmission Ten-Year Plan 2012-2021 56
Table 7.2: Capital expenditure per project type
Please note that the amounts in the tables represents cash flows in the Ten-year plan periods, any cash flows not falling within
this period have not been added, consequently the total cost of the plan may be higher than reflected here.
The details of costing per Grid and Project type are shown in Appendix B. For purposes of confidentiality the planned
or exact costs per project of Customer Projects have been excluded from the table, however the total sum of all
customer projects are indicated in Table 7.2 above.
Type Total R’mil
Customer 3,647
Generation 26,734
Reliability 140,507
Grand Total 170,888
The most visible difference between this TDP and the previous year’s TDP is the reduction in the amount of
Transmission line by approximately 3 800-km. This is mainly due to the deferment of the coal and nuclear projects
linked to the TDP Generation Assumptions made. The Cape Corridor projects have also been deferred to beyond
the TDP period.
The other difference between this TDP and the previous year’s TDP is the phasing and spread of the projects over the
planning period. There has been a re-phasing of the existing projects (55% of the total number of projects), using more
realistic completion dates based on execution time-lines.
A number of additional projects have been included in the later part of the planning period, mainly due to new
existing substation transformer expansion linked to the assumptions made about solar and wind generation. New
substations have been included, mainly owing to a better positioning of loads resulting from the spatial load-forecasting
techniques applied.
The result is an improved and more realistic or achievable spread of the transmission line projects and transformer
installations. The slower rate of completion of the transmission lines and new transformers increases the overall risk to
the network. However this risk can be managed as the N-1 unfirm refers to the strict deterministic level which assumes
that the N-1 event will happen at the time of the loading peak. In reality there is a limited chance of this happening and
operational mitigation plans will cater for most of the events until the required projects have been completed. Some of
the risk mitigation measures under consideration include higher reliance on the following: utilisation of strategic spares,
the use of capacitors in the short term for voltage support, as well as Emergency Preparedness Plans.
8. Concluding Remarks

© Eskom 2011 57
The economic slowdown as well as efforts to promote demand side management through the use of solar geysers
and compact fluorescent lamps, and by encouraging saving of electricity has greatly assisted in reducing major supply
constraints. The economy is, however, showing signs of a recovery, and there should be a return to pre-recession
demand levels and forecasts soon. Hence we believe it will be necessary to proceed with the planned infrastructure
development.
This Ten-Year Plan has many similarities with the previous one as far as projects are concerned. At the end of the
period of this Ten-Year Plan, it is expected that the transmission network will be fully compliant to the reliability
requirements of the Grid Code that were amended in 2008.
Robust and efficient planning requires the timely exchange of credible information between stakeholders. In particular,
stakeholders are requested to note that spatial data and information are critical for the effective planning and
development of the transmission network.
Transmission infrastructure could easily become the critical path in connecting and integrating large new loads and
generation, due to the long lead times for securing corridors. We recommend that for planning purposes, developers
should allow for at least 7 years’ lead time for new corridors. It should also be noted that in the EIA process, there
are increasing objections from llandowner’s and other stakeholders to proposed power line routes, which may further
prolong the time to implement projects.
Research and feasibility studies are required on HVDC technology to ensure its availability for major corridors for the
coastal nuclear or Waterberg coal scenarios. In addition, the recycling of certain transmission networks (especially 275
kV to 400 kV) in Gauteng and KwaZulu-Natal will be needed in the long term.
The conclusion is that the transmission projects in this TDP will result in the overall network becoming Grid Code
compliant while catering for increased load growth and the integration of new generation. The system will be running
at risk in some areas, and careful operational mitigation planning will have to be undertaken until the transmission
projects and new generation are in place.
The estimated rand value of the planned projects is approximately R171 billion in the next ten years, of which
approximately R 4 billion is for customer related projects; R27 billion for generation integration projects, and
approximately R140 billion is related to reliability projects.

Transmission Ten-Year Plan 2012-2021 58
Appendix A: Generation Assumptions
Gen
erat
ion
Plan
t use
d fo
r th
e TD
P st
udie
s

© Eskom 2011 59
Appendix B: Costing Details
Type Total R’mil
Customer 3,647
Generation 26,734
Reliability 140,507
Grand Total 170,888
APPENDIX B1: COSTING PER PROJECT TYPE
APPENDIX B2A: COSTING FOR CENTRAL GRID PROJECTS
Please note that the amounts in the tables represents cash flows in the Ten-year plan periods, any cash flows not falling within this period have not been added, consequently the total cost of the plan may be higher than reflected here.
Please note that the amounts in the tables represent cash flows as a total scheme cost that may fall outside of the Ten-year plan periods
Grid Project Cost R’ mil Grid Total
Central
Benburg Ext 3rd 250MVA 275/132kV
Croydon Ext 3rd 250MVA 275/132kV transformer
Demeter 400kV Integration
Eiger Ext 3rd 80MVA 88/33kV transformer
Johannesburg Reactive Power Project
Johannesburg East Strengthening - Phase 1
Johannesburg East Strengthening - Phase 2
Johannesburg East Strengthening- Phase 3 A-D
Johannesburg East Strengthening - Phase 3 E-F
Johannesburg North - Phase 2a
Johannesburg North - Phase 2b
Johannesburg Strengthening
Kookfontein Phase 1
Kookfontein Phase 2
Kyalami Integration
Simmerpan 275/132kV substation
Simmerpan 275/88kV substation
Snowdon transformer upgrade
Vaal Strengthening Phase 1: Glockner 400/275kV Trfr
& Hera-Bernina
Vaal Strengthening Phase 2
Soweto Strengthening Phase 2 - 275/132kV
West Rand Strengthening - Phase: Westgate B and
Taunus 400kV
Soweto Strengthening Phase 1 - 275kV
145
144
1,115
30
45
460
615
1,900
1,928
208
83
2,337
15
125
1,770
396
497
110
500
317
563
1,701
616
15,620

Transmission Ten-Year Plan 2012-2021 60
Please note that the amounts in the tables represent cash flows as a total scheme cost that may fall outside of the Ten-year plan periods.
APPENDIX B2B: COSTING FOR EAST GRID PROJECTS
Grid Project Cost R’ mil Grid Total
Eastern
Ariadne-Venus 2nd 400kV Line
Assmang MTS
Avon Ext 3rd 250MVA 275/132kV transformer
Invubu Ext 1st and 2nd 500MVA 400/132kV transformers
Empangeni Strengthening - Phase 1
Empangeni Strengthening - Phase 2
Empangeni Strengthening - Phase 4
Eros Reinforcement - Ariadne-Eros 400kV
Eros Reinforcement - Eros 2nd transformer
Hector Ext 3rd 800MVA 400/275kV transformer
Hector Ext 4th 800MVA 400/275kV transformer
Incandu Ext 3rd 315MVA 400/132kV transformer
Klaarwater Reinforcement - Phase 1
Klaarwater Reinforcement - Phase 2
KZN 765kV Integration
Ottowa Reinforcement
Pinetown Strengthening - Phase 1
South Coast Strengthening
Pinetown - Empangeni Interconnection
Normandie Ext 2nd 250MVA 400/132kV transformer
Mersey Ext 3rd 250MVA 275/132kV transformer
Ingula Pumped Storage P/S Intergation
1,021
400
117
1,120
1,271
1,706
4,912
1,456
168
141
198
185
47
344
4,777
158
4,410
948
2,105
129
116
1,271
26,999

© Eskom 2011 61
* Total Cost for projects across CLNs
**A cost of R1.7bil for all Wind Assumed Projects, is additional
Please note that the amounts in the tables represent cash flows as a total scheme cost that may fall outside of the
Ten-year plan periods.
APPENDIX B2C: COSTING FOR WEST GRID PROJECTS
Grid Project Cost R’ mil Grid Total
Western
Cape Corridor Phase 2: Gamma-Omega 765kV Intergation
Cape Corridor Phase 2: Kappa 765kV Integration
Cape Corridor Phase 4: 2nd Zeus-Per-Gam-Ome 765kV line*
Droerivier-Proteus 2nd 400kV line
Firgrove Substation Establishment (2x 500MVA 400/132kV
TRFR’s)
Gas 1 off-site relocation to Ankerlig
Mitchells Plain 400kV Substation
Muldersvlei Ext 3rd 500MVA 400/132kV transformer &
132kV Series Reactors
N Cape reinforcement: Ageneies-Paulputs 2nd 220kV
N Cape reinforcement: Aggeneies-Helios 1st 400kV
N Cape reinforcement: Aggeneis-Oranjemund 2nd 220kV
N Cape reinforcement: Aries SVC
N Cape reinforcement: Ferrum-Garona-Nieuwehoop 400kV
Paulputs Ext 2nd 125MVA 220/132kV transformer
Howhoek Substation Establishment (2x 500MVA 400/132/kV
TRFR’s)
Blanco Substation Establishment (2x 500MVA 400/132/kV
TRFR’s)
Juno Wind Phase 1
Aurora Wind Phase 1
Aurora Wind Phase 2
Droerivier Wind Phase 1
Droerivier Wind Phase 3
Bacchus Wind Phase 1
Bacchus Wind Phase 2
Kappa Wind Phase 1
Droerivier Wind Phase 2
Juno Wind Phase 2
Gromis Wind Phase 1
Nama Wind Phase 1
Philippi Ext 3rd 500MVA 400/132kV transformer
5,525
1,200
20,873
1,383
378
471
1,147
153
508
1,176
1,415
463
1,714
74
571
571
0**
0**
0**
0**
0**
0**
0**
0**
0**
0**
0**
0**
101
37,723

Transmission Ten-Year Plan 2012-2021 62
APPENDIX B2D: COSTING FOR SOUTH GRID PROJECTS
* Cost Included in the Cape Corridor Phase 2: Gamma-Omega 765kV Integration (Western Grid)
** Cost included in Greater East London Strengthening - Phase 1: Eros-Vuyani & SS
***Although Nuclear 1 is required in 2022, most of the projcet will have to be done in this TDP window and is hence shown
****A cost of R1bil for all Wind Assumed Projects, is additional
*****Costing for the project is not complete
Please note that the amounts in the tables represent cash flows as a total scheme cost that may fall outside of the
Ten-year plan periods
Grid Project Cost R’ mil Grid Total
Southern
Cape Corridor Phase 2: Gamma-Omega 765kV Integration
Grassridge Ext 3rd 400/132kV 500MVA transformation
Greater East London Strengthening - Phase 1: Eros-Vuyani & SS
Greater East London Strengthening - Phase 2: Neptune-
Vuyani & SS
Greater East London Strengthening - Phase 3
Nuclear 1 Integration***
PE Phase 3: Poseidon, Delphi, Grassridge and Dedisa Shunt
compensation
PE Phase 4: Poseidon, Delphi, Grassridge and Dedisa Shunt
compensation
Port Elizabeth substation integration - Phase 1
Southern Grid - Phase 3 : 1st Gamma Grassridge 765kV Line
Delphi Wind Phase 1
Delphi Wind Phase 2
Grassridge Wind Phase 1
Hydra Wind Phase 1
Grassridge Wind Phase 2
Grassridge Wind Phase 3
Poseidon Wind Phase 1
Poseidon Wind Phase 2
Delphi Wind Phase 2
Hydra Wind Phase 2
Grassridge-Dedisa Strengthening
Gariep Network Strengthening
Delphi 3rd 120MVA 400/132kV transformer
Pembroke 3rd 90MVA 220/66kV transformer (Dual ratio
220/132/66kV)
Hydra 400 & 132kV equipment upgrade (Fault level
requirements)
Grassridge 132kV equipment upgrade (Fault level
requirements)
Southern Grid - Transmission Transformer Normalisation
0*
150
1,550
0**
0**
5,810
127
149
503
4,584
0****
0****
0****
0****
0****
0****
0****
0****
0****
0****
167
20
0*****
0*****
0*****
0*****
81
13,141

© Eskom 2011 63
*Project not costed yet
Please note that the amounts in the tables represent cash flows as a total scheme cost that may fall outside of the Ten-year
plan periods.
Grid Project Cost R’ mil Grid Total
North-East
Alpha Ext 4th 765/400kV transformer
Highveld North-West and Lowveld North Reinforcement -
Phase 1
Highveld South Reinforcement
Kruispunt Reinforcement
Kusile Integration Phase 1 - 4
Lowveld 400kV Strengthening - Phase 1&2: Gumeni
Lowveld 400kV strengthening - Phase 3
Lowveld Transformation Capacity Enhancement
Malelane 275kV Reinforcement - Phase 2
Steelpoort Strengthening Scheme
Tshwane Reinforcement - Phoebus Phase 1 - 3 &
Verwoerdburg Phase 1 - 2
Tshwane Reinforcement - Wildebees Phase
Malelane 275kV Reinforcement - Phase 2
Tubatse Strengthening Scheme Phase 1
Tubatse Strengthening Scheme Phase 2
Highveld North-West and Lowveld North Reinforcement -
Phase 2
Highveld North-West and Lowveld North Reinforcement -
Phase 3
Highveld North-West and Lowveld North Reinforcement -
Phase 4
Lomond MTS transformation upgrade
Highveld North terminal equipment upgrade
Leseding 400kV Reinforcement
611
770
780
42
2,438
1,301
1,349
344
545
750
1,834
125
512
692
231
2,280
142
167
0*
0*
587
15,817
APPENDIX B2E: COSTING FOR NORTH EAST GRID PROJECTS

Transmission Ten-Year Plan 2012-2021 64
Please note that the amounts in the tables represent cash flows as a total scheme cost that may fall outside of the
Ten-year plan periods.
Grid Project Cost R’ mil Grid Total
North-West
Bloemfontien Strengthening
Cape Corridor Phase 2: Zeus-Hydra 765kV Integration
Cape Corridor Phase 3: 765kV Series Capacitors (NOH)
Kimberley 400kV Strengthening Phase 1
Kimberley 400kV Strengthening Phase 2
Kimberley 400kV Strengthening Phase 3
Merapi Wind Phase 1
Upington Strengthening Phase 1
Garona Strengthening
Watershed 275kV Reinforcement
753
8,151
963
28
1,900
3,272
10
4,300
205
200
19,782
APPENDIX B2F: COSTING FOR NORTH WEST GRID PROJECTS

© Eskom 2011 65
* Project not costed as yet
**Costs included in Foskor 275/132kV transformation upgrade
***Costs in Medupi Integration (Alpha) Phase 1A: Spitskop and Dinaledi
Please note that the amounts in the tables represent cash flows as a total scheme cost that may fall outside of the
Ten-year plan periods
Grid Project Cost R’ mil Grid Total
Northern
Acornhoek Upgrade 2x 125MVA 275/132kV transformers
Brits 400kV Reinforcement
Dwaalboom 132kV switching station
Foskor 275/132kV transformation upgrade
Foskor 275kV Reinforcement
Medupi Integration (Alpha) Phase 1A: Spitskop and Dinaledi
Medupi Integration (Charlie) Phase 2A: Ngwedi
Medupi Integration (Charlie) Phase 2B: Borutho
Nzhelele 400kV reinforcement
Pelly 132/22kV transformation upgrade
Rustenburg Transformation Reinforcement
Spitskop 400/132kV Transformation
Tabor and Spencer Reinforcement - Phase 1
Tabor and Spencer Reinforcement - Phase 2
Trident 275/88kV transformation Upgrade
Dinaledi 3rd 500 MVA 400/132kV Transformer
Brits 400kV Reinforcement Medupi Integration (Alpha) Phase 1B: Marang
17
949
45
1,096
0**
11,100
647
647
2,387
28
194
221
185
622
0*
0*
853
0***
18,991
APPENDIX B2G: COSTING FOR NORTH GRID PROJECTS

Transmission Ten-Year Plan 2012-2021 66
Appendix C: Publication Team
Although the publication of the document did not comprise a formal team, the following people were instrumental
in bringing the document to life. Credit is also given to all the Grid Planning staff, who are responsible for formulating
the Strategic Grid Plan as well as the Regional Grid Plans.
Team Members Role
Nishan Rathanlall Compiler 1
Roy Estment Compiler 2
Camille Shah and Nomfi Nomjana Printing and Communications
Juan La Grange Legal/Regulations
This document will be available via the Eskom website (www.eskom.co.za), but should you have any queries please
contact the following people.
Transmission Communications
Camille Shah
Tel: + 27 11 800 4742
Email: [email protected]
Fax: +27 11 800 2336
Grid Planning
Nishan Rathanlall
Tel: 011 800 6879
Email: [email protected]
Fax: +27 11 800 2175
Appendix D: Contact Details

© Eskom 2011 67
Notes

Eskom Transmission Division
Megawatt Park Maxwell Drive Sunninghill Sandton
PO Box 1091 Johannesburg 2000 SA
www.eskom.co.za