Translation of a report and consolidated financial ... · Translation of a report and consolidated...
84
Translation of a report and consolidated financial statements originally issued in Spanish - see note 27 Corporación Lindley S.A. and Subsidiary Consolidated financial statements as of December 31, 2011 and 2010 together with the independent auditors‟ report
Transcript of Translation of a report and consolidated financial ... · Translation of a report and consolidated...

Translation of a report and consolidated financial statements originally issued in Spanish - see note 27
Corporación Lindley S.A. and Subsidiary
Consolidated financial statements as of December 31, 2011 and 2010 together with the independent auditors‟ report
Translation of a report and consolidated financial statements originally issued in Spanish - see note 27
Corporación Lindley S.A. and Subsidiary
Consolidated financial statements as of December 31, 2011 and 2010
together with the independent auditors‟ report
Content
Independent auditors’ report
Consolidated financial statements
Consolidated statement of financial position
Consolidated income statement
Consolidated statement of comprehensive income
Consolidated statement of changes in equity
Consolidated statement of cash flows
Notes to the consolidated financial statements
Translation of a report and consolidated financial statements originally issued in Spanish - see note 27
Independent auditors‟ report
To the shareholders of Corporación Lindley S.A. and Subsidiary
We have audited the accompanying consolidated financial statements of Corporación Lindley S.A.
and its subsidiary (the Group), which comprise the consolidated statement of financial position as at
31 December 2011, 2010 and 1 January 2010, the consolidated income statement, consolidated
statement of comprehensive income, consolidated statement of changes in equity and consolidated
statement of cash flows for the years ended 31 December 2011 and 2010, and a summary of
significant accounting policies and other explanatory information.
Management’s responsibility for the consolidated financial statements
Management is responsible for the preparation and fair presentation of these consolidated financial
statements in accordance with International Financial Reporting Standards, and for such internal
control as management determines is necessary to enable the preparation of consolidated financial
statements that are free from material misstatement, whether due to fraud or error.
Auditors’ responsibility
Our responsibility is to express an opinion on these consolidated financial statements based on our
audit. We conducted our audit in accordance with International Standards on Auditing. Those
standards require that we comply with ethical requirements and plan and perform the audit to
obtain reasonable assurance about whether the financial statements are free from material
misstatement.
An audit involves performing procedures to obtain audit evidence about the amounts and
disclosures in the consolidated financial statements. The procedures selected depend on the
auditors‟ judgment, including the assessment of the risks of material misstatement of the
consolidated financial statements, whether due to fraud or error. In making those risk
assessments, the auditors consider internal control relevant to the entity‟s preparation and fair
presentation of the consolidated financial statements in order to design audit procedures that are
appropriate in the circumstances, but not for the purpose of expressing an opinion on the
effectiveness of the entity‟s internal control. An audit also includes evaluating the appropriateness
of accounting policies used and the reasonableness of accounting estimates made by management,
as well as evaluating the overall presentation of the consolidated financial statements.
Miembro de Ernst & Young Global Inscrita en la partida 11396556 del Registro
de Personas Jurídicas de Lima y Callao

Translation of a report and consolidated financial statements originally issued in Spanish - see note 27
Independent auditors‟ report (continued)
We believe that the audit evidence we have obtained is sufficient and appropriate to provide a basis
for our audit opinion.
Opinion
In our opinion, the consolidated financial statements give a true and fair view of the financial
position of the Group as at 31 December 2011, 2010 and 1 January 2010, and of its financial
performance and cash flows for the years ended 31 December 2011 and 2010 in accordance with
International Financial Reporting Standards.
Lima, Peru,
24 February 2012
Countersigned by:
Manuel Diaz
C.P.C.C. Registration No.19-000996
Translation of a report and consolidated financial statements originally issued in Spanish - see note 27
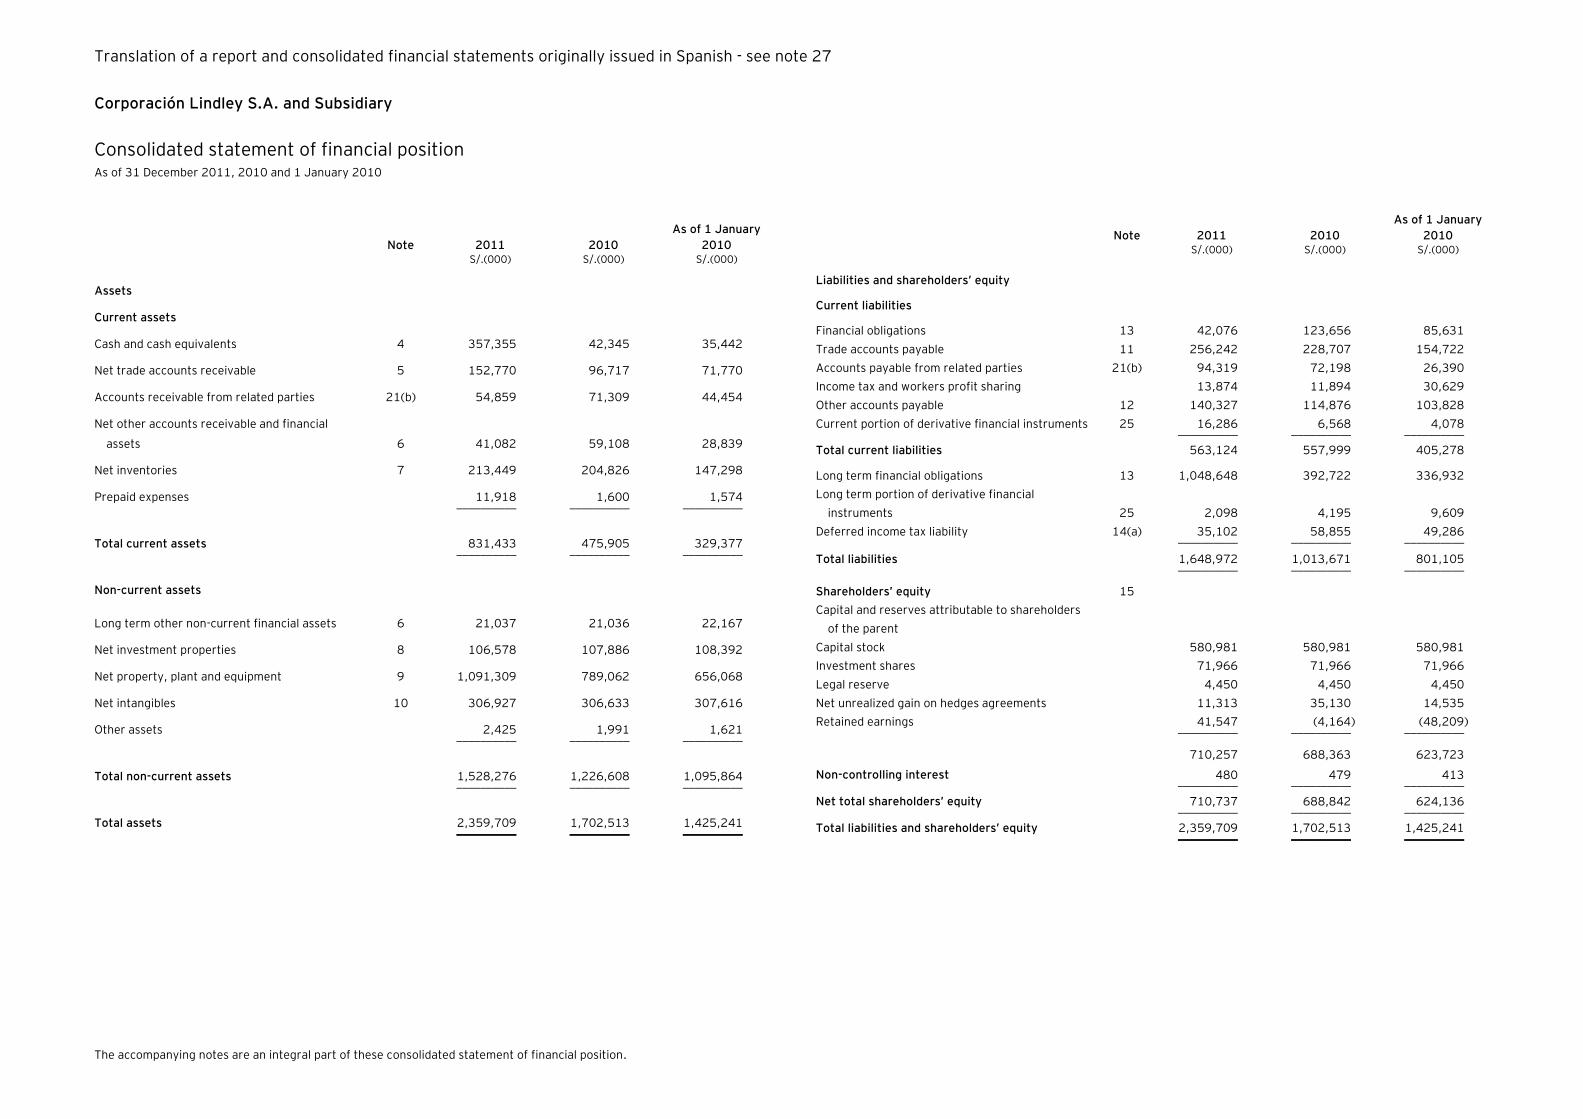
The accompanying notes are an integral part of these consolidated statement of financial position.
Corporación Lindley S.A. and Subsidiary
Consolidated statement of financial position As of 31 December 2011, 2010 and 1 January 2010
Note 2011 2010
As of 1 January
2010 S/.(000) S/.(000) S/.(000)
Assets
Current assets
Cash and cash equivalents 4 357,355 42,345 35,442
Net trade accounts receivable 5 152,770 96,717 71,770
Accounts receivable from related parties 21(b) 54,859 71,309 44,454
Net other accounts receivable and financial
assets 6 41,082 59,108 28,839
Net inventories 7 213,449 204,826 147,298
Prepaid expenses 11,918 1,600 1,574 __________ __________ __________
Total current assets 831,433 475,905 329,377 __________ __________ __________
Non-current assets
Long term other non-current financial assets 6 21,037 21,036 22,167
Net investment properties 8 106,578 107,886 108,392
Net property, plant and equipment 9 1,091,309 789,062 656,068
Net intangibles 10 306,927 306,633 307,616
Other assets 2,425 1,991 1,621 __________ __________ __________
Total non-current assets 1,528,276 1,226,608 1,095,864 __________ __________ __________
Total assets 2,359,709 1,702,513 1,425,241 __________ __________ __________
Note 2011 2010
As of 1 January
2010 S/.(000) S/.(000) S/.(000)
Liabilities and shareholders’ equity
Current liabilities
Financial obligations 13 42,076 123,656 85,631
Trade accounts payable 11 256,242 228,707 154,722
Accounts payable from related parties 21(b) 94,319 72,198 26,390
Income tax and workers profit sharing 13,874 11,894 30,629
Other accounts payable 12 140,327 114,876 103,828
Current portion of derivative financial instruments 25 16,286 6,568 4,078 __________ __________ __________
Total current liabilities 563,124 557,999 405,278
Long term financial obligations 13 1,048,648 392,722 336,932
Long term portion of derivative financial
instruments 25 2,098 4,195 9,609
Deferred income tax liability 14(a) 35,102 58,855 49,286 __________ __________ __________
Total liabilities 1,648,972 1,013,671 801,105 __________ __________ __________
Shareholders’ equity 15
Capital and reserves attributable to shareholders
of the parent
Capital stock 580,981 580,981 580,981
Investment shares 71,966 71,966 71,966
Legal reserve 4,450 4,450 4,450
Net unrealized gain on hedges agreements 11,313 35,130 14,535
Retained earnings 41,547 (4,164) (48,209) __________ __________ __________
710,257 688,363 623,723
Non-controlling interest 480 479 413 __________ __________ __________
Net total shareholders’ equity 710,737 688,842 624,136 __________ __________ __________
Total liabilities and shareholders’ equity 2,359,709 1,702,513 1,425,241 __________ __________ __________

Translation of a report and consolidated financial statements originally issued in Spanish - see note 27
The accompanying notes are an integral part of these consolidated financial statements.
Corporación Lindley S.A. and Subsidiary
Consolidated income statement For the years ended 31 December 2011 and 2010
Note 2011 2010 S/.(000) S/.(000)
Net sales 17 1,767,812 1,538,049
Cost of sales 18 (1,270,652) (1,082,864) __________ __________
Gross profit 497,160 455,185
Selling expenses 18 (302,184) (253,999)
Administrative expenses 18 (65,474) (64,982)
Other operating income 19 66,474 74,815
Other expenses 19 (79,775) (110,408) __________ __________
Operating income 116,201 100,611
Financial income 20 59,919 25,943
Financial expenses 20 (106,834) (59,299)
Net loss from financial instruments 25 (2,352) 2,877 __________ __________
Income before income tax 66,934 70,132
Income tax 14(b) (21,222) (26,021) __________ __________
Net income 45,712 44,111 __________ __________
Attributable to:
Equity shareholders of the parent 45,711 44,045
Non-controlling interests 1 66 __________ __________
45,712 44,111 __________ __________
Earnings per share for net income basic and diluted 23 S/.0.0700 S/.0.0675 __________ __________
Weighted average number of shares outstanding attributable to
equity shareholders (in thousands of shares) 23 652,947 652,947 __________ __________
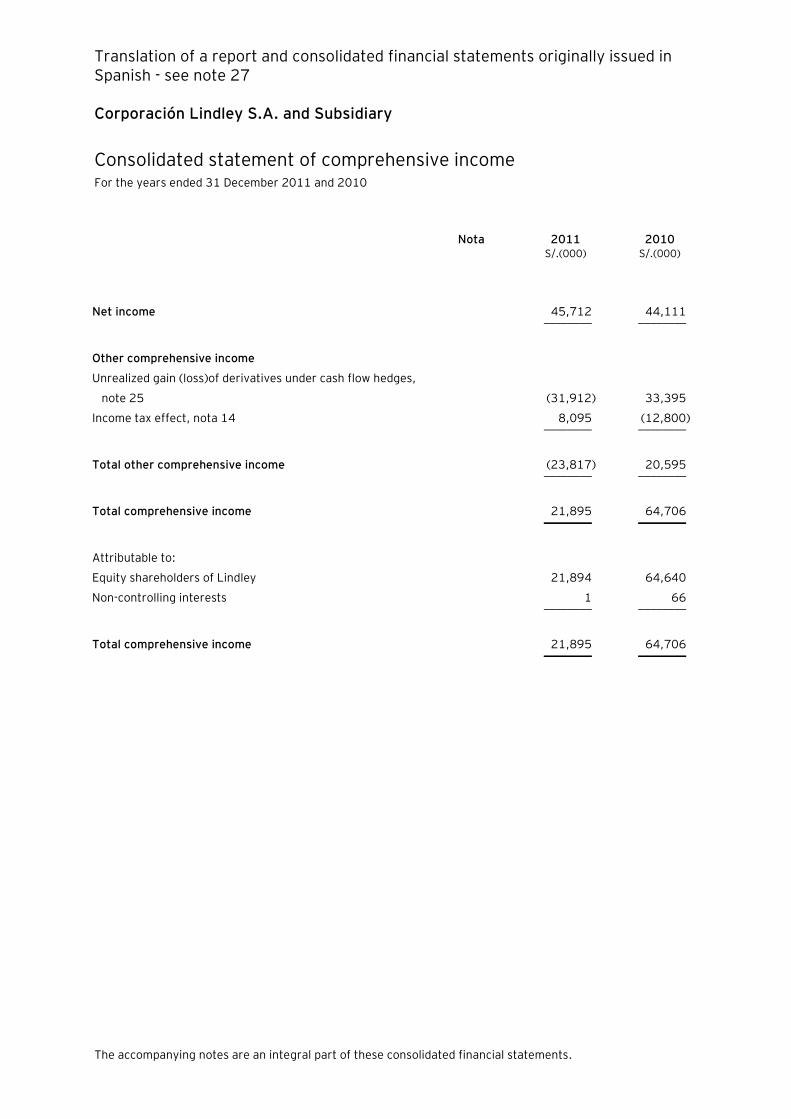
Translation of a report and consolidated financial statements originally issued in Spanish - see note 27
The accompanying notes are an integral part of these consolidated financial statements.
Corporación Lindley S.A. and Subsidiary
Consolidated statement of comprehensive income For the years ended 31 December 2011 and 2010
Nota 2011 2010 S/.(000) S/.(000)
Net income 45,712 44,111 ________ ________
Other comprehensive income
Unrealized gain (loss)of derivatives under cash flow hedges,
note 25 (31,912) 33,395
Income tax effect, nota 14 8,095 (12,800) ________ ________
Total other comprehensive income (23,817) 20,595 ________ ________
Total comprehensive income 21,895 64,706 ________ ________
Attributable to:
Equity shareholders of Lindley 21,894 64,640
Non-controlling interests 1 66 ________ ________
Total comprehensive income 21,895 64,706 ________ ________

Translation of a report and consolidated financial statements originally issued in Spanish - see note 27
The accompanying notes are an integral part of these consolidated financial statements.
Corporación Lindley S.A. and Subsidiary
Consolidated statement of change in equity For the years ended as of 31 December 2011 and 2010
Attributable to owners of the parent ___________________________________________________________________________________________________________
Number of
shares
Capital
stock
Investment
shares Legal reserve
Unrealised
results of
derivatives
cash flows
hedge
Retained
earnings Total
Non-
controlling
interests Total In thousand S/.(000) S/.(000) S/.(000) S/.(000) S/.(000) S/.(000) S/.(000) S/.(000)
As of 1 January 2010 580,981 580,981 71,966 4,450 14,535 (48,209) 623,723 413 624,136
Net income - - - - - 44,045 44,045 66 44,111
Unrealized gain of derivatives under cash flow hedges, net of
income tax effect, note 25 - - - - 20,595 - 20,595 - 20,595 __________ __________ __________ __________ __________ __________ __________ __________ __________
As of 31 December 2010 580,981 580,981 71,966 4,450 35,130 (4,164) 688,363 479 688,842
Net income - - - - - 45,711 45,711 1 45,712
Unrealized loss of derivatives under cash flow hedges, net of
income tax effect, note 25 - - - - (23,817) - (23,817) - (23,817) __________ __________ __________ __________ __________ __________ __________ __________ __________
As of 31 December 2011 580,981 580,981 71,966 4,450 11,313 41,547 710,257 480 710,737 __________ __________ __________ __________ __________ __________ __________ __________ __________

Translation of a report and consolidated financial statements originally issued in Spanish - see note 27
Corporación Lindley S.A. and Subsidiary
Consolidated statement of cash flows For the years ended 31 December 2011 and 2010
2011 2010 S/.(000) S/.(000)
Reconciliation of net income to cash and cash equivalents provided by
operating activities
Net income 45,712 44,111
Plus (less) adjustments to net income of the year:
Depreciation 99,201 79,387
Amortization 938 1,853
Allowance for doubtful accounts 2,619 401
Allowance for obsolescence 228 1,581
Recovery of previous years provisions
Deferred income tax (15,658) (3,231)
Gain from property, plant and equipment sales (2,880) (5,938)
Loss (gain) related to derivative financial instruments 2,352 (2,877)
Various provisions and other 23,333 10,645
Financial expenses 42,311
Financial income (11,561 22,025 _________ _________
186,595 144,909
Debits and credits for net changes in operating current assets and
liabilities
Decrease (increase) in operating assets
Trade accounts receivable (56,053) (24,947)
Accounts receivable from related parties 16,450 (26,855)
Other accounts receivable 18,025 11,757
Inventories (8,623) (57,528)
Prepaid expenses (10,318) (26)
Increase (decrease) in operating liabilities
Trade accounts payable 27,535 73,985
Accounts payable to related parties 22,121 45,808
Other accounts payable 43,464 39,541 __________ __________
239,196 206,644
Interests payments (23,144) (20,244)
Interests collections 2,223 2,440
Income tax payments (23,647) (40,895) __________ __________
Cash and cash equivalents, provided by operating activities 194,628 147,928 __________ __________
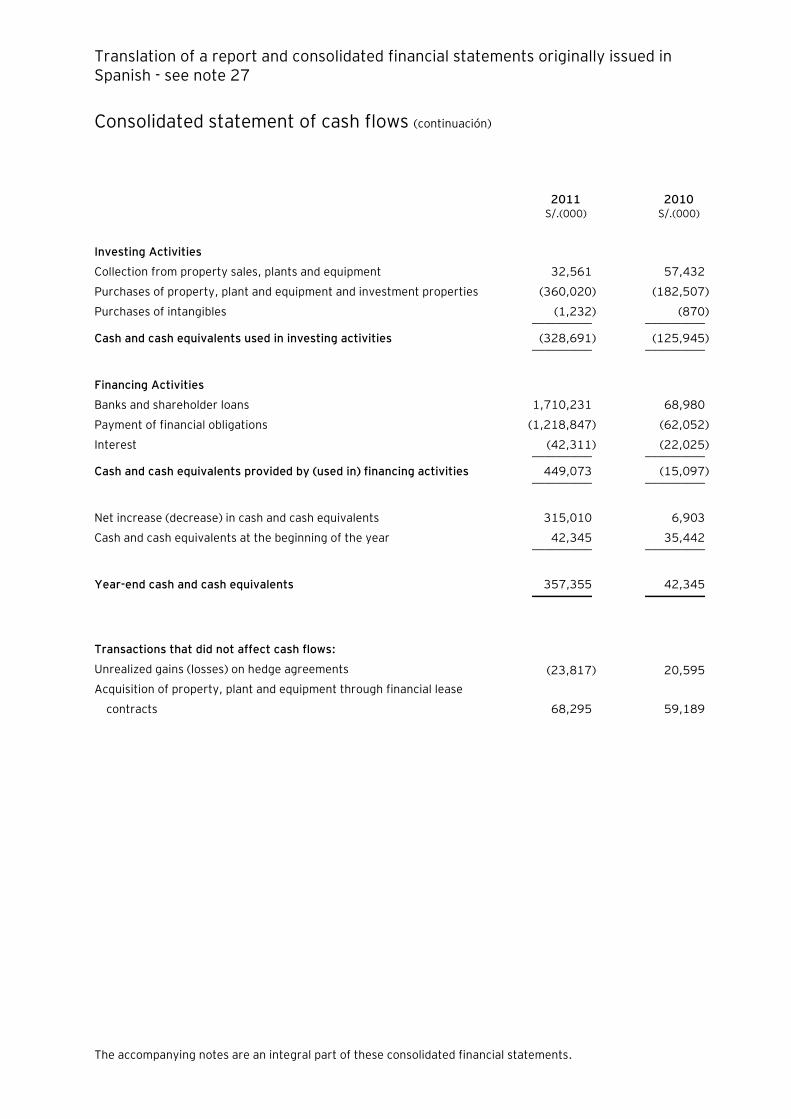
Translation of a report and consolidated financial statements originally issued in Spanish - see note 27
Consolidated statement of cash flows (continuación)
The accompanying notes are an integral part of these consolidated financial statements.
2011 2010 S/.(000) S/.(000)
Investing Activities
Collection from property sales, plants and equipment 32,561 57,432
Purchases of property, plant and equipment and investment properties (360,020) (182,507)
Purchases of intangibles (1,232) (870) __________ __________
Cash and cash equivalents used in investing activities (328,691) (125,945) __________ __________
Financing Activities
Banks and shareholder loans 1,710,231 68,980
Payment of financial obligations (1,218,847) (62,052)
Interest (42,311) (22,025) __________ __________
Cash and cash equivalents provided by (used in) financing activities 449,073 (15,097) __________ __________
Net increase (decrease) in cash and cash equivalents 315,010 6,903
Cash and cash equivalents at the beginning of the year 42,345 35,442 __________ __________
Year-end cash and cash equivalents 357,355 42,345 __________ __________
Transactions that did not affect cash flows:
Unrealized gains (losses) on hedge agreements (23,817) 20,595
Acquisition of property, plant and equipment through financial lease
contracts 68,295 59,189

Corporación Lindley S.A. and Subsidiary
Notes to the consolidated financial statements As of 31 December 2011 and 2010
1. Identification and economic activity
(a) Identification -
Corporación Lindley S.A. (formerly Corporación José R. Lindley S.A., hereinafter “the Company”
or “Lindley”) is a Peruvian public company formed on the basis of Fábrica de Aguas Gaseosas La
Santa Rosa, a company incorporated in 1910 that would become José R. Lindley e Hijos S.A. in
November 1928. Subsequently, on February 22, 1960, it was incorporated Inmobiliaria Lintab
S.A. which absorbed José R. Lindley e Hijos S.A. and other related companies through a
reorganization process. In April 1997, Inmobiliaria Lintab S.A. changed its name to Corporación
José R. Lindley S.A. until June 15, 2010, and after that changed to the actual name. The main
four shareholders of the Company are members of the Lindley family, who hold 59.66 percent of
the Company‟s representative shares and Perú Beverage Limitada S.R.L., a subsidiary of The
Coca-Cola Company, which owns 38.52 percent of capital of the Company at September 30,
2011 and December 31, 2010.
The Company‟s legal address domicile is Jr.Cajamarca No. 371, Rímac, Lima.
The consolidated financial statements as of December 31, 2011 and for the year then ended
include the financial statements of Lindley and its subsidiary Embotelladora La Selva S.A.
(hereinafter "ELSSA" or "Subsidiary") in which Lindley has control and an equity interest of
93.20 percent (together hereinafter called "the Group"). ELSSA is a Peruvian public company
that has the same economic activity as the Company and was incorporated on June 23, 1967.
The accompanying consolidated financial statements as of December 31, 2011 have been
approved by Group‟s Management on 24 February 2012 to be issue.
(b) Economic activity -
The Group's primary activity is the production, bottling, distribution and sale of soft drinks,
carbonated water, and fruit pulps and nectars used certain trademarks owned by related parties
through franchise agreements, such as Corporación Inca Kola Perú S.R.L, Schweppes Holdings
Limited and The Coca-Cola Company. All those related parties have contracts in force until April
2015 and expected to be renewed at maturity.
The Company consolidated the bottling systems of the Coca Cola and Inca Kola products in Peru
based on a process of mergers and acquisitions made in previous years with the bottler of The
Coca Cola Company brands in southern Peru, Lima and Trujillo, and with Embotelladora Piura
S.A. Then the Company ensured the strengthening of these brands in the Peruvian market and
achieved a superior market structure.
Translation of a report and consolidated financial statements originally issued in Spanish - see note 27
Notes to the consolidated financial statements (continued)
2
The Company registered a 10 percent or 22 million unit sales-volume increases for the year
ending December 31, 2010 and a 4 percent or 9 million unit increases for the year ending
December 31, 2009. (Unaudited).
The Group has increased its share in the market for Peruvian soft drinks, despite the extremely
competitive nature, largely through increased sales of the Company‟s leading brands, "Inca Kola"
and "Coca Cola". The Group primarily sells its products to distributors located in Lima and cities
in Peru‟s interior.
The Company also operates in the Eastern region of the country through its subsidiary,
Embotelladora La Selva S.A.
On 23 November 2011, the Company entered a international bonds issuing under rule
144A/Regulation S of the Stock Exchange Market Law of the United States of America for a total
amount of US$320,000,000 to an interest rate of 6.75% due on 23 November 2021. The
obtained funds related to this issuing were used to restructure its liabilities and finance its
inversion plan. See note 13.
2. Basis of consolidation, preparation and presentation, principles and accounting policies
2.1.1 Basis of preparation and presentation –
The accompanying consolidated financial statements have been prepared in accordance with
International Financial Reporting Standards (hereinafter "IFRS"), in forces as of December 31,
2011.
The financial statements have been prepared under the historical cost basis, except for derivative
financial instruments which are measured at fair value, based on the accounting records kept by
the Company. The financial statements are presented in nuevos soles and all amounts are
rounded to thousands (S/.(000)), unless otherwise indicated.
2.1.2 Basis of consolidation -
The consolidated financial statements comprise the financial statements of the Group as of
December 31, 2011, 2010 and as of January 1, 2010
Subsidiary is fully consolidated from the date of acquisition, being the date on which the Group
obtains control, and continue to be consolidated until the date when such control ceases.
The financial statements of the subsidiary are prepared for the same reporting period as the
parent company, using consistent accounting policies.
All intra-group balances, transactions, unrealised gains and losses resulting from intra-group
transactions and dividends are eliminated in full.

Translation of a report and consolidated financial statements originally issued in Spanish - see note 27
Notes to the consolidated financial statements (continued)
3
Where the ownership of a subsidiary is less than 100%, and therefore a non-controlling interest
exists, any losses of that subsidiary are attributed to the non-controlling interest even if that
results in a deficit balance.
A change in the ownership interest of a subsidiary, without a loss of control, is accounted for as
an equity transaction. If the Group loses control over a subsidiary, it:
- Derecognises the assets (including goodwill) and liabilities of the subsidiary
- Derecognises the carrying amount of any non-controlling interest
- Derecognises the cumulative translation differences, recognised in equity
- Recognises the fair value of the consideration received.
- Recognises the fair value of any investment retained
- Recognises any surplus of deficit in profit or loss
- Reclassifies the parent´s share of components previously recognised in other
comprehensive income to profit or loss or retained earnings, as appropriate.
The note 2.5 includes information about the significant accounting judgments, estimates and
assumptions used by Group‟s Management for the preparation of these accompanying
consolidated financial statements.
2.2. Summary of significant accounting policies
Below the significant accounting policies used by Group‟s Management for the preparation of
consolidated financial statements are shown:
(a) Cash and cash equivalents -
Cash and short-term deposits in the consolidated statement of financial position comprise
cash at banks and on hand and short-term deposits with a maturity of three months or less.
For the purpose of the consolidated statement cash flows, cash and cash equivalents consist
of cash and short-term deposits as defined above, net of outstanding bank overdrafts.
(b) Financial instruments: Initial recognition and subsequent measurement -
(i) Financial assets –
Initial recognition and measurement –
Financial assets within scope of International accounting standard (IAS) 39
“Financial instruments: Recognition and measurement” are classified as financial
assets at fair value through profit or loss, loans and receivables, held-to-maturity
investments, available-for-sale financial assets, or as derivatives designated as
hedging instruments in an effective hedge, as appropriate. The Group determines
the classification of its financial assets at initial recognition.
All financial assets are recognised initially at fair value plus, in the case of assets
not at fair value through profit or loss, directly attributable transaction costs.
Purchases or sales of financial assets that require delivery of assets within a time

Translation of a report and consolidated financial statements originally issued in Spanish - see note 27
Notes to the consolidated financial statements (continued)
4
frame established by regulation or convention in the marketplace (regular way
trades) are recognised on the trade date, i.e., the date that the Group commits to
purchase or sell the asset.
Subsequent measurement -
The subsequent measurement of financial assets depends on their classification as
follows:
Financial assets at fair value through profit or loss -
Financial assets at fair value through profit or loss include financial assets held for
trading and financial assets designated upon initial recognition at fair value through
profit or loss. Financial assets are classified as held for trading if they are acquired
for the purpose of selling or repurchasing in the near term.
This category includes derivative financial instruments entered into by the Group
that are not designated as hedging instruments in hedge relationships as defined
by IAS 39.
Financial assets at fair value through profit and loss are carried in the consolidated
statement of financial position at fair value with changes in fair value recognised in
finance income or finance costs in the consolidated income statement.
As of 31 December 2011, 2010 and 1 January 2010, the Company maintained
derivative financial instruments (cross currency swap and interest rate swaps)
designed as for trading classified as financial liabilities at fair value with changes in
fair value recognised in the consolidated income statement, see note 25.
Loans and receivables -
Loans and receivables are non-derivative financial assets with fixed or
determinable payments that are not quoted in an active market. After initial
measurement, such financial assets are subsequently measured at amortized cost
using the effective interest rate method (EIR), less impairment. Amortized cost is
calculated by taking into account any discount or premium on acquisition and fees
or costs that are an integral part of the EIR. The EIR amortization is included in
finance income in the consolidated income statement. The losses arising from
impairment are recognised in the consolidated income statement in finance costs.
Translation of a report and consolidated financial statements originally issued in Spanish - see note 27
Notes to the consolidated financial statements (continued)
5
Held-to-maturity investments -
Non-derivative financial assets with fixed or determinable payments and fixed
maturities are classified as held-to-maturity when the Group has the positive
intention and ability to hold them to maturity. After initial measurement, held-to-
maturity investments are measured at amortized cost using the effective interest
method, less impairment. Amortized cost is calculated by taking into account any
discount or premium on acquisition and fees or costs that are an integral part of
the EIR. The EIR amortization is included in finance income in the consolidated
income statement. The losses arising from impairment are recognised in the
consolidated income statement in finance costs.
The Group did not have any held-to-maturity investments as of 31 December 2011,
2010 and 1 January 2010.
Available for sale financial investments -
Available-for-sale financial investments are those, which are intended to be held for
an indefinite period of time and which may be sold in response to needs for liquidity
or in response to changes in the interest rate, exchange rate or market conditions,
or neither classified as held for trading nor designated at fair value through profit
or loss.
After initial measurement, available-for-sale financial investments are subsequently
measured at fair value. The unrealised gains or losses are recognised directly in the
consolidated statement of changes in equity. When the financial investment is sold
the cumulative gain or loss previously recognised in consolidated statement of
changes in equity, is recognised in consolidate income statement in finance costs
or income.
The gained dividends during the period when the investment was held are
recognised in the consolidated statement of income when the payment right has
been established. .
As of 31 December 2011, 2010 y as of 1 January 2010, the Group has not
maintained investments in this category.
Translation of a report and consolidated financial statements originally issued in Spanish - see note 27
Notes to the consolidated financial statements (continued)
6
Derecognition
A financial asset (or, where applicable a part of a financial asset or part of a group
of similar financial assets) is derecognised when:
-
-
has assumed an obligation to pay the received cash flows in full without
material delay to a third party under a „pass-through‟ arrangement; and
either (a) the Group has transferred substantially all the risks and rewards of
the asset, or (b) the Group has neither transferred nor retained substantially
all the risks and rewards of the asset, but has transferred control of the
asset.
When the Group has transferred its rights to receive cash flows from an asset or
has entered into a pass-through arrangement, and has neither transferred nor
retained substantially all of the risks and rewards of the asset nor transferred
control of it, the asset is recognised to the extent of the Group‟s continuing
involvement in it. In that case, the Group also recognises an associated liability.
The transferred asset and the associated liability are measured on a basis that
reflects the rights and obligations that the Group has retained.
(ii) Impairment of financial assets -
The Group assesses at each reporting date whether there is any objective evidence
that a financial asset or a group of financial assets is impaired. A financial asset or
a group of financial assets is deemed to be impaired if, and only if, there is
objective evidence of impairment as a result of one or more events that has
occurred after the initial recognition of the asset (an incurred „loss event‟) and that
loss event has an impact on the estimated future cash flows of the financial asset
or the group of financial assets that can be reliably estimated. Evidence of
impairment may include indications that the debtors or a group of debtors is
experiencing significant financial difficulty, default or delinquency in interest or
principal payments, the probability that they will enter bankruptcy or other
financial reorganisation and where observable data indicate that there is a
measurable decrease in the estimated future cash flows, such as changes in arrears
or economic conditions that correlate with defaults.

Translation of a report and consolidated financial statements originally issued in Spanish - see note 27
Notes to the consolidated financial statements (continued)
7
Financial assets carried at amortized cost -
For financial assets carried at amortized cost, the Group first assesses whether
objective evidence of impairment exists individually for financial assets that are
individually significant, or collectively for financial assets that are not individually
significant. If the Group determines that no objective evidence of impairment exists
for an individually assessed financial asset, whether significant or not, it includes
the asset in a group of financial assets with similar credit risk characteristics and
collectively assesses them for impairment. Assets that are individually assessed for
impairment and for which an impairment loss is, or continues to be, recognised are
not included in a collective assessment of impairment.
If there is objective evidence that an impairment loss has been incurred, the
amount of the loss is measured as the difference between the assets carrying
amount and the present value of estimated future cash flows (excluding future
expected credit losses that have not yet been incurred). The present value of the
estimated future cash flows is discounted at the financial asset‟s original effective
interest rate. If a loan has a variable interest rate, the discount rate for measuring
any impairment loss is the current effective interest rate.
The carrying amount of the asset is reduced through the use of an allowance
account and the amount of the loss is recognised in the consolidated income
statement. Interest income continues to be accrued on the reduced carrying
amount and is accrued using the rate of interest used to discount the future cash
flows for the purpose of measuring the impairment loss.
The interest income is recorded as part of finance income in the consolidated
income statement. Loans together with the associated allowance are written off
when there is no realistic prospect of future recovery and all collateral has been
realised or has been transferred to the Group. If, in a subsequent year, the amount
of the estimated impairment loss increases or decreases because of an event
occurring after the impairment was recognised, the previously recognised
impairment loss is increased or reduced by adjusting the allowance account. If a
future write-off is later recovered, the recovery is credited to finance costs in the
consolidated income statement.
(iii) Financial liabilities –
Initial recognition and measurement -
Financial liabilities within the scope of IAS 39 are classified as financial liabilities at
fair value through profit or loss, loans and borrowings, or as derivatives designated
as hedging instruments in an effective hedge, as appropriate. The Group
determines the classification of its financial liabilities at initial recognition.

Translation of a report and consolidated financial statements originally issued in Spanish - see note 27
Notes to the consolidated financial statements (continued)
8
All financial liabilities are recognised initially at fair value and, in the case of loans
and borrowings, carried at amortized cost. This includes directly attributable
transaction costs.
As of 31 December 2011, 2010 and 1 January 2010 the Group‟s financial
liabilities include trade and other payables, accounts payable to related parties
financial obligations, and derivative financial instruments.
Financial liabilities are classified as short term obligations at less the Group has
irrevocable right to deferred the agreement for twelve months more after the
consolidated statement of financial position.
Subsequent measurement –
The measurement of financial liabilities depends on their classification as follows:
Financial liabilities at fair value through profit or loss -
Financial liabilities at fair value through profit or loss include financial liabilities held
for trading and financial liabilities designated upon initial recognition as at fair
value through profit or loss.
Financial liabilities are classified as held for trading if they are acquired for the
purpose of selling in the near term. This category includes derivative financial
instruments entered into by the Group that are not designated as hedging
instruments in hedge relationships as defined by IAS 39. Separated embedded
derivatives are also classified as held for trading unless they are designated as
effective hedging instruments.
Gains or losses on liabilities held for trading are recognised in the income
statement.
Loans and borrowings -
After initial recognition, interest bearing loans and borrowings are subsequently
measured at amortized cost using the effective interest rate method. Gains and
losses are recognised in the consolidated income statement when the liabilities are
derecognised as well as through the effective interest rate method (EIR)
amortization process. Amortized cost is calculated by taking into account any
discount or premium on acquisition and fees or costs that are an integral part of
the EIR. The EIR amortization is included in finance costs in the consolidated
income statement.

Translation of a report and consolidated financial statements originally issued in Spanish - see note 27
Notes to the consolidated financial statements (continued)
9
Derecognition -
A financial liability is derecognised when the obligation under the liability is
discharged or cancelled or expires. When an existing financial liability is replaced by
another from the same lender on substantially different terms, or the terms of an
existing liability are substantially modified, such an exchange or modification is
treated as a derecognition of the original liability and the recognition of a new
liability, and the difference in the respective carrying amounts is recognised in the
consolidated income statement.
(iv) Offsetting of financial instruments -
Financial assets and financial liabilities are offset and the net amount reported in
the consolidated statement of financial position if, and only if, there is a currently
enforceable legal right to offset the recognised amounts and there is an intention
to settle on a net basis, or to realise the assets and settle the liabilities
simultaneously.
(v) Fair value of financial instruments -
The fair value of financial instruments that are traded in active markets at each
reporting date is determined by reference to quoted market prices or dealer price
quotations (bid price for long positions and ask price for short positions), without
any deduction for transaction costs. For financial instruments not traded in an
active market, the fair value is determined using appropriate valuation techniques.
Such techniques may include using recent arm‟s length market transactions;
reference to the current fair value of another instrument that is substantially the
same; a discounted cash flow analysis or other valuation models.
An analysis of fair values of financial instruments and further details as to how they
are measured are provided in Note 22.
Derivative financial instruments -
Derivative financial instruments as defined by IAS 39, are classified as for trade
and hedge. The most relevant aspects of each category are described as follows:
Trade -
Derivative financial instruments for trade are initially recognised at historical cost
in the consolidated statement of financial position and subsequently at their fair
value. The fair value are obtained basis on the exchange rate and market interest
rate. Any gain or losses in the fair value are recorded in the consolidated income
statement.

Translation of a report and consolidated financial statements originally issued in Spanish - see note 27
Notes to the consolidated financial statements (continued)
10
The derivative financial instruments maintained by the Company as “Cross
Currency Interest Rate Swap” and “Interest Rate Swaps”, do not qualify for hedge
accounting in accordance to specific rules of IAS 39, for that reason are treated as
derivative financial instruments for trade.
Hedge -
Hedge accounting in accordance to IAS 39 is applied with the objective to manage
particular risks for the transactions that accomplish with specific criteria for that.
The derivative financial instruments are initially recognised at fair value on the date
on which a derivate contract is entered and are subsequently remeasurement to
the consolidated financial statements date. Any gains or losses arising from
changes in the fair value of derivatives are taken directly to the consolidated
statement of income, except for the effective portion of cash flow hedges, which is
recognised in other comprehensive income.
For the purpose of hedge accounting, hedges are classified as:
- Fair value hedges when hedging the exposure to changes in the fair value of
a recognised asset or liability or an unrecognised firm commitment (except
for foreign currency risk) or a portion of these assets, liabilities or firm
commitment attributable to a particular risk which could affect the
consolidated statement of income; or
-
either (i) attributable to a particular risk associated with a recognised asset
or liability (total or some future interest payments on variable rate debt) or
a highly probable forecast transaction which could affect the consolidated
income statement.
At the inception of a hedge relationship, the Group formally designates and
documents the hedge relationship to which the Group wishes to apply hedge
accounting and the risk management objective and strategy for undertaking the
hedge. The documentation includes identification of the hedging instrument, the
hedged item or transaction, the nature of the risk being hedged and how the entity
will assess the effectiveness of changes in the hedging instrument‟s fair value in
offsetting the exposure to changes in the hedged item‟s fair value or cash flows
attributable to the hedged risk. Such hedges are expected to be highly effective in
achieving offsetting changes in fair value or cash flows and are assessed on an
ongoing basis to determine that they actually have been highly effective
throughout the financial reporting periods for which they were designated.

Translation of a report and consolidated financial statements originally issued in Spanish - see note 27
Notes to the consolidated financial statements (continued)
11
Hedges that meet the specified criteria for hedge accounting are accounted for as
follows:
Fair value hedges –
Changes in the fair value of the hedged item attributable to the hedged risk are
adjusted to the carrying value of the hedged item and are recognized in the
consolidated statement of income.
For fair value hedges relating to items carried at amortized cost, the adjustment to
the carrying amount is amortized against the results of the year according to the
maturity of the hedged items. Amortization may begin as soon as they make the
adjustment and must begin no later than the hedged item ceases to be adjusted for
changes in fair value attributable to the risk being covered.
If the hedged item is derecognised, the unamortized fair value is recognised
immediately in the consolidated income statement.
When an unrecognized firm commitment is designated as a hedged item, the
subsequent cumulative change in its fair value, that is attributable to the hedged
risk, is recognized as an asset or liability with a corresponding gain or loss
recognized in the consolidated statement of income.
As of December 31, 2011, 2010, and 1 January 2010, the Group has not
maintained hedging instruments at fair value.
Cash flow hedges –
The effective portion of the gain or loss on the hedging derivative instrument is
recognized in the equity and consolidated statement of changes in equity
respectively, and the gain or loss related to the ineffective portion is immediately
recognized in the consolidated statement of income.
The accumulated amounts in equity for cash flows hedging are carried out to the
consolidated statement of income in the periods when the hedge item affects the
profit and loss. In the cases when the finance income or expense is recognized or
when the forecast sale occurs. Where the hedged item is the cost of non-financial
asset or financial liability, the amounts recognized in equity are transferred to the
initial cost of the asset or non-financial liability.

Translation of a report and consolidated financial statements originally issued in Spanish - see note 27
Notes to the consolidated financial statements (continued)
12
If it expects the forecasted transaction or firm commitment does not occur, the
cumulative gain or loss previously recognized in equity is transferred to the
consolidated statement of income. If the hedging instrument expires or is sold, is
terminated or exercised without replacement or rollover, or if its designation as a
hedge is revoked, any cumulative gain or loss previously recognized in equity
remains in equity until the forecasted transaction or firm commitment occurs.
As of December 31, 2011, 2010 and 1 January 2010, the Group decided to hedge
their exposure to risks associated with commodity price volatility by subscribing
futures contracts and prices of sugar swaps. These contracts qualify as hedges
pursuant to IAS 39 (see note 25).
(c) Foreign currency translation -
(i) Functional and presentation currency -
The Group has determinated the nuevo sol as the functional and presentation
currency of its consolidated financial statements.
(ii) Transaction and balances in foreign currency -
Transactions in foreign currency are those carried out in a currency different from
the functional currency. Transactions in foreign currency are initially recorded at
the functional currency using the exchange rates in effect on the transactions.
Monetary assets and liabilities denominated in foreign currencies are
subsequently translated into the functional currency using the exchange rate in
effect as of the consolidated statement of financial position. Any gains or losses
from exchange differences resulting from the settlement of these transactions
and the translation of foreign currency monetary assets and liabilities at the
consolidated statement of financial position date exchange rate are recognized in
the consolidated statement of income.
Non-monetary assets and liabilities are translated into the functional currency at the
actual exchange rate at the transaction date.
(d) Inventories -
Inventories are stated at the lower of average cost or net realizable value.
Costs incurred in bringing each product to its present location and condition are
accounted for as follows:
Goods for sale, raw materials, packaging materials and supplies:
The cost includes the purchase cost using the pondered average method.
Translation of a report and consolidated financial statements originally issued in Spanish - see note 27
Notes to the consolidated financial statements (continued)
13
Finished goods and work in progress:
The cost of the products in process and finished goods includes material costs, labor
expenses and the corresponding distribution of the fixed costs and production overheads
(based on normal operating capacity) and excludes financing cost and exchange
differences.
The purchase cost include the gains and losses transference related to cash flows hedge
recognised in the comprehensive income, associated to the raw material acquisition.
Inventories in transit –
Inventories in transit are stated at purchase cost.
Net realizable value is the sales price obtained in the ordinary course of business, less the
estimated costs of placing the inventories into a ready-for-sale condition and the
commercialization and distribution expenses.
(e) Investment properties -
Investment properties are stated at acquisition cost or equity incorporation, in accordance
to IAS 40 “Investment property”, following the historical cost model. As consequence,
they are treated following the indicated in IAS 16 “Property, plant and equipment”.
Investment properties include land and its respective construction.
The construction have to be depreciated following the straight line method, using an
adequate rate to extinguish the cost at the end of useful live estimated between 40 and
80 years.
Investment properties are derecognised when either they have been disposed of or when
the investment property is permanently withdrawn from use and no future economic
benefit is expected from its disposal. The difference between the net disposal proceeds
and the carrying amount of the asset is recognised in the income statement in the period
of derecognition.
Transfers are made to or from investment property only when there is a change in use.
For a transfer from investment property to owner-occupied property, the deemed cost for
subsequent accounting is the fair value at the date of change. If owner-occupied property
becomes an investment property, the Group accounts for such property in accordance
with the policy stated under property, plant and equipment up to the date of change.
Translation of a report and consolidated financial statements originally issued in Spanish - see note 27
Notes to the consolidated financial statements (continued)
14
(f) Property, plant and equipment -
Property, plant and equipment are stated at cost, net of accumulated depreciation and/or
accumulated impairment losses, if any. Such cost includes the cost of replacing
component parts of the property, plant and equipment and borrowing costs for long-term
construction projects if the recognition criteria are met. When significant parts of
property, plant and equipment are required to be replaced at intervals, the Group
derecognises the replaced part, and recognises the new part with its own associated
useful life and depreciation. Likewise, when a major inspection is performed, its cost is
recognised in the carrying amount of the plant and equipment as a replacement if the
recognition criteria are satisfied. All other repair and maintenance costs are recognised in
the income statement as incurred.
The historical acquisition cost includes purchase price, including non-refundable purchase
taxes and any other expense that are directly attributable to the acquisition of the assets.
Works in progress represent properties and equipments that are under construction and
are recorded at cost. The constructions are not depreciated until the relevant assets are
finished and operative.
An item of property, plant and equipment and any significant part initially recognised is
derecognised upon disposal or when no future economic benefits are expected from its
use or disposal. Any gain or loss arising on derecognition of the asset (calculated as the
difference between the net disposal proceeds and the carrying amount of the asset) is
included in the income statement when the asset is derecognized.
Depreciation is calculated on a straight-line basis over the estimated useful lives of the
assets as follows:
Years
Buildings and other constructions 40 to 80
Machinery and equipment 5 to 50
Furniture and fixtures 4 to 30
Transport units 5 to 33
Bottles and boxes 2.5 and 4
Computer equipment and others 4 to 30
The assets‟ residual values, useful lives and selected depreciation method are reviewed at
each year end and adjusted prospectively if appropriate.

Translation of a report and consolidated financial statements originally issued in Spanish - see note 27
Notes to the consolidated financial statements (continued)
15
Plastic bottles and returnable glass bottles are presented at cost and are classified as
bottles in the item "Net property, plant and equipment.” The depreciation of these is
calculated following the straight-line method, using 2.5 years as useful lives for returnable
plastic bottles, 4 years for returnable glass bottles.
Non-returnable bottles are presented in "Inventories" caption at specific acquisition cost.
(g) Leases -
The determination of whether an arrangement is, or contains, a lease is based on the
substance of the arrangement at the inception date, whether fulfillment of the
arrangement is dependent on the use of a specific asset or assets or the arrangement
conveys a right to use the asset.
Finance leases which transfer to the Group substantially all the risks and benefits
incidental to ownership of the leased item, are capitalised at the commencement of the
lease at the fair value of the leased property or, if lower, at the present value of the
minimum lease payments.
Initial cost are included as part of property, plant and equipment. Lease payments are
apportioned between finance charges and reduction of the lease liability so as to achieve a
constant rate of interest on the remaining balance of the liability. Finance charges are
recognised in finance costs in the consolidated income statement.
The leased assets are depreciated as is explained in the literal (f) above, which is
consistent with the policy that the Group maintains.
Leases in which the Group does not transfer substantially all the risks and benefits of
ownership of the asset are classified as operating leases. Operating lease payments are
recognised as an operating expense in the income statement on a straight-line basis over
the lease term.
(h) Intangible asset -
An intangible asset is recognized to the extent that it is probable that future economic
benefits generated will flow to the Group and its cost can be reliably measured. The
intangibles are presented at cost less accumulated depreciation and, if applicable, the
allowance for impairment of assets has been estimated.
The amortization of assets is calculated following the straight-line method, using the rates
to extinguish the cost of assets at end of estimated useful life up to 5 years for software
licenses and other projects.
The amortization period and the amortization method for an intangible asset with a finite
useful life are reviewed at least at the end of each reporting period. Changes in the
expected useful life or the expected pattern of consumption of future economic benefits
Translation of a report and consolidated financial statements originally issued in Spanish - see note 27
Notes to the consolidated financial statements (continued)
16
embodied in the asset is accounted for by changing the amortization period or method, as
appropriate, and are treated as changes in accounting estimates. The amortization
expense on intangible assets with finite lives is recognised in the income statement in the
expense category consistent with the function of the intangible assets.
Gains or losses arising from derecognition of an intangible asset are measured as the
difference between the net disposal proceeds and the carrying amount of the asset and
are recognised in the income statement when the asset is derecognised.
(i) Goodwill -
Business combinations are accounted for using the acquisition method. The cost of an
acquisition is measured as the aggregate of the consideration transferred, measured at
acquisition date fair value and the amount of any non-controlling interest in the acquiree.
For each business combination, the Group elects whether it measures the non-controlling
interest in the acquiree either at fair value or at the proportionate share of the acquiree‟s
identifiable net assets. Acquisition costs incurred are expensed and included in
administrative expenses.
When the Group acquires a business, it assesses the financial assets and liabilities
assumed for appropriate classification and designation in accordance with the contractual
terms, economic circumstances and pertinent conditions as at the acquisition date. This
includes the separation of embedded derivatives in host contracts by the acquiree.
Goodwill is initially measured at cost, being the excess of the aggregate of the
consideration transferred and the amount recognised for non-controlling interest over the
net identifiable assets acquired and liabilities assumed. If this consideration is lower than
the fair value of the net assets of the subsidiary acquired, the difference is recognised in
profit or loss at the acquisition date.
After initial recognition, goodwill is measured at cost less any accumulated impairment
losses. For the purpose of impairment testing, goodwill acquired in a business combination
is, from the acquisition date, allocated to each of the Group‟s cash-generating units that
are expected to benefit from the combination, irrespective of whether other assets or
liabilities of the acquiree are assigned to those units.

Translation of a report and consolidated financial statements originally issued in Spanish - see note 27
Notes to the consolidated financial statements (continued)
17
Where goodwill forms part of a cash-generating unit and part of the operation within that
unit is disposed of, the goodwill associated with the operation disposed of is included in
the carrying amount of the operation when determining the gain or loss on disposal of the
operation. Goodwill disposed of in this circumstance is measured based on the relative
values of the operation disposed of and the portion of the cash-generating unit retained.
(j) Borrowing costs -
Borrowing costs directly attributable to the acquisition, construction or production of an
asset that necessarily takes a substantial period of time to get ready for its intended use
or sale are capitalised as part of the cost of the respective assets. All other borrowing
costs are expensed in the period they occur. Borrowing costs consist of interest and other
costs that an entity incurs in connection with the borrowing of funds.
The Group capitalises borrowing costs for all eligible assets where construction was
commenced on IFRS adoption date or after (1 January 2010).
When the Company obtains funds specifically to finance a project, the capitalised amount
represents the borrowing costs actually agreed. If during a short term period there are
funds excess from the Money received for the project, the income that generate the
temporary investment are capitalised and deduced from the total capitalised cost. When
the used funds are part of general borrowings, the capitalised amount is calculated using
an average rate from all the interest rate of the period. The other borrowing costs are
recognised in the consolidated statement of income in the period when occurs.
(k) Impairment of non financial assets -
The Group assesses at each reporting date whether there is an indication that an asset
may be impaired. If any indication exists, or when annual impairment testing for an asset
is required, the Group estimates the asset‟s recoverable amount. An asset‟s recoverable
amount is the higher of an asset‟s or cash-generating unit‟s (CGU) fair value less costs to
sell and its value in use and is determined for an individual asset, unless the asset does not
generate cash inflows that are largely independent of those from other assets or groups of
assets. Where the carrying amount of an asset or CGU exceeds its recoverable amount,
the asset is considered impaired and is written down to its recoverable amount. In
assessing value in use, the estimated future cash flows are discounted to their present
value using a pre-tax discount rate that reflects current market assessments of the time
value of money and the risks specific to the asset. In determining fair value less costs to
sell, recent market transactions are taken into account, if available. If no such
transactions can be identified, an appropriate valuation model is used.
Impairment losses of continuing operations, including impairment on inventories, are
recognised in the income statement in those expense categories consistent with the
function of the impaired asset.
Translation of a report and consolidated financial statements originally issued in Spanish - see note 27
Notes to the consolidated financial statements (continued)
18
For assets excluding goodwill, an assessment is made at each reporting date as to whether
there is any indication that previously recognised impairment losses may no longer exist
or may have decreased. If such indication exists, the Group estimates the asset‟s or cash-
generating unit‟s recoverable amount.
A previously recognised impairment loss is reversed only if there has been a change in the
assumptions used to determine the asset‟s recoverable amount since the last impairment
loss was recognised. The reversal is limited so that the carrying amount of the asset does
not exceed its recoverable amount, nor exceed the carrying amount that would have been
determined, net of depreciation, had no impairment loss been recognised for the asset in
prior years. Such reversal is recognised in the income statement unless the asset is
carried at a revalued amount, in which case the reversal is treated as a revaluation
increase.
The following criteria are also applied in assessing impairment of goodwill:
Goodwill is tested for impairment annually (as at 31 December) and when circumstances
indicate that the carrying value may be impaired.
Impairment is determined for goodwill by assessing the recoverable amount of each cash-
generating unit (or group of cash-generating units) to which the goodwill relates. Where
the recoverable amount of the cash generating unit is less than their carrying amount, an
impairment loss is recognised. Impairment losses relating to goodwill cannot be reversed
in future periods.
(l) Taxes -
Current income tax -
Current income tax assets and liabilities for the current period are measured at the
amount expected to be recovered from or paid to the taxation authorities. The tax rates
and tax laws used to compute the amount are those that are enacted or substantively
enacted, at the reporting date in the countries where the Group operates and generates
taxable income.
Current income tax relating to items recognised directly in equity is recognised in equity
and not in the income statement. Management periodically evaluates positions taken in
the tax returns with respect to situations in which applicable tax regulations are subject to
interpretation and establishes provisions where appropriate

Translation of a report and consolidated financial statements originally issued in Spanish - see note 27
Notes to the consolidated financial statements (continued)
19
Deferred tax -
Deferred tax is provided using the liability method on temporary differences at the
reporting date between the tax bases of assets and liabilities and their carrying amounts
for financial reporting purposes. Deferred tax liabilities are recognised for all taxable
temporary differences, except:
- Where the deferred tax liability arises from the initial recognition of goodwill or of
an asset or liability in a transaction that is not a business combination and, at the
time of the transaction, affects neither the accounting profit nor taxable profit or
- Where the timing of the reversal of the temporary differences can be controlled
and it is probable that the temporary differences will not reverse in the foreseeable
future
Deferred tax assets are recognised for all deductible temporary differences, carry forward
of unused tax credits and unused tax losses, to the extent that it is probable that taxable
profit will be available against which the deductible temporary differences, and the carry
forward of unused tax credits and unused tax losses can be utilised, except:
-
from the initial recognition of an asset or liability in a transaction that is not a
business combination and, at the time of the transaction, affects neither the
accounting profit nor taxable profit or loss, or
- In respect of deductible temporary differences associated with investments in
subsidiaries, associates and interests in joint ventures, deferred tax assets are
recognised only to the extent that it is probable that the temporary differences will
reverse in the foreseeable future and taxable profit will be available against which
the temporary differences can be utilised.
The carrying amount of deferred tax assets is reviewed at each reporting date and
reduced to the extent that it is no longer probable that sufficient taxable profit will be
available to allow all or part of the deferred tax asset to be utilised. Unrecognised deferred
tax assets are reassessed at each reporting date and are recognised to the extent that it
has become probable that future taxable profits will allow the deferred tax asset to be
recovered.
Deferred tax assets and liabilities are measured at the tax rates that are expected to apply
in the year when the asset is realised or the liability is settled, based on tax rates (and tax
laws) that have been enacted or substantively enacted at the reporting date.
Translation of a report and consolidated financial statements originally issued in Spanish - see note 27
Notes to the consolidated financial statements (continued)
20
Deferred tax assets and deferred tax liabilities are offset if a legally enforceable right
exists to set off current tax assets against current income tax liabilities and the deferred
taxes relate to the same taxable entity and the same taxation authority.
Sales tax -
Revenues, expenses and assets are recognised net of the amount of sales tax, except:
-
from the taxation authority, in which case the sales tax is recognised as part of the
cost of acquisition of the asset or as part of the expense item as applicable;
- Receivables and payables are stated with the amount of sales tax included
The net amount of sales tax recoverable from, or payable to, the taxation authority is
included as part of receivables or payables in the statement of financial position.
(m) Revenue recognition -
Revenue is recognised to the extent that it is probable that the economic benefits will flow
to the Group and the revenue can be reliably measured, regardless of when the payment is
being made. Revenue is measured at the fair value of the consideration received or
receivable, taking into account contractually defined terms of payment and excluding
taxes or duty. The Group assesses its revenue arrangements against specific criteria in
order to determine if it is acting as principal or agent. The Group has concluded that it is
acting as a principal in all of its revenue arrangements. The following specific recognition
criteria must also be met before revenue is recognised:
Sale of goods -
Revenue from the sale of goods is recognised when the significant risks and rewards of
ownership of the goods have passed to the buyer, usually on delivery of the goods and its
corresponding bill.
Rendering of services -
Revenue from property leases and other services are recognised when they are accrued.
Interest income -
Interest income are recognised when they are accrued using the effective interest rate.
Interest income is included in finance income in the consolidated income statement.
(n) Recognition of costs and expenses -
The cost of sales that corresponds to the cost of production of the products that the
Company commercializes is registered when the goods are delivered, simultaneous to the
recognition of income corresponding to the sale.
The financial costs are recorded as expense when they are accrued and mainly include the
interest charges and other related costs incurred related to the received loans.

Translation of a report and consolidated financial statements originally issued in Spanish - see note 27
Notes to the consolidated financial statements (continued)
21
The other costs and expenses are recognized as they are accrued, independent to the
moment of payment, and are recorded in the periods to which they are related.
(o) Provisions -
Provisions are recognised when the Group has a present obligation (legal or constructive)
as a result of a past event, it is probable that an outflow of resources embodying economic
benefits will be required to settle the obligation and a reliable estimate can be made of the
amount of the obligation. Provisions are reviewed each period and are adjusted to reflect
the best estimate at financial position date. The expense relating to any provision is
presented in the income statement net of any reimbursement. If the effect of the time
value of money is material, provisions are discounted using a current pre-tax rate that
reflects, where appropriate, the risks specific to the liability. Where discounting is used,
the increase in the provision due to the passage of time is recognised as a finance cost.
(p) Contingencies -
The contingent liabilities are not recognized in the consolidated financial statements.
These are disclosed in the notes to the consolidated financial statements unless the
possibility of a disbursement is remote.
A contingent asset is not recognized in the consolidated financial statements but it is
disclosed when its degree of contingency is probable.
(q) Employment benefits -
The Group has short term obligations related to employment benefits that include salaries,
social contributions, gratifications, performance bonuses and profit sharing. These
obligations are recorded monthly in the consolidated income statement when they are
accrued.
(r) Earnings per share -
Basic and diluted earnings per share have been calculated over the basis of the weighted
average of the common shares and investment shares in circulation during the period. As
of December 31, 2011 and 2010, the Company does not have financial instruments with
dilutive effect; as a result, the basic and diluted earnings per share are the same.
Translation of a report and consolidated financial statements originally issued in Spanish - see note 27
Notes to the consolidated financial statements (continued)
22
(s) Subsequent events -
The subsequent events at closing date that provide additional information on the Group's
financial position and have a connection with events occurred and recorded at the date of
the consolidated statement of financial position (adjusting events) are included in the
consolidated financial statements. Significant subsequent events that are not adjusting
events are disclosed in notes to the consolidated financial statements.
2.3. First time adoption of IFRS -
These financial statements, for the year ended 31 December 2011, are the first the Group has
prepared in accordance with IFRS. For periods up to and including the year ended 31 December
2010, the Group prepared its financial statements in accordance with Peru generally accepted
accounting principles (Peruvian GAAP).
Accordingly, the Group has prepared financial statements which comply with IFRS applicable for
periods ending on or after 31 December 2011, together with the comparative period data as at
and for the year ended 31 December 2010, as described in the accounting policies. In preparing
these financial statements, the Group‟s opening statement of financial position was prepared as
at 1 January 2010, the Group‟s date of transition to IFRS. This note explains the principal
adjustments made by the Group in restating the Peruvian GAAP statement of financial position as
at 1 January 2010 and its previously published under Peruvian GAAP financial statements as at
and for the year ended 31 December 2010.
Exemptions applied -
IFRS 1 First-Time Adoption of International Financial Reporting Standards allows first-time
adopters certain exemptions from the retrospective application of certain IFRS. The Group has
applied the following exemptions:
- Certain items of property, plant and equipment have been measured at fair value at the
date of transition to IFRS.
- Investment properties have been measured at fair value at the date of transition to IFRS.
- Goodwill maintain the book value as of 31 December 2009 as deemed cost at that date.
- Investment in subsidiary maintain the book value as of 31 December 2009 as deemed cost
at that date.
Estimates -
The estimates at 1 January 2010 and at December 31, 2011 and 2010 are consistent with those
made for the same dates in accordance with Peruvian GAAP apart from the estimation of residual
values and useful lives of property, plant and equipment as explained as follows.
Translation of a report and consolidated financial statements originally issued in Spanish - see note 27
Notes to the consolidated financial statements (continued)
23
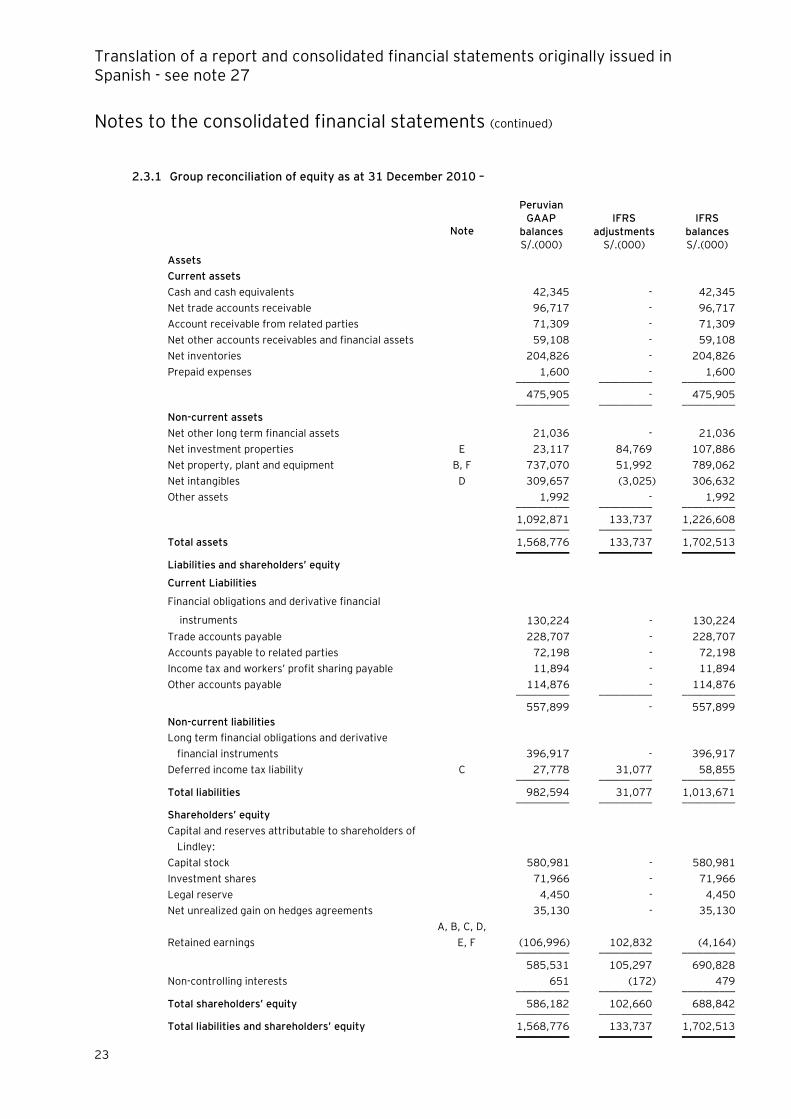
2.3.1 Group reconciliation of equity as at 31 December 2010 –
Note
Peruvian GAAP
balances
IFRS
adjustments
IFRS
balances S/.(000) S/.(000) S/.(000)
Assets
Current assets
Cash and cash equivalents 42,345 - 42,345
Net trade accounts receivable 96,717 - 96,717
Account receivable from related parties 71,309 - 71,309
Net other accounts receivables and financial assets 59,108 - 59,108
Net inventories 204,826 - 204,826
Prepaid expenses 1,600 - 1,600 __________ __________ __________
475,905 - 475,905 __________ __________ __________
Non-current assets
Net other long term financial assets 21,036 - 21,036
Net investment properties E 23,117 84,769 107,886
Net property, plant and equipment B, F 737,070 51,992 789,062
Net intangibles D 309,657 (3,025) 306,632
Other assets 1,992 - 1,992 __________ __________ __________
1,092,871 133,737 1,226,608 __________ __________ __________
Total assets 1,568,776 133,737 1,702,513 __________ __________ __________
Liabilities and shareholders’ equity
Current Liabilities
Financial obligations and derivative financial
instruments 130,224 - 130,224
Trade accounts payable 228,707 - 228,707
Accounts payable to related parties 72,198 - 72,198
Income tax and workers‟ profit sharing payable 11,894 - 11,894
Other accounts payable 114,876 - 114,876 __________ __________ __________
557,899 - 557,899
Non-current liabilities
Long term financial obligations and derivative
financial instruments 396,917 - 396,917
Deferred income tax liability C 27,778 31,077 58,855 __________ __________ __________
Total liabilities 982,594 31,077 1,013,671 __________ __________ __________
Shareholders’ equity
Capital and reserves attributable to shareholders of
Lindley:
Capital stock 580,981 - 580,981
Investment shares 71,966 - 71,966
Legal reserve 4,450 - 4,450
Net unrealized gain on hedges agreements 35,130 - 35,130
Retained earnings
A, B, C, D,
E, F (106,996) 102,832 (4,164) __________ __________ __________
585,531 105,297 690,828
Non-controlling interests 651 (172) 479 __________ __________ __________
Total shareholders’ equity 586,182 102,660 688,842 __________ __________ __________
Total liabilities and shareholders’ equity 1,568,776 133,737 1,702,513 __________ __________ __________

Translation of a report and consolidated financial statements originally issued in Spanish - see note 27
Notes to the consolidated financial statements (continued)
24
Group reconciliation of equity as at 1 January 2010 (transition date to IFRS) –
Note
Peruvian GAAP
balances
IFRS
adjustments
IFRS
balances S/.(000) S/.(000) S/.(000)
Assets
Current assets
Cash and cash equivalents 35,442 - 35,442
Net trade accounts receivable 71,770 - 71,770
Account receivable from related parties 44,454 - 44,454
Net other accounts receivables and financial
assets 28,839
-
28,839
Net inventories 147,298 - 147,298
Prepaid expenses 1,574 - 1,574 __________ __________ __________
329,377 - 329,377 __________ __________ __________
Non-current assets
Net other long term financial assets 22,167 - 22,167
Net investment properties E 26,269 82,123 108,392
Net property, plant and equipment B, F 601,354 54,714 656,068
Net intangibles D 310,899 (3,283) 307,616
Other assets 1,621 - 1,621 __________ __________ __________
962,310 133,554 1,095,864 __________ __________ __________
Total assets 1,291,687 133,554 1,425,241 __________ __________ __________
Liabilities and shareholders’ equity Current Liabilities
Financial obligations and derivative financial
instruments 89,709 - 89,709
Trade accounts payable 154,722 - 154,722
Accounts payable to related parties 26,390 - 26,390
Income tax and workers´ profit sharing
payable 30,629 - 30,629
Other accounts payable 103,828 - 103,828 __________ __________ __________
405,278 - 405,278 Non-current liabilities
Long term financial obligations and derivative
financial instruments 346,541 - 346,541
Deferred income tax liability C 11,939 37,347 49,286 __________ __________ __________
Total liabilities 763,758 37,347 801,105 __________ __________ __________
Shareholders’ equity
Capital and reserves attributable to
shareholders of Lindley:
Capital stock 580,981 - 580,981
Investment shares 71,966 - 71,966
Legal reserve 4,450 - 4,450
Net unrealized gain on hedges agreements 14,535 - 14,535
Retained earnings B, C, D, E, F (144,539) 96,330 (48,209) __________ __________ __________
527,393 96,330 623,723
Non-controlling interests 536 (123) 413 __________ __________ __________
Total shareholders‟ equity 527,929 96,207 624,136 __________ __________ __________
Total liabilities and shareholders’ equity 1,291,687 133,554 1,425,241 __________ __________ __________
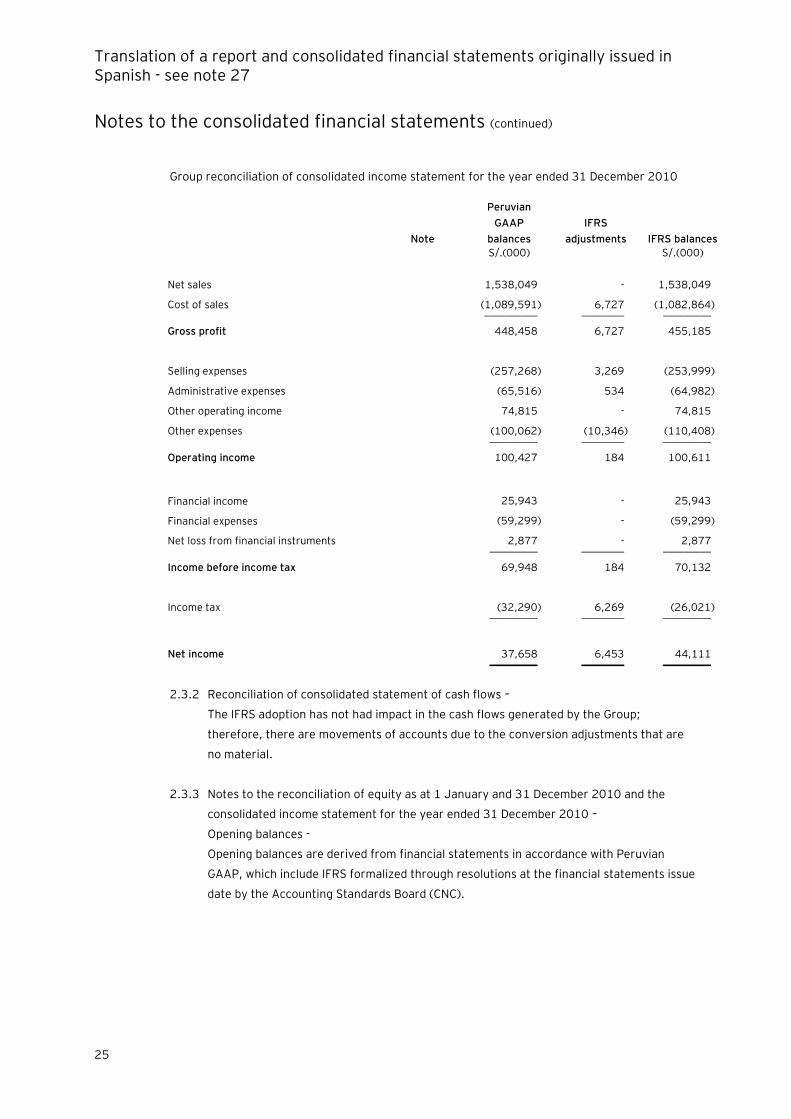
Translation of a report and consolidated financial statements originally issued in Spanish - see note 27
Notes to the consolidated financial statements (continued)
25
Group reconciliation of consolidated income statement for the year ended 31 December 2010
Note
Peruvian
GAAP
balances
IFRS
adjustments IFRS balances
S/.(000) S/.(000)
Net sales 1,538,049 - 1,538,049
Cost of sales (1,089,591) 6,727 (1,082,864) __________ ________ _________
Gross profit 448,458 6,727 455,185
Selling expenses (257,268) 3,269 (253,999)
Administrative expenses (65,516) 534 (64,982)
Other operating income 74,815 - 74,815
Other expenses (100,062) (10,346) (110,408) _________ ________ _________
Operating income 100,427 184 100,611
Financial income 25,943 - 25,943
Financial expenses (59,299) - (59,299)
Net loss from financial instruments 2,877 - 2,877 _________ ________ _________
Income before income tax 69,948 184 70,132
Income tax (32,290) 6,269 (26,021) _________ ________ _________
Net income 37,658 6,453 44,111 _________ ________ _________
2.3.2 Reconciliation of consolidated statement of cash flows –
The IFRS adoption has not had impact in the cash flows generated by the Group;
therefore, there are movements of accounts due to the conversion adjustments that are
no material.
2.3.3 Notes to the reconciliation of equity as at 1 January and 31 December 2010 and the
consolidated income statement for the year ended 31 December 2010 –
Opening balances -
Opening balances are derived from financial statements in accordance with Peruvian
GAAP, which include IFRS formalized through resolutions at the financial statements issue
date by the Accounting Standards Board (CNC).

Translation of a report and consolidated financial statements originally issued in Spanish - see note 27
Notes to the consolidated financial statements (continued)
26
IFRS adjustments -
The adoption of IFRS has required adjustments to the balances in the financial statements
under accounting principles generally accepted in Peru. The most important adjustments
are:
A. Investment in subsidiary –
Peruvian GAAP:
In accordance to Peruvian GAAP, the investment in subsidiary was recorded under
the equity method. According to this method, investments in subsidiaries are
initially recorded at cost and subsequently its carrying amount is increased or
decreased to recognize the Company's participation in the profits and/or losses of
such subsidiaries.
IFRS:
In accordance with IAS 27 "Consolidated and Separate Financial Statements",
establish that investment in subsidiaries included in consolidated financial
statement, have to be recorded in the separated financial statements following the
cost or fair value method. As consequence of IFRS adoption, the Company decided
applied the IAS 27 to record the investment in subsidiary under cost method.
As a result of the described above, as at 1 January 2010 the Company has elected
kept the book value of “Investment in subsidiary” caption and as at 31 December
2010 recorded a decrease by approximately S/.1,566,000 as transition to IFRS
adjustment, debit the “retained earnings” in the equity net.
B. Property, plant and equipment -
Cost -
Peruvian GAAP:
Effective January 1, 1994, the Peruvian economy was not considered as
hyperinflationary economy according to IAS 29 “Financial Reporting
Hyperinflationary Economies”; however, the Peruvian entities were required to
prepare financial statements adjusted by inflation until December 31, 2004. As a
result, cost of items of property, plant and equipment were adjusted by inflation to
reflect the effect of the variation of the acquisition power of the Peruvian currency
until December 31, 2004.
Translation of a report and consolidated financial statements originally issued in Spanish - see note 27
Notes to the consolidated financial statements (continued)
27
IFRS:
According to IAS 29, the Group was not permitted to adjust by inflation from
January 1, 1994 to December 31, 2004. In order to address this issue, the Group
has elected to measure certain items of property, plant and equipment at fair value
at the date of transition to IFRS, based on a valuation made by an independent
appraiser. At the date of transition to IFRS, an increase of S/.98,726,000 was
recognized in property, plant and equipment. This amount has been recognized
against retained earnings
As explained above, at the transition date, cost of property, plant and equipment
also includes major spare parts that can be used in items of property, plant and
equipment.
Accumulated depreciation -
Peruvian GAAP:
Peruvian GAAP does not require entities to account for the residual value of an
asset.
It is not required to have a separate depreciation of each part of an item of
property, plant and equipment that is significant in relation to the total cost of the
item. The normal practice is to depreciate the whole item using a single
depreciation rate.
IFRS:
IAS 16 “Property, Plant and Equipment” requires an entity to estimate the residual
value of an item of property, plant and equipment in order to determine the
depreciable amount.
IAS 16 also requires significant components parts of an item of property, plant and
equipment to be depreciated separately.
For the year ended 31 December 2010, the net effect of these adjustments is a
decrease in accumulated depreciation amounting to S/.10,736,000.
C. Deferred income tax –
The various transitional adjustments lead to different temporary differences.
According to the accounting policies in Note 2, the Group has to account for such
differences. Deferred tax adjustments are recognised in correlation to the
underlying transaction either in retained earnings as at transition date.

Translation of a report and consolidated financial statements originally issued in Spanish - see note 27
Notes to the consolidated financial statements (continued)
28
D. Business combinations and goodwill –
Peruvian GAAP:
As at 1 January 1994, the Peruvian economy was not considered as
hyperinflationary economy according to IAS 29 “Financial Reporting
Hyperinflationary Economies”; however, the Peruvian entities were required to
prepare financial statements adjusted by inflation until December 31, 2004. As a
result, the goodwill was adjusted by inflation to reflect the effect of the variation of
the acquisition power of the Peruvian currency until December 31, 2004.
The Company‟s goodwill correspond to the merger provenient of the bottling
system consolidation, as is described in note 1 of the notes to the consolidated
financial statements, and also to the value paid in excess at the acquisition date of
the several authorized bottlers that operated at national level until the
restructuration project began by the Company and ELSA at 1998.
IFRS:
According to IAS 29, the Group was not permitted to adjust by inflation from
January 1, 1994 to December 31, 2004. In order to address this issue, the Group
has elected to measure the goodwill at net cost at the date of transition to IFRS,
In other case, assets and liabilities balances incorporated as part of the business
combination in accordance to local GAAP and have to be recognised in accordance
to IFRS are their deemed cost at the acquisition date.
Also, as of 1 January 2010, there was a net cost related to franchise rights and
concessions related to past due contracts that were adjusted as of that date. The
adjustment was S/.3,283,000.
Amortization –
Peruvian GAAP:
The goodwill‟s amortization until 31 December 2005 was calculated following the
straight line method to extinguish the cost at the end of the useful life estimated
between 10 and 20 years since it was recorded.
Since 1 January 2006, Company‟s Management reestimated the goodwill‟s useful
life and considered that it was unlimited, consequently stopped the amortization.
IFRS:
After initial recognition, goodwill is measured at cost less any accumulated loss for
impairment. In accordance with IFRS 1, the Group has tested goodwill for
impairment at the date of transition to IFRS, no goodwill impairment was deemed
necessary, also the Company elected to maintain the book value as of 1 January
2010.

Translation of a report and consolidated financial statements originally issued in Spanish - see note 27
Notes to the consolidated financial statements (continued)
29
Other adjustments –
E. Investment property –
Company maintained lands and buildings with not defined use and disposition, also
other properties that as of 31 December 2010 accomplished the requirements to
be classified as available for sale. Considering the business conditions showed
during 2011, the Group reassessed the classifications of this caption and decided
to disclose as investment property adjusting their value at fair value at the date of
transition to IFRS, based on a valuation made by an independent appraiser.
According to this, the effect represents an increase in the accumulated results as
of 1 January 2010 by S/.82,122,000 and an effect amounting to S/.2,647,000 as
of 31 December 2010.
F. Planting of bottles –
Planting of returnable glass has as objective introduce to the market by the launch
of new presentations to the market and to meet the growing demand, were
presented at cost and are classified as bottles in the item "Net property, plant and
equipment.” The depreciation of these was calculated following the straight-line
method, using 4 years of useful life. The Company reassessed the accounting
policy of this caption and in accordance to the actual market conditions, products‟
rotation level and the presented demand has considered record the planting of
bottles cost in the operating expenses when occurs the acquisition, and transferred
to equity the net cost maintained as of 1 January 2010 amounting to
S/.42,207,000 and S/.10,810,000 to the consolidated income statement of 2010
period.
2.4. New accounting pronouncements -
On May 2011, el IASB approved the following international financial reporting standards and
their modifications, which will be in force for annual periods beginning on 1 January 2013,
except when the against is indicated:
- Amendment to IAS 1“Presentation of financial statements – presentation of the elements
of comprehensive income statement” That amendment is in force for the periods
beginning on 1 July 2012, and request that if certain conditions are applied, the entity
present separately the captions of the comprehensive income statement that in future can
be reclassified to results, from other caption that never will be classified.
- Amendment to IAS 12 "Income Taxes" established that deferred tax on investment
property that is recorded following the fair value model of IAS 40 should be determined on
the basis that their carrying amount will be recovered through the sale of such assets.
Also, deferred taxes on non-depreciable assets, measured by the revaluation model of IAS
16, should be measured on the presumption of its sale. Effective January 1, 2012 and
thereafter, early adoption is permitted.

Translation of a report and consolidated financial statements originally issued in Spanish - see note 27
Notes to the consolidated financial statements (continued)
30
- Amendment to IAS 19 “Employee benefits”, establish significant changes related to
recognition and measure of the pension defined expense and termination benefits, and
also the information to disclose in the financial statements.
- Amendment to IAS 27 “Separate financial statements” (revised in 2011), and IAS 28
“Investments in associates and joint ventures” (revised in 2011).
- IFRS 9 “Financial Instruments: Classification and Measurement” that modified the
recognition and classification of assets and liabilities established in IAS 39 “Financial
Instruments: Classification and Measurement”.
- IFRS 10 “Consolidated Financial Statements” It establishes the principles for the
preparation and presentation of consolidated financial statements when an entity controls
one or more entities. IFRS 10 replaces the consolidation requirements in SIC-12
“Consolidation – Special Purpose Entities” and IAS 27 “Consolidated and Separate
Financial Statements”.
- IFRS 11 "Join arrangements", the standard contains the inconsistencies of the joint
ventures related to the request of a unique method to report the interest in join controlled
entities, focused in its rights and obligations instead its juridical form. IFRS 11 replace IAS
31 Interest in joint ventures and SIC 13 Join controlled entities – non monetary
contributions by ventures.
- IFRS 12 “Disclosure of Interests in other entities” it establishes the disclosure
requirements for all forms of interests in other entities, including subsidiaries, joint
ventures, associates, special purpose entities and other investment form outside the
consolidated statement of financial position.
- IFRS 13 “Fair Value Measurement” established new requirements on how to measure the
fair value and improve the convergence with international standards and reduce the
complexity to provide a fair value definition and resources for its measurement, also the
disclosure requirements to its use through IFRS.
- IFRIC 20 “Stripping cost in the production phase of a surface mine ".
As of today, Group‟s Management is analyzing the impact of those standards can be produce in
its operations when they will be in force.
Translation of a report and consolidated financial statements originally issued in Spanish - see note 27
Notes to the consolidated financial statements (continued)
31
2.5. Significant accounting judgments, estimates and assumptions -
Many of the amounts included in the financial statements involve the use of judgment and/or
estimation. These judgments and estimates are based on management‟s best knowledge of the
relevant facts and circumstances, having regard to prior experience, but actual results may differ
from the amounts included in the financial statements. Information about such judgments and
estimates are contained in the accounting policies and/or the notes to the financial statements.
The key areas are summarized below:
Significant areas of estimation uncertainty and critical judgments made by management in
preparing the consolidated financial statements include:
- Determination of useful lives of assets for depreciation and amortization purposes – see
notes 2.2(e) and (f) and note 8, 9 and 10.
- Estimation of allowance for obsolescence, see note 2.2(d) and note 7.
- Depreciation of property, plant and equipment, and investment property, see note 2.2(e)
and (f) and note 8 and 9.
- Amortization of intangible assets, see note 2.2(h) and note 10.
- Estimation for impairment of non financial assets, see note 2.2(k) and note 8, 9 and 10.
- Income tax – note 2.2(l) and note 13.
Any difference in the estimations with the subsequent results is recorded in the income
statement in the year when occurs.

Translation of a report and consolidated financial statements originally issued in Spanish - see note 27
Notes to the consolidated financial statements (continued)
32
3. Transactions in foreign currency
Foreign currency transactions are carried out at market exchange rates as published by the
Superintendencia de Banca, Seguros and AFP. The weighted average exchange rates for the
transactions in dollars were S/.2.695 for the purchase and S/2.697 for the sale as of December 31,
2011, (S/.2.808 for the purchase and S/.2.809 for the sale as of December 31, 2010).
As of 31 December 2011, 2010 and 1 January 2010, the Group had the following assets and liabilities
at foreign currency:
2011
2010
1 January
2010
US$(000) US$(000) US$(000)
Assets
Cash and cash equivalents 126,717 783 2,625
Net trade account receivables 1,671 429 1,224
Account receivables from related parties 15,441 14,721 15,268
Net, other account receivables and other
financial assets
8,747 13,074 5,382
_________ _________ _________
152,576 29,007 24,499 _________ _________ _________
Liabilities
Trade account payables 72,721 61,697 31,936
Account payables to related parties 18,856 13,097 4,052
Other financial liabilities 3,058 2,823 2,521
Financial obligations 335,302 81,795 69,672 _________ _________ _________
429,937 159,412 108,181 _________ _________ _________
Net liability position 277,361 130,405 83,682 _________ _________ _________
The Group uses derivative financial instruments to hedge the exposure to a portion of its foreign
currency liability position (see notes 25 and 24(iii).
During 2011, the Group recognized a gain and a loss from exchange differences of approximately
S/.55,304,000 and S/.36,695,000 respectively (gain of S/.21,064,000 and a loss of S/.15,756,000
respectively in 2010), which is presented in the caption "Finance income" and "Finance expense" in the
consolidated statement of income.

Translation of a report and consolidated financial statements originally issued in Spanish - see note 27
Notes to the consolidated financial statements (continued)
33
4. Cash and cash equivalents
As of 31December 2011, 2010 and 1 January 2010, cash and cash equivalents comprise bank accounts
amounting to S/.357,355,000, S/.42,345,000 and 35,442,000, respectively which are mainly
maintained in local Banks in nuevos soles and U.S. dollars are unrestricted and generate interests at
market rates. As of 31 December 2011 include approximately S/.339,000,000 from the international
bonds issuing, see note 12.
5. Net trade accounts receivable
(a) The item is made up as follows:
2011 2010
1 January
2010
S/.(000) S/.(000) S/.(000)
Current
Invoices 158,938 97,944 77,929
Notes receivable 7,469 12,394 7,044
Other receivables 2,822 756 798 _________ _________ _________
169,229 111,094 85,771
Less – Allowance for doubtful accounts (c) (16,459) (14,377) (14,001) _________ _________ _________
Net 152,770 96,717 71,770 _________ _________ _________
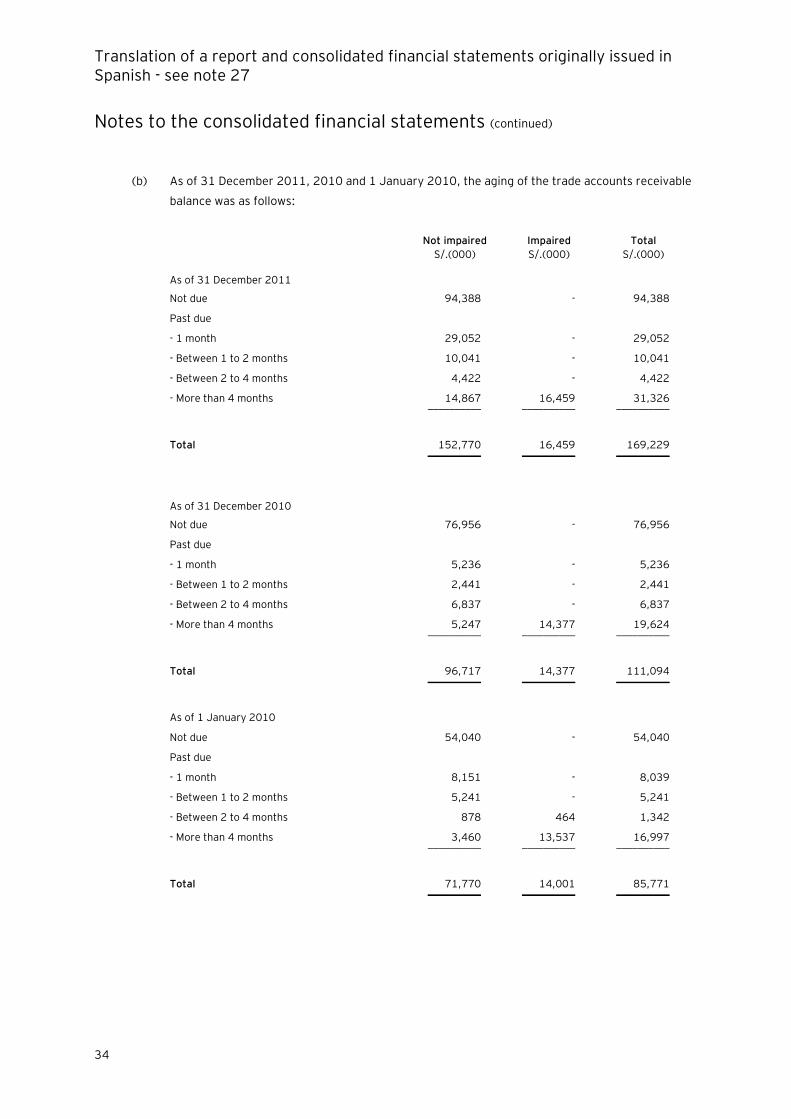
Translation of a report and consolidated financial statements originally issued in Spanish - see note 27
Notes to the consolidated financial statements (continued)
34
(b) As of 31 December 2011, 2010 and 1 January 2010, the aging of the trade accounts receivable
balance was as follows:
Not impaired Impaired Total S/.(000) S/.(000) S/.(000)
As of 31 December 2011
Not due 94,388 - 94,388
Past due
- 1 month 29,052 - 29,052
- Between 1 to 2 months 10,041 - 10,041
- Between 2 to 4 months 4,422 - 4,422
- More than 4 months 14,867 16,459 31,326 __________ __________ __________
Total 152,770 16,459 169,229 __________ __________ __________
As of 31 December 2010
Not due 76,956 - 76,956
Past due
- 1 month 5,236 - 5,236
- Between 1 to 2 months 2,441 - 2,441
- Between 2 to 4 months 6,837 - 6,837
- More than 4 months 5,247 14,377 19,624 __________ __________ __________
Total 96,717 14,377 111,094 __________ __________ __________
As of 1 January 2010
Not due 54,040 - 54,040
Past due
- 1 month 8,151 - 8,039
- Between 1 to 2 months 5,241 - 5,241
- Between 2 to 4 months 878 464 1,342
- More than 4 months 3,460 13,537 16,997 __________ __________ __________
Total 71,770 14,001 85,771 __________ __________ __________

Translation of a report and consolidated financial statements originally issued in Spanish - see note 27
Notes to the consolidated financial statements (continued)
35
(c) As of 31 December 2011, 2010, and 1 January 2010, the movement of the allowance for
doubtful accounts was as follows:
2011 2010
S/.(000) S/.(000)
Opening balance 14,377 14,001
Additions 2,619 389
Less: recoveries and write off (537) (13) _________ _________
Ending balance 16,459 14,377 _________ _________
6. Net other accounts receivable and financial assets
(a) The item is made up as follows:
2011 2010
1 January
2010
S/.(000) S/.(000) S/.(000)
Claims for tax refund (b) 25,437 30,155 20,686
Claim to Embonor Holdings S.A. (c) 4,343 4,343 4,343
Loans to employees 2,402 2,209 2,499
Legal deductions and claims to council 1,818 1,478 1,585
Distributors 1,828 1,123 688
Other claims and other receivables (d) 7,240 6,067 8,881
Accruals 1,675 1,702 1,688 _________ _________ _________
44,743 47,077 40,370
Allowance for doubtful accounts (f) (1,674) (1,702) (1,688) _________ _________ _________
43,069 45,375 38,682
Derivatives financial instruments
Credit line applied to sugar contracts 19,050 427 5,624
Cash flow hedge, note 25 (iv) - 34,342 6,700 _________ _________ _________
Total 62,119 80,144 51,006 _________ _________ _________
By maturity -
Current portion 41,082 59,108 28,839
Non-current portion (e) 21,037 21,036 22,167 _________ _________ _________
Total 62,119 80,144 51,006 _________ _________ _________

Translation of a report and consolidated financial statements originally issued in Spanish - see note 27
Notes to the consolidated financial statements (continued)
36
(b) The claims for tax refund comprise:
2011 2010
1 January
2010
S/.(000) S/.(000) S/.(000)
Claims request by ELSA 15,215 15,215 16,037
Tax to be applied 6,549 14,909 4,121
Other claims 3,673 31 528 ________ ________ ________
25,437 30,155 20,686 ________ ________ ________
The claims request by ELSA to the Tax Authority, mainly correspond to tax prepayments in
excess in previous years that are in resolutions process.
The claims request by ELSA to the Tax Authority, mainly correspond to tax prepayments in
excess in previous years that are in resolutions process.
(c) As part of the arrangements described in the sale and purchase contract of participations and
shares held on January 29, 2004 between the Group, Embonor Holding S.A. (hereinafter
"Embonor") and Embotelladora Arica Overseas, involving "SOCAP" and Coca Cola Embonor S.A.,
as a result of the transactions described in note 1(b), the Group may exercise the right to recover
the excess of declared inadmissible claims incorporated in their assets as part of merger with
ELSA, from US$4,000,000, considering the percentage of interest acquired. Thus, the Group
recorded a total of S/.4,343,000, which corresponds to the claim that Management has
requested as restitution to Embonor Holdings S.A. and consider that this concept will be
recovered in the long term
(d) Non current portion comprises:
2011
2010
1 January
2010
S/.(000) S/.(000) S/.(000)
Claims for tax refund 14,876 15,215 16,037
Claim to Embonor Holdings S.A. (c) 4,343 4,343 4,343
Legal deductions and claims to council 1,818 1,478 1,585
Other receivables - - 202 ________ ________ _________
21,037 21,036 22,167 ________ ________ _________
The Management and its legal counsel expect to recover these balances in the medium term.

Translation of a report and consolidated financial statements originally issued in Spanish - see note 27
Notes to the consolidated financial statements (continued)
37
(e) As of 31 December 2011, 2010 and 1 January 2010, the aging of the other financial assets
balance was as follows:
Not impaired Impaired Total S/.(000) S/.(000) S/.(000)
As of 31 December 2011
Not due 9,741 - 9,741
Past due
- 1 month 3,313 - 3,313
- Between 1 to 2 months 3,044 - 3,044
- Between 2 to 4 months 10,280 - 10,280
- More than 4 months 35,741 1,674 37,415 __________ __________ __________
Total 62,119 1,674 63,793 __________ __________ __________
As of 31 December 2010
Not due 17,454 - 17,454
Past due
- 1 month 15,849 - 15,849
- Between 1 to 2 months 156 - 156
- Between 2 to 4 months 1,121 - 1,121
- More than 4 months 45,564 1,702 47,266 __________ __________ __________
Total 80,144 1,702 81,846 __________ __________ __________
As of1 January 2010
Not due 5,371 - 5,371
Past due
- 1 month 7,379 - 7,379
- Between 1 to 2 months 6,179 - 6,179
- Between 2 to 4 months 2,131 408 2,539
- More than 4 months 29,946 1,280 31,226 __________ __________ __________
Total 51,006 1,688 52,694 __________ __________ __________
(f) As of December 31, 2011 and 2010, the movement of the allowance for doubtful accounts was
as follows:
2011 2010
S/.(000) S/.(000)
Opening balance 1,702 1,688
Additions - 12
Less: recoveries and write off (28) 2 _________ _________
Ending balance 1,674 1,702 _________ _________
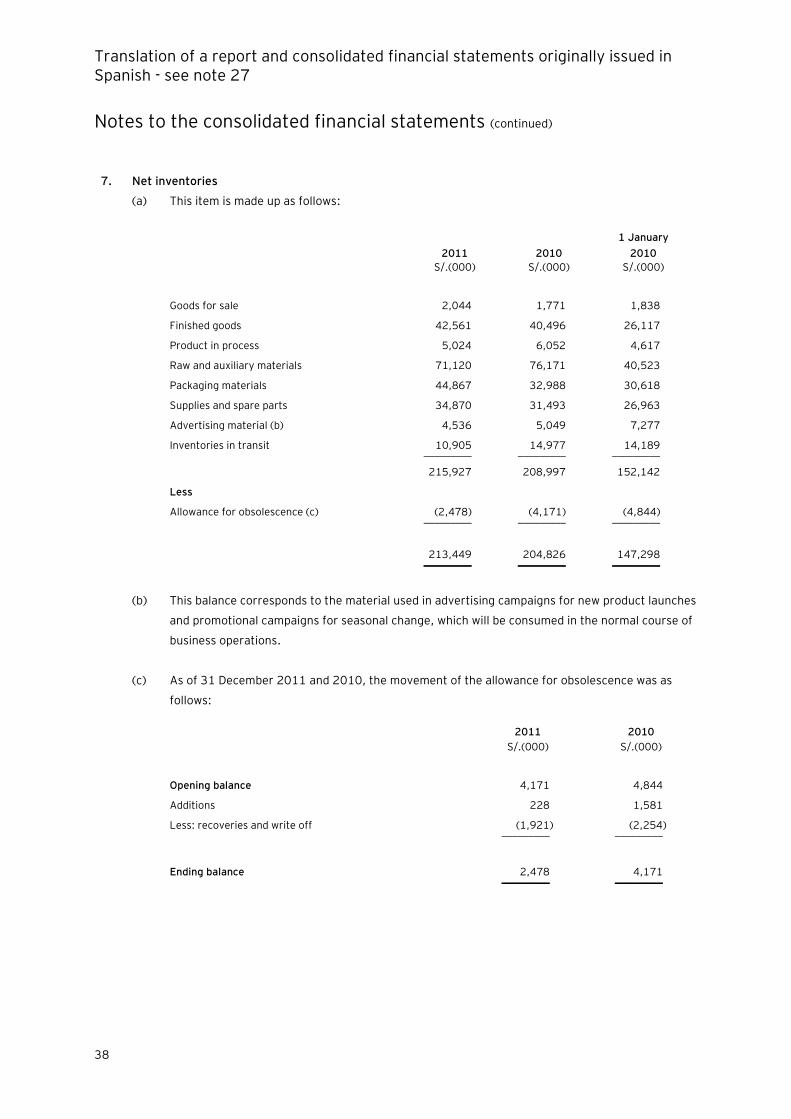
Translation of a report and consolidated financial statements originally issued in Spanish - see note 27
Notes to the consolidated financial statements (continued)
38
7. Net inventories
(a) This item is made up as follows:
2011 2010
1 January
2010
S/.(000) S/.(000) S/.(000)
Goods for sale 2,044 1,771 1,838
Finished goods 42,561 40,496 26,117
Product in process 5,024 6,052 4,617
Raw and auxiliary materials 71,120 76,171 40,523
Packaging materials 44,867 32,988 30,618
Supplies and spare parts 34,870 31,493 26,963
Advertising material (b) 4,536 5,049 7,277
Inventories in transit 10,905 14,977 14,189 _________ _________ _________
215,927 208,997 152,142
Less
Allowance for obsolescence (c) (2,478) (4,171) (4,844) _________ _________ _________
213,449 204,826 147,298 _________ _________ _________
(b) This balance corresponds to the material used in advertising campaigns for new product launches
and promotional campaigns for seasonal change, which will be consumed in the normal course of
business operations.
(c) As of 31 December 2011 and 2010, the movement of the allowance for obsolescence was as
follows:
2011 2010
S/.(000) S/.(000)
Opening balance 4,171 4,844
Additions 228 1,581
Less: recoveries and write off (1,921) (2,254) _________ _________
Ending balance 2,478 4,171 _________ _________

Translation of a report and consolidated financial statements originally issued in Spanish - see note 27
Notes to the consolidated financial statements (continued)
39
8. Net investment properties
(a) The compositions and movement of this item is as follows:
Land
Buildings and
other
constructions Total
S/.(000) S/.(000) S/.(000)
Cost
As of 1 January 2010 94,034 25,306 119,340
Additions - 1,879 1,879
Sales/ disposals (315) (3,132) (3,447) _________ _________ _________
As of 31 December 2010 93,719 24,053 117,772
Sales/ disposals (754) (151) (905) _________ _________ _________
As of 31 December 2011 92,965 23,902 116,867 _________ _________ _________
Accumulated depreciation
As of 1 January 2010 - 10,948 10,948
Additions, note 9(d) - 448 448
Sales/ disposals - (1,510) (1,510) _________ _________ _________
As of 31 December 2010 - 9,886 9,886
Additions, note 9(d) - 403 403 _________ _________ _________
As of 31 December 2011 - 10,289 10,289 _________ _________ _________
Net value as of 1 January 2010 94,034 14,358 108,392 _________ _________ _________
Net value as of 31 December 2010 93,719 14,167 107,886 _________ _________ _________
Net value as of 31 December 2011 92,965 13,613 106,578 _________ _________ _________
(b) The fair value of investment properties are similar to their book value, due to was determined
based on a valuation made by an independent appraiser and do not have modifications at the
year ended 2011.

Translation of a report and consolidated financial statements originally issued in Spanish - see note 27
Notes to the consolidated financial statements (continued)
40
9. Net property, plant and equipment
(a) The compositions and movement of this item is as follows:
Lands
Buildings and
other
constructions
Machinery
and
equipment
Furniture and
fixtures
Transport
units
Bottles and
boxes
Computer
equipment
and others
Replacement
units
Work in
progress Units in transit Total
S/.(000) S/.(000) S/.(000) S/.(000) S/.(000) S/.(000) S/.(000) S/.(000) S/.(000) S/.(000) S/.(000)
Cost
Balance as of January 1 156,599 130,979 543,504 23,265 21,573 186,736 268,941 1,406 13,091 10,488 1,356,582
Additions - 2,206 14,003 6,092 29 12,662 15,819 - 66,289 122,717 239,817
Sales and/or withdrawals (6,093) (2,065) (3,718) - (2,031) (30,686) (16,949) - (31) (6,897) (68,470)
Transfers - 9,348 44,090 1,297 2,100 32,287 52,024 - (35,809) (105,337) - _________ _________ _________ _________ _________ _________ _________ _________ _________ _________ __________
Balance as of 31 December 2010 150,506 140,468 597,879 30,654 21,671 200,999 319,835 1,406 43,540 20,971 1,527,929
Additions 442 989 9,907 201 982 7,988 20,918 - 142,905 243,983 428,315
Sales and/or withdrawals - - (5,934) (1,181) (1,502) (25,340) (14,918) - (1,135) (14,391) (64,401)
Transfers - 14,448 12,634 213 2,652 37,778 33,807 (1,406) (26,981) (73,145) - _________ _________ _________ _________ _________ _________ _________ _________ _________ _________ __________
Balance as of 31 December 2011 150,948 155,905 614,486 29,887 23,803 221,425 359,642 - 158,329 177,418 1,891,843 _________ _________ _________ _________ _________ _________ _________ _________ _________ _________ __________
Accumulated depreciation
Balance as of January 1 - 58,976 313,491 18,239 11,246 108,456 190,106 - - - 700,514
Additions (c) - 2,476 21,484 891 1,384 26,793 25,911 - - - 78,939
Sales and/or withdrawals - (968) (3,064) - (1,975) (23,589) (10,990) - - - (40,586) _________ _________ _________ _________ _________ _________ _________ _________ _________ _________ _________
Balance as of 31 December 2010 - 60,484 331,911 19,130 10,655 111,660 205,027 - - - 738,867
Additions (c) - 2,440 24,433 1,622 1,754 32,074 36,475 - - - 98,798
Sales and/or withdrawals - - (5,604) (1,031) (1,138) (19,170) (10,188) - - - (37,131) _________ _________ _________ _________ _________ _________ _________ _________ _________ _________ __________
Balance as of 31 December 2011 - 62,924 350,740 19,721 11,271 124,564 231,314 - - - 800,534 _________ _________ _________ _________ _________ _________ _________ _________ _________ _________ __________
Net value as of 1 January 2010 156,599 72,003 230,013 5,026 10,327 78,280 78,835 1,406 13,091 10,488 656,068 _________ _________ _________ _________ _________ _________ _________ _________ _________ _________ __________
Net value as of 31 December 2010 150,506 79,984 265,968 11,524 11,016 89,339 114,808 1,406 43,540 20,971 789,062 _________ _________ _________ _________ _________ _________ _________ _________ _________ _________ __________
Net value as of 31 December 2011 150,948 92,981 263,746 10,166 12,532 96,861 128,328 - 158,329 177,418 1,091,309 _________ _________ _________ _________ _________ _________ _________ _________ _________ _________ __________

Translation of a report and consolidated financial statements originally issued in Spanish - see note 27
Notes to the consolidated financial statements (continued)
41
(b) As part of the program of infrastructure investments, Lindley performed significant acquisitions
and improvement projects in plants in response to the need to expand production capacity which
mainly comprise refurbishment and remodeling of Callao and Huacho plants, it also performed
significant purchases of glass bottles and returnable plastic, to respond to increased market
demand and increase product movement, and of refrigeration equipment, as part of its expansion
and presence in retail outlets. These investments were mainly financed through financial leasing
agreements with BBVA Banco Continental and Interbank and the funds obtained from the
international bonds issuing, see note 13 and were supported by its related companies,
see note 21.
(c) The depreciation of investment properties and property, plant and equipment of the years 2011
and 2010 is as follows:
2011 2010
S/.(000) S/.(000)
Cost of sales, note 18 59,308 50,172
Selling expenses, note 18 33,670 21,938
Administrative expenses, note 18 3,569 3,939
Net others, note 19 2,654 3,338 _________ _________
99,201 79,387 _________ _________
By item –
2011 2010
S/.(000) S/.(000)
Investment properties, nota 8 403 448
Property, plant and equipment 98,798 78,939 _________ _________
99,201 79,387 _________ _________
(d) Based on the results of its financial projections of earnings and cash flows, the Group has made
an assessment of indicators of impairment of some assets that make up this item, and considers
that the allowance for impairment of fixed assets as of 31 December 2011, 2010 and 1 January
2010 is sufficient and will not be required the registration of an additional provision. The present
value of the financial projections has been calculated using a discount rate that reflects the
changing value of money over time in the market.
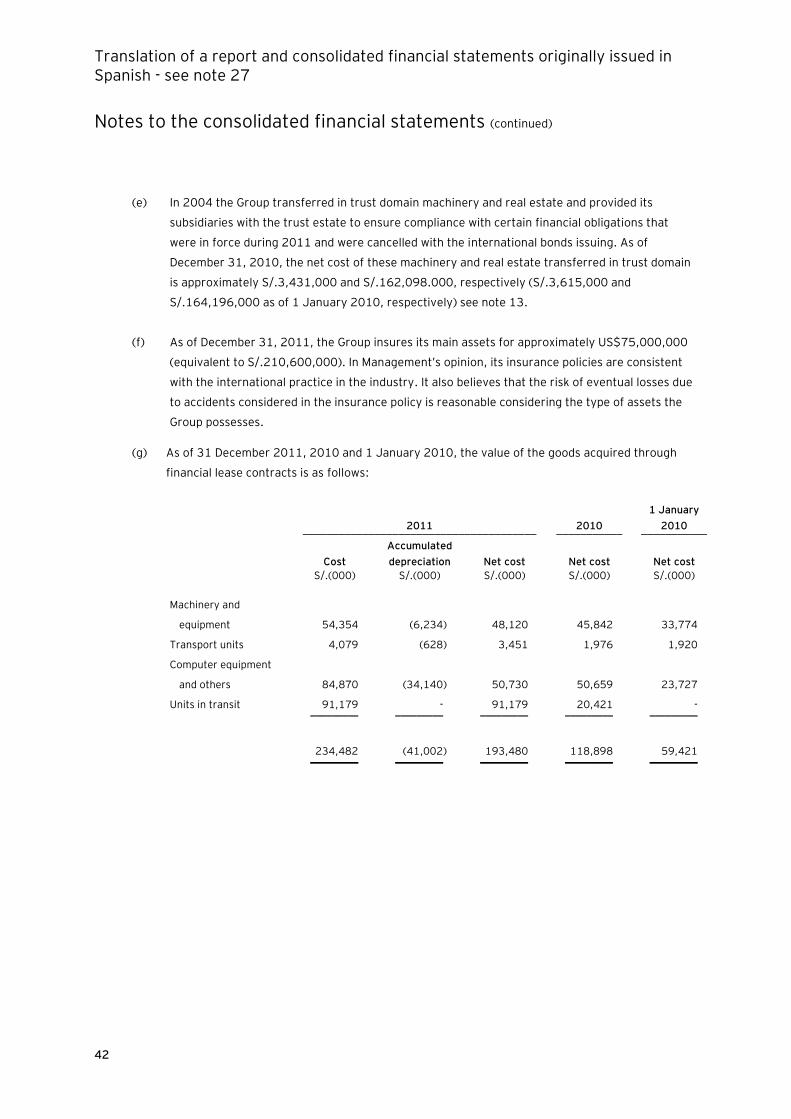
Translation of a report and consolidated financial statements originally issued in Spanish - see note 27
Notes to the consolidated financial statements (continued)
42
(e) In 2004 the Group transferred in trust domain machinery and real estate and provided its
subsidiaries with the trust estate to ensure compliance with certain financial obligations that
were in force during 2011 and were cancelled with the international bonds issuing. As of
December 31, 2010, the net cost of these machinery and real estate transferred in trust domain
is approximately S/.3,431,000 and S/.162,098.000, respectively (S/.3,615,000 and
S/.164,196,000 as of 1 January 2010, respectively) see note 13.
(f) As of December 31, 2011, the Group insures its main assets for approximately US$75,000,000
(equivalent to S/.210,600,000). In Management‟s opinion, its insurance policies are consistent
with the international practice in the industry. It also believes that the risk of eventual losses due
to accidents considered in the insurance policy is reasonable considering the type of assets the
Group possesses.
(g) As of 31 December 2011, 2010 and 1 January 2010, the value of the goods acquired through
financial lease contracts is as follows:
2011 2010
1 January
2010 _______________________________________ ___________ ___________
Cost
Accumulated
depreciation Net cost Net cost Net cost
S/.(000) S/.(000) S/.(000) S/.(000) S/.(000)
Machinery and
equipment 54,354 (6,234) 48,120 45,842 33,774
Transport units 4,079 (628) 3,451 1,976 1,920
Computer equipment
and others 84,870 (34,140) 50,730 50,659 23,727
Units in transit 91,179 - 91,179 20,421 - _________ _________ _________ _________ _________
234,482 (41,002) 193,480 118,898 59,421 ________ ________ ________ ________ ________

Translation of a report and consolidated financial statements originally issued in Spanish - see note 27
Notes to the consolidated financial statements (continued)
43
10. Net intangibles
(a) The compositions and movement of this item is as follows:
Software
licenses and
other projects
Franchise
rights and
concessions Goodwill (c) Total
S/.(000) S/.(000) S/.(000) S/.(000)
Cost
As of 1 January 2010 20,337 5,179 305,555 331,071
Additions 870 - - 870 _________ _________ _________ _________
As of 31 December 2010 21,207 5,179 305,555 331,941
Additions 1,232 - - 1,232 _________ _________ _________ _________
As of 31 December 2011 22,439 5,179 305,555 333,173 _________ _________ _________ _________
Accumulated amortization
As of 1 January 2010 18,276 5,179 - 23,455
Additions (b) 1,853 - - 1,853 _________ _________ _________ _________
As of 31 December 2010 20,129 5,179 - 25,308
Additions (b) 938 - - 938 _________ _________ _________ _________
As of 31 December 2011 21,067 5,179 - 26,246 _________ _________ _________ _________
Net cost as of 1 January 2010 2,061 - 305,555 307,616 _________ _________ _________ _________
Net cost as of 31 December 2010 1,078 - 305,555 306,633 _________ _________ _________ _________
Net cost as of 31 December 2011 1,372 - 305,555 306,927 _________ _________ _________ _________
(b) Distribution of amortization during the years 2011 and 2010 is as follows:
2011 2010
S/.(000) S/.(000)
Administrative expenses, note 18 922 1,820
Cost of sale, note 18 16 33 ________ ________
938 1,853 ________ ________
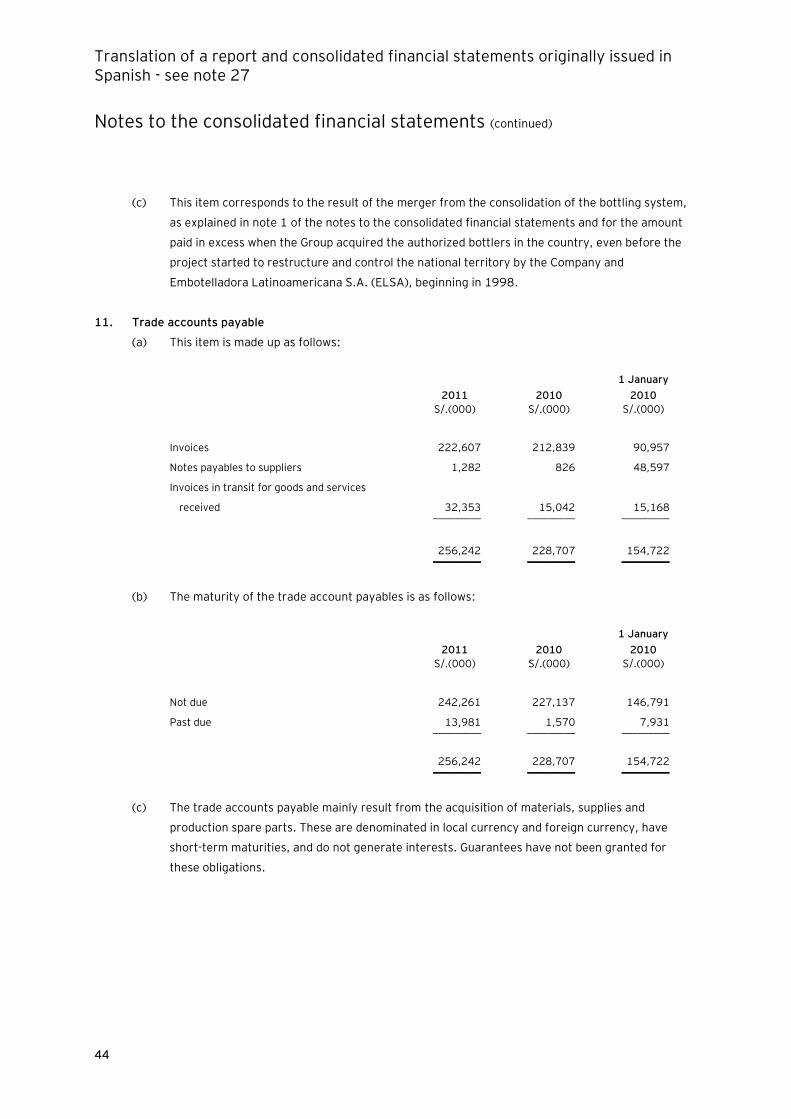
Translation of a report and consolidated financial statements originally issued in Spanish - see note 27
Notes to the consolidated financial statements (continued)
44
(c) This item corresponds to the result of the merger from the consolidation of the bottling system,
as explained in note 1 of the notes to the consolidated financial statements and for the amount
paid in excess when the Group acquired the authorized bottlers in the country, even before the
project started to restructure and control the national territory by the Company and
Embotelladora Latinoamericana S.A. (ELSA), beginning in 1998.
11. Trade accounts payable
(a) This item is made up as follows:
2011 2010
1 January
2010
S/.(000) S/.(000) S/.(000)
Invoices 222,607 212,839 90,957
Notes payables to suppliers 1,282 826 48,597
Invoices in transit for goods and services
received 32,353 15,042 15,168 _________ _________ _________
256,242 228,707 154,722 _________ _________ _________
(b) The maturity of the trade account payables is as follows:
2011 2010
1 January
2010
S/.(000) S/.(000) S/.(000)
Not due 242,261 227,137 146,791
Past due 13,981 1,570 7,931 _________ _________ _________
256,242 228,707 154,722 _________ _________ _________
(c) The trade accounts payable mainly result from the acquisition of materials, supplies and
production spare parts. These are denominated in local currency and foreign currency, have
short-term maturities, and do not generate interests. Guarantees have not been granted for
these obligations.
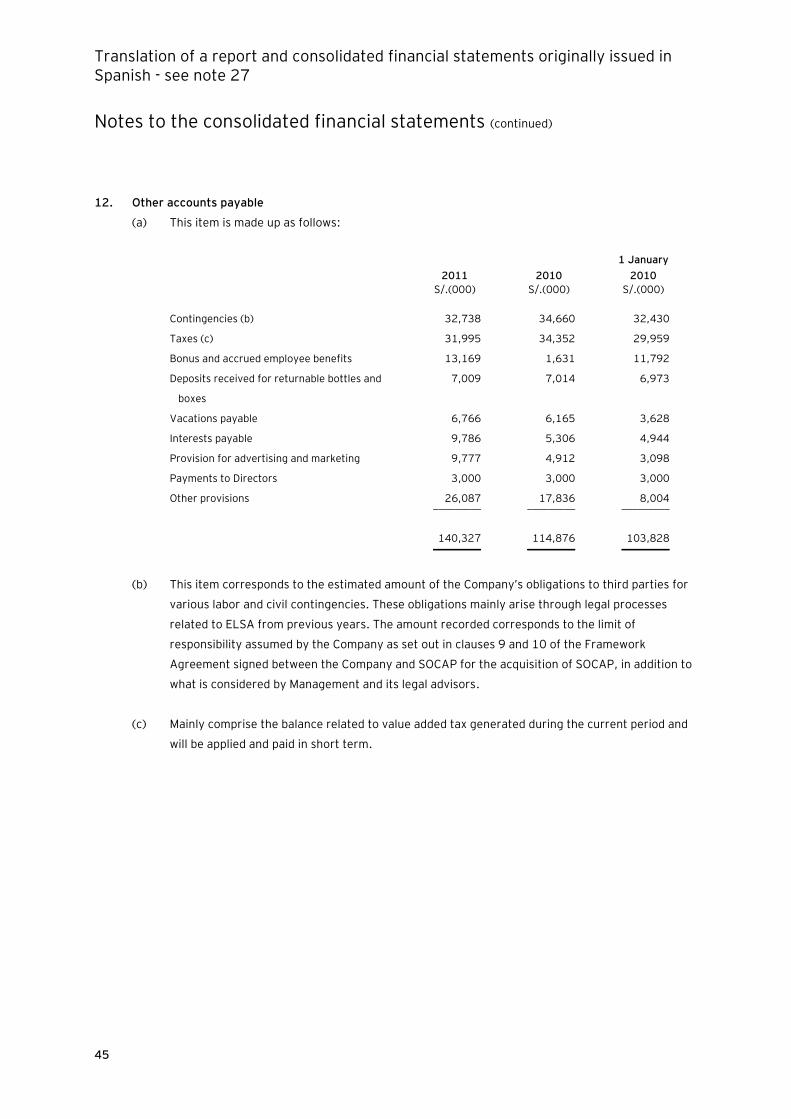
Translation of a report and consolidated financial statements originally issued in Spanish - see note 27
Notes to the consolidated financial statements (continued)
45
12. Other accounts payable
(a) This item is made up as follows:
2011
2010
1 January
2010
S/.(000) S/.(000) S/.(000)
Contingencies (b) 32,738 34,660 32,430
Taxes (c) 31,995 34,352 29,959
Bonus and accrued employee benefits 13,169 1,631 11,792
Deposits received for returnable bottles and
boxes
7,009 7,014 6,973
Vacations payable 6,766 6,165 3,628
Interests payable 9,786 5,306 4,944
Provision for advertising and marketing 9,777 4,912 3,098
Payments to Directors 3,000 3,000 3,000
Other provisions 26,087 17,836 8,004 _________ _________ _________
140,327 114,876 103,828 _________ _________ _________
(b) This item corresponds to the estimated amount of the Company‟s obligations to third parties for
various labor and civil contingencies. These obligations mainly arise through legal processes
related to ELSA from previous years. The amount recorded corresponds to the limit of
responsibility assumed by the Company as set out in clauses 9 and 10 of the Framework
Agreement signed between the Company and SOCAP for the acquisition of SOCAP, in addition to
what is considered by Management and its legal advisors.
(c) Mainly comprise the balance related to value added tax generated during the current period and
will be applied and paid in short term.
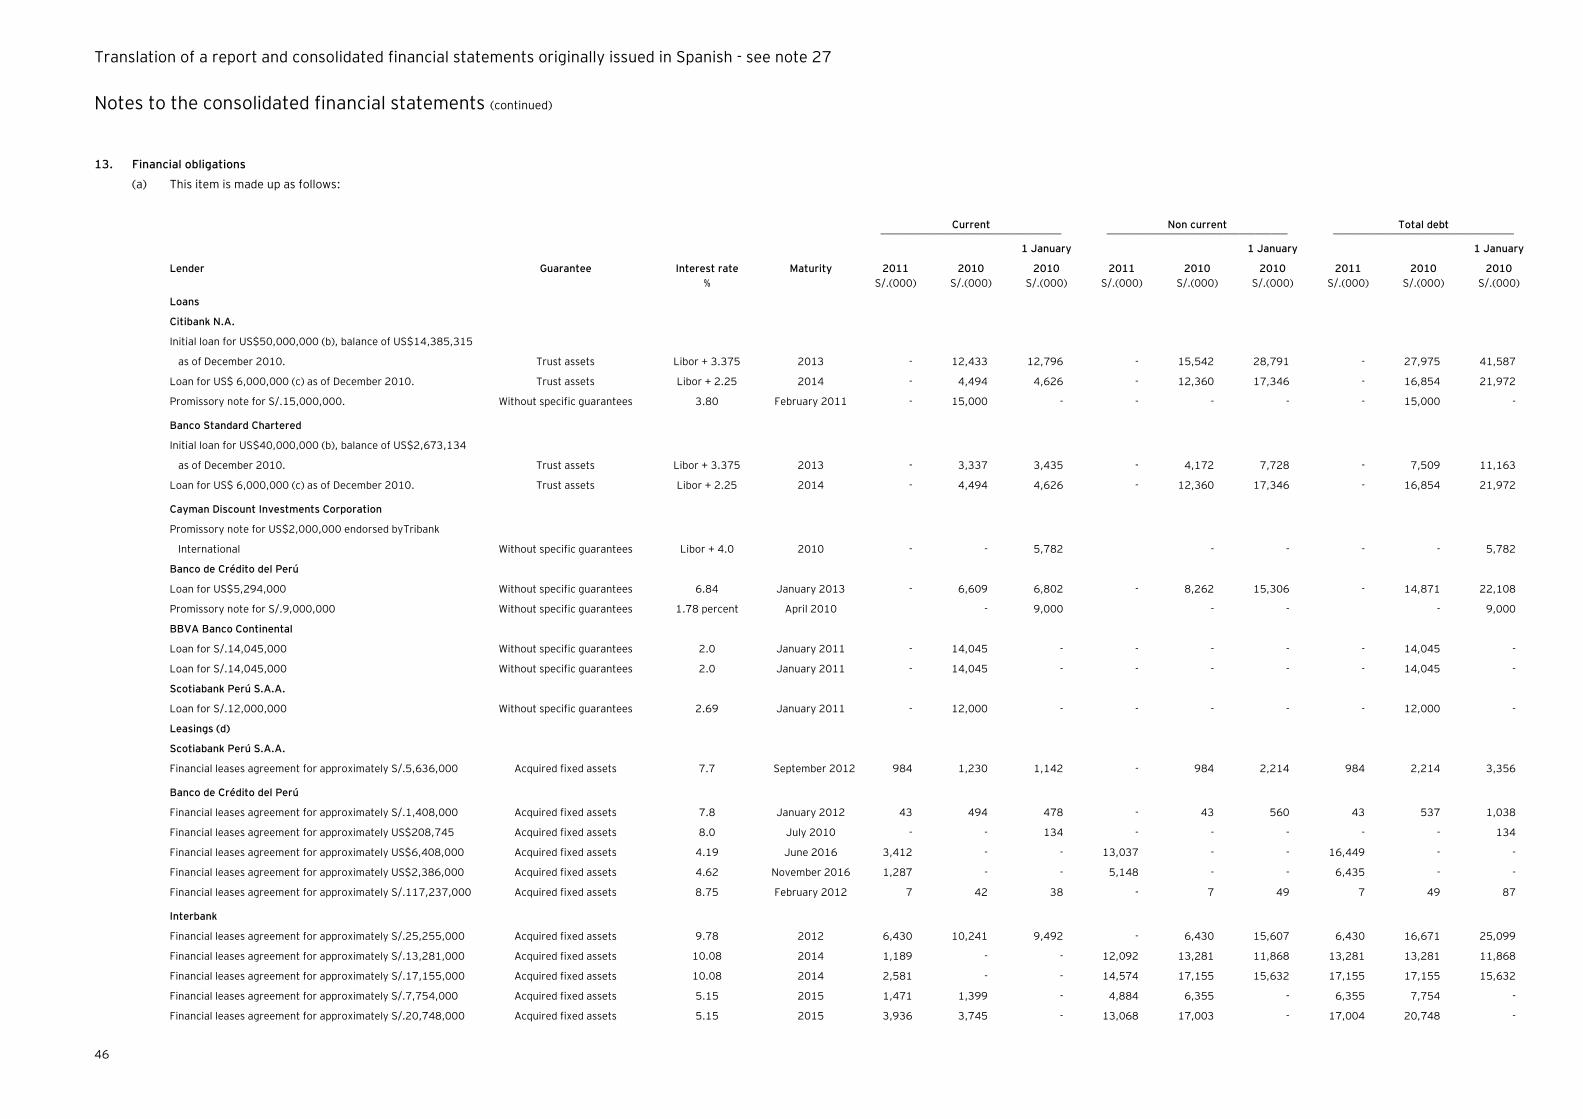
Translation of a report and consolidated financial statements originally issued in Spanish - see note 27
Notes to the consolidated financial statements (continued)
46
13. Financial obligations
(a) This item is made up as follows:
Current Non current Total debt __________________________________ __________________________________ __________________________________
Lender Guarantee Interest rate Maturity 2011 2010
1 January
2010 2011 2010
1 January
2010 2011 2010
1 January
2010
% S/.(000) S/.(000) S/.(000) S/.(000) S/.(000) S/.(000) S/.(000) S/.(000) S/.(000)
Loans
Citibank N.A.
Initial loan for US$50,000,000 (b), balance of US$14,385,315
as of December 2010. Trust assets Libor + 3.375 2013 - 12,433 12,796 - 15,542 28,791 - 27,975 41,587
Loan for US$ 6,000,000 (c) as of December 2010. Trust assets Libor + 2.25 2014 - 4,494 4,626 - 12,360 17,346 - 16,854 21,972
Promissory note for S/.15,000,000. Without specific guarantees 3.80 February 2011 - 15,000 - - - - - 15,000 -
Banco Standard Chartered
Initial loan for US$40,000,000 (b), balance of US$2,673,134
as of December 2010. Trust assets Libor + 3.375 2013 - 3,337 3,435 - 4,172 7,728 - 7,509 11,163
Loan for US$ 6,000,000 (c) as of December 2010. Trust assets Libor + 2.25 2014 - 4,494 4,626 - 12,360 17,346 - 16,854 21,972 -
Cayman Discount Investments Corporation
Promissory note for US$2,000,000 endorsed byTribank
International Without specific guarantees Libor + 4.0 2010 - - 5,782 -
- - - 5,782
Banco de Crédito del Perú
Loan for US$5,294,000 Without specific guarantees 6.84 January 2013 - 6,609 6,802 - 8,262 15,306 - 14,871 22,108
Promissory note for S/.9,000,000 Without specific guarantees 1.78 percent April 2010 - 9,000 - - - 9,000
BBVA Banco Continental
Loan for S/.14,045,000 Without specific guarantees 2.0 January 2011 - 14,045 - - - - - 14,045 -
Loan for S/.14,045,000 Without specific guarantees 2.0 January 2011 - 14,045 - - - - - 14,045 -
Scotiabank Perú S.A.A.
Loan for S/.12,000,000 Without specific guarantees 2.69 January 2011 - 12,000 - - - - - 12,000 -
Leasings (d)
Scotiabank Perú S.A.A.
Financial leases agreement for approximately S/.5,636,000 Acquired fixed assets 7.7 September 2012 984 1,230 1,142 - 984 2,214 984 2,214 3,356
Banco de Crédito del Perú
Financial leases agreement for approximately S/.1,408,000 Acquired fixed assets 7.8 January 2012 43 494 478 - 43 560 43 537 1,038
Financial leases agreement for approximately US$208,745 Acquired fixed assets 8.0 July 2010 - - 134 - - - - - 134
Financial leases agreement for approximately US$6,408,000 Acquired fixed assets 4.19 June 2016 3,412 - - 13,037 - - 16,449 - -
Financial leases agreement for approximately US$2,386,000 Acquired fixed assets 4.62 November 2016 1,287 - - 5,148 - - 6,435 - -
Financial leases agreement for approximately S/.117,237,000 Acquired fixed assets 8.75 February 2012 7 42 38 - 7 49 7 49 87
Interbank
Financial leases agreement for approximately S/.25,255,000 Acquired fixed assets 9.78 2012 6,430 10,241 9,492 - 6,430 15,607 6,430 16,671 25,099
Financial leases agreement for approximately S/.13,281,000 Acquired fixed assets 10.08 2014 1,189 - - 12,092 13,281 11,868 13,281 13,281 11,868
Financial leases agreement for approximately S/.17,155,000 Acquired fixed assets 10.08 2014 2,581 - - 14,574 17,155 15,632 17,155 17,155 15,632
Financial leases agreement for approximately S/.7,754,000 Acquired fixed assets 5.15 2015 1,471 1,399 - 4,884 6,355 - 6,355 7,754 -
Financial leases agreement for approximately S/.20,748,000 Acquired fixed assets 5.15 2015 3,936 3,745 - 13,068 17,003 - 17,004 20,748 -
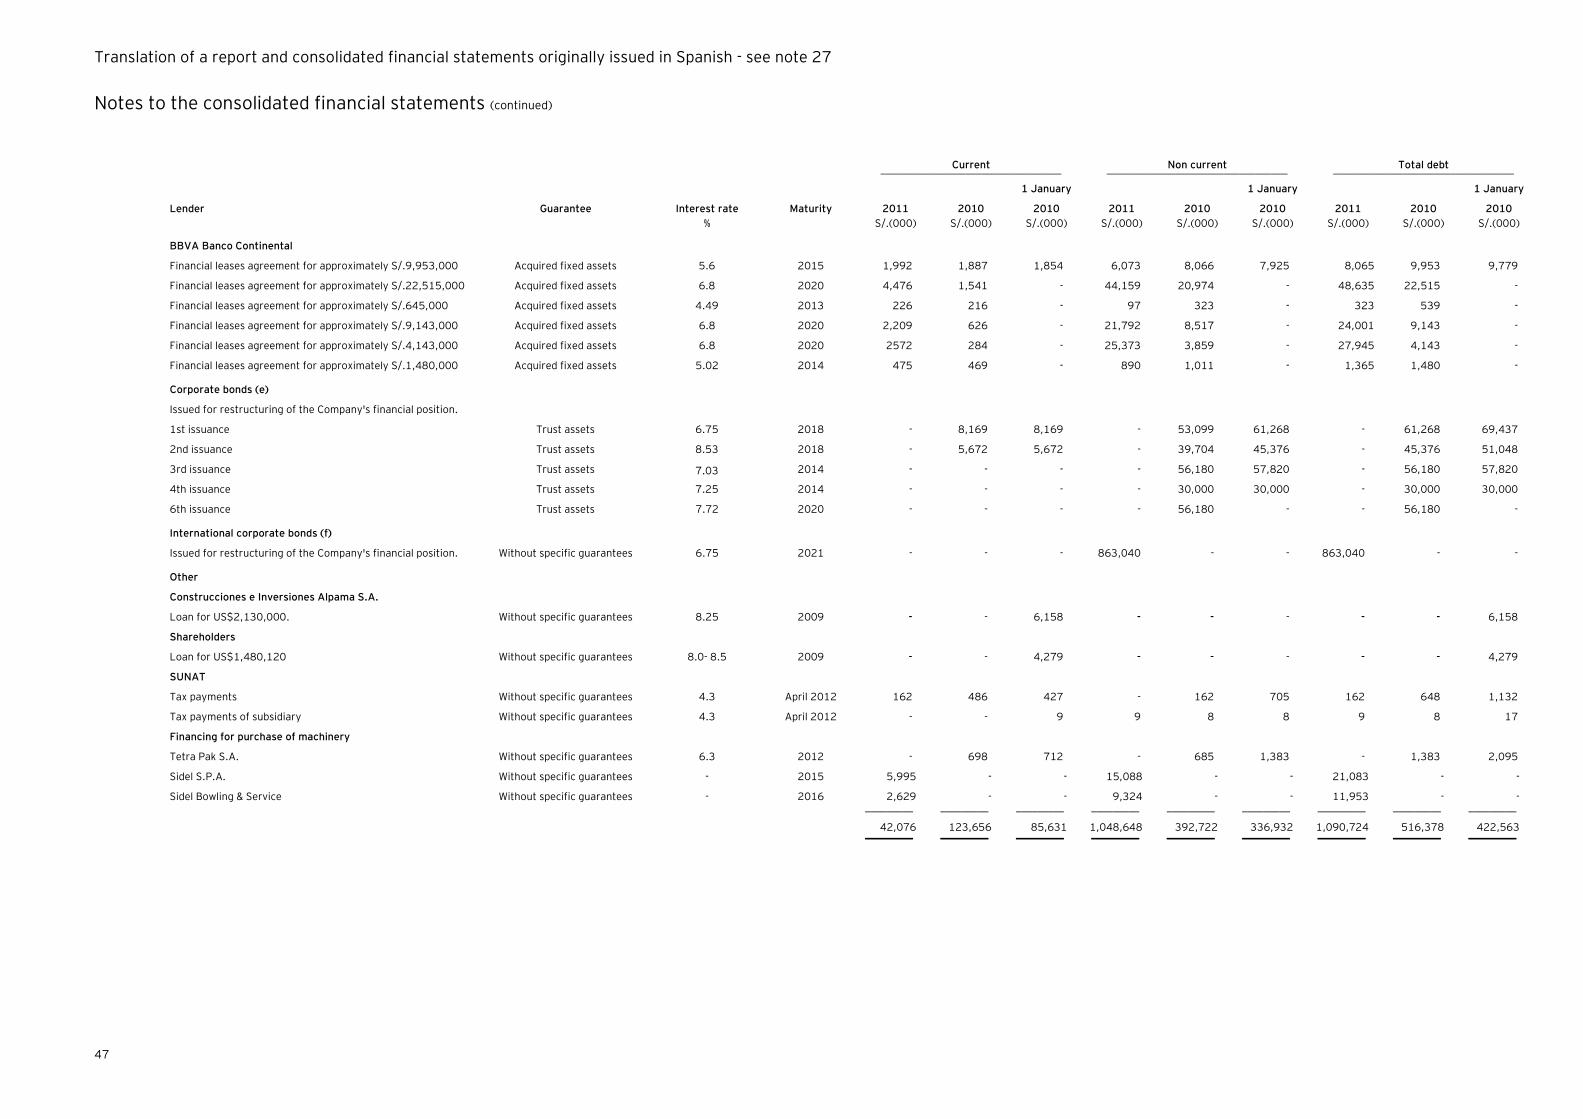
Translation of a report and consolidated financial statements originally issued in Spanish - see note 27
Notes to the consolidated financial statements (continued)
47
Current Non current Total debt __________________________________ __________________________________ __________________________________
Lender Guarantee Interest rate Maturity 2011 2010
1 January
2010 2011 2010
1 January
2010 2011 2010
1 January
2010
% S/.(000) S/.(000) S/.(000) S/.(000) S/.(000) S/.(000) S/.(000) S/.(000) S/.(000)
BBVA Banco Continental
Financial leases agreement for approximately S/.9,953,000 Acquired fixed assets 5.6 2015 1,992 1,887 1,854 6,073 8,066 7,925 8,065 9,953 9,779
Financial leases agreement for approximately S/.22,515,000 Acquired fixed assets 6.8 2020 4,476 1,541 - 44,159 20,974 - 48,635 22,515 -
Financial leases agreement for approximately S/.645,000 Acquired fixed assets 4.49 2013 226 216 - 97 323 - 323 539 -
Financial leases agreement for approximately S/.9,143,000 Acquired fixed assets 6.8 2020 2,209 626 - 21,792 8,517 - 24,001 9,143 -
Financial leases agreement for approximately S/.4,143,000 Acquired fixed assets 6.8 2020 2572 284 - 25,373 3,859 - 27,945 4,143 -
Financial leases agreement for approximately S/.1,480,000 Acquired fixed assets 5.02 2014 475 469 - 890 1,011 - 1,365 1,480 -
Corporate bonds (e)
Issued for restructuring of the Company's financial position.
1st issuance Trust assets 6.75 2018 - 8,169 8,169 - 53,099 61,268 - 61,268 69,437
2nd issuance Trust assets 8.53 2018 - 5,672 5,672 - 39,704 45,376 - 45,376 51,048
3rd issuance Trust assets 7.03 2014 - - - - 56,180 57,820 - 56,180 57,820
4th issuance Trust assets 7.25 2014 - - - - 30,000 30,000 - 30,000 30,000
6th issuance Trust assets 7.72 2020 - - - - 56,180 - - 56,180 -
International corporate bonds (f)
Issued for restructuring of the Company's financial position. Without specific guarantees 6.75 2021 - - - 863,040 - - 863,040 - -
Other
Construcciones e Inversiones Alpama S.A.
Loan for US$2,130,000. Without specific guarantees 8.25 2009 - - 6,158 - - - - - 6,158
Shareholders
Loan for US$1,480,120 Without specific guarantees 8.0- 8.5 2009 - - 4,279 - - - - - 4,279
SUNAT
Tax payments Without specific guarantees 4.3 April 2012 162 486 427 - 162 705 162 648 1,132
Tax payments of subsidiary Without specific guarantees 4.3 April 2012 - - 9 9 8 8 9 8 17
Financing for purchase of machinery
Tetra Pak S.A. Without specific guarantees 6.3 2012 - 698 712 - 685 1,383 - 1,383 2,095
Sidel S.P.A. Without specific guarantees - 2015 5,995 - - 15,088 - - 21,083 - -
Sidel Bowling & Service Without specific guarantees - 2016 2,629 - - 9,324 - - 11,953 - - _________ _________ _________ _________ _________ _________ _________ _________ _________
42,076 123,656 85,631 1,048,648 392,722 336,932 1,090,724 516,378 422,563 _________ _________ _________ _________ _________ _________ _________ _________ _________

This financial statements has been prepared from the company’s accounting record
after posting all the necessary adjustments and they represent the final statements for
the corresponding audit period
____________________________
Signature
Translation of a report and consolidated financial statements originally issued in Spanish - see note 27
Notes to the consolidated financial statements (continued)
48
(b) On January 23, 2006, the Company signed a mandate letter with two financial lenders, Citibank
NA and Standard Chartered Bank, to access a medium-term financing amounting to
US$90,000,000 – with Citibank NA providing US$50,000,000 and the Standard Chartered Bank
providing US$40,000,000 -- to (i) amortize and amend the entire outstanding balance of the
syndicated loan used for the transaction indicated in note 1(b), (ii) prepay loans from suppliers,
and (iii) fund additional needs of capital expenditures. The loan term was 7 years and payments
were made quarterly beginning in March 2007 after a grace period of 1 year, bearing an interest
rate three-month Libor over 3.375 percent per year. On August 2011, the Company paid the
loan.
(c) On July 26, 2007, the Company signed a mandate letter with two financial creditors, Citibank NA
and Standard Chartered Bank, to obtain a loan up to US$30,000,000, of which to date it has
received US$20,000,000 (US$10,000,000 from each one of the creditors) to be used for
working capital and capital investment of the Company. The loan term was 7 years and the
payments began after a grace period of 1 year, quarterly from July 2008, earning an interest
rate at three months Libor plus 2.25 percent annually. On August 2011, the Company paid the
loan.
(d) During 2010, the Company entered into various lease agreements with BBVA Banco Continental
and Interbank related to the acquisition of bottling line Krones, vehicles, forklifts and
refrigeration equipment, as well as the implementation of new bottling plants and renewal of
some plants to increase the level of production, see note 9(b).
(e) The Company entered a corporate bond program for a maximum of US$150,000,000 or the
equivalent in nuevos soles to make necessary investments for growth, and to refinance, and
change its financial obligations, thereby lowering costs and increasing flexibility in managing
future cash flows, which was approved by the advance registration process of the “Primer
Programa de Bonos Corporativos Corporación José R. Lindley S.A.” (First Corporate Bond
Program Corporación Jose R. Lindley S.A.) through Executive Resolution No. 079-2007-
EF/94.06.3 issued by the Comisión Nacional Supervisora de Empresas y Valores - CONASEV on
December 14, 2007. In April and July 2008 bonds from the Primera Emisión and from Serie A of
the Segunda Emisión were issued on a single serie for a total amount of S/.81,690,000 and
S/.56,720,000 respectively. In April 2009 were issued the Tercera Emision and Cuarta Emision
for a total amount of US$20,000,000 and S/.30,000,000, respectively. In March 2010 the Sexta
Emision was issued for a total amount of US$20,000,000, while the Quinta Emision on the
amount of S/.85,000,000 approved in February 2010 is currently pending.
On December 2011, the Company made the acceleration option payment of the bonds amounting
to S/.17,600,000 approximately using the funds obtained with the international bonds issuance
indicated in (f).
This financial statements has been prepared from the company’s accounting record
after posting all the necessary adjustments and they represent the final statements for
the corresponding audit period
____________________________
Signature
Translation of a report and consolidated financial statements originally issued in Spanish - see note 27
Notes to the consolidated financial statements (continued)
49
The bonds are backed by a generic guarantee of the assets of the Company. The rights and
obligations of the bonds are secured by a trust. The trust estate includes all fixed assets,
furniture and fixtures that are necessary for the development of core business operations of the
Group and are a part of the Company‟s production units. Currently, the properties included in the
trust estate are valued at US$72,000,000 and are in process of release.
(f) On 23 November 2011, the Company made the international bonds issuance under 144
rule/Regulation S of the Stock Exchange Law of United States of America amounting to
US$320,000,000 with an interest rate of 6.75% and maturity on 23 November 2021. The
obtained funds of this international issuance were used to execute the acceleration option
payment of the local bonds of Primer Programa de Bonos Corporativos (primera, segunda,
tercera, cuarta y sexta emision), the payments of bank loans, and also support the necessary
investment for the construction and improvements of Trujillo and Lima plants.
The international bonds do not have guarantees and must meet certain administrative and
financial obligations and restrictions as follows:
- Not incur in additional debts;
- Not permit to the Subsidiary create or allow that exist a restriction to any Subsidiary
capability to pay dividends or any debt of the Company or any guarantee Subsidiary;
- Not permit to the Subsidiary guarantee debts from Lindley or any Subsidiary;
- Transfer any property or asset from Lindley or any Subsidiary;
- Not grant as collateral;
- Not perform consolidations, mergers, excisions or transfer assets;
- Not perform transactions with affiliates ; and
- Not modified the type of business that the Company performs.
In case that (i) bonds obtain investment scale at less from two risk-rating agencies and (ii) when
the bonds have been obtained the investment scale at less from two risk-rating agencies would
not happened a default in force, the mentioned covenants will be ceases (except the related to
limitation to perform grants, business changes, and other limitations like mergers,
consolidations, and transfer assets while the two risk-rating agencies maintain the investment
scale.

Translation of a report and consolidated financial statements originally issued in Spanish - see note 27
Notes to the consolidated financial statements (continued)
50
(g) Information of the financial leases agreements as of 31 December 2011, 2010 and 1 January 2010:
2011 2010 1 January 2010 _____________________________ _____________________________ _____________________________
Minimum
payments
Present value of
lease payments
Minimum
payments
Present value of
lease payments
Minimum
payments
Present value of
lease payments
S/.(000) S/.(000) S/.(000) S/.(000) S/.(000) S/.(000)
Up to 1 year 38,544 28,299 28,257 20,745 21,429 19,584
Above 1 year and more 167,196 122,749 113,616 83,413 59,927 44,828 ________ ________ ________ ________ ________ ________
Total payable amount 205,740 151,048 141,873 104,158 81,356 64,412
Less interest payable (11,263) - (15,691) - (14,363) - ________ ________ ________ ________ ________ ________
Total 194,477 151,048 126,182 104,158 66,993 64,412 ________ ________ ________ ________ ________ ________

Translation of a report and consolidated financial statements originally issued in Spanish - see note 27
Notes to the consolidated financial statements (continued)
51
14. Income tax
(a) The deferred income tax is made up as follows based on temporary differences that generate:
As of 1 January
2010
Income
(expense) Equity
As of 31 December
2010
Income
(expense) Equity
As of 31 December
2011
S/.(000) S/.(000) S/.(000) S/.(000) S/.(000) S/.(000) S/.(000)
Deferred asset
Other provisions 19,866 (2,195) - 17,671 10,002 - 27,673
Derivative financial instruments 4,087 949 (12,800) (7,764) 3,267 8,095 3,598 _________ _________ _________ _________ _________ _________ _________
23,953 (1,246) (12,800) 9,907 13,269 8,095 31,271 _________ _________ _________ _________ _________ _________ _________
Deferred liability
Voluntary revaluation of fixed assets (69,592) 4,289 - (65,303) 2,043 - (63,260)
Financial leasing operations, net of accumulated
depreciation (3,498) 230 - (3,268) 346 - (2,922)
Difference in depreciation rates (149) (42) - (191) - - (191) _________ _________ _________ _________ _________ _________ _________
(73,239) 4,477 - (68,762) 2,389 - (66,373) _________ _________ _________ _________ _________ _________ _________
Net deferred income tax liability (49,286) 3,231 (12,800) (58,855) 15,658 8,095 (35,102) _________ _________ _________ _________ _________ _________ _________
(b) The expense for income tax presented in the consolidated statement of income as of 31 December 2011 and 2010 is composed as follows:
2011 2010
S/.(000) S/.(000)
Income tax
Current (36,880) (29,252)
Deferred 15,658 3,231 ________ ________
(21,222) (26,021) ________ ________
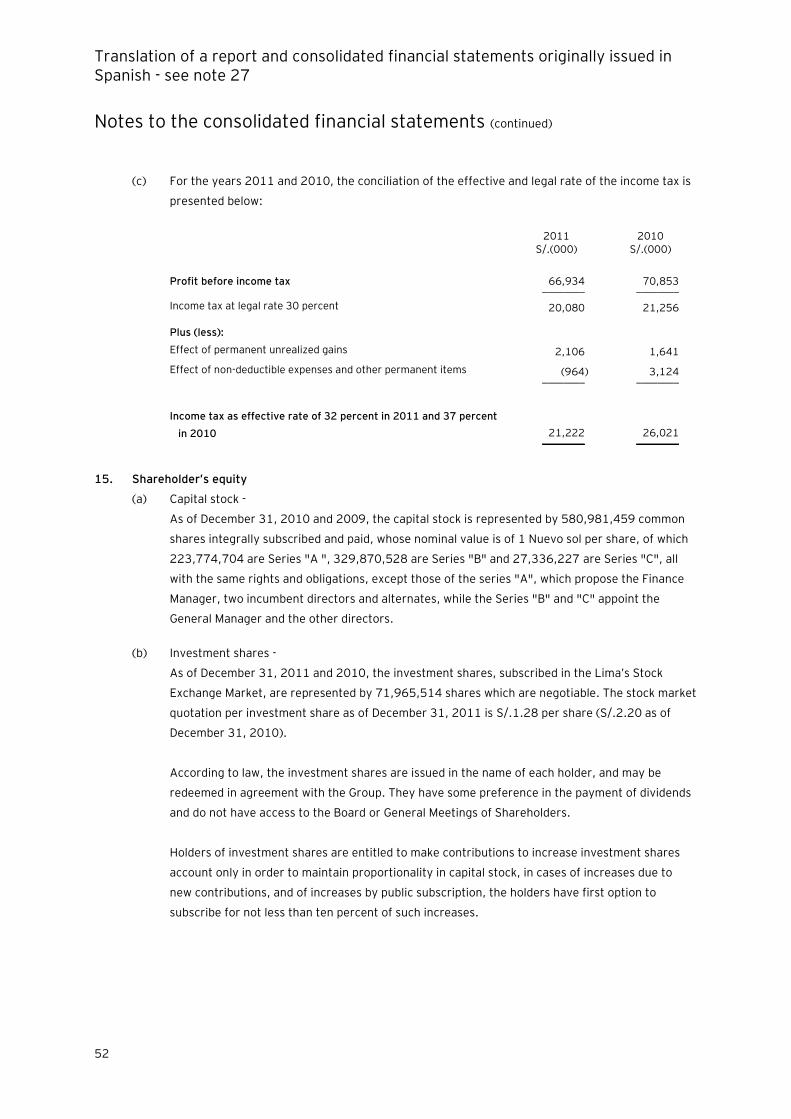
Translation of a report and consolidated financial statements originally issued in Spanish - see note 27
Notes to the consolidated financial statements (continued)
52
(c) For the years 2011 and 2010, the conciliation of the effective and legal rate of the income tax is
presented below:
2011 2010 S/.(000) S/.(000)
Profit before income tax 66,934 70,853 ________ ________
Income tax at legal rate 30 percent 20,080 21,256
Plus (less):
Effect of permanent unrealized gains 2,106 1,641
Effect of non-deductible expenses and other permanent items (964) 3,124 ________ ________
Income tax as effective rate of 32 percent in 2011 and 37 percent
in 2010 21,222 26,021 ________ ________
15. Shareholder’s equity
(a) Capital stock -
As of December 31, 2010 and 2009, the capital stock is represented by 580,981,459 common
shares integrally subscribed and paid, whose nominal value is of 1 Nuevo sol per share, of which
223,774,704 are Series "A ", 329,870,528 are Series "B" and 27,336,227 are Series "C", all
with the same rights and obligations, except those of the series "A", which propose the Finance
Manager, two incumbent directors and alternates, while the Series "B" and "C" appoint the
General Manager and the other directors.
(b) Investment shares -
As of December 31, 2011 and 2010, the investment shares, subscribed in the Lima‟s Stock
Exchange Market, are represented by 71,965,514 shares which are negotiable. The stock market
quotation per investment share as of December 31, 2011 is S/.1.28 per share (S/.2.20 as of
December 31, 2010).
According to law, the investment shares are issued in the name of each holder, and may be
redeemed in agreement with the Group. They have some preference in the payment of dividends
and do not have access to the Board or General Meetings of Shareholders.
Holders of investment shares are entitled to make contributions to increase investment shares
account only in order to maintain proportionality in capital stock, in cases of increases due to
new contributions, and of increases by public subscription, the holders have first option to
subscribe for not less than ten percent of such increases.

Translation of a report and consolidated financial statements originally issued in Spanish - see note 27
Notes to the consolidated financial statements (continued)
53
(c) Legal reserve -
The General Corporate Law requires that a minimum of 10 percent of a company‟s disposable
earnings each year must be transferred to a legal reserve until the reserve reaches an amount
equivalent to 20 percent of the Company‟s capital stock. The legal reserve can compensate
losses or can be capitalized. In both cases, it is mandatory to replenish it.
16. Tax situation and contingencies
(a) The Group is subject to the Peruvian tax system. As of 31 December 2011 and 2010 the income
tax rate was 30 percent of taxable income.
Companies not domiciled in Peru and individuals must pay an additional tax of 4.1 percent over
received dividends.
(b) Since year 2010, the capital gains resulting from the disposal of marketable securities through
centralized negotiation mechanism in Peru are taxable.
In this context, the Income Tax Law indicated that, to establish the income tax produced by the
disposal of marketable securities acquired before January 1, 2010, the taxable cost of those
marketable securities will be the quote price at the year end taxable 2009 or the acquisition cost
or the equity value, whichever is greater.
This rule is applicable for entities when the marketable securities will be disposed inside or
outside of a centralized negotiation mechanism.
Also, when the disposal have been made, redemption or share and participation rescue, acquired
or received by the tax person in different ways and opportunities, the taxable cost will be
composed of the weighted average cost. It is important to mention that the weighted average
cost will be equivalent to the result of the taxable cost, related to the acquired marketable
security in a specific moment by the number of shares, divided by the total acquired shares.
(c) With the purpose of determining the income tax and the value added tax, the transfer prices
among related parties and for transactions with companies domiciled in countries considered tax
havens, prices should be supported by documentation containing information about the valuation
methods applied and criteria used in its determination. Based on an analysis of the Group‟s
operations, Management and its legal advisors do not believe that the new regulations will result
in significant contingencies for the Company as of 31 December 2011 and 2010.

Translation of a report and consolidated financial statements originally issued in Spanish - see note 27
Notes to the consolidated financial statements (continued)
54
(d) Tax authority is legally entitled to review, and if applicable, adjust the income tax and value
added tax computed by the Group and the related parties absorbed by Lindley during the four
subsequent years to the year of the related tax return filing. The income tax and value added tax
returns of the Group and the related parties that are pending review by the Tax Authority are the
followings:
Years open to fiscal review ______________________________________________
Company Income tax Value added tax
Corporación Lindley S.A. 2008 to 2011 2008 to 2011
Embotelladora La Selva S.A. 2007 to 2011 2007 to 2011
(e) Due to various possible interpretations of current legislation, it is not possible to determine
whether or not future reviews will result in tax liabilities for the Group. In the event that
additional taxes payable, interest and surcharges result from tax authority reviews, they will be
charged to expense in the period assessed and paid. However, in the Management‟s and its legal
advisors‟ opinion, any additional tax assessment would not be significant to the financial
statements as of 31 December 2011 and 2010.
(f) As of 31 December 2011, the Group is pursuing reclamations from the Tax Authority and other
legal and labor proceedings totaling approximately S/.62 million and US$0.6 million
(approximately S/.78 million and US$1.7 million as of December 31, 2010) that are pending of
final judicial verdict. Management and legal advisors consider that these processes probably will
have an unfavorable result for the Group amounting to approximately S/.32,738,000
(S/.34,660,000 as of December 31, 2010), which have been recognized by the Group (see note
12(b)); also estimate that the demands classified as remote or possible will be resolved favorably
to the Group.

Translation of a report and consolidated financial statements originally issued in Spanish - see note 27
Notes to the consolidated financial statements (continued)
55
17. Net sales
(a) This item is made up as follows:
2011 2010
S/.(000) S/.(000)
Carbonated 1,642,975 1,457,363
Water 197,861 196,947
No carbonated 237,555 180,010
Others 6,322 31,218 __________ __________
2,084,713 1,865,538
Less discounts (316,901) (327,489) __________ __________
1,767,812 1,538,049 __________ __________
(b) As of 31 December 2011 and 2010, it was sold 259 and 236 million units, respectively.
(Unaudited).
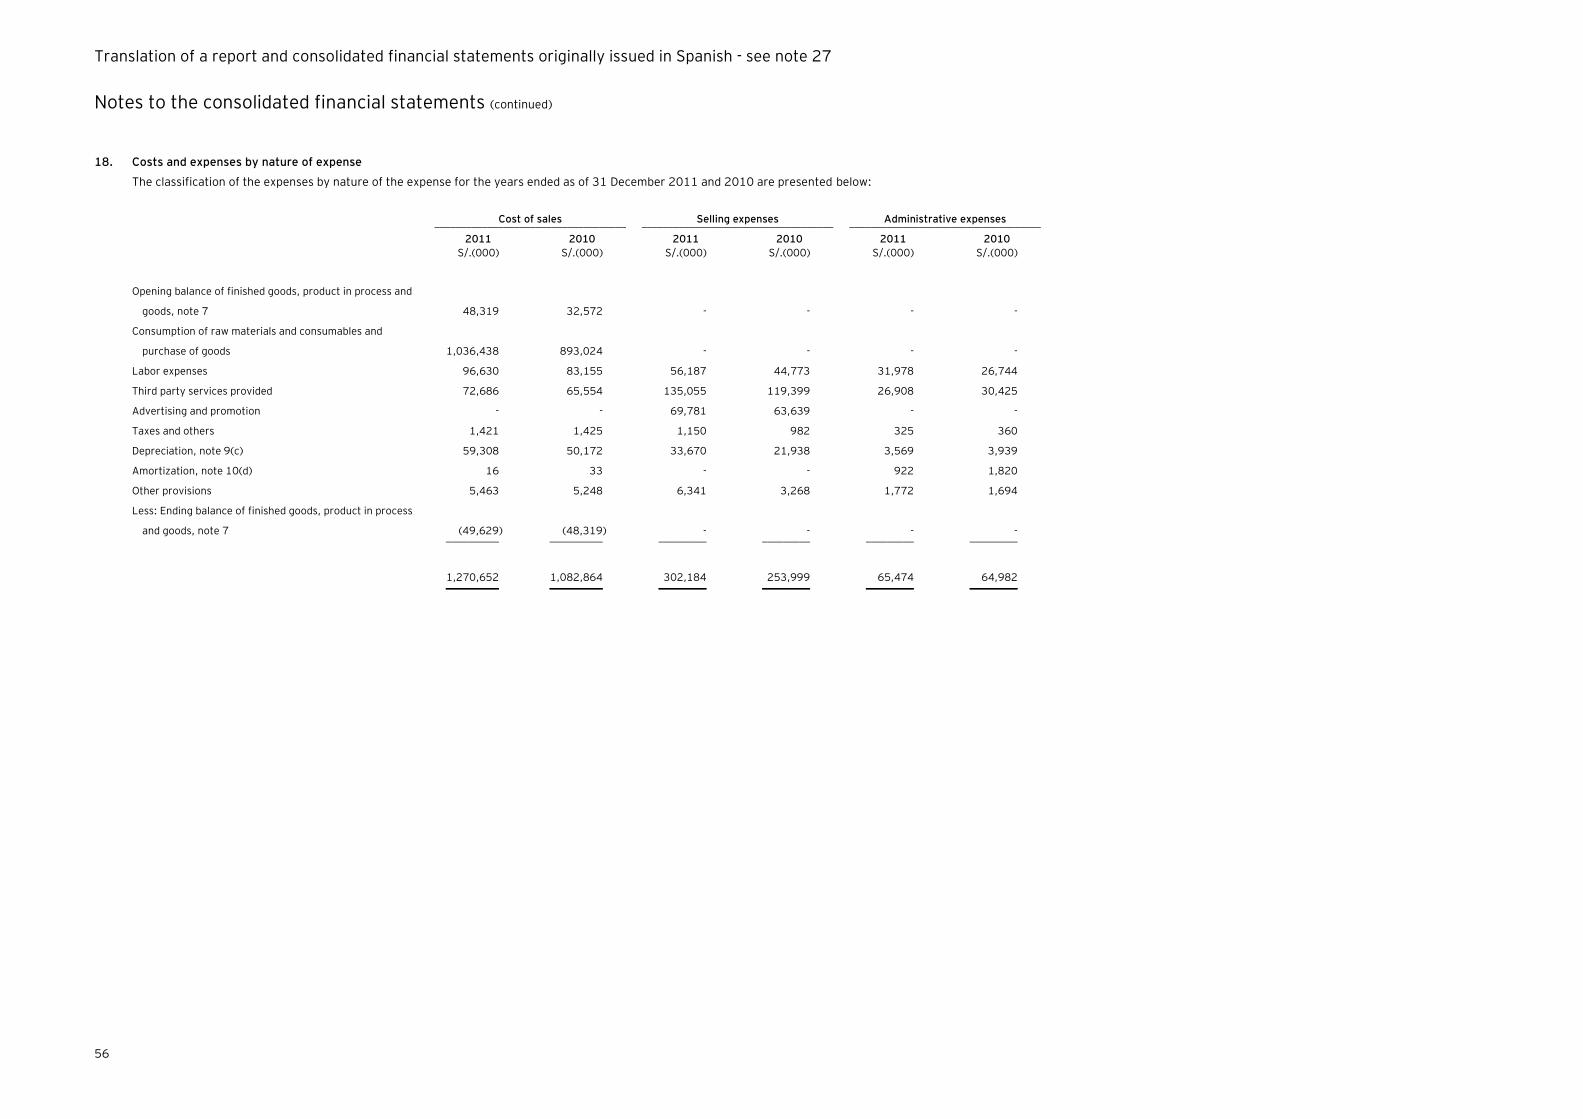
Translation of a report and consolidated financial statements originally issued in Spanish - see note 27
Notes to the consolidated financial statements (continued)
56
18. Costs and expenses by nature of expense
The classification of the expenses by nature of the expense for the years ended as of 31 December 2011 and 2010 are presented below:
Cost of sales Selling expenses Administrative expenses ____________________________________ ____________________________________ ____________________________________
2011 2010 2011 2010 2011 2010
S/.(000) S/.(000) S/.(000) S/.(000) S/.(000) S/.(000)
Opening balance of finished goods, product in process and
goods, note 7 48,319 32,572 - - - -
Consumption of raw materials and consumables and
purchase of goods 1,036,438 893,024 - - - -
Labor expenses 96,630 83,155 56,187 44,773 31,978 26,744
Third party services provided 72,686 65,554 135,055 119,399 26,908 30,425
Advertising and promotion - - 69,781 63,639 - -
Taxes and others 1,421 1,425 1,150 982 325 360
Depreciation, note 9(c) 59,308 50,172 33,670 21,938 3,569 3,939
Amortization, note 10(d) 16 33 - - 922 1,820
Other provisions 5,463 5,248 6,341 3,268 1,772 1,694
Less: Ending balance of finished goods, product in process
and goods, note 7 (49,629) (48,319) - - - - __________ __________ _________ _________ _________ _________
1,270,652 1,082,864 302,184 253,999 65,474 64,982 __________ __________ _________ _________ _________ _________

Translation of a report and consolidated financial statements originally issued in Spanish - see note 27
Notes to the consolidated financial statements (continued)
57
19. Other operating income and expenses
These items are made as follows:
2011 2010
S/.(000) S/.(000)
Income
Sale of bottles and boxes 26,572 34,641
Sale of property, plant and equipment 5,989 22,791
Sale of services, raw materials, advertising material and others 27,838 10,529
Rentals 912 945
Various 5,163 5,909 __________ __________
66,474 74,815 __________ __________
Expenses
Cost of sale of bottles and boxes 26,643 35,889
Retirements of inventories, bottles and boxes 26,616 27,252
Provisions for contingencies, termination of personnel and others 14,957 25,549
Net cost of disposal of properties, plant and equipment 3,038 15,605
Depreciation of packaging and others, note 9(d) 2,654 3,338
Cost of sale of services, raw materials, advertising material and
others 5,867 2,775 __________ __________
79,775 110,408 __________ __________
20. Financial income and expenses
This item is made up as follows:
2011 2010
S/.(000) S/.(000)
Income
Income from deposits in bank and others 2,223 2,440
Income from loans from related parties 2,392 2,439
Exchange rate gain 55,304 21,064 __________ __________
59,919 25,943 __________ __________
Expenses
Interests and expenses from long term financial obligations 50,644 28,825
Interests from loans and others 19,291 13,806
Interests from related parties, note 21 204 912
Exchange rate loss 36,695 15,756 __________ __________
106,834 59,299 __________ __________

Translation of a report and consolidated financial statements originally issued in Spanish - see note 27
Notes to the consolidated financial statements (continued)
58
21. Transactions with related parties
(a) During the years 2011 and 2010, the Company has mainly performed the following transactions
with related parties:
2011 2010
S/.(000) S/.(000)
Income
Recovery of expenses related to marketing and advertising
cooperative agreement (e) 25,771 29,836
Income from incident concentrates 11,545 7,603
Sale of packaging and boxes 10 5,025
Interests. 2,374 2,439
Sale of finished goods, goods and others 1,029 522
Others 2,490 920 _________ _________
43,219 46,345 _________ _________
Costs and expenses
Purchase of concentrates (f) 346,964 344,930
Security services 2,738 2,311
Interest expenses. - 763
Advertising expenses - 338
Consulting 677 772
Other 2,878 1,598 _________ _________
353,257 350,712 _________ _________
The Group performs its operations with related parties under the same conditions as those
performed with third parties, and therefore, no difference exists in pricing policies or the
settlement of tax base. Forms of payment also not differ from policies applied to third parties.

Translation of a report and consolidated financial statements originally issued in Spanish - see note 27
Notes to the consolidated financial statements (continued)
59
(b) The balances of the accounts receivable from and accounts payable to the related parties are
presented below:
2011 2010
1 January
2010
S/.(000) S/.(000) S/.(000)
Accounts receivable:
Trade accounts receivable
Embotelladora Bagua S.A. - 319 319
Coca Cola Servicios del Perú S.A. 559 23 40 _________ _________ ________
559 342 359 _________ _________ ________
Other accounts receivable -
Corporación Inca Kola Perú S.R.L. (e) 2,106 24,219 162
Coca Cola Servicios del Perú S.A. (e) 13,216 8,571 7,280
Latin American Finance LLC (d) 38,839 38,043 36,634
Other 139 134 19 _________ _________ ________
54,300 70,967 44,095 _________ _________ ________
Total 54,859 71,309 44,454 ________ ________ _______
Accounts payable
Coca Cola Chile S.A. (f) 53,073 38,715 12,902
Coca Cola Servicios del Perú S.A. (f) 15,929 14,199 10,497
Corporación Inca Kola Perú S.R.L. (f) 23,479 19,182 2,664
Other 1,838 102 327 _________ _________ ________
Total 94,319 72,198 26,390 ________ ________ _______
(c) The salary expenses of the Board members and key Management of the Group were
S/.10,037,000, S/.10,615,000 and S/.9,600,000 during the years 2011 and 2010 respectively.
(d) The item corresponds to US$12,550,000 loan granted to Latin American Finance LLC (a
company incorporated in United States of America), according to contract signed in November
2009, the loan bears an annual interest rate of 7 percent and matures in the short term. The
legal representative of the related parties has become as guarantor of the obligations. During
2011, the Group recognized interest income amounting to S/.2,374,000 (S/.2,439,000 for the
year 2010).
Translation of a report and consolidated financial statements originally issued in Spanish - see note 27
Notes to the consolidated financial statements (continued)
60
(e) The item corresponds to the support provided by Coca Cola Servicios del Perú S.A. and
Corporación Inca Kola Peru S.R.L. through cooperative agreements for the promotion and
marketing activities carried out by the Group in order to increase the market share of the brands
that related parties represent and mainly include purchases of packaging, exhibiting and
advertising campaigns.
(f) The item corresponds to the purchase of bases and concentrates used in the production of drinks
of the different brands that the related parties represent and the Group sells.

Translation of a report and consolidated financial statements originally issued in Spanish - see note 27
Notes to the consolidated financial statements (continued)
61
22. Fair value of financial instruments
The comparison between the carrying value and fair value of financial assets and liabilities presented in the consolidated financial statements at 31 December
2011, 2010 and 1 January 2010 is as follows:
Book value Fair value __________________________________________________ _________________________________________________
2011 2010 1 January 2010 2011 2010 1 January 2010
S/.(000) S/.(000) S/.(000) S/.(000) S/.(000) S/.(000)
Financial assets
Cash and cash equivalents 357,355 42,345 35,442 357,355 42,345 35,442
Net accounts receivable 152,770 96,717 71,770 152,770 96,717 71,770
Accounts receivable from related parties 54,859 71,309 44,454 54,859 71,309 44,454
Net other financial assets 41,082 59,108 28,839 41,082 59,108 28,839 _________ ________ _________ _________ _________ _________
606,066 269,479 180,505 606,066 269,479 180,505 _________ ________ _________ _________ _________ _________
Financial liabilities
Trade accounts payable 256,242 228,707 154,722 256,242 228,707 154,722
Accounts payable to related parties 94,319 72,198 26,390 94,319 72,198 26,390
Other financial liabilities 140,327 114,876 103,828 140,327 114,876 103,828
Corporate bonds 863,040 249,004 208,305 882,955 256,398 215,983
Financial instruments 18,384 10,763 13,687 18,384 10,763 13,687
Financial leasing 194,477 126,181 66,993 151,048 104,158 64,412
Bank loans - 139,154 133,584 - 139,154 133,584
Other financial obligations 33,207 2,039 13,681 33,207 2,039 13,681 _________ ________ _________ _________ _________ _________
1,599,996 942,922 721,190 1,576,482 928,293 726,287 _________ ________ _________ _________ _________ _________
The fair value of financial liabilities is the amount by which the instruments can be exchanged between concerned parties or willing parties conducting an arm's
length transaction without deduction of transaction costs on its possible sale, not in forced, urgent, or involuntary liquidation.
Based on the criteria described above, management believes that there are not significant differences between the carrying value and fair value of financial
instruments of the Group at 31 December 2011, 2010 and 1 January 2010.

Translation of a report and consolidated financial statements originally issued in Spanish - see note 27
Notes to the consolidated financial statements (continued)
62
The methodologies and assumptions used to determine fair values depend on the terms and risk
characteristics of the various financial instruments and include the following:
- The cash and cash equivalents have short-term maturity and do not have significant credit or
interest, for that reason the fair value of cash and cash equivalents approximate their book value.
- Fair value of trade accounts receivable is similar to their book value due to these accounts are
mainly in short-term and are presented net of its allowance of doubtful accounts.
- In the case of current financial obligations, trade and other accounts payable is similar to their
book value due to these accounts have current maturities.
- In the case of the long-term loans, since their conditions and the interest rates that accrued are
market based, Management believes that their carrying values do not differ significantly from
their respective market fair values.
- In the case of derivatives financial instruments, these are recognized at fair value, and therefore,
are not different from their respective book values.
Based in the aforementioned analysis, Management estimates that the book values of the financial
instruments do not differ significantly from their estimated market value as of 31 December 2011,
2010 and 1 January 2010.
Fair value hierarchy
The Group uses the following hierarchy for determining and disclosing the fair value of financial
instruments by valuation technique:
►- Level 1: quoted (unadjusted) prices in active markets for identical assets or liabilities.
- Level 2: other techniques for which all inputs which have a significant effect on the recorded fair
value are observable, either directly or indirectly.
- Level 3: techniques which use inputs that have a significant effect on the recorded fair value that
are not based on observable market data.

Translation of a report and consolidated financial statements originally issued in Spanish - see note 27
Notes to the consolidated financial statements (continued)
63
As of 31 December 2011, 2010 and 1 January 2010, the Group maintains the following financial
instruments measured at fair value:
2011 2010
As of 1 January
2010
S/.(000) S/.(000) S/.(000)
Assets measured at fair value:
Level 2
Future sugar contracts BNP Paribas 19,050 34,342 6,700 _________ _________ _________
Liabilities measured at fair value:
Level 2
Currency forwards 11,991 1,472 -
Cross currency swap – BBVA Continental 5,094 5,249 6,768
Interest rate swap - Citigroup 721 2,244 3,841
Interest rate swap – JP Morgan N.A. 578 1,798 3,078 _________ _________ _________
18,384 10,763 13,687 _________ _________ _________
During the years 2011 and 2010, there were not transfers between hierarchy levels from level 2 to
other. The Group does not maintain assets or liabilities measured at level 1 and 3.
23. Earning per share
During the years 2011 and 2010 there have been no equity transactions in the capital account and
equity investment, so the number of common and investment shares outstanding and the weighted
average at closing date of both years is as follows:
Common shares 580,981,459
Investment shares 71,965,514 _____________
Total 652,946,973 _____________
The calculation of the earnings per shares as of 31 December 2011 and 2010 is presented below:
Net income
(numerator)
Shares in
thousands
(denominator)
Earnings per
share
S/.(000) S/.
As of 31 December 2011
Basic and diluted profit per shares of the common and
investment shares 45,711 652,947 0.0700 _________ _________ _________
As of 31 December 2010
Basic and diluted profit per shares of the common and
investment shares 44,045 652,947 0.0675 _________ _________ _________
Translation of a report and consolidated financial statements originally issued in Spanish - see note 27
Notes to the consolidated financial statements (continued)
64
24. Financial risk management
In the normal course of its operations, the Group is exposed to financial risks that include the effects of
variations in interest rates, exchange rates, credit and liquidity. The managing risk program of the
Company tries to minimize the potential effects that affect its financial development.
The Management knows the existing conditions of the market, and based in its knowledge and
experience, controls the liquidity, exchange and credit risk, following the approved policies by the
Board. The most significant aspects for managing these risks are the following:
(i) Market risk -
Market risk is the risk that the fair values of the future cash flows of a financial instrument will
fluctuate because of changes in market prices. The market prices comprise three types of risks:
interest rate risk, currency risk and share investment risk. In the case of the Group, the financial
instruments affected by the market risks include deposits and obligations with financial entities
and third parties in short and long term, which are exposed to currency and interest rate risk.
The sensitivity analysis in the following section is as of 31 December 2011, 2010 and 1 January
2010, and was prepared considering that the net debt amount, the fixed interest rate of debt,
and the financial instruments‟ proportion in foreign currency are constant.
The sensitivity calculations assumed the following:
- Sensitivity in equity is related to the hedge derivatives financial instruments.
- Sensitivity in the consolidated statement of income is the effect of the changes assumed
in the respective market risk. This assumption was based on the financial assets and
liabilities as of 31 December 2011and 2010, including the effect of the hedge derivatives
financial instruments.
(ii) Interest rate risk -
Interest rate risk is the risk that the fair value or future cash flows of a financial instrument will
fluctuate because of changes in market interest rates. The Group‟s exposure to the risk of
changes in market interest rates relates primarily to the Group‟s long-term debt obligations with
floating interest rates.
The Group manages its interest rate risk through obtaining fixed interest rate debt and by
matching interest rates on active and passive instruments. In addition, when it is necessary, the
Group enters into hedge agreements (cross currency swaps) to exchange variable interest rates
for fixed rates, see note 25.
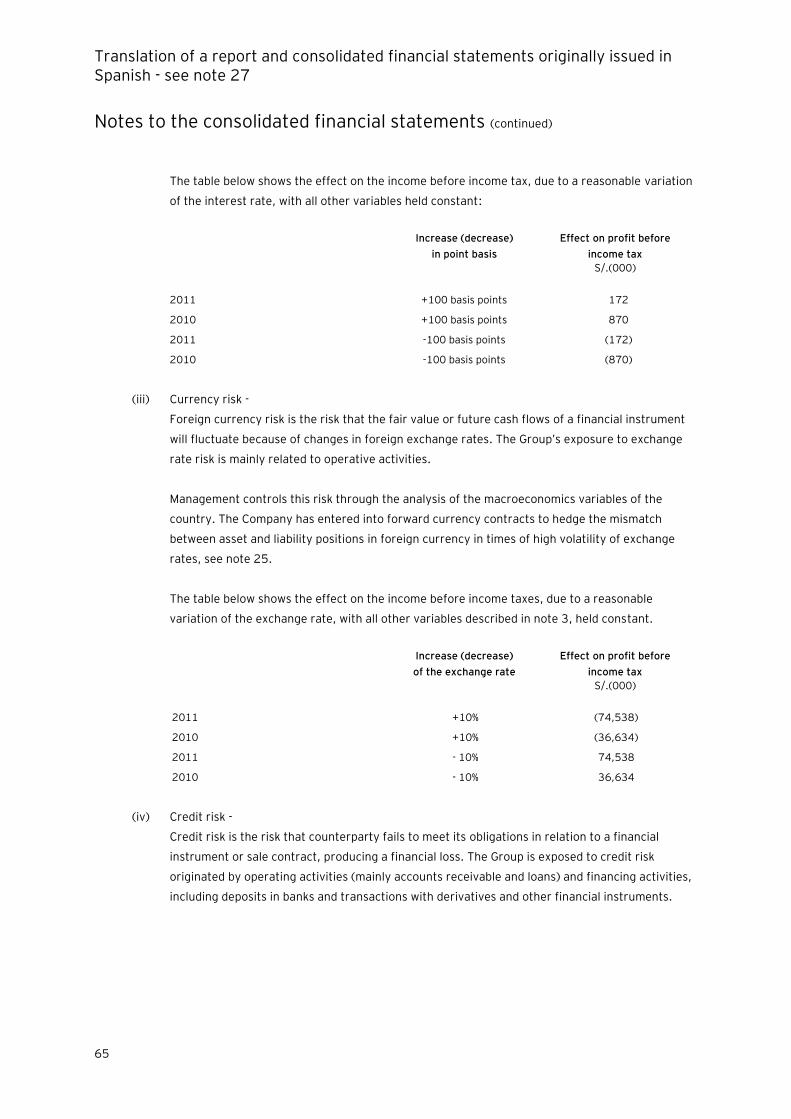
Translation of a report and consolidated financial statements originally issued in Spanish - see note 27
Notes to the consolidated financial statements (continued)
65
The table below shows the effect on the income before income tax, due to a reasonable variation
of the interest rate, with all other variables held constant:
Increase (decrease)
in point basis
Effect on profit before
income tax
S/.(000)
2011 +100 basis points 172
2010 +100 basis points 870
2011 -100 basis points (172)
2010 -100 basis points (870)
(iii) Currency risk -
Foreign currency risk is the risk that the fair value or future cash flows of a financial instrument
will fluctuate because of changes in foreign exchange rates. The Group‟s exposure to exchange
rate risk is mainly related to operative activities.
Management controls this risk through the analysis of the macroeconomics variables of the
country. The Company has entered into forward currency contracts to hedge the mismatch
between asset and liability positions in foreign currency in times of high volatility of exchange
rates, see note 25.
The table below shows the effect on the income before income taxes, due to a reasonable
variation of the exchange rate, with all other variables described in note 3, held constant.
Increase (decrease)
of the exchange rate
Effect on profit before
income tax
S/.(000)
2011 +10% (74,538)
2010 +10% (36,634)
2011 - 10% 74,538
2010 - 10% 36,634
(iv) Credit risk -
Credit risk is the risk that counterparty fails to meet its obligations in relation to a financial
instrument or sale contract, producing a financial loss. The Group is exposed to credit risk
originated by operating activities (mainly accounts receivable and loans) and financing activities,
including deposits in banks and transactions with derivatives and other financial instruments.
Translation of a report and consolidated financial statements originally issued in Spanish - see note 27
Notes to the consolidated financial statements (continued)
66
Credit risk arises from the inability of debtors of the Group to comply with its payment
obligations as they fall due (without taking into account the fair value of any collateral or other
securities as collateral); the failure of counterparties transactions in cash and cash equivalent if
any, is limited to balances in bank accounts and accounts receivable as of the date of the
consolidated statement of financial position. Thus, the Group deposits their surplus funds in first
class financial institutions, provides conservative credit policies, and continuously evaluates
market conditions in which it operates. Accordingly, the Group expects to incur significant losses
for credit risk, see notes 4, 5 and 6.
(v) Liquidity risk -
The Group controls its liquidity risk using a projected cash flow at short and long term.
The objective of the Group is to maintain a balance between continuity of funding and flexibility
through an appropriate number of credit sources and the capacity to settle and repay debts. The
Group has sufficient credit capacity that allows access to credit in first class financial institutions
on reasonable terms.

Translation of a report and consolidated financial statements originally issued in Spanish - see note 27
Notes to the consolidated financial statements (continued)
67
The table below summarizes the maturity profile of the Company‟s financial assets and liabilities at 31 December 2011, 2010 and 1 January 2010 based on
contractual undiscounted payments.
Less than 1 year
Between 1 and 2
years
Between 2 and 5
years
Between 6 years
and above Total
S/.(000) S/.(000) S/.(000) S/.(000) S/.(000)
As of 31 December 2011
Cash and cash equivalents 357,355 - - - 357,355
Financial obligations and derivative financial instruments,
note 13 and 25 (58,362) (8,784) (979,098) (62,864) (1,109,108)
Trade accounts payable and other financial liabilities,
notes 11 and 12 (396,570) - - - (396,570)
Accounts payable from related parties, note 21 (94,319) - - - (94,319) _________ _________ _________ _________ _________
(191,896) (8,784) (979,098) (62,864) (1,242,642) _________ _________ _________ _________ _________
As of 31 December 2010
Cash and cash equivalents 42,345 - - - 42,345
Financial obligations and derivative financial instruments,
note 13 and 25 (129,170) (69,187) (211,894) (116,890) (527,141)
Trade accounts payable and other financial liabilities,
notes 11 and 12 (343,583) - - - (343,583)
Accounts payable from related parties, note 21 (72,198) - - - (72,198) _________ _________ _________ _________ _________
(502,606) (69,187) (211,894) (116,890) (900,577) _________ _________ _________ _________ _________
As of 1 January 2010
Cash and cash equivalents 35,442 - - - 35,442
Financial obligations and derivative financial instruments,
note 13 and 25 (92,550) (60,998) (194,882) (87,820) (436,250)
Trade accounts payable and other financial liabilities,
notes 11 and 12 (258,550) - - - (258,550)
Accounts payable from related parties, note 21 (26,390) - - - (26,390) _________ _________ _________ _________ _________
(342,048) (60,998) (194,882) (87,820) (685,748) _________ _________ _________ _________ _________

Translation of a report and consolidated financial statements originally issued in Spanish - see note 27
Notes to the consolidated financial statements (continued)
68
(vi) Capital management -
The Group‟s objective when managing capital is to ensure that it maintains a strong credit rating
and healthy capital ratios in order to support its business and maximize shareholder value,
accomplish its administrative and financial obligations and restrictions agreed with financial
creditors and bondholders.
The Group manages its capital structure and makes the necessary adjustments, in accordance
with the changes in economic conditions. To maintain or adjust the capital structure, the Group
may adjust the dividend payment to shareholders, return capital to shareholders or issue new
shares.
No changes were made in objectives, policies and processes during the years ending as of 31
December 2011 and 2010.
The Group monitors capital using a gearing ratio, which is net debt divided by total capital plus
net debt. The Group‟s policy is to maintain a gearing ratio of no more than 60 percent. Within
the net debt calculation, the Company includes obligations with banks and financial institutions
and trade and other account payables, less cash and cash equivalents balance. The capital
includes capital stocks, reserves and retained earnings.
The table below shows the calculation of gearing ratio as of 31 December 2011, 2010 and 1
January 2010:
2011
2010
1 January
2010
S/.(000) S/.(000) S/.(000)
Financial obligations 1,109,108 527,141 436,250
Trade accounts payable and other 504,762 427,675 315,569
Less – cash and cash equivalents (357,355) (42,345) (35,442) __________ __________ __________
Net debt (a) 1,256,515 912,471 716,377
Shareholders‟ equity 710,737 688,842 624,136 __________ __________ __________
Shareholders‟ equity and net debt (b) 1,967,252 1,601,313 1,340,513 __________ __________ __________
Gearing ratio (a / b) 64% 57% 53% __________ __________ __________
(vii) Commodity price risk -
The Group is exposed to the volatility of certain commodities, such as sugar, which is the main
raw material for the soft drinks production. The Group has developed a strategy for manage and
mitigate this risk; the Group has signed futures contracts to buy sugar to hedge the risk of price
volatility in the London and New York markets and a swap of sugar price. See note 25.
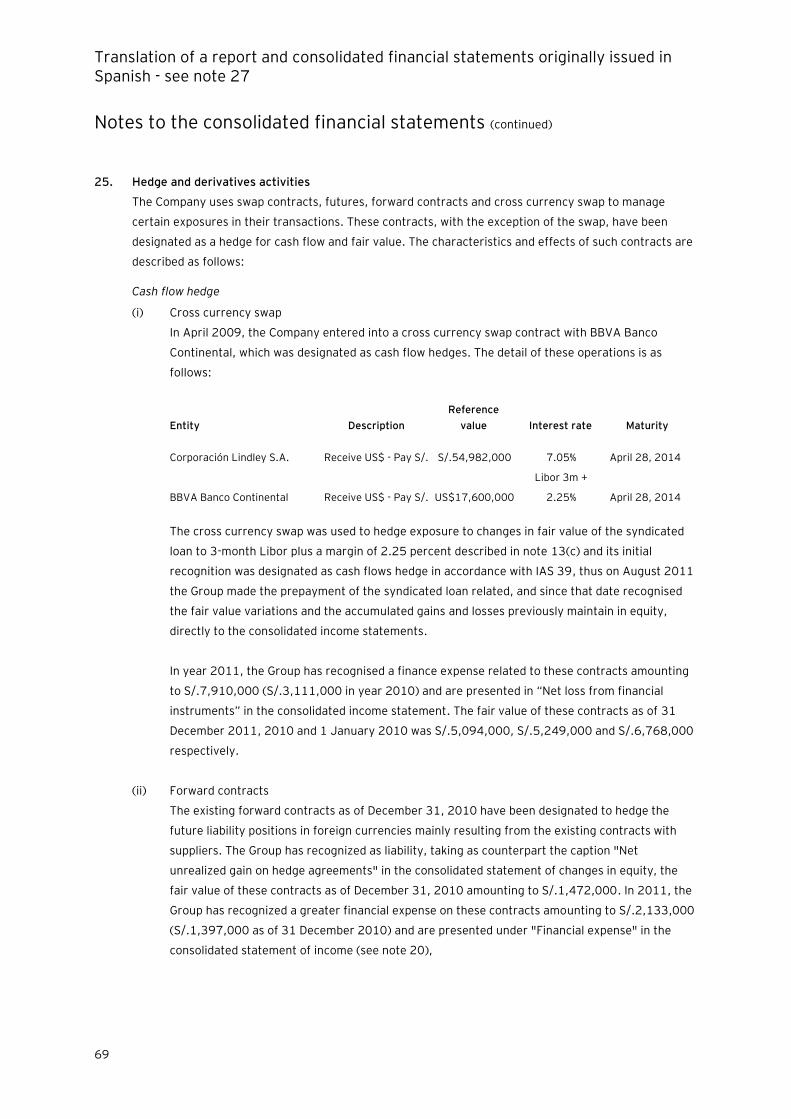
Translation of a report and consolidated financial statements originally issued in Spanish - see note 27
Notes to the consolidated financial statements (continued)
69
25. Hedge and derivatives activities
The Company uses swap contracts, futures, forward contracts and cross currency swap to manage
certain exposures in their transactions. These contracts, with the exception of the swap, have been
designated as a hedge for cash flow and fair value. The characteristics and effects of such contracts are
described as follows:
Cash flow hedge
(i) Cross currency swap
In April 2009, the Company entered into a cross currency swap contract with BBVA Banco
Continental, which was designated as cash flow hedges. The detail of these operations is as
follows:
Entity Description
Reference
value Interest rate Maturity
Corporación Lindley S.A. Receive US$ - Pay S/. S/.54,982,000 7.05% April 28, 2014
BBVA Banco Continental Receive US$ - Pay S/. US$17,600,000
Libor 3m +
2.25% April 28, 2014
The cross currency swap was used to hedge exposure to changes in fair value of the syndicated
loan to 3-month Libor plus a margin of 2.25 percent described in note 13(c) and its initial
recognition was designated as cash flows hedge in accordance with IAS 39, thus on August 2011
the Group made the prepayment of the syndicated loan related, and since that date recognised
the fair value variations and the accumulated gains and losses previously maintain in equity,
directly to the consolidated income statements.
In year 2011, the Group has recognised a finance expense related to these contracts amounting
to S/.7,910,000 (S/.3,111,000 in year 2010) and are presented in “Net loss from financial
instruments” in the consolidated income statement. The fair value of these contracts as of 31
December 2011, 2010 and 1 January 2010 was S/.5,094,000, S/.5,249,000 and S/.6,768,000
respectively.
(ii) Forward contracts
The existing forward contracts as of December 31, 2010 have been designated to hedge the
future liability positions in foreign currencies mainly resulting from the existing contracts with
suppliers. The Group has recognized as liability, taking as counterpart the caption "Net
unrealized gain on hedge agreements" in the consolidated statement of changes in equity, the
fair value of these contracts as of December 31, 2010 amounting to S/.1,472,000. In 2011, the
Group has recognized a greater financial expense on these contracts amounting to S/.2,133,000
(S/.1,397,000 as of 31 December 2010) and are presented under "Financial expense" in the
consolidated statement of income (see note 20),

Translation of a report and consolidated financial statements originally issued in Spanish - see note 27
Notes to the consolidated financial statements (continued)
70
The critical periods of the forward contracts have been negotiated to coincide with the timing of
their obligations. The effectiveness of these contracts has not been observed since it has been no
significant element of ineffectiveness at the date of the consolidated statement of financial
position.
(iii) Future contracts
In July 2008, the Company began hedging operations related to the volatility of the price of
sugar, the main raw material used for their products. The Company acquired futures sugar
contracts in recognized markets (London and New York). These contracts have maturities
between March 2012 and May 2014. This activity required that the Company has a credit line of
US$4.5 million in the BNP Paribas - Panama for a period of 2 years to cover open positions and
market price changes. In addition, the Company signed a contract with BNP Paribas Commodity
Futures Inc., a company incorporated in New York, to act as a broker, who settled and recorded
periodically the contracts (revolving). The funds used as credit for the derivative options are
given as collateral. See note 6.
As of December 31, 2011, the Company maintains open positions in 2,162 contracts of 50 MT
and 245 contracts of 1,120 pounds each, with a market value of approximately US$2,077,000
recognising a loss amounting to S/.5,601,000 in consolidated statement of income related to the
cash liquidations of open positions obtained from the difference between the agreed and market
price (open positions in 1,031 contracts of 50 MT and 627 contracts of 1,120 pounds each, at
fair value by approximately US$10,489,000 recognising a total amount of S/.29,464,000 in
consolidated statement of income as of 31 December 2010).
In year 2011, the Company has recognised as part of operating costs the gains and losses
obtained for these contracts amounting to S/.46,796,000 (S/.12,759,000 in year 2010)
presented in the item “Cost of sales” in the consolidated income statement.
As of 31 December 2011, the open positions are as follows:
Maturity Metric tones
Quantity of
contracts Fair value
US$ / TM
London
March 2012 50 386 602.00
May 2012 50 319 591.60
August 2012 50 799 584.60
October 2012 50 640 586.80
December 2012 50 4 591.80
May 2013 50 14 599.00
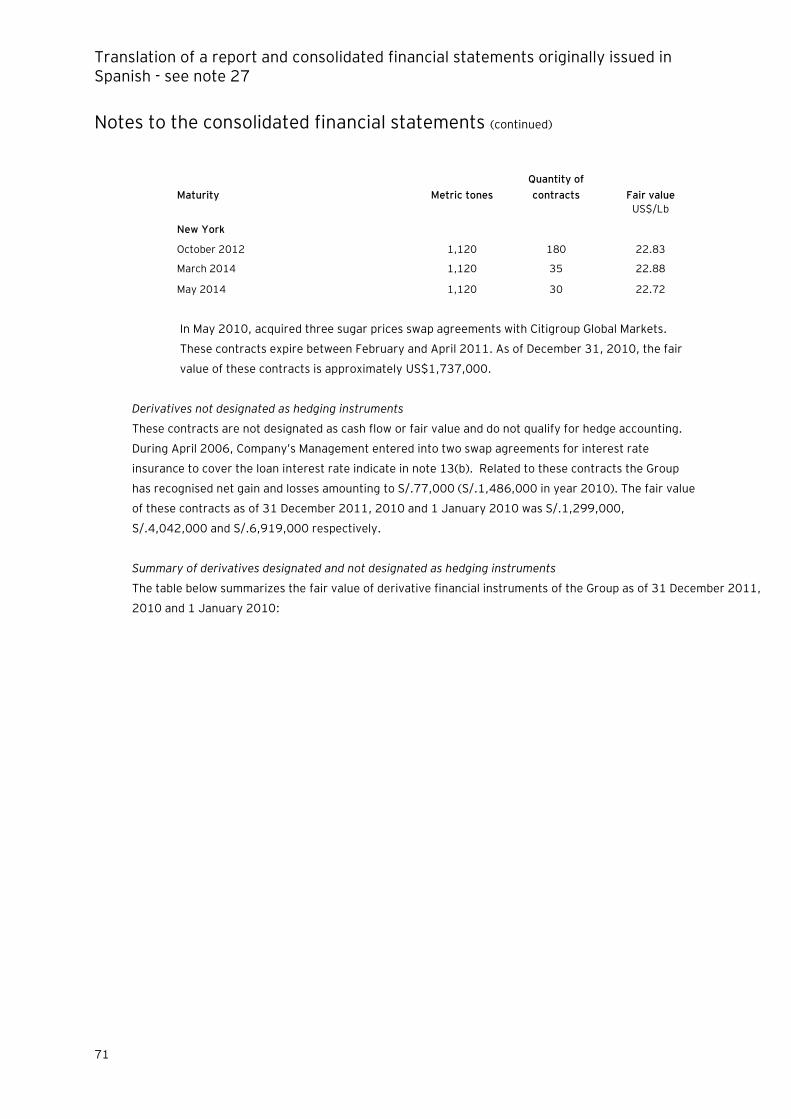
Translation of a report and consolidated financial statements originally issued in Spanish - see note 27
Notes to the consolidated financial statements (continued)
71
Maturity Metric tones
Quantity of
contracts Fair value
US$/Lb
New York
October 2012 1,120 180 22.83
March 2014 1,120 35 22.88
May 2014 1,120 30 22.72
In May 2010, acquired three sugar prices swap agreements with Citigroup Global Markets.
These contracts expire between February and April 2011. As of December 31, 2010, the fair
value of these contracts is approximately US$1,737,000.
Derivatives not designated as hedging instruments
These contracts are not designated as cash flow or fair value and do not qualify for hedge accounting.
During April 2006, Company‟s Management entered into two swap agreements for interest rate
insurance to cover the loan interest rate indicate in note 13(b). Related to these contracts the Group
has recognised net gain and losses amounting to S/.77,000 (S/.1,486,000 in year 2010). The fair value
of these contracts as of 31 December 2011, 2010 and 1 January 2010 was S/.1,299,000,
S/.4,042,000 and S/.6,919,000 respectively.
Summary of derivatives designated and not designated as hedging instruments
The table below summarizes the fair value of derivative financial instruments of the Group as of 31 December 2011,
2010 and 1 January 2010:

Translation of a report and consolidated financial statements originally issued in Spanish - see note 27
Notes to the consolidated financial statements (continued)
72
Current _______________________________________ Non current _______________________________________ Total debt ______________________________________
Interest rate Maturity 2011 2010
1 January
2010 2011 2010
1 January
2010 2011 2010
1 January
2010
% S/.(000) S/.(000) S/.(000) S/.(000) S/.(000) S/.(000) S/.(000) S/.(000) S/.(000)
Derivatives financial instruments
Cash flow hedge
Future contracts, (iii) Libor + 4.5 percent 2012 11,991 - - - - - 11,991 - -
Currency forwards, (ii)
Receive dollars – Pay
nuevos soles 2011 - 1,472 - - - - - 1,472 -
Cross Currency Swap – BBVA Banco Continental, (i)
Receive dollars at libor
3m+2.25 percent – Pay
nuevos soles at 7.05
percent 2014 3,256 3,300 1,772 1,839 1,949 4,996 5,095 5,249 6,768
Derivatives financial instruments not designated as
hedge
Interest rate swap – Citigroup 5.23 2013 577 997 1,280 144 1,247 2,561 721 2,244 3,841
Interest rate swap – JP Morgan N.A. 5.24 2013 462 799 1,026 115 999 2,052 577 1,798 3,078 ________ ________ ________ __________ ________ ________ __________ ________ ________
16,286 6,568 4,078 2,098 4,195 9,609 18,384 10,763 13,687 ________ ________ ________ ___________ ________ ________ __________ ________ ________
Translation of a report and consolidated financial statements originally issued in Spanish - see note 27
Notes to the consolidated financial statements (continued)
73
26. Commitment
In previous years, the Company signed private agreements without term defined with Peruvian banks to
guarantee financial obligations of certain customers related to the acquisition of trucks. Those
guarantees will become in obligations for the Company in case any of them (customers) do not pay its
obligations to the bank. In case of this event occurs, said private agreements transfer to the Company
the whole rights and obligations pending related to those leasing agreements signed between the
customers and the banks. As of December 31, 2011 the amount of the obligations of its customers for
this concept is amounting to approximately S/.30,639,000 (unaudited) (S/.42,067,000 (unaudited) as
of December 31, 2010).
27. Explanation added for English
language translation
The accompanying translated consolidated financial statements were originally issued in Spanish and
are presented on the basis of international financial reporting standards, as described in note 2 of this
report. Certain accounting practices applied by the Company that conform to international financial
reporting standards may not conform in a significant manner with generally accepted accounting
principles applied in other countries. In the event of a discrepancy, the Spanish language version
prevails.
Ernst & Young
Assurance | Tax | Transactions | Advisory
Acerca de Ernst & Young Ernst & Young es líder global en auditoría, impuestos, transacciones y servicios de asesoría. Cuenta con aproximadamente 600 profesionales en el Perú como parte de sus 152,000 profesionales alrededor del mundo, quienes comparten los mismos valores y un firme compromiso con la calidad. Marcamos la diferencia ayudando a nuestra gente, clientes y comunidades a alcanzar su potencial. Puede encontrar información adicional sobre Ernst & Young en www.ey.com
© 2011 Ernst & Young.
All Rights Reserved. Ernst & Young is a registered trademark.