TRANSITIONING TO THE FUTURE - Sasol portfolio profitable through the cycle Developing future...
24
TRANSITIONING TO THE FUTURE SASOL LIMITED FINANCIAL RESULTS for the six months ended 31 December 2016 JSE: SOL NYSE: SSL
Transcript of TRANSITIONING TO THE FUTURE - Sasol portfolio profitable through the cycle Developing future...

TRANSITIONING TO THE FUTURE
SASOL LIMITED FINANCIAL RESULTS for the six months ended 31 December 2016
JSE: SOL NYSE: SSL

2
Forward-looking statements
Sasol may, in this document, make certain statements that are not historical facts and relate to analyses and other
information which are based on forecasts of future results and estimates of amounts not yet determinable. These
statements may also relate to our future prospects, developments and business strategies. Examples of such
forward-looking statements include, but are not limited to, statements regarding exchange rate fluctuations, volume
growth, increases in market share, total shareholder return, executing our growth projects and cost reductions, including
in connection with our Business Performance Enhancement Programme and Response Plan. Words such as "believe",
"anticipate", "expect", "intend", "seek", "will", "plan", "could", "may", "endeavour", "target", "forecast" and "project" and
similar expressions are intended to identify such forward-looking statements, but are not the exclusive means of identifying
such statements. By their very nature, forward-looking statements involve inherent risks and uncertainties, both general
and specific, and there are risks that the predictions, forecasts, projections and other forward-looking statements will not
be achieved. If one or more of these risks materialise, or should underlying assumptions prove incorrect, our actual results
may differ materially from those anticipated. You should understand that a number of important factors could cause
actual results to differ materially from the plans, objectives, expectations, estimates and intentions expressed in such
forward-looking statements. These factors are discussed more fully in our most recent annual report on Form 20-F filed
on 27 September 2016 and in other filings with the United States Securities and Exchange Commission. The list of factors
discussed therein is not exhaustive; when relying on forward-looking statements to make investment decisions, you should
carefully consider both these factors and other uncertainties and events. Forward-looking statements apply only as of the
date on which they are made, and we do not undertake any obligation to update or revise any of them, whether as a result
of new information, future events or otherwise.
Please note: A billion is defined as one thousand million. All references to years refer to the financial year ended 30 June.
Any reference to a calendar year is prefaced by the word "calendar".
Comprehensive additional information is available on our website: www.sasol.com

INTRODUCTION
Bongani Nqwababa and Stephen Cornell
Joint Presidents and Chief Executive Officers
JSE: SOL NYSE: SSL

4
Key messages
● Strong results delivery and capital excellence focus despite continued market volatility
● Resilient operational and financial performance across our global business
● Improving focus on capital allocation to drive total shareholder return
● Lake Charles Chemicals Project (US) – on track and delivering on key project milestones
● Mozambique Production Sharing Agreement (PSA) – steady progress with drilling activities
yielding positive results
Secunda Chemicals Operations, South Africa Lake Charles Chemicals Project, Lake Charles, US
What you will hear today

5
● Operating model continues to deliver further efficiencies and effectiveness
● Foundation businesses safe, highly efficient and driving continuous improvement
● Proactive financial risk mitigation measures to protect and grow balance sheet
● Current portfolio profitable through the cycle
● Developing future investment opportunities
Lake Charles Chemicals Project, Lake Charles, US
Wax Expansion Project, Sasolburg, South Africa
Strong results delivery and capital excellence focus
despite continued market volatility

6
● Group safety performance, excluding illnesses, remained solid with an RCR of 0,27
● Regrettably three tragic fatalities in HY17
● Strong business performance across most of the value chain
● Secunda Synfuels Operations production volumes ▲1%, Eurasian operations ▲5%
● Normalised sales volumes ▲11% for Base Chemicals, ▲2% for Performance Chemicals
and liquid fuels ▼2%
● Cash fixed costs ▼1% in real terms, despite impact of mining strike
● Cost and cash savings initiatives exceeding targets, developing further opportunities
● Headline EPS ▼38% to R15,12 per share, EPS ▲19% to R14,21
● Interim dividend of R4,80 per share – based on annual 2,8x cover/36% payout
Sasol Mining, Secunda, South Africa Satellite Operations, Durban, South Africa
Resilient operational and financial performance
across our global business

7
● Long-term strategy being further refined
● Ensure robust capital allocation approach aimed at maximum sustainable returns to shareholders
● Focused interventions to close the current value gap
● Policy and structures in place to protect and strengthen the balance sheet
● Approach to be shared with investors in future engagements
Lake Charles Chemicals Project, Lake Charles, US
Sasol Synfuels, Secunda, South Africa
Improving focus on capital allocation
to drive total shareholder return

8
● Overall project almost two thirds complete with engineering at 94%
● Procurement activities nearly completed
● Capital expenditure to date of US$6,0 billion – tracking revised estimate
● Modularisation approach benefitting overall construction progress
● Above ground construction productivity tracking plan
● Good progress on operation and business readiness
● LCCP remains a sound investment that will return value to shareholders
● Confident that risks can be managed within current cost and schedule targets
Lake Charles Chemicals Project, Lake Charles, US
Lake Charles Chemicals Project, Lake Charles, US
LCCP on track and delivering
on key project milestones

9
● Mozambique facing major fiscal challenges
● Working very closely with all our partners to support them
● Confident that the challenges will be overcome
● Mitigating actions in place to minimise impact on Sasol
● Investments secure and will deliver future value to shareholders and other stakeholders
● Positive results from four wells drilled
● Nine additional wells to be drilled by end of 2018
● Loop Line 2 completed within schedule and significantly below budget
● Focus on securing gas feedstock to further enable our 2050 strategy
Central Processing Facility, Temane, Mozambique Drilling rig, Temane, Mozambique
Mozambique PSA – steady progress
with drilling activities yielding positive results
FINANCIAL AND OPERATIONAL
PERFORMANCE
Paul Victor
Chief Financial Officer
JSE: SOL NYSE: SSL

11
● Volatile macro environment continues, current rand strength will negatively impact earnings
● Continued focus on factors within our control
● Operational stability and production volumes remain a key deliverable
● Cost and cash savings initiatives providing headroom
● Protection and strengthening of balance sheet continues, liquidity remains strong
● Driving value-based growth strategy through sound and transparent capital allocation principles
● Outlook for FY17
Sasolburg Operations, Sasolburg, South Africa ORYX GTL, Ras Laffan, Qatar
Key messages

12
Chemical product prices trending up but exchange rate remains volatile
% c
han
ge
y-o
-y
Solvents basket Polymers basket Brent
$/m
mb
tu (
ga
s p
rice)
US
$/b
bl
Brent Product price Henry Hub
Product price differentials under pressure
US
$1 =
ZA
R
Volatile currency
Base chemical prices vs Brent
1H16 1H17
$2,44 $2,95
$47
$60
$48
1H16
Macro environment remains challenging
Prices reflect international commodities or baskets of commodities and are not necessarily Sasol specific
Sources: RSA Department of Energy, ICIS-LOR, Reuters, Platts, International Energy Agency
2% (7%)
4%
1H16 1H17
R13,62 R13,99
1H17
Product prices
R12,17
R15,48 R14,71
R13,74
US$/unit
Average
HY17
% ∆ vs
HY16
Brent/bbl 47,68 2▲
Fuel products/bbl 60,36 8▼
Base Chemicals/ton 764 6▼
Performance Chemicals/ton 1 255 6▼
Export coal/ton 71 35▲
Opening/closing rate Average rate during period
$65

13
11
2
34
13
40
Mining EPI PC BC Energy Group
Strong business performance across most of the value chain despite macro challenges
Group profitability
Solid operational performance supported by continued effective cost management
HY17 HY16 % ∆
Mining 1 534 2 359 35▼
Exploration and Production
International (EPI) 204 (8 289) >100▲
Performance Chemicals (PC) 4 647 5 161 10▼
Base Chemicals (BC) 1 733 3 178 45▼
Energy 5 529 10 261 46▼
Group Functions 25 2 246 99▼
Operating profit (Rm) 13 672 14 916 8▼
Earnings per share (R) 14,21 11,97 19▲
Headline earnings per share (R) 15,12 24,28 38▼
Dividend per share (R) 4,80 5,70 16▼
Capital expenditure (Rbn) 30,2 33,6 10▼
Operating profit %

14
Operating profit impacted by volatile macro environment
Headwinds
● Impact of stronger closing
exchange rate
● Steep decline in product
differentials and refining
margins, trending upwards
since November
● Lower average Base
Chemicals margins,
trending upwards since
November
Tailwinds
● Resilient Performance
Chemicals margins
● Cost and cash initiatives
delivering
● Higher sales volumes
● Higher average oil prices
since November
13 672
14 916
1%
1%
21%
(16%)
(15%)
0 4 000 8 000 12 000 16 000
HY17
Sales volumes
Cost and other
Once-off items andyear-end adjustments
Crude oil andproduct prices
Exchange rate
HY16
Rm
Operating profit
Macro
environ-
ment
Costs
and
volumes

15
22 628
21 307
21 429
0 5 000 10 000 15 000 20 000 25 000
HY17
Exchange rate
Inflation
Cash cost
Normalised cost
Mining strike
Cost increasebelow inflation
Sustainablebusiness savings
HY16
Rm
Cash fixed costs down 1% in real terms
Tailwinds
● Cost and value mindset
culturally entrenched
● Increased BPEP and
Response Plan savings
delivering in excess of
internal targets
● Maintaining focus and
priority, developing further
savings opportunities
Headwinds
● Strike action at Secunda
mines
Cash fixed costs
Costs and
volumes
Restructuring,
study and
growth cost
Macro
environment
1,6%
1,1%
(2,1%)
0,9%
(7,0%)
(0,1%)

16
FY14 FY15 FY16 FY17 FY18
Ra
nd
bill
ion
Project implementation cost Actual savings
Annualised expected savings
Targeting to deliver upper end of Response Plan range
● Savings of R54,9 billion achieved
since January 2015
● FY17 target increased to R26,0 billion
● Additional opportunities continuously
identified and implemented
● Sustainable savings target remains
R2,5 billion by FY19
● Delivered R4,9 billion in sustainable
savings to date
● On track to deliver FY17 target
of R5,0 billion
● Sustainable savings of R5,4 billion
by end FY18
0 5 10 15 20 25 30 35
Capital portfolio reductions and phasing
Cash cost savings
Capital structuring
Margin and working capital
Rbn
Actual savings to date Minimum target Upper target
Response Plan cost savings to end FY18 (42 months)
Business Performance Enhancement Programme
1,3 0,5
1,9 2,5
0,3
4,5
5,0 5,4

17
Mining and EPI Operating Business Units
Mining
● Operating profit decreased by 35%
● Export coal market prices higher
● Strike significantly impacted
profitability
● Business ramp-up from January 2017
on target
● Impact of strike
EPI ● Operating profit of R204 million
delivered through focused management interventions
● Strong Mozambique operations, volumes up 3%
● Canadian asset de-risking yielding benefits
● Gabon loss lower due to lower depreciation and increased prices
HY16 HY17
mm
to
ns
Production
HY16 HY17
mm
to
ns
External purchases
256
359
HY16 HY17
R/to
n
Unit cost/sales ton
HY16 HY17
Rm
Mozambique*
437
HY16 HY17
Op
era
tin
g p
rofit/(lo
ss)
Rm
Canada*
HY16 HY17
Rm
Gabon*
(7 769)
(312)
(512)
(41)
988
2,4
4,4
19,8
16,6
* Producing assets

18
Chemicals Strategic Business Units
Base Chemicals
● Sales volumes increased by 11%
● Operating profit down 45% to
R1 733m
● Strong closing R/US$ exchange rate
results in ~R900 million loss
● US$ prices anticipated to recover
during second half of FY17
Performance Chemicals
● Normalised sales volumes up 2%
● Operating profit down 10% to
R4 647m
● R527m impairment in US Phenolics
● Significant decline in ammonia pricing
● Phase 2 of FTWEP expected to reach
beneficial operation in March 2017
HY16 HY17
kt
Sales volumes
19
10
HY16 HY17
%
Operating profit margin
HY16 HY17
Rm
Operating profit
HY16 HY17
kt
Sales volumes
HY16 HY17
%
15 14
Operating profit margin
HY16 HY17
Rm
Operating profit
1 727 1 702 5 161 4 647
1 469 1 624
3 178
1 733

19
Energy Strategic Business Unit
Energy
● Liquid fuels sales volumes 2% lower
● Cash fixed costs down 2%
● Operating profit down 46% to
R5 529 million
● Petrol differential 38% lower, diesel
differential 12% lower
● Margins starting to recover
● ORYX GTL achieves 95% utilisation
● Normalised profit from joint ventures
10% higher
● EGTL scheduled to ramp-up during
first quarter of CY2017
Synfuels refined product Retail centres Liquid fuels sales
HY16 HY17
mm
bb
l
378 392
HY16 HY17
nu
mb
er
HY16 HY17
bscf
90 95
HY16 HY17
% 31
18
HY16 HY17
%
HY16 HY17
mm
bb
l
Operating profit margin Gas sales ORYX utilisation
30,2 29,6
17,1 15,8
29,4 29,6

20
Focused value-based capital allocation Maintain strong balance sheet and liquidity
Driving disciplined and transparent capital allocation
* Up to 2,2x cover / 45% payout
License to operate
and sustenance capex Minimum
shareholder return
(2,8x cover/
36% payout)
Special dividends
and share buy backs
Balance sheet protection will take precedence
if investment grade credit rating at risk
Deliver maximum sustainable shareholder return
Sources
of capital Allocation of capital
Capital allocation guided by key financial metrics – Gearing, Net debt:EBITDA and ROIC
All three elements
compete equally
for capital
Equity raise
Debt
drawdown
Cash flow
from
operations
Cash
on hand Strengthen
balance sheet
Value-based
growth capex
Premium
shareholder
return*
21
70
75
60
66
60
0
20
40
60
80
FY16 FY17 FY18
Ran
d b
illio
n
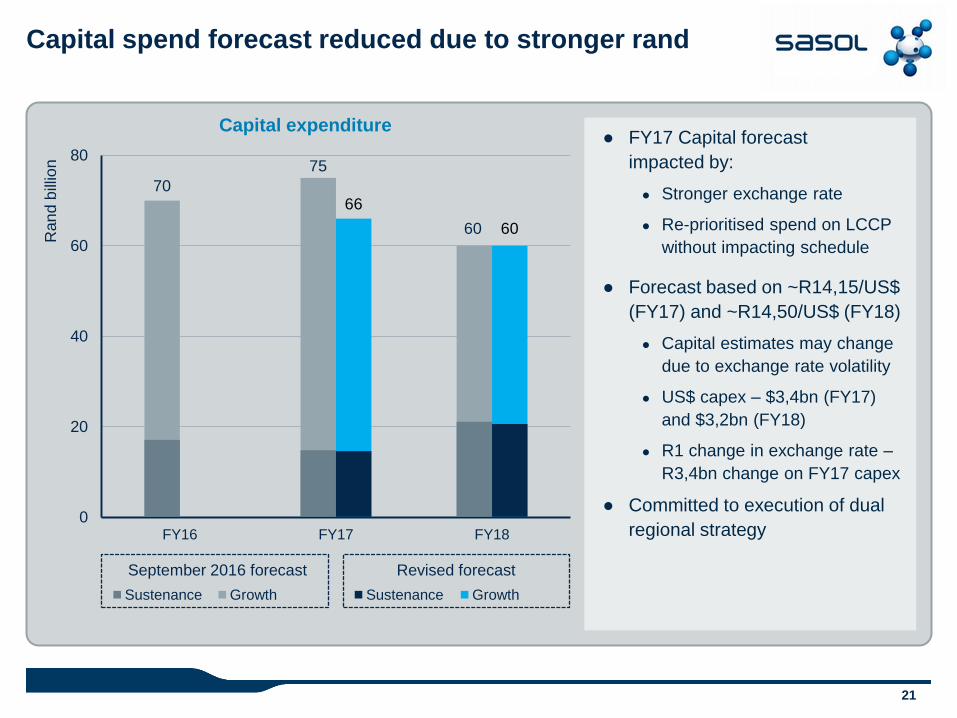
Capital spend forecast reduced due to stronger rand
● FY17 Capital forecast
impacted by:
● Stronger exchange rate
● Re-prioritised spend on LCCP
without impacting schedule
● Forecast based on ~R14,15/US$
(FY17) and ~R14,50/US$ (FY18)
● Capital estimates may change
due to exchange rate volatility
● US$ capex – $3,4bn (FY17)
and $3,2bn (FY18)
● R1 change in exchange rate –
R3,4bn change on FY17 capex
● Committed to execution of dual
regional strategy
September 2016 forecast
Growth Sustenance
Revised forecast
Sustenance Growth
Capital expenditure
22
94
28
52
66
12
30
6
0 20 40 60 80 100
Total liquidity
Available undrawn facilities
Closing cash balance (31 December 2016)
Capex
Dividend
Cash retained
Opening cash balance (1 July 2016)
Rbn
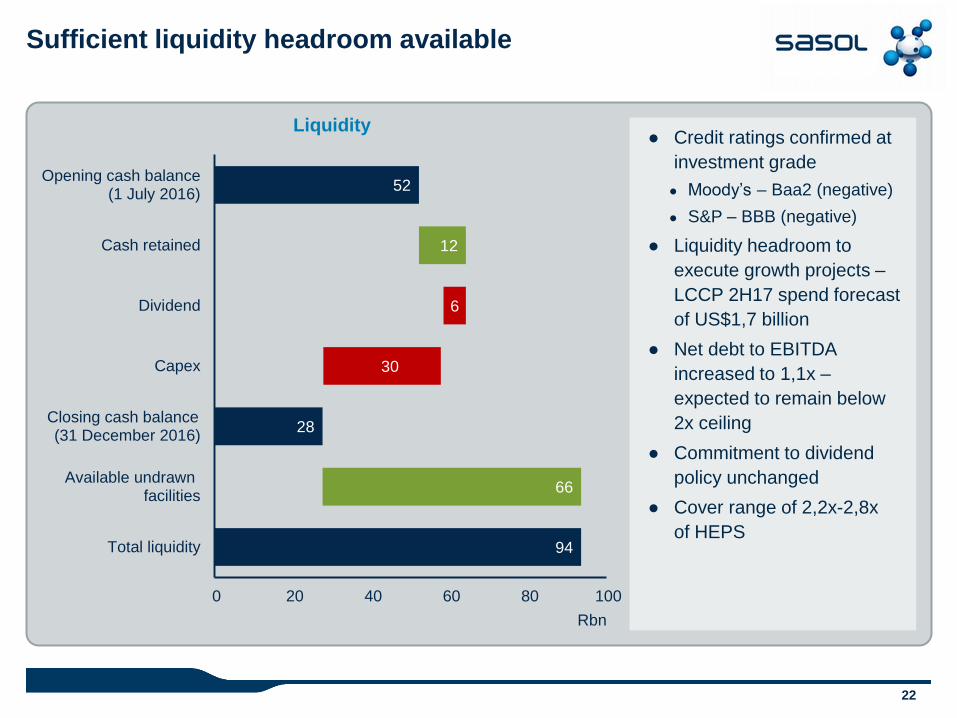
Sufficient liquidity headroom available
● Credit ratings confirmed at
investment grade
● Moody’s – Baa2 (negative)
● S&P – BBB (negative)
● Liquidity headroom to
execute growth projects –
LCCP 2H17 spend forecast
of US$1,7 billion
● Net debt to EBITDA
increased to 1,1x –
expected to remain below
2x ceiling
● Commitment to dividend
policy unchanged
● Cover range of 2,2x-2,8x
of HEPS
Liquidity

23
FY17 Outlook
Outlook
Mining Return to full production with corresponding cost performance
to follow inflation
EPI Increased gas production from PPA ● PSA drilling activities to continue
● No drilling activity in Canada
Energy Liquid fuels sales approximately 61 million barrels
● ORYX GTL average utilisation >90%
Base Chemicals Sales volumes 4-6% higher than prior year ● US$ selling prices recovering
● Gemini HDPE to reach mechanical completion by middle CY17
Performance Chemicals Sales volumes 1-2% higher than prior year ● Margins to remain resilient
● FTWEP phase 2 BO imminent, full benefit by FY19
Group
Normalised cash fixed costs to track SA PPI ● RP cash flow contribution
of R22-R26bn ● BPEP cost savings to achieve run-rate of R5,4bn by 2018
● Balance sheet gearing between 30-35%
QUESTIONS AND ANSWERS
Bongani Nqwababa and Stephen Cornell
Joint Presidents and Chief Executive Officers
JSE: SOL NYSE: SSL


![SPENCER LAKE CAMPS CHARLES T. BRATTEN, … LAKE CAMPS CHARLES T. BRATTEN, Proprietor [picture] Gerard Somerset County Maine. Spencer Lake Camps In the Heart of the Great Maine Woods](https://static.fdocuments.net/doc/165x107/5ac422a47f8b9a2b5c8cc974/spencer-lake-camps-charles-t-bratten-lake-camps-charles-t-bratten-proprietor.jpg)