Transit Development Plan 2011 - 2016 Transit...Annual Report. The TDP is submitted ......
46
Transit Development Plan 2011 - 2016 Adopted by: Spokane Transit Authority Board of Directors FINAL 3/16/2011 Upon request, alternative formats of this document will be produced for people with disabilities. Please call 325- 6094 or TTY (509) 232-6555 or email [email protected]
Transcript of Transit Development Plan 2011 - 2016 Transit...Annual Report. The TDP is submitted ......

Transit Development Plan 2011 - 2016
Adopted by: Spokane Transit Authority Board of Directors FINAL 3/16/2011
Upon request, alternative formats of this document will
be produced for people with disabilities. Please call 325-
6094 or TTY (509) 232-6555 or email
Transit Development Plan 2011 - 2016 ii Spokane Transit Authority FINAL 3/16/2011
Table of Contents Introduction .................................................................................................................................... 1
Section I: Organization .................................................................................................................... 1
Mission ........................................................................................................................................ 1
Guiding Principles ....................................................................................................................... 1
Background ................................................................................................................................. 2
Agency Leadership ...................................................................................................................... 2
2011 Spokane Transit Board of Directors ................................................................................... 3
Section II: Physical Plant & Equipment ........................................................................................... 3
Section III: Service Characteristics .................................................................................................. 4
Fare Structure ............................................................................................................................. 4
Service Description ..................................................................................................................... 5
Service Area ................................................................................................................................ 6
Figure 1.1: STA Route System ................................................................................................. 6
Figure 1.2: STA Paratransit Boundary ..................................................................................... 7
Section IV: Service Connections ...................................................................................................... 8
Section V: 2010 Activities ................................................................................................................ 8
Spokane Transit’s Compliance with WSDOT State Transportation Goals .................................. 9
Ridership ................................................................................................................................... 10
Fleet .......................................................................................................................................... 10
Capital Projects ......................................................................................................................... 10
Section VI: Proposed Strategic Actions (2011 – 2016) in compliance with State Transportation
Goals ............................................................................................................................................. 11
Section VII: Planned Activities: 2011 – 2016 ................................................................................ 11
Section VIII: Capital Improvement Program: 2011- 2016 ............................................................. 14
Section IX: Operating Data: 2010 – 2016 ...................................................................................... 18
Section X: Operating Revenues and Expenditures: 2010 – 2016 ................................................. 19
Appendix ....................................................................................................................................... 21

Transit Development Plan 2011 - 2016 iii Spokane Transit Authority FINAL 3/16/2011
Appendix A – Priorities and Objectives ..................................................................................... 21
Appendix B – Performance Measures ...................................................................................... 21
Appendix C – System Ridership, Miles & Hours 1994 - 2009 ................................................... 30
Appendix D – Asset Management Plan ..................................................................................... 33
Appendix E – Bus Fleet Contingency Plan – Inactive Reserve/Contingency Bus Fleet ............. 41
NOTE: This draft replaces a previous version submitted to the Board of Directors February 16, 2011.

Transit Development Plan 2011 - 2016 1 Spokane Transit Authority FINAL 3/16/2011
Introduction
Spokane Transit Authority’s Transit Development Plan (TDP) contains its Six-year Plan and
Annual Report. The TDP is submitted to the Washington State Department of Transportation
(WSDOT) on an annual basis.
Spokane Transit’s 2011 – 2016 TDP includes, but is not limited to, significant accomplishments
in 2010, projects that are in progress or planned for the future, and planned strategies for the
current year plus five additional years.
STA is required to submit the six-year plan per RCW 35.58.2795. The information contained
herein will be used as part of WSDOT’s annual report to the Washington State Legislature.
Section I: Organization
Mission
1. We are dedicated to providing safe, convenient and accessible transportation
services to Spokane area neighborhoods, business and activity centers.
2. We are leaders in transportation and a valued partner in the community’s social
fabric, economic infrastructure and quality of life.
3. We aspire to be a source of pride in the region.
Guiding Principles
1. Safety
a. Emphasize Safety in all aspects of our operations
2. Earn and Retain the Community’s Trust
a. Engender trust and accountability
b. Satisfy and exceed the expectations of citizens, customers and employees

Transit Development Plan 2011 - 2016 2 Spokane Transit Authority FINAL 3/16/2011
3. Provide Outstanding Customer Service
a. To provide consistently high-quality service to customers in every interaction
with Spokane Transit
4. Employee and Organizational Development
a. To have a well trained and highly productive workforce
b. To promote a healthy dialogue on important issues
c. To reduce employee injuries
Background
Public transportation began in Spokane County in the late 19th Century with a series of
independent transit companies. In 1922, in conjunction with other groups, the Washington
Water Power Company established the Spokane United Railway Company and provided a
privately owned and operated transit network throughout the area.
In 1945, Washington Water Power sold its interests in the transit system to Spokane City Lines
Company, a private entity, and a part of National City Lines Company. The extended usage of
the private automobile following World War II contributed to the gradual decline in transit
ridership. The added burden of declining revenues resulted in the transfer of the transit system
to the City of Spokane in 1968 in order to obtain public funding.
Initially, public funding for the transit system was derived from a household tax approved by
voters. Increasing costs and a need for more funding precipitated a statewide effort to provide
a more stable and responsive public funding source. In 1981, a new municipal corporation, the
Spokane County Public Transportation Benefit Area was formed for the sole purpose of
providing public transportation via independent taxing and revenue generating authority. That
same year, Spokane voters approved a 0.3% retail sales tax to be levied within the Public
Transportation Benefit Area (PTBA) for transit funding. This funding was matched with the
Motor Vehicle Excise Tax (MVET) until 2000, when MVET was rescinded by voter initiative and
the state legislature. In May of 2004, voters temporarily approved an increase in the sales tax of
an additional 0.3% for a total of 0.6% levied in the PTBA. The 0.6% sales tax was permanently
reauthorized by voters in May of 2008.
Agency Leadership
The Board of Directors provides the policy and legislative direction for STA and its
administrators and approves its actions, budgets, and long-term plans. It also has the authority
to levy taxes as authorized by state law (with voter approval).

Transit Development Plan 2011 - 2016 3 Spokane Transit Authority FINAL 3/16/2011
By state law, the Board is composed of up to nine voting members who are elected officials
chosen from the jurisdictions served by the PTBA. These include the cities of Airway Heights,
Cheney, Medical Lake, Millwood, Liberty Lake, Spokane, and Spokane Valley as well as Spokane
County. Additionally, there is a non-voting labor representative appointed by STA’s labor
organizations as required by state law.
The Chief Executive Officer is appointed by the Board of Directors and directly oversees
Legislative Activity, Board Relations, Ombuds and Accessibility Activity, Human Resources,
Communications, Operations and Planning and Grants.
2011 Spokane Transit Board of Directors
Amber Waldref, Chair City of Spokane Al French, Chair Pro Tempore Spokane County Josh Beckett Small Cities Representative, City of Liberty Lake Brenda Redell Small Cities Representative, City of Medical Lake Dean Grafos City of Spokane Valley Gary Schimmels Mark Richard Nancy McLaughlin Richard Rush Rhonda Bowers
City of Spokane Valley Spokane County City of Spokane City of Spokane Labor Representative (non-voting)
Section II: Physical Plant & Equipment
Spokane Transit Authority’s Operations, Maintenance and Administration Facilities are at the
following locations:
Operations, Maintenance and Administration Charles H. Fleck Service Center 1230 W. Boone Avenue 127 South Bowdish Road Spokane, WA 99201 Spokane Valley, WA 99206
STA’s 2010 fleet included 146 fixed route coaches, 70 Paratransit vans and 117 vanpool vans.
Fixed Route Bus Service operated 38 routes, 365 days a year. In accordance with the Americans
with Disabilities Act (ADA) all Fixed Route and Paratransit vehicles are lift equipped.
Paratransit Service is operated by STA and its contractor for people who qualify under the
eligibility requirements of the ADA. Paratransit service is provided within a defined service area,
Transit Development Plan 2011 - 2016 4 Spokane Transit Authority FINAL 3/16/2011
during the same hours and days as fixed route service and in compliance with applicable state
and federal laws for service to people whose disability prevents them from using Fixed Route
bus service. The directly operated Paratransit Fleet is comprised of 70 vehicles, each with a
capacity for 15 passengers. Contracted transportation supplements service during the early
mornings, nights and weekends as well as augments capacity during weekdays. The contractor’s
fleet is comprised of 44 vehicles.
Vanpool (Rideshare) Service augments STA’s public transportation system through the
assignment of passenger vans to vanpool groups. The Vanpool fleet has 117 vehicles that
include 14 passenger Ford vans, 15 passenger Chevy vans and eight passenger Chevy vans. A
vanpool group can be formed by a group of eight to 15 people whose origin or destination is
within the STA service area.
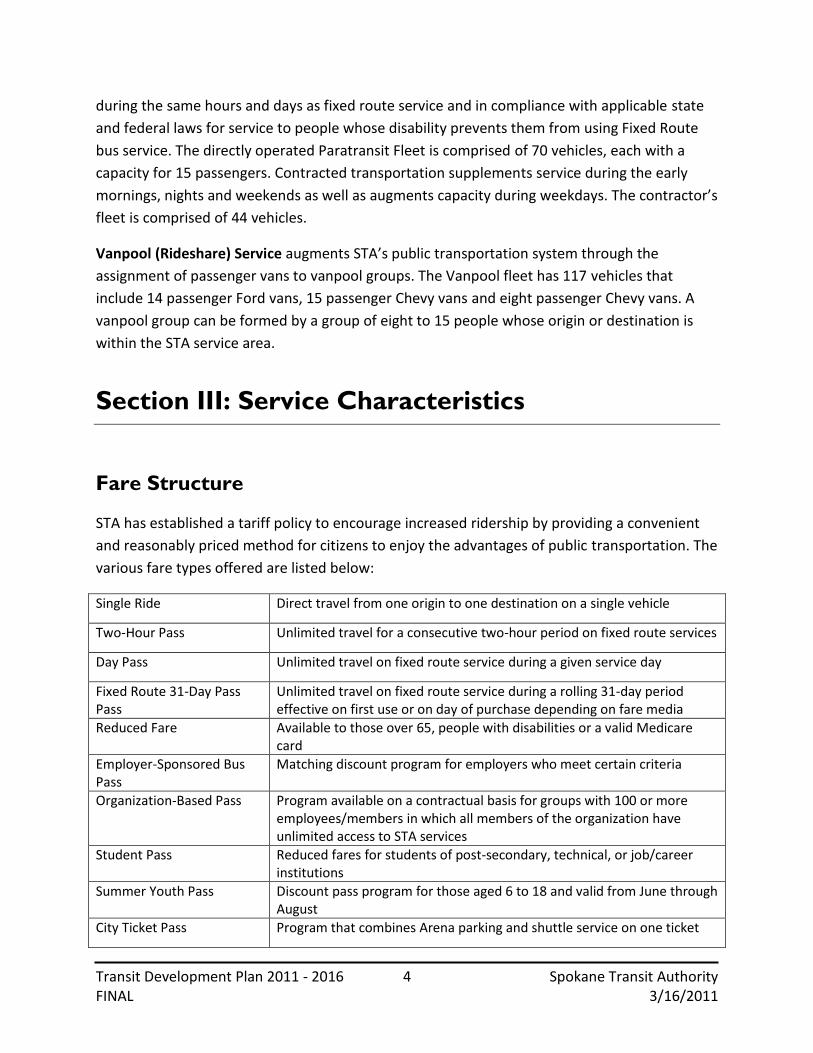
Section III: Service Characteristics
Fare Structure
STA has established a tariff policy to encourage increased ridership by providing a convenient
and reasonably priced method for citizens to enjoy the advantages of public transportation. The
various fare types offered are listed below:
Single Ride Direct travel from one origin to one destination on a single vehicle
Two-Hour Pass Unlimited travel for a consecutive two-hour period on fixed route services
Day Pass Unlimited travel on fixed route service during a given service day
Fixed Route 31-Day Pass Pass
Unlimited travel on fixed route service during a rolling 31-day period effective on first use or on day of purchase depending on fare media
Reduced Fare Available to those over 65, people with disabilities or a valid Medicare card
Employer-Sponsored Bus Pass
Matching discount program for employers who meet certain criteria
Organization-Based Pass Program available on a contractual basis for groups with 100 or more employees/members in which all members of the organization have unlimited access to STA services
Student Pass Reduced fares for students of post-secondary, technical, or job/career institutions
Summer Youth Pass Discount pass program for those aged 6 to 18 and valid from June through August
City Ticket Pass Program that combines Arena parking and shuttle service on one ticket

Transit Development Plan 2011 - 2016 5 Spokane Transit Authority FINAL 3/16/2011
Service Description
As of January 1, 2011 STA has 38 fixed routes in operation:
1 Plaza/Arena 2 South Side Medical Shuttle
20 Spokane Falls Community College 21 West Broadway
22 Northwest Boulevard 23 Maple – Ash
24 Monroe 25 Division
26 Addison 27 Crestline
28 Nevada 29 Spokane Community College
30 Francis 31 Garland
32 Trent/Indiana 33 Wellesley
41 Latah 42 South Maple
43 Lincoln/37th 44 29th Avenue
45 Southeast Boulevard 46 Altamont
60 Airport/Browne’s Addition 61 Browne’s Addition/Highway 2
62 Medical Lake Hospitals 65 Cheney/EWU
66 EWU 67 Medical Lake/Geiger
72 Liberty Lake Express 73 VTC Express
74 Valley Limited 90 Sprague
91 Mission 94 East Fifth
95 Millwood 96 Pines
97 South Valley 124 North Express
Hours of service are generally 5:30 AM to 11:30 PM Monday through Friday, 6:00 AM to 10:00
PM Saturdays, and 8:00 AM to 8:00 PM Sundays.
STA operates 365 days a year; however, holiday schedules (8:00 AM to 8:00 PM) are followed
for New Year’s Day, Memorial Day, Independence Day, Labor Day, Thanksgiving Day, and
Christmas Day. In addition, extended Holiday service operates on Independence Day from 8:00
AM to 10:30 PM

Transit Development Plan 2011 - 2016 6 Spokane Transit Authority FINAL 3/16/2011
Service Area1
STA provides fixed route bus service and Paratransit service comparable to fixed route service
to the cities of Airway Heights, Cheney, Liberty Lake, Medical Lake, Millwood, Spokane and
Spokane Valley as well as to unincorporated areas of Spokane County that are within the PTBA.
Figure 1.1 below outlines the STA Route System.
Figure 1.1: STA Route System
1 The STA system map and Paratransit Boundary map will be included after the adoption of the September 2011
Service Plan

Transit Development Plan 2011 - 2016 7 Spokane Transit Authority FINAL 3/16/2011
Figure 1.2: STA Paratransit Boundary
Paratransit service is comparable to Fixed Route service area and conforms to the ADA. The
service area extends ¾ of a mile on each side of and around each fixed route.

Transit Development Plan 2011 - 2016 8 Spokane Transit Authority FINAL 3/16/2011
Section IV: Service Connections
STA provides service to the following public transportation facilities:
Spokane Intermodal Center (Greyhound and Amtrak services)
Spokane International Airport (regional and international air transportation services)
In addition, STA provides service to, or in the vicinity of, most of the public elementary, middle
and high schools in its service area, as well as to Spokane Community College, Spokane Falls
Community College, Gonzaga University, Whitworth University, and Riverpoint Campus
(Eastern Washington University and Washington State University).
STA also operates service to 10 park-and-ride lots within the PTBA. As of January 1, 2011, STA
has park-and-ride facilities at the following locations:
Lot Location
Five Mile N. Ash Street & Five Mile Road
“K” Street Station (Cheney) “K” Street & 1st Avenue
Hastings Hastings Road & Mayfair Road
Liberty Lake Mission Avenue (behind Albertsons)
Mirabeau Point I-90 & Indiana Avenue
Pence-Cole Valley Transit Center 4th Avenue & University Avenue
South Hill Southeast Boulevard & 31st Avenue
Airway Heights Highway 2 (Yokes Market)
Arena Boone Avenue & Howard Street
Jefferson Lot Jefferson Street and Walnut Street
Section V: 2010 Activities
Below is a general summary of the activities that STA undertook in 2010 to comply with the
WSDOT State Transportation Goals as listed in RCW 47.04.280. This is followed by a more
detailed account of activities related to STA’s ridership, fleet and capital projects.

Transit Development Plan 2011 - 2016 9 Spokane Transit Authority FINAL 3/16/2011
Spokane Transit’s Compliance with WSDOT State
Transportation Goals
Per RCW 47.04.280, the Washington State Legislature has outlined policy goals for the planning,
operation, and performance of, and investment in, the state’s transportation system. These
policy goals, also referred to as the WSDOT State Transportation Goals, are listed in italics
below, followed by an account of STA’s compliance activities.
Preservation: maintain, preserve, and extend the life and utility of prior investments in
transportation systems and services. STA continues to maintain its facilities and
equipment in a state of good repair according to its quality standards.
Safety: provide for and improve the safety and security of transportation customers
and the transportation system. STA continues to regard safety as a high priority. STA
operates in a safe and efficient manner, maintains safe facilities and maintains a regular
maintenance program on all vehicles and facilities. In 2010, STA worked with
Washington State University to install two solar lighting units at the Riverpoint Campus
as part of a larger pedestrian and student safety initiative.
Mobility: improve the predictable movement of goods and people throughout
Washington State. STA partnered with Google to publish STA route and schedule
information via Google Transit. Customers can access the trip planner via the STA
website or through Google Maps. Additionally, customers can access STA schedule
information via their mobile device, use place or business names when searching for
schedule information and the use of Google maps to get a better understanding of
where their travels aboard STA will take them.
Environment: enhance Washington’s quality of life through transportation
investments that promote energy conservation, enhance healthy communities, and
protect the environment. STA continues to sustain high ridership levels and a
commitment to increasing the number of hybrid vehicles in the fleet. In 2010 STA took
delivery of ten 40’ Hybrid Fixed Route coaches while retiring the same number of diesel
coaches from the fleet.
Stewardship: continuously improve the quality, effectiveness, and efficiency of the
transportation system. 2010 continued to see a decline in sales tax revenue for STA
which required a reduction in transportation service levels in order to operate within
expected resources. While STA did reduce approximately 13,000 annual platform hours

Transit Development Plan 2011 - 2016 10 Spokane Transit Authority FINAL 3/16/2011
of Fixed-Route service there were improvements to some routes including modification
of the Route 2 Southside Medical Shuttle that reduced travel time while increasing
frequency to 15 minutes; schedule modifications to Route 29 SCC and Route 91 Mission,
which gave riders more frequency options at Spokane Community College; and,
increasing the number of stops on the Route 124 North Express in order to mitigate the
loss of the Hastings Park & Ride segment of the Route 23 Maple Ash route.
Ridership
In 2010, STA carried approximately 10.7 million riders on its Fixed-Route system, down 4%,
from 2009’s record of 11.15 million. Paratransit ridership was down slightly from 2009’s
521,578 trips with 517,242 passengers carried in 2010. Vanpool ridership was also down in
2010. Vanpool had 208,502 passenger trips in 2010 compared to 209,822 in 2009.
Fleet
STA added ten 40’ Fixed Route Hybrid coaches in 2010 bringing the total number in the fleet to
twenty-two. The ten hybrid coaches received in 2010 replaced ten existing diesel coaches in the
fleet. The paratransit fleet remained at 70 vehicles while the Vanpool fleet received ten new
vans and retired the same number of vans.
Capital Projects
In 2010 STA completed the first phase of a multi-phase plan to install fixed asset cameras.
Additional installations will continue through the year 2012. In September 2010, the Board of
Directors gave approval for the on board camera system contract. Installation of cameras will
begin in 2011. STA also came to a decision in regards to changes and upgrades required to meet
the FCC requirements for the narrow banding project for current communications systems. This
project will begin in 2011 and will move the paratransit data off the existing radio network to a
cellular network which eliminates the need for procurement of data radios and associated
infrastructure upgrades.
STA also received two Federal Transit Administration (FTA) grants in 2010. One grant provided
funds to replace the current Transit Asset Management System. The federal grant totals
$1,880,000. The second grant provided funds for the replacement of the Boone Avenue facility
roof. The federal grant totals $1,836,054. Both projects are scheduled to begin in 2011.

Transit Development Plan 2011 - 2016 11 Spokane Transit Authority FINAL 3/16/2011
Section VI: Proposed Strategic Actions (2011 –
2016) in compliance with State Transportation
Goals
The following section provides a general summary of STA’s proposed strategic actions for
meeting WSDOT’s State Transportation Goals for 2011 – 2016:
Preservation: STA will ensure the continued safe operation of its fleet and facilities.
Safety: STA will ensure that its fleet continues to operate in a safe manner and to
operate its facilities in the same safe manner.
Mobility: STA will continue to emphasize the role that public transit plays in the
community, work to expand rideshare programs and improve park & ride options.
Environment: By continuing to grow ridership, STA can continue to lessen people’s
impact on the environment in the Spokane region.
Stewardship: STA understands the trust the community places upon it will work to
maintain a sound, efficient transit system that people can depend on.
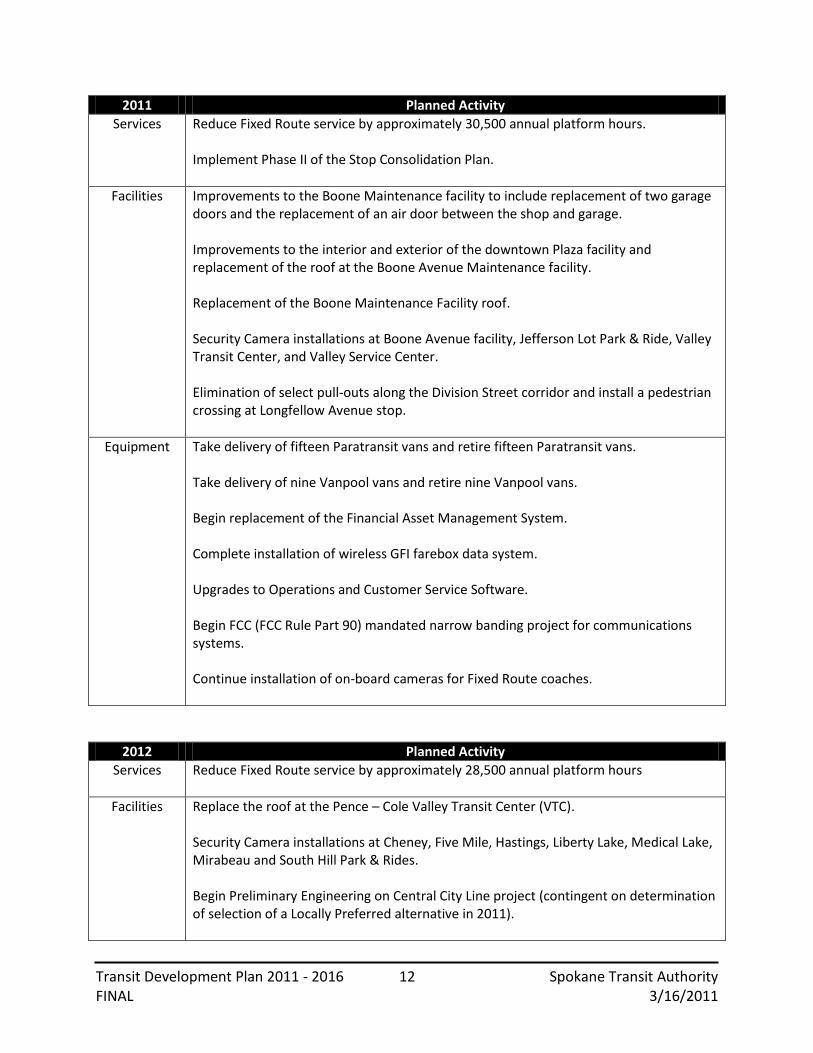
Section VII: Planned Activities: 2011 – 2016
The following section lists specific capital and service improvement activities STA has planned
for 2011 – 2016 that support WSDOT’s aforementioned State Transportation Goals. Activities
are listed in three categories: Services, Facilities and Equipment.
Services list planned and/or proposed changes to services provided by STA. The facilities section
includes planned changes or improvements to the facilities STA operates. Finally, the
Equipment section outlines fleet changes such as new vehicles procured, vehicles removed
from service or other fleet changes.
Transit Development Plan 2011 - 2016 12 Spokane Transit Authority FINAL 3/16/2011
2011 Planned Activity
Services Reduce Fixed Route service by approximately 30,500 annual platform hours. Implement Phase II of the Stop Consolidation Plan.
Facilities Improvements to the Boone Maintenance facility to include replacement of two garage doors and the replacement of an air door between the shop and garage. Improvements to the interior and exterior of the downtown Plaza facility and replacement of the roof at the Boone Avenue Maintenance facility. Replacement of the Boone Maintenance Facility roof. Security Camera installations at Boone Avenue facility, Jefferson Lot Park & Ride, Valley Transit Center, and Valley Service Center. Elimination of select pull-outs along the Division Street corridor and install a pedestrian crossing at Longfellow Avenue stop.
Equipment Take delivery of fifteen Paratransit vans and retire fifteen Paratransit vans. Take delivery of nine Vanpool vans and retire nine Vanpool vans. Begin replacement of the Financial Asset Management System. Complete installation of wireless GFI farebox data system. Upgrades to Operations and Customer Service Software. Begin FCC (FCC Rule Part 90) mandated narrow banding project for communications systems. Continue installation of on-board cameras for Fixed Route coaches.
2012 Planned Activity
Services Reduce Fixed Route service by approximately 28,500 annual platform hours
Facilities Replace the roof at the Pence – Cole Valley Transit Center (VTC). Security Camera installations at Cheney, Five Mile, Hastings, Liberty Lake, Medical Lake, Mirabeau and South Hill Park & Rides. Begin Preliminary Engineering on Central City Line project (contingent on determination of selection of a Locally Preferred alternative in 2011).

Transit Development Plan 2011 - 2016 13 Spokane Transit Authority FINAL 3/16/2011
2012 Planned Activity
Equipment Take delivery of six Hybrid Fixed Route coaches and retire ten diesel 40’ Fixed Route coaches. Take delivery of twelve Paratransit vans and retire twelve Paratransit vans. Take delivery of eight Vanpool vans and retire eight Vanpool vans. Complete replacement of the Financial Asset Management System. Upgrades to Operations and Customer Service software. Installation of Smart Bus components.
2013 Planned Activity
Services Make scheduling adjustments and minor route changes as appropriate to accommodate changing traffic and ridership conditions
Facilities Expand and/or renovate existing administrative and operational space at the Boone Avenue facilities. Changes are essential to accommodate current personnel requirements, implement the required configuration for real-time dispatch operations, and improve security.
Equipment Take delivery of twelve Paratransit vans and retire twelve Paratransit vans. Take delivery of nine Vanpool vans and retire nine Vanpool vans. Replace bus washer at Boone Avenue Maintenance facility. Upgrades to Operations and Customer Service Software. Installation of Smart Bus components.
2014 Planned Activity
Services Make scheduling adjustments and minor route changes as appropriate to accommodate changing traffic and ridership conditions.
Facilities Improvements to shelters, signage and wayfinding as well as ADA improvements.
Equipment Take delivery of twelve Paratransit vans and retire twelve Paratransit vans. Take delivery of twenty Vanpool vans and retire twenty Vanpool vans.

Transit Development Plan 2011 - 2016 14 Spokane Transit Authority FINAL 3/16/2011
2015 Planned Activity
Services Make scheduling adjustments and minor route changes as appropriate to accommodate changing traffic and ridership conditions
Facilities Improvements to shelters, signage and wayfinding as well as ADA improvements.
Equipment Take delivery of seven Paratransit vans and retire seven Paratransit vans. Take delivery of ten Vanpool vans and retire ten Vanpool vans.
2016 Planned Activity
Services Make scheduling adjustments and minor route changes as appropriate to accommodate changing traffic and ridership conditions.
Facilities Improvements to shelters, signage and wayfinding as well as ADA improvements.
Equipment Take delivery of twelve Paratransit vans and retire twelve Paratransit vans. Take delivery of ten Vanpool vans and retire ten Vanpool vans.
Section VIII: Capital Improvement Program:
2011- 2016
Funded and Proposed Fixed Route Coach Acquisition Plan 2011 - 2016 2011 2012 2013 2014 2015 2016 FLEET AT START 146 136 132 132 132 132
Diesel Buses 112 102 102 102 102 102
Hybrid Electric Vehicles 22 28 28 28 28 28
Fixed Route Vans 2 2 2 2 2 2
Buses to be Surplused 10 10 0 0 0 0
Vans to be Surplused 0 0 0 0 0 0
New Replacement Buses – Hybrid 0 6 0 0 0 0

Transit Development Plan 2011 - 2016 15 Spokane Transit Authority FINAL 3/16/2011
Funded and Proposed Fixed Route Coach Acquisition Plan 2011 - 2016 2011 2012 2013 2014 2015 2016 New Replacement Buses – Diesel 0 0 0 0 0 0
FLEET AT END 136 132 132 132 132 132
Buses in Contingency Fleet 9 10 0 0 0 0
FLEET UTILIZATION
Maximum Peak Requirement 114 110 110 110 110 110
Spare Fleet 22 22 22 22 22 22
Operating Fleet 136 132 132 132 132 132
Contingency Fleet 9 19 19 19 19 19
Funded and Proposed Paratransit Van Acquisition Plan (Directly Operated) 2011 - 2016
2011 2012 2013 2014 2015 2016 FLEET AT START 70 70 70 70 70 70
Gasoline Vans 12 12 12 12 12 12
Diesel Vans 58 58 58 58 58 58
Vans to be Surplused 15 12 12 12 7 12
New Replacement Vans – Gasoline 0 0 0 0 0 0
New Replacement Vans – Diesel 15 12 12 12 7 12
FLEET AT END 70 70 70 70 70 70
FLEET UTILIZATION
Maximum Peak Requirement 60 60 60 60 60 60
Contingency Fleet 10 10 10 10 10 10
Funded and Proposed Vanpool Acquisition Plan 2011 - 2016
2011 2012 2013 2014 2015 2016
FLEET AT START 117 122 132 142 152 162
New Expansion Vans2 0 10 10 10 10 10
Replacement Vans 9 8 9 20 10 10
Vans to be Surplused 9 8 9 20 10 10
2 Expansion Vans pending State funding

Transit Development Plan 2011 - 2016 16 Spokane Transit Authority FINAL 3/16/2011
Funded and Proposed Vanpool Acquisition Plan 2011 - 2016
2011 2012 2013 2014 2015 2016
Expanded Special Use 5
FLEET AT END 122 132 142 152 162 172
FLEET UTILIZATION
Vanpool Operating Fleet 100 109 118 127 136 145
Vanpool Spare Fleet (100%) 8 9 10 11 12 13
Special Operating Fleet 11 11 11 11 11 11
Special Spare Fleet 3 3 3 3 3 3
PEAK REQUIREMENT 111 120 129 138 147 156

Transit Development Plan 2011 - 2016 17 Spokane Transit Authority FINAL 3/16/2011
Transit Development Plan 2011 - 2016 18 Spokane Transit Authority FINAL 3/16/2011
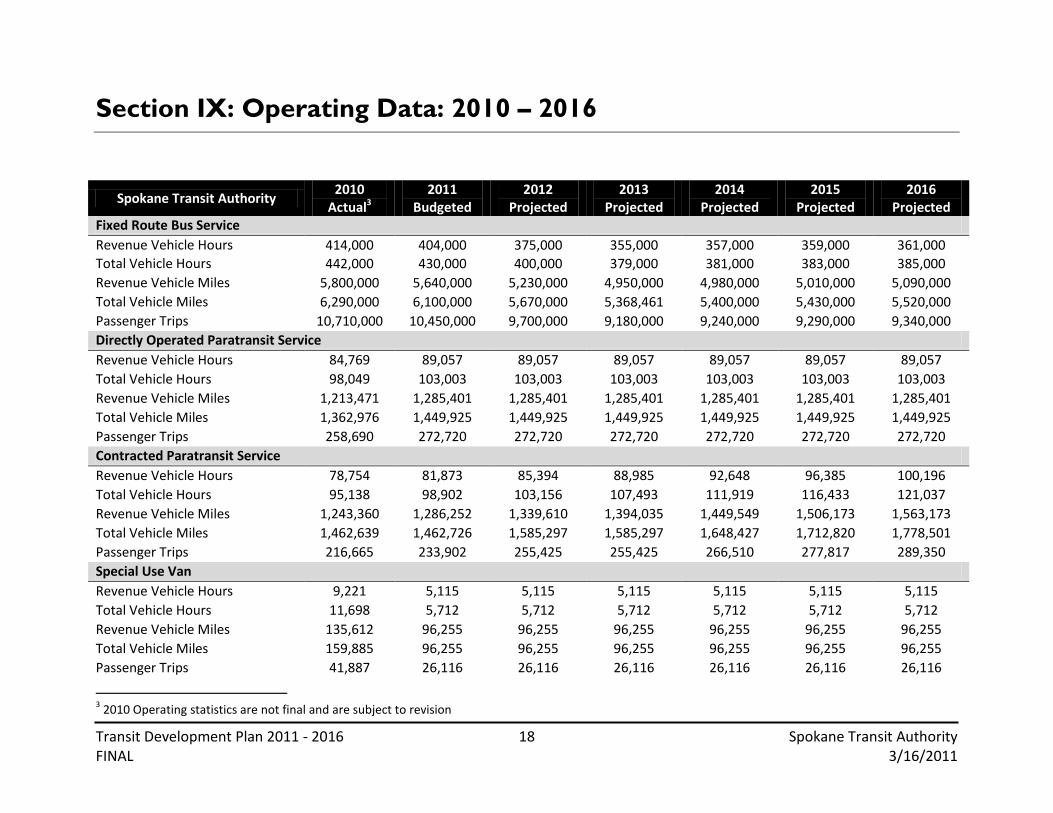
Section IX: Operating Data: 2010 – 2016
Spokane Transit Authority 2010
Actual3 2011
Budgeted 2012
Projected 2013
Projected 2014
Projected 2015
Projected 2016
Projected Fixed Route Bus Service
Revenue Vehicle Hours 414,000 404,000 375,000 355,000 357,000 359,000 361,000
Total Vehicle Hours 442,000 430,000 400,000 379,000 381,000 383,000 385,000
Revenue Vehicle Miles 5,800,000 5,640,000 5,230,000 4,950,000 4,980,000 5,010,000 5,090,000
Total Vehicle Miles 6,290,000 6,100,000 5,670,000 5,368,461 5,400,000 5,430,000 5,520,000
Passenger Trips 10,710,000 10,450,000 9,700,000 9,180,000 9,240,000 9,290,000 9,340,000
Directly Operated Paratransit Service
Revenue Vehicle Hours 84,769 89,057 89,057 89,057 89,057 89,057 89,057
Total Vehicle Hours 98,049 103,003 103,003 103,003 103,003 103,003 103,003
Revenue Vehicle Miles 1,213,471 1,285,401 1,285,401 1,285,401 1,285,401 1,285,401 1,285,401
Total Vehicle Miles 1,362,976 1,449,925 1,449,925 1,449,925 1,449,925 1,449,925 1,449,925
Passenger Trips 258,690 272,720 272,720 272,720 272,720 272,720 272,720
Contracted Paratransit Service
Revenue Vehicle Hours 78,754 81,873 85,394 88,985 92,648 96,385 100,196
Total Vehicle Hours 95,138 98,902 103,156 107,493 111,919 116,433 121,037
Revenue Vehicle Miles 1,243,360 1,286,252 1,339,610 1,394,035 1,449,549 1,506,173 1,563,173
Total Vehicle Miles 1,462,639 1,462,726 1,585,297 1,585,297 1,648,427 1,712,820 1,778,501
Passenger Trips 216,665 233,902 255,425 255,425 266,510 277,817 289,350
Special Use Van
Revenue Vehicle Hours 9,221 5,115 5,115 5,115 5,115 5,115 5,115
Total Vehicle Hours 11,698 5,712 5,712 5,712 5,712 5,712 5,712
Revenue Vehicle Miles 135,612 96,255 96,255 96,255 96,255 96,255 96,255
Total Vehicle Miles 159,885 96,255 96,255 96,255 96,255 96,255 96,255
Passenger Trips 41,887 26,116 26,116 26,116 26,116 26,116 26,116
3 2010 Operating statistics are not final and are subject to revision

Transit Development Plan 2011 - 2016 19 Spokane Transit Authority FINAL 3/16/2011
Spokane Transit Authority 2010
Actual3 2011
Budgeted 2012
Projected 2013
Projected 2014
Projected 2015
Projected 2016
Projected Vanpool Services
Revenue Vehicle Hours 24,198 28,765 32,162 34,918 37,675 40,432 43,188
Revenue Vehicle Miles 907,418 1,078,694 1,206,059 1,309,436 1,412,812 1,516,189 1,619,565
Passenger Trips 208,502 255,049 277,394 301,170 324,947 348,723 372,500
Section X: Operating Revenues and Expenditures: 2010 – 2016
2010 Estimate
2011 Budgeted
2012 Projected
2013 Projected
2014 Projected
2015 Projected
2016 Projected
Revenue
Fixed Route 8.5 9.5 8.8 8.4 8.4 9.7 9.8
Paratransit 0.4 0.5 0.6 0.6 0.6 0.7 0.8
Vanpool 0.6 0.6 0.8 0.8 1.4 1.6 1.6
Total Fare Revenue $9.4 $10.6 $10.1 $9.8 $10.5 $12.0 $12.2
Sales Tax 40.4 39.6 39.6 40.4 41.6 42.8 44.1
Fed. Preventative Maintenance Grant 8.0 8.0 8.2 8.4 8.7 8.9 9.1
State Special Needs Grant 1.0 0.3 0.7 0.7 0.7 0.8 0.8
Misc. Investments & Earnings 5.8 1.6 1.8 1.3 1.1 1.0 1.0
Total Revenue Before Capital Grants $64.7 $60.1 $60.5 $60.7 $62.5 $65.5 $67.1
Federal and State Capital Grants 6.9 4.4 2.9 0.8 0.4 0.3 0.3
Total Revenue $71.6 $64.5 $63.4 $61.5 $62.9 $65.8 $67.4

Transit Development Plan 2011 - 2016 20 Spokane Transit Authority FINAL 3/16/2011
2010 Estimate
2011 Budgeted
2012 Projected
2013 Projected
2014 Projected
2015 Projected
2016 Projected
Operating Expenses
Fixed Route 43.2 44.5 43.4 42.6 44.1 45.6 47.2
Paratransit 12.2 12.7 13.3 14.0 14.7 15.4 16.2
Vanpool 0.6 0.7 0.8 0.9 1.5 1.7 1.7
Total Operating Expense $56.1 $58.0 $57.5 $57.5 $60.3 $62.7 $65.2
Capital Projects Expenditures
Federal Portion 2.4 4.3 2.7 0.6 0.1 0.1 0.1
State Portion 0.5 0.0 0.2 0.2 0.2 0.2 0.2
Federal Stimulus Portion 4.0 0.0 0.0 0.0 0.0 0.0 0.0
Local Portion 4.0 9.0 12.8 8.6 3.5 3.4 6.8
Total Capital Expenditures $10.9 $13.4 $15.7 $9.4 $3.9 $3.7 $7.2
Cooperative Street & Road Projects 1.0 4.2
Total Expenses and Expenditures $68.0 $75.6 $73.2 $66.8 $64.2 $66.5 $72.3
Change in Cash Balance $3.6 ($11.1) ($9.8) ($5.4) ($1.3) ($0.7) ($4.9)
Beginning Cash Balance 43.7 47.3 36.3 26.5 21.1 19.8 19.1
Ending Cash Balance 47.3 36.3 26.5 21.1 19.8 19.1 14.2
Self Insurance Reserve (5.5) (5.5) (5.5) (5.5) (5.5) (5.5) (5.5)
Board Designating Operating (8.4) (8.7) (8.6) (8.6) (9.0) (9.4) (9.8)
Cash Balance After Reserves $33.4 $22.1 $12.4 $7.0 $5.3 $4.2 ($1.1)
*NOTE: Figures in this table are in tenths of millions of dollars

Transit Development Plan 2011 - 2016 21 Spokane Transit Authority FINAL 3/16/2011
Appendix
Appendix A – Priorities and Objectives
1. Safety
Emphasize Safety in all aspects of our operations
2. Earn and Retain the Community’s Trust
Engender trust and accountability
Satisfy and exceed the expectations of citizens, customers, and employees
Increase ridership
Operate an efficient, cost-effective operation
Maintain tight control of operational, administrative, and capital expenditures of public resources
Provide service that is responsive and tailored to the area’s needs
3. Provide Excellent Customer Service
To provide consistently high-quality service to customers in every interaction with Spokane Transit
4. Employee and Organizational Development
To have a well trained and highly productive workforce
To promote a healthy dialogue on important issues
To reduce employee injuries
Appendix B – Performance Measures
I. SAFETY
A. Emphasize safety in all aspects of our operations
1. Objective:
The safety and well-being of our employees and customers
2. Performance Measures
Accident Rate (Property)
Fixed Route
Measurement – (2 measures) Total accidents; Preventable accidents

Transit Development Plan 2011 - 2016 22 Spokane Transit Authority FINAL 3/16/2011
Goal - Zero. Standard - 2.0 (or less) per 100,000 miles (total accidents); 0.5 (or less) per
100,000 miles (preventable accidents)
Measured - Quarterly
Paratransit
Measurement – (2 measures) Total accidents; Preventable accidents
Goal - Zero. Standard - 2.0 (or less) per 100,000 miles (total accidents); 1.0 (or less) per
100,000 miles (preventable accidents)
Measured - Quarterly
II. EARN AND RETAIN THE COMMUNITY’S TRUST
A. Engender trust and accountability—satisfy and exceed the expectations of citizens,
customers, and employees
1. Objectives:
Operate an efficient, cost-effective operation
Maintain tight control of operational, administrative, and capital expenditures
of public resources
Provide service that is responsive and tailored to the area’s needs
Focus on communications
Make decisions based on internal and external input (Board, committees,
employees, community)
Communicate decisions thoroughly internally and externally
2. Performance Measures
Ridership
Fixed Route
Measurement – Number of unlinked trips
Goal - Retain at least 85% of 2009 Ridership
Measured - Monthly (by system, by route, by day of week)
Paratransit
Measurement – Number of unlinked trips
Goal – 0% increase from 2009

Transit Development Plan 2011 - 2016 23 Spokane Transit Authority FINAL 3/16/2011
Measured - Monthly
Vanpool
Measurement – Number of unlinked trips
Goal – 19% increase from 2010 to 2011
Measured - Monthly
Cost Efficiency
Fixed Route
Measurement – Cost per Revenue Hour
Goal – below 94% of average cost of urban systems in Washington State
Measured - no more than Quarterly
Paratransit
Measurement – Cost per Revenue Hour
Goal – below 94% of average cost of urban systems in Washington State
Measured - Quarterly
Vanpool
Measurement – Cost per Mile
Goal – Recover 109% of Operational and Administrative costs.
Measured how often – No More Than Quarterly
Cost Effectiveness
Fixed Route
Measurement – Cost per Passenger
Goal – below 94% of average cost of urban systems in Washington State
Measured - Quarterly
Paratransit
Measurement – Cost per Passenger
Goal – below 94% of average cost of urban systems in Washington State

Transit Development Plan 2011 - 2016 24 Spokane Transit Authority FINAL 3/16/2011
Measured - Quarterly
Service Effectiveness
Fixed Route
Measurement – Passengers per revenue hour
Goal – 24 system wide average
Measured - Quarterly
Paratransit
Measurement – Passengers per revenue hour
Goal – 3.0
Measured - Quarterly
Customer Security
Fixed Route
Measurement – Response to two questions on annual survey: Customer assessment of
personal safety & drivers’ driving safe
Goal – 5 on a scale of 1 to 5. Standard: 4.5 average
Measured – Annually
Paratransit
Measurement – Response to two questions on annual survey: Customer assessment of
personal safety & drivers driving safe
Goal – 5 on a scale of 1 to 5. Standard: 4.5 average
Measured – Annually
Maintenance Cost
Fixed Route
Measurement – Cost per total mile by fleet
Goal – $1.06 per mile
Measured - Quarterly
Transit Development Plan 2011 - 2016 25 Spokane Transit Authority FINAL 3/16/2011
Paratransit/Rideshare
Measurement – Cost per total mile
Goal – $0.71 per mile
Measured – Quarterly
III. PROVIDE EXCELLENT CUSTOMER SERVICE
1. Objectives:
a. To provide consistently high-quality service to customers at every interaction with Spokane Transit
b. To be rated by customers, the community, and employees as providing excellent customer service as measured annually in surveys.
2. Performance Measures
On Time Performance
Fixed Route
Measurement – 0 to 5 minutes from scheduled time point
Goal – 95% on time
Measured – Quarterly
Paratransit
Measurement – 0 to 30 minutes from scheduled pick up time
Goal – 95% on time
Measured – Monthly
Call Center
Fixed Route Abandon Rate
Measurement – Percent of calls abandoned in comparison to the total call volume
Goal – 4% or below
Measured – Monthly

Transit Development Plan 2011 - 2016 26 Spokane Transit Authority FINAL 3/16/2011
Paratransit Abandon Rate
Measurement – Percent of calls abandoned in comparison to the total call volume
Goal – 4% or below
Measured – Monthly
Fixed Route Service Level
Measurement – The percent of time calls are answered within the goal period
Goal – 90%/60 seconds
Measured – Monthly
Paratransit Service Level
Measurement – The percent of time calls are answered within the goal period
Goal – 90%/60 seconds
Measured – Monthly
Professionalism and Courtesy
Fixed Route
Measurement – Quality Counts survey response to: “Operator professional and
courteous throughout the trip”
Goal – 5 on a scale of 1 to 5. Standard – 4.5 average
Measured – Monthly
Paratransit
Measurement – Quality Counts survey response to: “Operator professional and
courteous throughout the trip”
Goal – 5 on a scale of 1 to 5. Standard – 4.5 average
Measured – Monthly
Administration/Customer Service/Paratransit Reservations/Security
Measurement – Quality Counts survey response to: “Employee was professional and
courteous throughout the call/interaction”
Goal – 5 on a scale of 1 to 5. Standard – 4.5 average

Transit Development Plan 2011 - 2016 27 Spokane Transit Authority FINAL 3/16/2011
Measured – Monthly
Driver Announcements / Introduction
Fixed Route
Measurement – Quality Counts survey response to: “Operator audibly announcing
published stops”
Goal – 100%. Standard – 100% of observations report “Average” or above.
Measured – Monthly
Paratransit
Measurement – Quality Counts survey response to: “Operator identifying
himself/herself at pick-up”
Goal –100%. Standard – 90% of observations report that operators are identifying
themselves.
Measured – Monthly
Cleanliness of coach / van
Fixed Route
Measurement – Response to Quality Counts survey
Goal –100%. Score 90% or greater as a standard
Measured – Monthly
Paratransit
Measurement – Response to Quality Counts survey
Goal –100%. Score 90% or greater as a standard
Measured – Monthly
Complaint Rate
Fixed Route
Measurement – Number of complaints received
Goal – 5 complaints per 100,000 boardings
Measured - Monthly

Transit Development Plan 2011 - 2016 28 Spokane Transit Authority FINAL 3/16/2011
Paratransit
Measurement – Number of complaints received
Goal – 5 complaints per 10,000 boardings
Measured - Monthly
Maintenance Reliability
Fixed Route
Measurement – Number of Road Calls
Goal – Less than 1 per 9,000 miles
Measured - Monthly
Paratransit
Measurement – Number of Road Calls
Goal – Less than 1 per 35,000 miles
Measured - Monthly
IV. PROVIDE ORGANIZATIONAL AND EMPLOYEE DEVELOPMENT
1. Objectives
a. To have a well-trained and highly productive workforce
b. To promote healthy dialogue on important issues
c. To reduce employee injuries
2. Performance Measures
Injury Rate (Employee)
Fixed Route
Measurement – Work days lost due to injury
Goal – 0.02 per 1000 employee hours
Measured - Quarterly
Paratransit
Measurement – Workers Comp Lost Days

Transit Development Plan 2011 - 2016 29 Spokane Transit Authority FINAL 3/16/2011
Goal – 0.04 per 1000 employee hours
Measured - Quarterly
Maintenance
Measurement – Workers Comp Lost Days
Goal – 0.05 per 1000 employee hours
Measured - Quarterly
Fixed Route
Measurement – Claims per 1,000 hours
Goal – 0.05 claims per 1,000 hours
Measured - Quarterly
Paratransit
Measurement – Claims per 1,000 hours
Goal – 0.08 claims per 1,000 hours
Measured - Quarterly
Maintenance
Measurement – Claims per 1,000 hours
Goal – 0.09 claims per 1,000 hours
Measured - Quarterly

Transit Development Plan 2011 - 2016 30 Spokane Transit Authority FINAL 3/16/2011
Appendix C – System Ridership, Miles & Hours 1994 - 2009
Fixed Route Ridership, Mile and Hours Year Annual Revenue Hours Annual Revenue Miles Total Passengers 1994 355,890 5,045,803 7,485,275 1995 369,756 5,223,287 7,467,089 1996 371,431 5,330,929 7,831,964 1997 374,718 5,389,263 8,171,745 1998 377,509 5,411,212 7,944,416 1999 375,175 5,308,483 8,099,072 2000 356,977 4,962,786 8,512,225 2001 336,401 4,641,901 8,370,460 2002 348,675 4,753,745 7,522,394 2003 351,239 4,789,262 7,504,713 2004 354,985 4,839,102 7,740,360 2005 369,494 5,031,171 7,688,002 2006 402,533 5,570,692 8,408,678 2007 406,008 5,592,842 9,436,662 2008 414,751 5,718,006 11,110,476 2009 418,247 5,811,386 11,152,841
Paratransit Ridership, Miles and Hours; Combined Service
Year Annual Revenue Hours Annual Revenue Miles Total Passengers 1994 140,137 1,953,261 396,178 1995 159,214 2,269,217 442,334 1996 149,425 2,326,050 453,341 1997 150,178 2,523,866 437,155 1998 144,944 2,479,090 435,412 1999 149,508 2,449,312 435,153 2000 148,814 2,353,028 430,920 2001 153,565 2,349,728 431,210 2002 155,983 2,386,941 435,341 2003 159,421 2,462,488 454,503 2004 158,491 2,401,305 456,969 2005 158,744 2,333,365 463,207 2006 167,309 2,549,716 493,981 2007 172,776 2,675,985 506,710 2008 178,959 2,724,953 516,516 2009 175,081 2,685,157 521,578
Paratransit Ridership, Miles and Hours; Directly Operated Year Annual Revenue Hours Annual Revenue Miles Total Passengers 1994 97,993 1,371,257 279,737 1995 101,589 1,483,982 291,545 1996 93,601 1,489,913 289,274
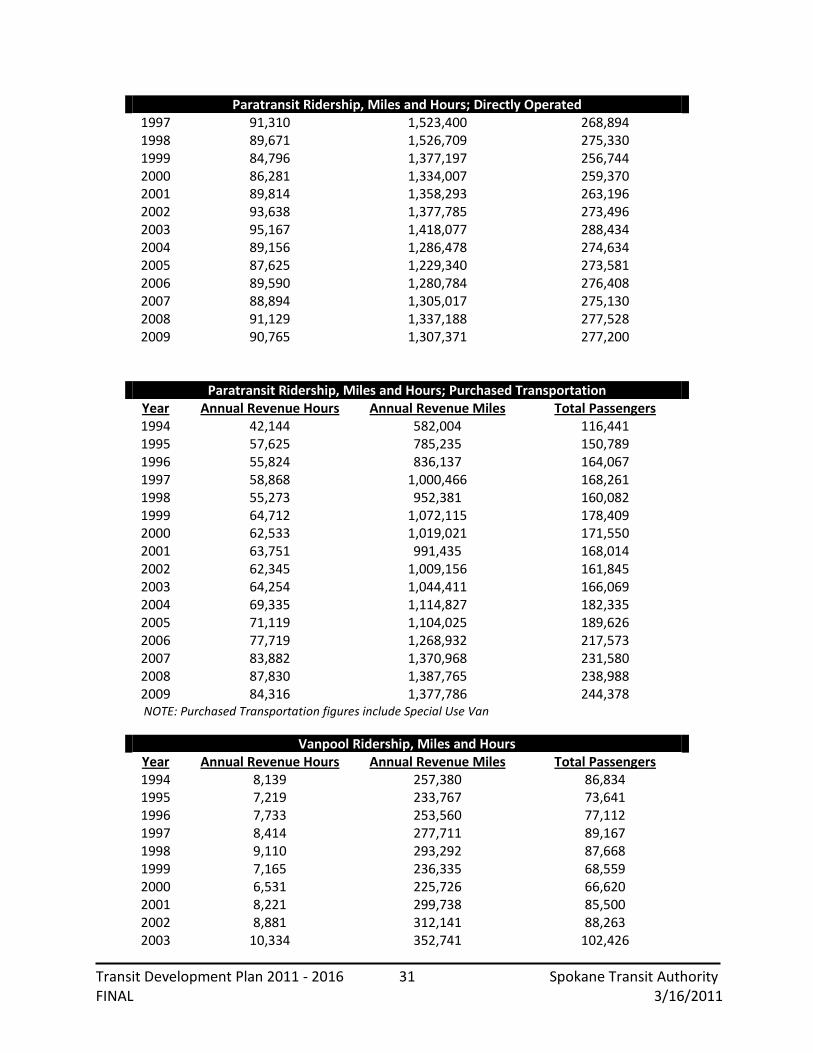
Transit Development Plan 2011 - 2016 31 Spokane Transit Authority FINAL 3/16/2011
Paratransit Ridership, Miles and Hours; Directly Operated 1997 91,310 1,523,400 268,894 1998 89,671 1,526,709 275,330 1999 84,796 1,377,197 256,744 2000 86,281 1,334,007 259,370 2001 89,814 1,358,293 263,196 2002 93,638 1,377,785 273,496 2003 95,167 1,418,077 288,434 2004 89,156 1,286,478 274,634 2005 87,625 1,229,340 273,581 2006 89,590 1,280,784 276,408 2007 88,894 1,305,017 275,130 2008 91,129 1,337,188 277,528 2009 90,765 1,307,371 277,200
Paratransit Ridership, Miles and Hours; Purchased Transportation Year Annual Revenue Hours Annual Revenue Miles Total Passengers 1994 42,144 582,004 116,441 1995 57,625 785,235 150,789 1996 55,824 836,137 164,067 1997 58,868 1,000,466 168,261 1998 55,273 952,381 160,082 1999 64,712 1,072,115 178,409 2000 62,533 1,019,021 171,550 2001 63,751 991,435 168,014 2002 62,345 1,009,156 161,845 2003 64,254 1,044,411 166,069 2004 69,335 1,114,827 182,335 2005 71,119 1,104,025 189,626 2006 77,719 1,268,932 217,573 2007 83,882 1,370,968 231,580 2008 87,830 1,387,765 238,988 2009 84,316 1,377,786 244,378
NOTE: Purchased Transportation figures include Special Use Van
Vanpool Ridership, Miles and Hours Year Annual Revenue Hours Annual Revenue Miles Total Passengers 1994 8,139 257,380 86,834 1995 7,219 233,767 73,641 1996 7,733 253,560 77,112 1997 8,414 277,711 89,167 1998 9,110 293,292 87,668 1999 7,165 236,335 68,559 2000 6,531 225,726 66,620 2001 8,221 299,738 85,500 2002 8,881 312,141 88,263 2003 10,334 352,741 102,426

Transit Development Plan 2011 - 2016 32 Spokane Transit Authority FINAL 3/16/2011
Vanpool Ridership, Miles and Hours Year Annual Revenue Hours Annual Revenue Miles Total Passengers 2004 9,938 352,415 101,971 2005 15,157 490,835 129,548 2006 17,462 609,385 163,826 2007 18,720 686,661 166,996 2008 24,267 893,380 224,264 2009 23,703 888,699 209,822

Transit Development Plan 2011 - 2016 33 Spokane Transit Authority FINAL 3/16/2011
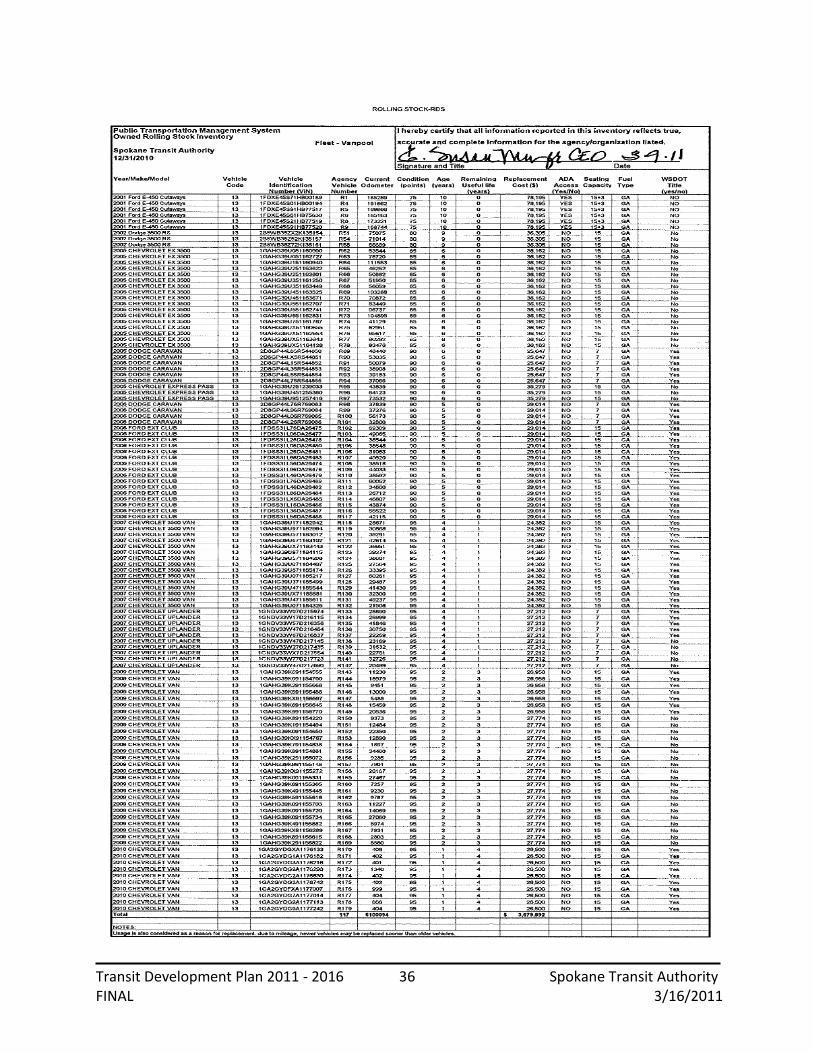
Appendix D – Asset Management Plan
Spokane Transit Authority must submit and Asset Management Plan (AMP) to the Washington
State Department of Transportation. As part of the approved AMP, a separate annual inventory
is included as part of the Transit Development Plan to the Washington State Department of
Transportation.
Per the Washington State Department of Transportation, “as a condition of receiving state
funds, publicly owned transit systems are required to submit an asset management plan to the
Washington State Transportation Commission for certification. The plan must inventory all
transportation system assets and provide a preservation plan based on the lowest life-cycle
cost (LLCC) methodologies.”4
The AMP inventory includes:
1. Rolling Stock (all passenger service vehicles owned by the agency)
2. Facilities (all facilities with a replacement value of $25,000 or greater)
3. Equipment (all equipment with a replacement value of $100,000 or greater)
The inventory includes, but is not limited to, the asset’s Condition, Age, Remaining useful life
and Replacement Cost.
4 Washington State Department of Transportation

Transit Development Plan 2011 - 2016 34 Spokane Transit Authority FINAL 3/16/2011

Transit Development Plan 2011 - 2016 35 Spokane Transit Authority FINAL 3/16/2011
Transit Development Plan 2011 - 2016 36 Spokane Transit Authority FINAL 3/16/2011

Transit Development Plan 2011 - 2016 37 Spokane Transit Authority FINAL 3/16/2011

Transit Development Plan 2011 - 2016 38 Spokane Transit Authority FINAL 3/16/2011

Transit Development Plan 2011 - 2016 39 Spokane Transit Authority FINAL 3/16/2011

Transit Development Plan 2011 - 2016 40 Spokane Transit Authority FINAL 3/16/2011

Transit Development Plan 2011 - 2016 41 Spokane Transit Authority FINAL 3/16/2011
Appendix E – Bus Fleet Contingency Plan – Inactive
Reserve/Contingency Bus Fleet
Introduction
The purpose of this section is to document the periodic need and justification for an inactive-
contingency reserve bus fleet as part of the total Spokane Transit Authority operating fleet.
Such action would be in accordance with Federal Transit Administration Circular C 9030.1A,
which permits transit agencies to reserve buses for future emergency use in lieu of selling
them.
Policy Statement STA will establish and maintain a contingency bus fleet as necessary. Such a fleet would be in addition to the normal spare ratio allowed by federal regulations and will only be used when circumstances warrant. The buses in this fleet will not be used for charter, school, or any other non-transit use, but only for emergency contingencies. Occasional use in service will occur only to the extent necessary to ensure mechanical reliability and fleet readiness. Definitions
Contingency Bus Fleet – The buses held in contingency may be used during extreme weather
conditions, for potential service expansion, emergency operation (evacuation), fuel shortages,
and for other undefined emergencies or service requirement. A bus must meet the FTA
minimum replacement standards prior to being placed into the contingency fleet.
Service Life – Service life of rolling stock begins on the date the vehicle is placed in revenue
service and continues until it is removed from service. Minimum service lives for buses are
given below. Each vehicle placed into a contingency fleet will be examined for reliability
versus need for disposal prior to placement in the contingency fleet. STA has set its standards
based on FTA guidelines as minimums, and in most cases actual vehicle use will extend
beyond this time frame.
(a) Large, heavy-duty transit buses (approximately 35’-40’, and articulated buses): at
least 12 years of service or an accumulation of at least 500,000 miles.
(b) Medium-size, heavy-duty transit buses (approximately 30’): 10 years or 350,000
miles.
Transit Development Plan 2011 - 2016 42 Spokane Transit Authority FINAL 3/16/2011
(c) Medium-size, medium-duty transit buses (approximately 30’): 7 years or 200,000
miles.
(d) Medium-size, light-duty transit buses (approximately 25’-35’): 5 years or 150,000
miles.
(e) Other light-duty vehicles such as small buses: 4 years or 100,000 miles.
(f) Rideshare vehicles (vans): 5 years regardless of mileage.
Spare Ratio – By federal requirements, the number of spare buses in the active fleet may not
exceed 20 percent of the number of vehicles operated in maximum service.
For purposes of the spare ratio calculation, “vehicles operated in maximum service” is defined
as the total number of revenue vehicles operated to meet the annual maximum service
requirement. This is the revenue vehicle count during the peak season of the year, on the
week and day that maximum service is provided excluding atypical days and one-time special
events. Scheduled standby vehicles are permitted to be included as “vehicles operated in
maximum service.” Spare ratio is usually expressed as a percentage, e.g., 100 vehicles
operating in maximum service with 20 spare vehicles is a 20 percent spare ratio.
Spare Bus Ratio (%) = Spare Bus Fleet
Vehicles Operated in Maximum Service
Unanticipated Ridership – A sudden unanticipated increase in bus ridership could require a
corresponding increase in the level of bus service. Such a ridership increase would most likely
occur as a result of an energy-related emergency or weather conditions. However, a similar
situation could occur due to a major transportation corridor construction project (causing
extreme delays, etc.) or the failure of a major transportation facility such as a river crossing,
etc.
Catastrophic Loss of Active Bus Fleet – A sudden unanticipated decrease in the availability of
buses in the active bus fleet could require that buses in the contingency fleet be placed back
into service. Such an event could occur if a significant number of buses were damaged or
destroyed by fire, tornado, flood, or other act of nature. A similar need could arise as a result

Transit Development Plan 2011 - 2016 43 Spokane Transit Authority FINAL 3/16/2011
of the premature failure of a major component of a group or sub fleet of buses, e.g., an
engine or transmission failure, or cracking of structural frame members.
Maintenance – Buses in the contingency fleet will be on a 6,000-mile preventive maintenance
schedule in accordance with STA’s approved Maintenance Plan. Periodic start-ups will occur
between normal preventive maintenance inspections so that the fleet remains ready for
service at all times. All records associated with these buses will be maintained in the vehicle
history file.