Transforming Data. P. 265 2,4 P. 276 5,7,9 Make a scatterplot of data Note non-linear form ...
25
Chapter Four Day One Transforming Data
-
Upload
chrystal-wilkinson -
Category
Documents
-
view
217 -
download
0
Transcript of Transforming Data. P. 265 2,4 P. 276 5,7,9 Make a scatterplot of data Note non-linear form ...

Chapter FourDay One
Transforming Data

P. 265 2,4 P. 276 5,7,9
Homework
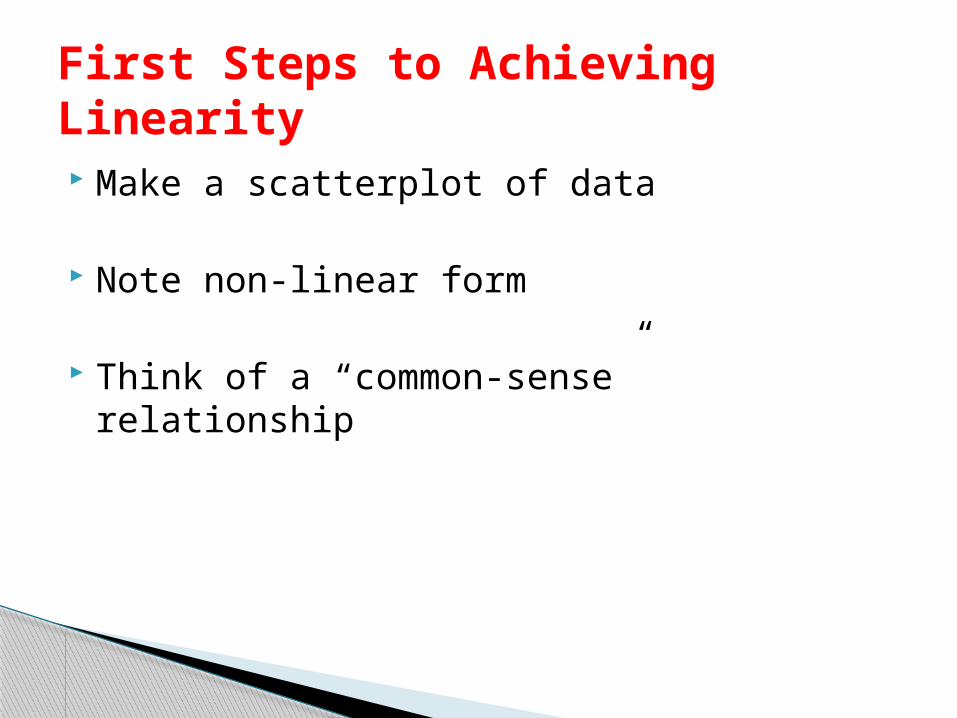
Make a scatterplot of data
Note non-linear form
Think of a “common-sense” relationship
First Steps to Achieving Linearity


Average length and weight of Atlantic Ocean rockfish
Example
Age(years)
Length(cm)
Weight(g)
Age Length
Weight
1 5.2 2 11 28.2 318
2 8.5 8 12 29.6 371
3 11.5 21 13 30.8 455
4 14.3 38 14 32.0 504
5 16.8 69 15 33.0 518
6 19.2 117 16 34.0 537
7 21.3 148 17 34.9 651
8 23.3 190 18 36.4 719
9 25.0 264 19 37.1 726
10 26.7 293 20 37.7 810

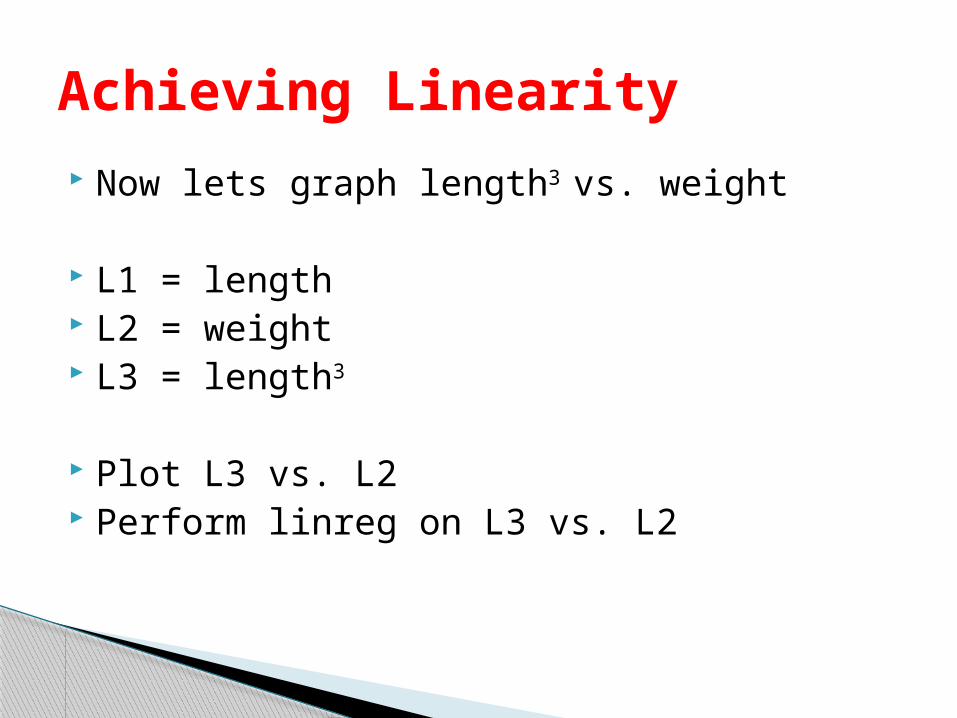
Achieving Linearity Now lets graph length3 vs. weight
L1 = length L2 = weight L3 = length3
Plot L3 vs. L2 Perform linreg on L3 vs. L2


weight = 4.066 + 0.0147(length)3
Now report r and r2
Make residual plot
Model


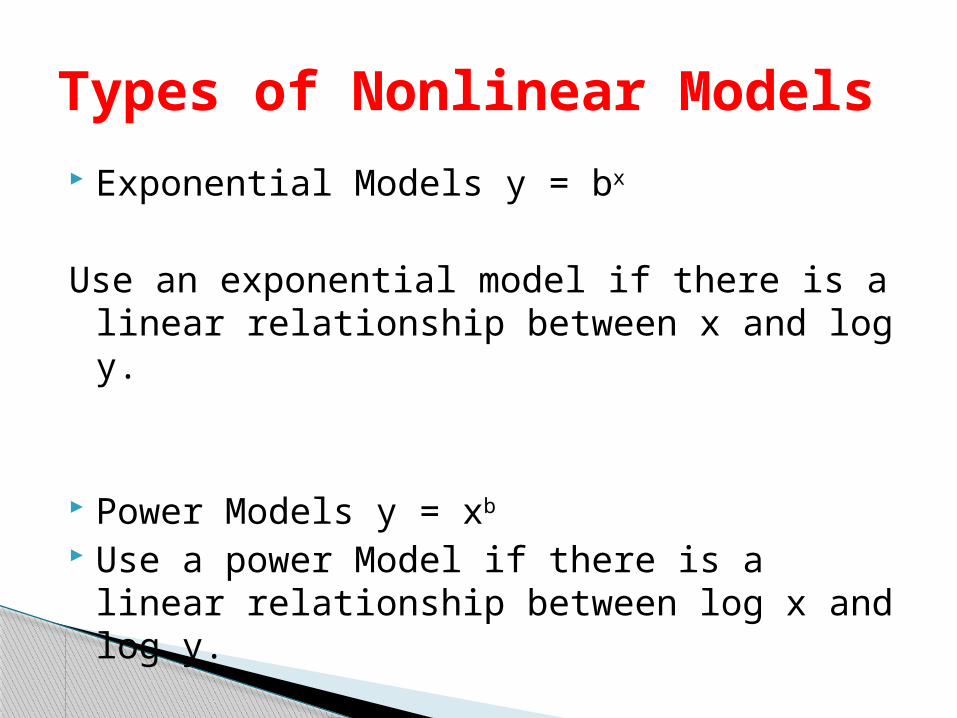
Types of Nonlinear Models Exponential Models y = bx
Use an exponential model if there is a linear relationship between x and log y.
Power Models y = xb
Use a power Model if there is a linear relationship between log x and log y.
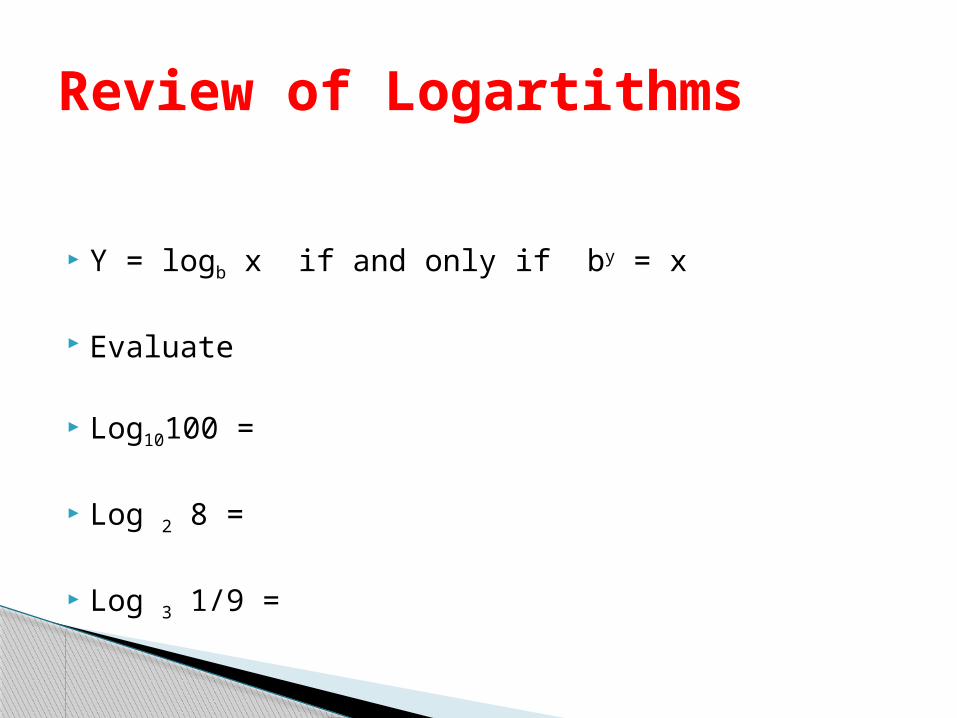
Y = logb x if and only if by = x
Evaluate
Log10100 =
Log 2 8 =
Log 3 1/9 =
Review of Logartithms

logx 125 = 3
Log 4 x = 4
Solve each equation

Logb (MN) = logb M + logb N
Logb (M/N) = logb M – logb N
Logb Mp = p logb M
Laws of Logarthims
Exponential Models Show that if y = abx, then there is a linear
relationship between x and log y
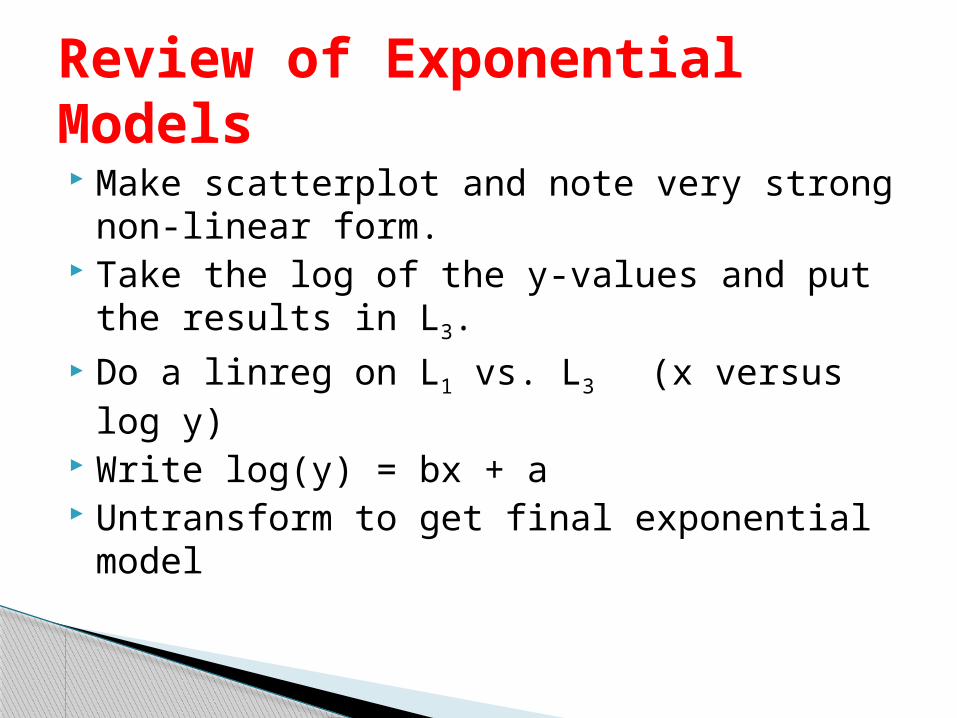
Make scatterplot and note very strong non-linear form.
Take the log of the y-values and put the results in L3.
Do a linreg on L1 vs. L3 (x versus log y) Write log(y) = bx + a Untransform to get final exponential model
Review of Exponential Models
Log y = a + bx
Untransform

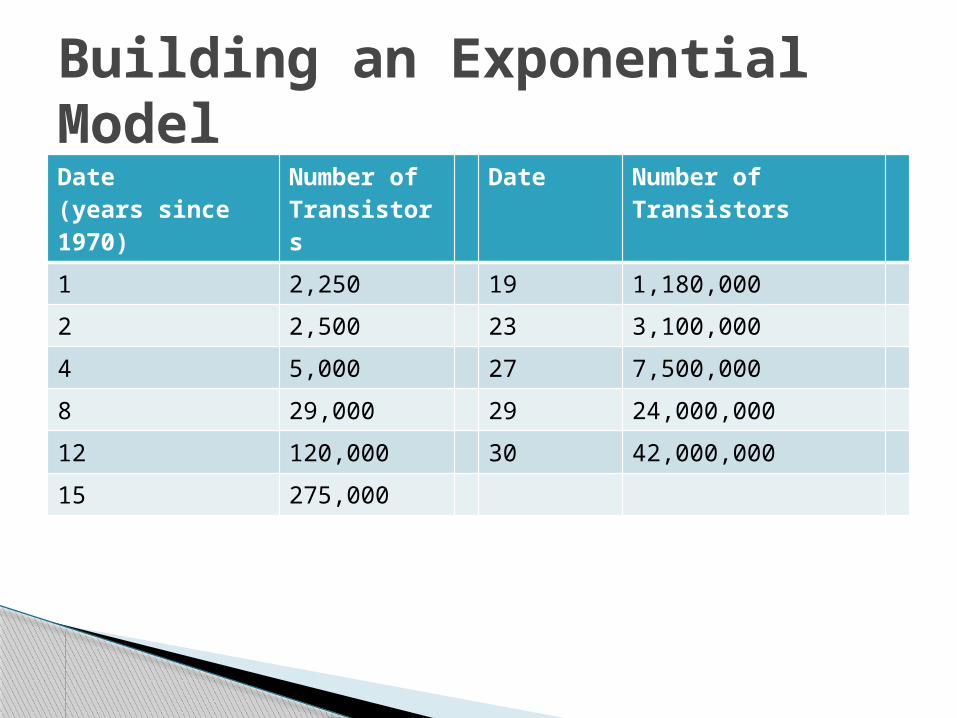
Date(years since 1970)
Number of Transistors
Date Number of Transistors
1 2,250 19 1,180,000
2 2,500 23 3,100,000
4 5,000 27 7,500,000
8 29,000 29 24,000,000
12 120,000 30 42,000,000
15 275,000
Building an Exponential Model