Dual Three-Winding Transformer Equivalent Circuit Matching ...
Transformer winding temperature estimation based on tank surface temperature
Wenyu Guo*, Jaury Wijaya, Daniel Martin, Nick Lelekakis
Dept. of Electrical and Computer Systems Engineering, Monash Univ., Wellington Road, Clayton, VIC 3800, Australia
ABSTRACT
Power transformers are among the most valuable assets of the electrical grid. Since the largest units cost in the order of millions of dollars, it is desirable to operate them in such a manner that extends their remaining lives. Operating these units at high temperature will cause excessive insulation ageing in the windings. Consequently, it is necessary to study the thermal performance of these expensive items.
Measuring or estimating the winding temperature of power transformers is beneficial to a utility because this provides them with the data necessary to make informed decisions on how best to use their assets. Fiber optic sensors have recently become viable for the direct measurement of winding temperatures while a transformer is energized. However, it is only practical to install a fiber optic temperature sensor during the manufacture of a transformer. For transformers operating without fiber optic sensors, the winding temperature can be estimated with calculations using the temperature of the oil at the top of the transformer tank. When the oil temperature measurement is not easily available, the temperature of the tank surface may be used as an alternative. This paper shows how surface temperature may be utilized to estimate the winding temperature within a transformer designed for research purposes.
Keywords: Power transformers, winding temperature, surface temperature, fiber optic sensors, modeling, thermocouples
1. INTRODUCTION The life expectancy of a transformer is reduced as its operating temperature increases. When a transformer is loaded, and current flows, the temperature of the windings will increase. For an oil-immersed power transformer, the windings are cooled with oil. The effectiveness of cooling using oil is dependent on the overall thermal design of the transformer. The distribution of temperature along a transformer winding is not uniform and so it can be challenging to estimate the hot spot temperature where the higher heat may degrade the winding insulation fastest. The hot spot temperature is therefore a major limitation for the loading capability of a power transformer.
Fiber optic sensors have recently become practical methods to directly measure the winding temperature of a transformer while energized [1, 2]. A major disadvantage of using these sensors is that it is only feasible to install them during the manufacture of a transformer. For transformers which do not have fiber optic sensors embedded, the hot spot temperature may be estimated using the models described in the IEC and IEEE loading guides for oil-immersed power transformers [3, 4], which have been widely used by the utilities.
Among the IEC and IEEE loading guides, IEC 60076-7 [3] is the latest one. It has introduced changes such as extra thermal model parameters to represent the dynamics of hot spot temperature rise over top oil during the short period after a sudden rise in load. This model requires the temperature of the oil at the top of the transformer tank to be known , either by measurement or calculation, in order to estimate the hot spot temperature (as shown in Figure 1).
*[email protected]; phone 61 3 9905-5957; fax 61 3 9905-3454; monash.edu
Sensors and Smart Structures Technologies for Civil, Mechanical, and Aerospace Systems 2011, edited by Masayoshi Tomizuka, Chung-Bang Yun, Victor Giurgiutiu, Jerome P. Lynch, Proc. of SPIE Vol. 7981, 79812Y
© 2011 SPIE · CCC code: 0277-786X/11/$18 · doi: 10.1117/12.880615
Proc. of SPIE Vol. 7981 79812Y-1
Downloaded From: http://proceedings.spiedigitallibrary.org/ on 12/09/2015 Terms of Use: http://spiedigitallibrary.org/ss/TermsOfUse.aspx

rosq O
vwpIeL
ewbeLnLE
rosq 0
ewbeLnLE
yhrKθΔ sk
ksk
k
OW )/(11
1 22
21
22
21
ττ +−
−+
hθΔ
Oθ
hθ
Figure 1. Diagram for IEC loading guide winding hot spot temperature model with per unit load and top oil temperature as inputs [3]
When the top oil temperature measurement is not available, it can be estimated from the load and ambient temperature [5-7] using the top oil temperature model described in IEC 60076-7 [3], shown in Figure 2.
x
or RRK⎥⎦
⎤⎢⎣
⎡+
+Δ
11 2
θ sk Oτ1111
+oθΔ
sk Oτ1111
+aθ
oθ
Figure 2. Diagram for IEC loading guide top oil temperature model with per unit load and ambient temperature as
inputs [3]
The authors have been carrying out investigations to whether the surface temperature of the top of the transformer tank would provide a better indication of the top oil temperature compared to the IEC model in Figure 2. The temperature of the surface of the tank is easily measurable using temperature sensors, such as thermocouple probes, without having to access a transformer internally. If the top oil temperature can be estimated using the tank surface temperature, then the IEC loading guide winding hot spot temperature model can be applied with a better degree of accuracy than when only the ambient temperature is used. This paper discusses how the top oil temperature can be estimated using the tank surface temperature. This estimation can then be used to estimate winding temperature using the IEC loading guide model.
2. EXPERIMENTAL SETUP Experiments were carried out in a laboratory using a specially designed core-type test transformer. The test transformer is a 468kVA, three-phase, three-winding (22/4.5/0.415kV, Y/Y/Y) transformer, filled with Nynas Nytro 10XN oil. The high voltage (HV) winding is a disc type aluminum winding, while the medium and low voltage (MV and LV) windings are layer type copper windings. The test transformer is equipped with 16 Luxtron fiber optic temperature sensors distributed in HV and MV windings, 20 type-K thermocouple, 5 temperature and moisture probes, an ultrasonic oil flow sensor, three pressure sensors, four current transducers and three voltage transducers. 11 of the 16 fiber optic sensors
K = load current / rated current Δθhr: hot-spot-to-top-oil gradient at rated current Δθh: hot-spot-to-top-oil gradient θo: top oil temperature θh: hot spot temperature τw: winding time constant τo:oil time constant y: winding exponent k21, k22: thermal model constants s: Laplace operator
K = load current / rated current Δθor: top oil temperature rise at rated current R: ratio of load losses at rated current to no-load losses x: oil exponent θo: top oil temperature θa: ambient temperature k11: thermal model constants τo:oil time constant s: Laplace operator
Proc. of SPIE Vol. 7981 79812Y-2
Downloaded From: http://proceedings.spiedigitallibrary.org/ on 12/09/2015 Terms of Use: http://spiedigitallibrary.org/ss/TermsOfUse.aspx
were installed in the phase B HV winding. The transformer is designed so can be run with different cooling modes applied, for instance without fans or oil circulation pumps active (ONAN mode) or with both fans and pumps running (OFAF mode).
Experiments were carried out by energizing, thus heating, the test transformer in different cooling modes from the MV side and short circuiting the HV windings. The temperature sensors could then be used to measure the change in temperature at different points in the transformer.
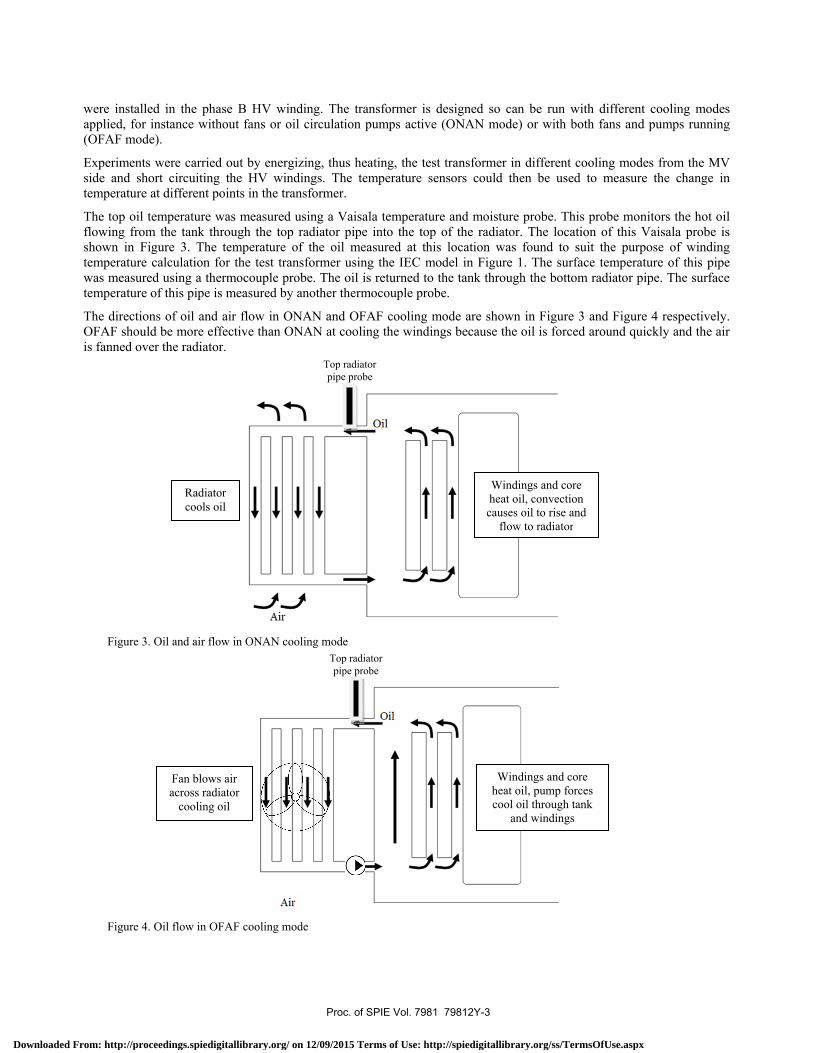
The top oil temperature was measured using a Vaisala temperature and moisture probe. This probe monitors the hot oil flowing from the tank through the top radiator pipe into the top of the radiator. The location of this Vaisala probe is shown in Figure 3. The temperature of the oil measured at this location was found to suit the purpose of winding temperature calculation for the test transformer using the IEC model in Figure 1. The surface temperature of this pipe was measured using a thermocouple probe. The oil is returned to the tank through the bottom radiator pipe. The surface temperature of this pipe is measured by another thermocouple probe.
The directions of oil and air flow in ONAN and OFAF cooling mode are shown in Figure 3 and Figure 4 respectively. OFAF should be more effective than ONAN at cooling the windings because the oil is forced around quickly and the air is fanned over the radiator.
Figure 3. Oil and air flow in ONAN cooling mode
Figure 4. Oil flow in OFAF cooling mode
Top radiator pipe probe
Windings and core heat oil, convection causes oil to rise and
flow to radiator
Radiator cools oil
Windings and core heat oil, pump forces cool oil through tank
and windings
Fan blows air across radiator
cooling oil
Top radiator pipe probe
Proc. of SPIE Vol. 7981 79812Y-3
Downloaded From: http://proceedings.spiedigitallibrary.org/ on 12/09/2015 Terms of Use: http://spiedigitallibrary.org/ss/TermsOfUse.aspx

3. WINDING TEMPERATURE ESTIMATION BASED ON SURFACE TEMPERATURE Top oil temperature, either directly measured or calculated, is often used as a reference for the winding temperature calculation. The accuracy of the estimation for the winding temperature is dependent on the precision of the top oil temperature. Estimating the winding temperature from the measured surface temperature therefore requires two steps. The first step is to estimate the top oil temperature from the surface temperature. The second step is to estimate the winding temperature from the top oil temperature using the IEC model shown in Figure 1.
3.1 In ONAN cooling mode
The equation used to estimate the top oil temperature, based on surface temperature, was determined experimentally. The transformer was loaded using the profile shown in Figure 5. This profile was specially designed for research purposes where sufficient time was given during each step to allow the transformer to reach steady state.
Figure 6 shows the temperature measured at different locations during this test. The HV winding temperature shown in Figure 6 is the output of the fiber optic sensor that usually measures the hottest temperature in overload conditions in ONAN and OFAF cooling mode among the 11 fiber optic sensors installed in HV winding phase B. This fiber optic sensor is referred to as "FOh" in this paper.
0
10
20
30
40
50
60
70
80
90
100
13-Jul-09 14-Jul-09 15-Jul-09 16-Jul-09 17-Jul-09 18-Jul-09 19-Jul-09 20-Jul-09 21-Jul-09 22-Jul-09
Load
cur
rent
, A
Figure 5. Multiple step load profile
0
10
20
30
40
50
60
70
80
90
100
13-Jul-09 14-Jul-09 15-Jul-09 16-Jul-09 17-Jul-09 18-Jul-09 19-Jul-09 20-Jul-09 21-Jul-09 22-Jul-09
Tem
pera
ture
, ̊C
HV winding temperature measured by fiber optic FOh
Top oil temperature measured by Vaisala
Top radiator pipe surface temperature measured by thermocouple
Bottom radiator pipe surface temperature measured by thermocouple
Figure 6. Temperature measurements in ONAN cooling mode
Proc. of SPIE Vol. 7981 79812Y-4
Downloaded From: http://proceedings.spiedigitallibrary.org/ on 12/09/2015 Terms of Use: http://spiedigitallibrary.org/ss/TermsOfUse.aspx

It can be observed from Figure 6 that the temperature of the oil inside the top radiator pipe, measured with the Vaisala probe, is higher than the surface temperature measured on the same pipe by the thermocouple. It is also clear that the surface temperature measured by the thermocouple monitoring the top radiator pipe is higher than the surface temperature measured by the thermocouple monitoring the bottom radiator pipe.
By scatter plotting the temperatures measured by the surface thermocouple and Vaisala oil probe, both used on the top oil pipe, a linear relationship can be observed between the two sensor measurements (shown in Figure 7). A linear trend line can be fitted to the scatter plot, shown in Figure 7.
y = 1.228x - 2.5249R² = 0.9987
0
10
20
30
40
50
60
70
80
0 10 20 30 40 50 60 70
Top
oil t
empe
ratu
re m
easu
red
by V
aisa
la, ˚C
Top radiator pipe surface temperature measured by thermocouple, ˚C
Figure 7. Top radiator pipe surface temperature measured by thermocouple and top oil temperature measured by
Vaisala show a linear relation
The linear trend line equation in Figure 7 can then be used to estimate Vaisala oil temperature output based on top radiator pipe surface temperature measurement, i.e. Top oil temperature ≈ Top radiator pipe surface temperature × 1.228 - 2.5249 (1) Equation 1 was validated against a cyclic ONAN test profile shown in Figure 8. Figure 9 shows a comparison between the top oil temperature (measured by the Vaisala probe monitoring the radiator pipe) and the result calculated using Equation 1 and the surface temperature. The root mean square error (RMSE) is around 0.6, which suggests a close estimation.
0
10
20
30
40
50
60
70
80
27-Apr-09 28-Apr-09 29-Apr-09 30-Apr-09 01-May-09 02-May-09 03-May-09 04-May-09 05-May-09
Load
cur
rent
, A
Figure 8. Cyclic load profile
Proc. of SPIE Vol. 7981 79812Y-5
Downloaded From: http://proceedings.spiedigitallibrary.org/ on 12/09/2015 Terms of Use: http://spiedigitallibrary.org/ss/TermsOfUse.aspx
-10
0
10
20
30
40
50
60
27-Apr-09 28-Apr-09 29-Apr-09 30-Apr-09 01-May-09 02-May-09 03-May-09 04-May-09 05-May-09
Tem
pera
ture
, ̊C
Measured top oil temperature
Estimated top oil temperature
Difference
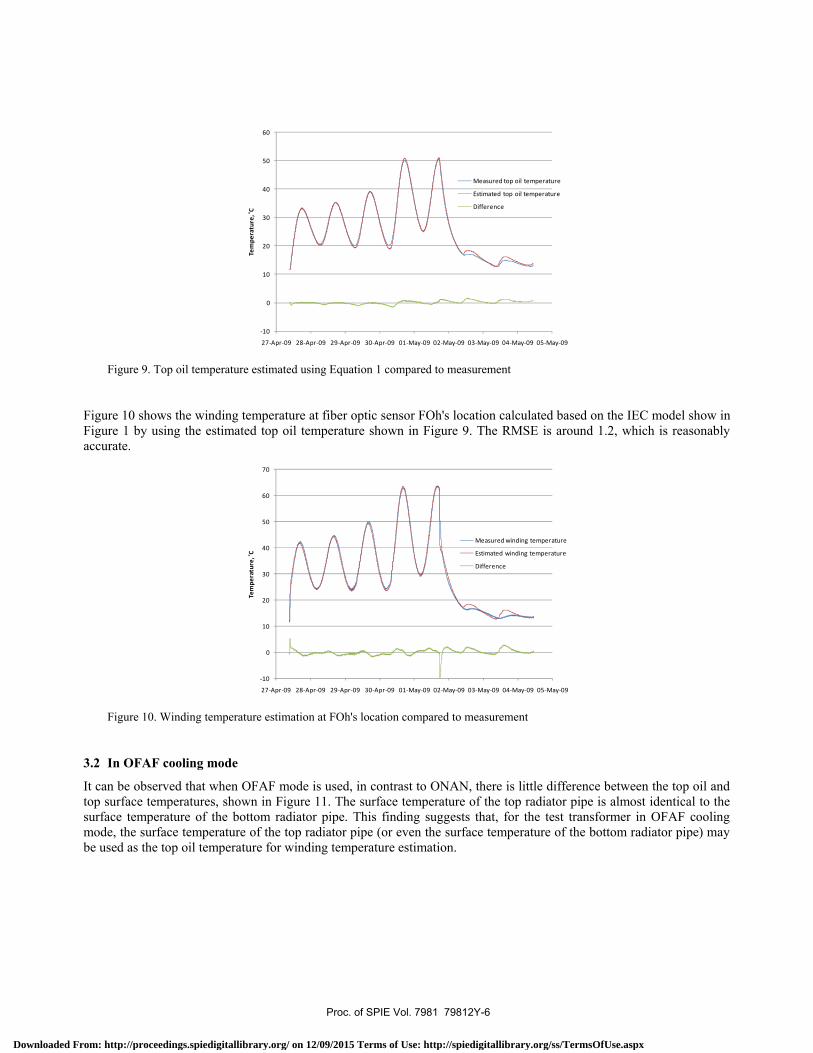
Figure 9. Top oil temperature estimated using Equation 1 compared to measurement
Figure 10 shows the winding temperature at fiber optic sensor FOh's location calculated based on the IEC model show in Figure 1 by using the estimated top oil temperature shown in Figure 9. The RMSE is around 1.2, which is reasonably accurate.
-10
0
10
20
30
40
50
60
70
27-Apr-09 28-Apr-09 29-Apr-09 30-Apr-09 01-May-09 02-May-09 03-May-09 04-May-09 05-May-09
Tem
pera
ture
, ̊C
Measured winding temperature
Estimated winding temperature
Difference
Figure 10. Winding temperature estimation at FOh's location compared to measurement
3.2 In OFAF cooling mode
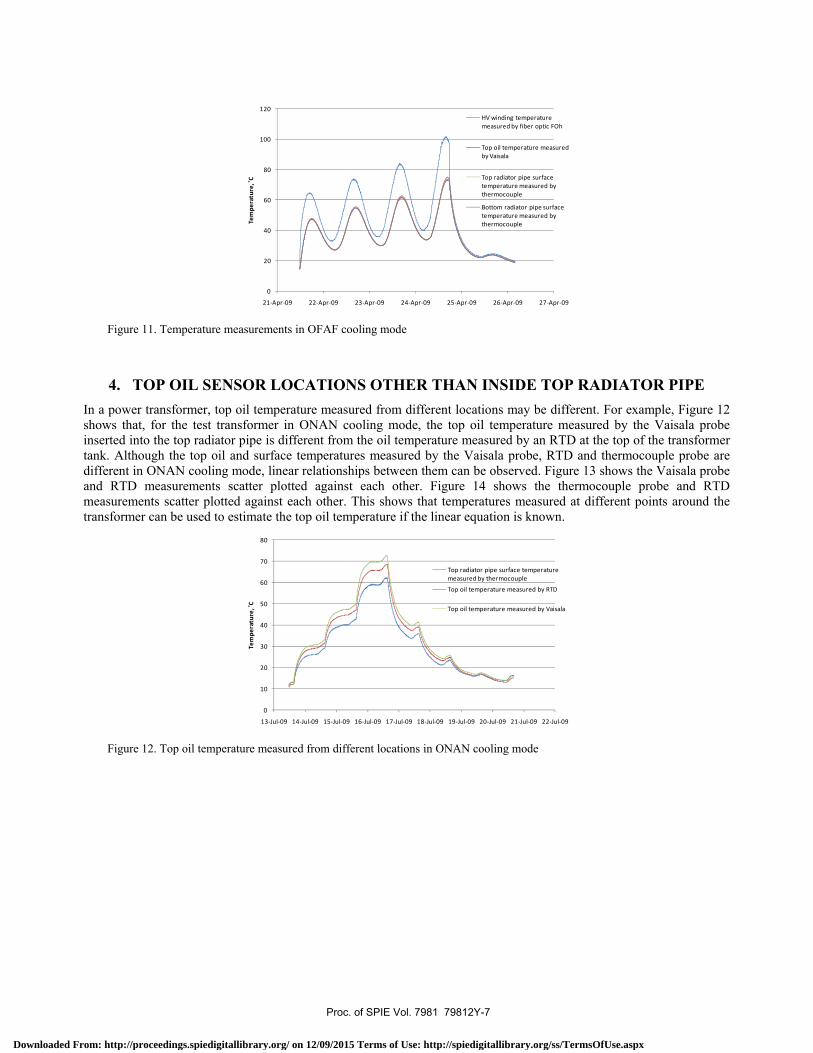
It can be observed that when OFAF mode is used, in contrast to ONAN, there is little difference between the top oil and top surface temperatures, shown in Figure 11. The surface temperature of the top radiator pipe is almost identical to the surface temperature of the bottom radiator pipe. This finding suggests that, for the test transformer in OFAF cooling mode, the surface temperature of the top radiator pipe (or even the surface temperature of the bottom radiator pipe) may be used as the top oil temperature for winding temperature estimation.
Proc. of SPIE Vol. 7981 79812Y-6
Downloaded From: http://proceedings.spiedigitallibrary.org/ on 12/09/2015 Terms of Use: http://spiedigitallibrary.org/ss/TermsOfUse.aspx
0
20
40
60
80
100
120
21-Apr-09 22-Apr-09 23-Apr-09 24-Apr-09 25-Apr-09 26-Apr-09 27-Apr-09
Tem
pera
ture
, ̊C
HV winding temperature measured by fiber optic FOh
Top oil temperature measured by Vaisala
Top radiator pipe surface temperature measured by thermocouple
Bottom radiator pipe surface temperature measured by thermocouple
Figure 11. Temperature measurements in OFAF cooling mode
4. TOP OIL SENSOR LOCATIONS OTHER THAN INSIDE TOP RADIATOR PIPE In a power transformer, top oil temperature measured from different locations may be different. For example, Figure 12 shows that, for the test transformer in ONAN cooling mode, the top oil temperature measured by the Vaisala probe inserted into the top radiator pipe is different from the oil temperature measured by an RTD at the top of the transformer tank. Although the top oil and surface temperatures measured by the Vaisala probe, RTD and thermocouple probe are different in ONAN cooling mode, linear relationships between them can be observed. Figure 13 shows the Vaisala probe and RTD measurements scatter plotted against each other. Figure 14 shows the thermocouple probe and RTD measurements scatter plotted against each other. This shows that temperatures measured at different points around the transformer can be used to estimate the top oil temperature if the linear equation is known.
0
10
20
30
40
50
60
70
80
13-Jul-09 14-Jul-09 15-Jul-09 16-Jul-09 17-Jul-09 18-Jul-09 19-Jul-09 20-Jul-09 21-Jul-09 22-Jul-09
Tem
pera
ture
, ̊C
Top radiator pipe surface temperature measured by thermocouple
Top oil temperature measured by RTD
Top oil temperature measured by Vaisala
Figure 12. Top oil temperature measured from different locations in ONAN cooling mode
Proc. of SPIE Vol. 7981 79812Y-7
Downloaded From: http://proceedings.spiedigitallibrary.org/ on 12/09/2015 Terms of Use: http://spiedigitallibrary.org/ss/TermsOfUse.aspx

y = 0.939x + 0.2589R² = 0.9999
0
10
20
30
40
50
60
70
80
0 10 20 30 40 50 60 70 80
Top
oil t
empe
ratu
re m
easu
red
by R
TD, ˚C
Top oil temperature measured by Vaisala, ˚C
Figure 13. Top oil temperature measured by Vaisala (top radiator pipe) and RTD (top of tank) show a linear
relationship
y = 1.1531x - 2.1126R² = 0.9987
0
10
20
30
40
50
60
70
80
0 10 20 30 40 50 60 70
Top
oil t
empe
ratu
re m
easu
red
by R
TD, ˚C
Top radiator pipe surface temperature measured by thermocouple, ˚C
Figure 14. Thermocouple (top radiator pipe surface) and RTD (top of tank oil temperature) measurements show a linear
relationship
5. CONCLUSIONS AND FUTURE WORK For the ONAN cooling mode a linear relationship was observed between the surface temperature of the top radiator pipe and the top oil temperatures measured at two different locations. This relationship needs to be validated using other power transformers, especially those in service. It should be simple to install a temperature sensor on to the surface of an operating transformer and record the temperatures with a data logger. If the relationship between the surface and top oil temperatures is valid for the transformer in service then the surface temperature data, along with the load, can be used to estimate the winding temperature.
When the OFAF cooling mode was investigated, little difference was found between the surface temperatures at the top and bottom pipes of the radiator. Therefore, if a large difference was found this may indicated an abnormality in the cooling mode, such as fan or pump failure.
Similar studies may be carried out for cooling modes other than ONAN and OFAF.
The impact of the sun on heating the surface of a transformer has yet to be included in the model and remains further work.
Proc. of SPIE Vol. 7981 79812Y-8
Downloaded From: http://proceedings.spiedigitallibrary.org/ on 12/09/2015 Terms of Use: http://spiedigitallibrary.org/ss/TermsOfUse.aspx

ACKNOWLEDGEMENTS
The authors wish to thank Dr. Valery Davydov, Dr. Oleg Roizman, Dr. Andrew Reykherdt, Dr. Yuriy Odarenko and Dr. Dejan Susa for their contribution towards this research.
REFERENCES
[1] Cigre Working Group 12-09, "Direct measurement of the hot-spot temperature of transformers," Électra 129, 48-51 (1990).
[2] Nordman, H. and Lahtinen, M., "Thermal overload tests on a 400-MVA power transformer with a special 2.5-p.u. Short time loading capability," IEEE Transactions on Power Delivery 18, 107-112 (2003).
[3] IEC, [IEC 60076-7: Power transformers - Part 7: Loading guide for oil-immersed power transformers], (2005). [4] IEEE, [IEEE Std C57.91-1995: IEEE Guide for Loading Mineral-Oil-Immersed Transformers], (1996). [5] Lesieutre, B. C., Hagman, W. H. and Kirtley, J. L., Jr., "An improved transformer top oil temperature model for
use in an on-line monitoring and diagnostic system," IEEE Transactions on Power Delivery 12, 249-256 (1997). [6] Swift, G., Molinski, T. S. and Lehn, W., "A fundamental approach to transformer thermal modeling. I. Theory
and equivalent circuit," IEEE Transactions on Power Delivery 16, 171-175 (2001). [7] Swift, G., Molinski, T. S., Bray, R. and Menzies, R., "A fundamental approach to transformer thermal
modeling. II. Field verification," IEEE Transactions on Power Delivery 16, 176-180 (2001).
Proc. of SPIE Vol. 7981 79812Y-9
Downloaded From: http://proceedings.spiedigitallibrary.org/ on 12/09/2015 Terms of Use: http://spiedigitallibrary.org/ss/TermsOfUse.aspx


![Winding temperature prediction in split-winding traction transformer · manufactured as seen in the Figure 1 [1] and is usually called a split-winding transformer. The transformer](https://static.fdocuments.net/doc/165x107/60b5dfb61a68b1378b3649a5/winding-temperature-prediction-in-split-winding-traction-transformer-manufactured.jpg)