Transform CSCU 2020 - CSU-AAUPDRAFT – for discussion Transform CSCU 2020 Presidents Meeting...
53
DRAFT – for discussion Transform CSCU 2020 Presidents Meeting August 07, 2014 DRAFT – for discussion only
Transcript of Transform CSCU 2020 - CSU-AAUPDRAFT – for discussion Transform CSCU 2020 Presidents Meeting...

DRAFT – for discussion
Transform CSCU 2020 Presidents Meeting
August 07, 2014
DRAFT – for discussion only

DRAFT – for discussion
Agenda
Welcome and updates Value proposition Initiative discussion Lunch Metrics Organizational effectiveness & efficiency Stakeholder engagement Closing
Description
• Sibson, background checks, GBTBA, credit restrictions, sexual misconduct compliance
• Introduce and facilitate conversation around value proposition
• Discussion of initiatives
• Review updated set of metrics • Discuss how metrics will be used
• Share process for developing
recommendations and proposed recommendations
• Town Hall agenda, schedule • Business survey highlights
• Recap from day
Presenter
Dr. Gray Dr. Gray All M. Kozlowski E. Steiner M. Kozlowski Dr. Gray
Topic Timing
8-9am 9-9:30am 9:30-11:30am 11:30-noon Noon-1pm 1-2pm 2-2:45pm 2:45-3pm
2

DRAFT – for discussion
Value proposition answers "why CSCU" for students A natural extension of existing inputs
CSCU mission & vision CSCU strategic goals Institution missions & visions
CSCU value proposition …
... stems from system’s and institutions’ input
3

DRAFT – for discussion
CSCU value proposition
• Lowest tuition in state of Connecticut
• Minimal time to degree • Enhanced student-facing
financial aid resources
• Flexible career pathways utilizing online offerings
• Improved transfer and articulation
• State of the art classrooms • Cross-registration options • Degree variety (e.g., through
Charter Oak)
• Targeted student services (e.g., embedded tutoring)
• Enhanced academic advising
• Diverse program mix, aligned to workforce needs
• High-caliber faculty • Student diversity
• Enhanced career-related programming (e.g., PTECH)
• Expanded partnerships with business community
• Growth in centers of excellence more closely tied to CT workforce needs
Affordable price
Greater preparation
to achieve life and career
goals
Superior access
to courses & programs
Quality student
experience
Value proposition to students
4

DRAFT – for discussion
Poll question: How well does this value proposition articulate the essence or spirit of the value of the collective system of Connecticut colleges and universities?
1. Not at all
2. Somewhat, but not well
3. Moderately well
4. Well
5. Very well
0 / 17 Cross-tab label
0% 0% 0% 0% 0%
1 2 3 4 5
5
Com
DRAFT – for discussion
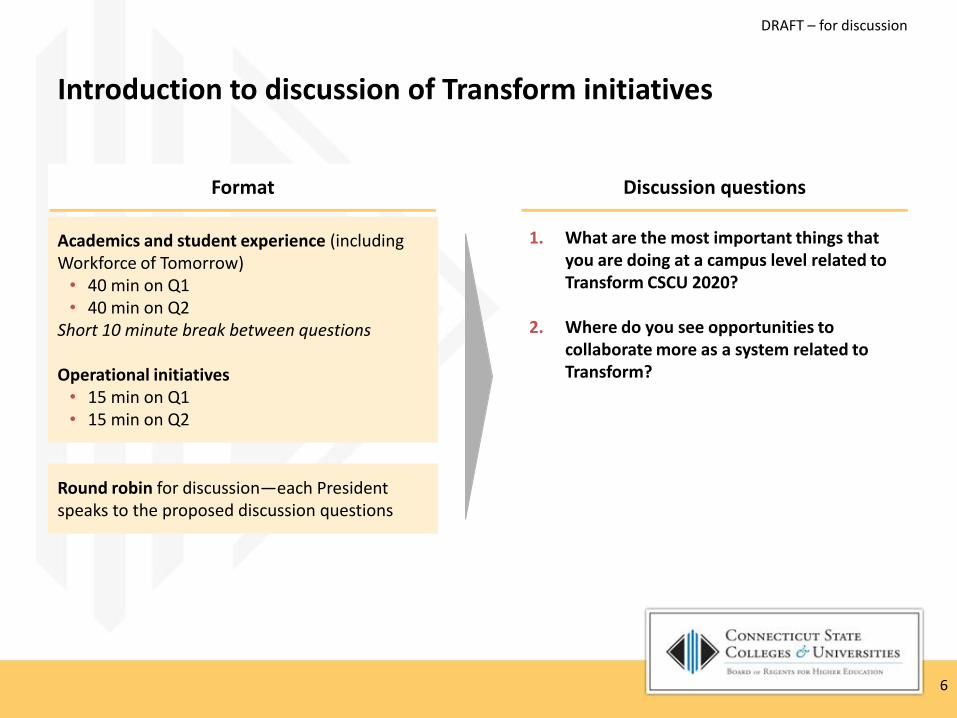
Introduction to discussion of Transform initiatives
Discussion questions Format
Academics and student experience (including Workforce of Tomorrow) • 40 min on Q1 • 40 min on Q2
Short 10 minute break between questions Operational initiatives • 15 min on Q1 • 15 min on Q2
Round robin for discussion—each President speaks to the proposed discussion questions
1. What are the most important things that you are doing at a campus level related to Transform CSCU 2020?
2. Where do you see opportunities to collaborate more as a system related to Transform?
6

DRAFT – for discussion
Academics and student experience initiatives
1. What are the most important things that you are doing at a campus level related to Transform CSCU 2020?
2. Where do you see opportunities to collaborate more as a system related to Transform?
Enrollment and retention Academics and
student experience Workforce of Tomorrow
• Early college programs • Cross-campus registration and
admissions • Go Back to Get Ahead • Veterans recruitment • Recruit non-resident students • Study abroad • Graduate recruitment • Academic advising • First-year student experience • Philanthropic
campaign to go from CCs to CSUs
• Academic calendar • Academic program
optimization • K-12 system alignment • Career preparation COEs • Strengthen liberal arts core • Faculty skill and development • Applied research –graduate
students • Seamless system-wide
transfer • State-of-the-art classrooms • Blended learning and online • Distance learning study skills • After-hours support • Invest in co-curriculars • Enhanced career services • Shared metrics
• Labor needs & workforce programs
• Career-related programs (e.g., P-Tech)
• Collaboration with business community
• Career pathway alignment— CT Tech. system
7

DRAFT – for discussion
Poll question
Question 1: How important is it to enhance the academic and student experience by leveraging
collective resources across the system?
1. Not at all important
2. Of little importance
3. Moderately important
4. Important
5. Very important
Question 2: How far along are we to realizing the potential of leveraging the collective resources
for colleges and universities?
1. Not yet started
2. Initial progress
3. Mid-way
4. Considerable progress
5. Fully there
8

DRAFT – for discussion
How important is it to enhance the academic and student experience by leveraging collective resources across the system?
1. Not at all important
2. Of little importance
3. Moderately important
4. Important
5. Very important
0 / 17 Cross-tab label
0% 0% 0% 0% 0%
1 2 3 4 5
9
Com

DRAFT – for discussion
How far along are we to realizing the potential of leveraging the collective resources for colleges and universities?
1. Not yet started
2. Initial progress
3. Mid-way
4. Considerable progress
5. Fully there
0 / 17 Cross-tab label
0% 0% 0% 0% 0%
1 2 3 4 5
10
Com

DRAFT – for discussion
Operational initiatives
System-wide policy transparency
Revenue management
Organizational effectiveness and efficiency
IT systems assessment
IT organizational structure
Facilities master plan
Code compliance/infrastructure improvements
1. What are the most important things that you are doing at a campus level related to Transform CSCU 2020?
2. Where do you see opportunities to collaborate more as a system related to Transform?
11

System-wide shared metrics
12

DRAFT – for discussion
Objectives for this conversation
Share a revised set of system-wide metrics
Share and discuss go-forward plan for how metrics can be used, including
• Defining what success looks like for each metric
• Sharing how different stakeholders might use shared metrics
• Discussing ways to measure institutional performance
• Sharing proposed plan and timing for how metrics scorecard can be rolled out
13

DRAFT – for discussion
Recall: Purpose of system-wide shared metrics is to transparently track progress towards CSCU system goals
Provide transparent way to track CSCU system-wide progress towards goals
• BOR, system and campus leadership
• Other key stakeholders, e.g., students, prospective students/parents, faculty, community
Track and share
progress
Inform decision making
Enable leadership to make data-driven decisions in improving performance against goals
• In the short term, track institutional performance over time and in comparison to other CSCU institutions (accounting for differences in context)
• In the long term, consider tracking institutional performance in comparison to external peer institutions
Metrics tracked at institution level to provide system-wide view; individual institutions may track other metrics independently
14

DRAFT – for discussion
Proposed set of 25 CSCU system-wide shared metrics (I/II) Reflects feedback from Presidents workshop and system leadership discussions
Goal Category Metric Detailed metric definition (segments listed are examples and not exhaustive)
A successful first year
First year progress
First year English/Math completion rate (including remedial students)
Percent of first-year students who completed a credit-bearing English or Math course over their first year (segment by students who take/do not take a remedial course and by full/part-time)
First year credit completion rate Percent of degree-seeking, first-year students who completed 15 credit hours (part-time) or 30 credit hours (full-time)
First year retention
First year retention rate First to second year retention rate for degree-seeking students (segment by full/part-time and by degree)
Student success
Overall progress
Overall credit completion rate Percent of degree-seeking students who completed an average of 30 credits/yr over their time of enrollment (indicates on-track to graduate in 100% of normal time), 20 credits/yr (150%), 15 credits/yr (200%) (segment by first-time/transfer, full/part-time, degree)
Overall completion
Cohort graduation rate in 100%, 150%, 200% of normal time
Percent of degree-seeking, first-time full-time cohort who graduated in 100%, 150%, 200% normal time from a higher education institution (segment by graduation from a CSCU institution/from a non-CSCU institution and by degree)
Average time to degree Average time to degree for full-time students (segment by degree and first-time/transfer)
Undergraduate transfers and completions per 100 undergraduate FTE
Number of CSCU undergraduate students who transferred or graduated per 100 undergraduate FTEs (segment by transfer to and graduation from CSCU/non-CSCU institution)
Graduate completions per 100 graduate FTE
Number of graduate students who graduated per 100 graduate FTEs
Exam performance
National exam performance (e.g., licensure)
Number of students who passed national exams on the first attempt (e.g., licensure exam) compared to a fixed year baseline
Affordability and
sustainability
Student enrollment
Student enrollment Student enrollment (headcount and FTE) (segment by degree and by full/part-time)
CSCU share of state HS graduates Percent of state high school graduates that enrolled in a CSCU institution
Student exposure to distance education
Percent of students taking fully online or hybrid courses (segment by fully online/hybrid courses)
High school and early college student enrollment
High school (dual enrollment programs) and early college (high school credit-granting programs) student enrollment compared to a fixed year baseline
Metric is BOR approved
15

DRAFT – for discussion
Proposed set of 25 CSCU system-wide shared metrics (II/II) Reflects feedback from Presidents workshop and system leadership discussions
Goal Category Metric Detailed metric definition (segments listed are examples and not exhaustive)
Affordability and
sustainability
Affordability Out-of-pocket cost to student Change in net price (tuition and fees less grant aid) over time (e.g., 1 year, 3 year, 5 year) (segment by degree)
Resource sustainability
State appropriations as a percent of revenue
State appropriations as a percent of total revenue
Education and related expense as a percent of expenses
Education and related expenses (instruction, student services, and the instructional share of academic support, operations and maintenance, and institutional support) as a percent of total expense
Average credits to degree Average credits earned by students at time of degree (segment by degree and by first-time/transfer)
Credit hours taught per faculty Average number of credit hours per faculty (segment by type of faculty)
Innovation and
economic growth
Grant funding
Grant funding (e.g., for specific research projects)
Revenues from governmental and non-governmental agencies that are for specific research projects, other types of projects, or general institutional operations (e.g., training programs)
Placement of graduates
Awards in workforce-aligned fields Awards in STEM, healthcare, education, other priority fields compared to a fixed year baseline and as a percent of total awards
Rate of graduate employment in state
Number of graduates employed within one year in CT compared to fixed year baseline and as a percent of total graduates
Rate of graduate enrollment in graduate programs
Number of graduates enrolled in graduate program within one year compared to a fixed year baseline and as a percent of total graduates
Jobs filled through partnerships Number of jobs filled through institution-sponsored programs (e.g., P-Tech) compared to a fixed year baseline
Equity
Student diversity
Diversity of student population Underrepresented student group enrollment (headcount and FTE) (segment by race/ethnicity, gender, Pell-grant, adult)
Equity of outcomes
Equity in outcomes Underrepresented student group success on other CSCU shared metrics (segment by race/ethnicity, gender, Pell-grant, adult)
Metric is BOR approved
16
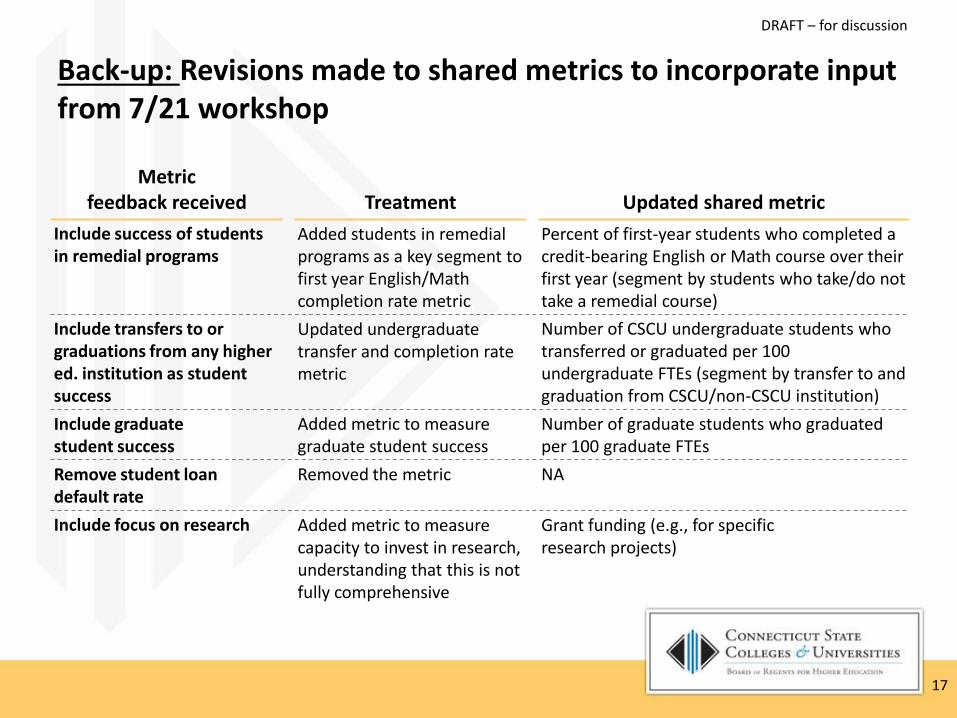
DRAFT – for discussion
Metric feedback received Treatment Updated shared metric
Include success of students in remedial programs
Added students in remedial programs as a key segment to first year English/Math completion rate metric
Percent of first-year students who completed a credit-bearing English or Math course over their first year (segment by students who take/do not take a remedial course)
Include transfers to or graduations from any higher ed. institution as student success
Updated undergraduate transfer and completion rate metric
Number of CSCU undergraduate students who transferred or graduated per 100 undergraduate FTEs (segment by transfer to and graduation from CSCU/non-CSCU institution)
Include graduate student success
Added metric to measure graduate student success
Number of graduate students who graduated per 100 graduate FTEs
Remove student loan default rate
Removed the metric NA
Include focus on research Added metric to measure capacity to invest in research, understanding that this is not fully comprehensive
Grant funding (e.g., for specific research projects)
Back-up: Revisions made to shared metrics to incorporate input from 7/21 workshop
17
DRAFT – for discussion
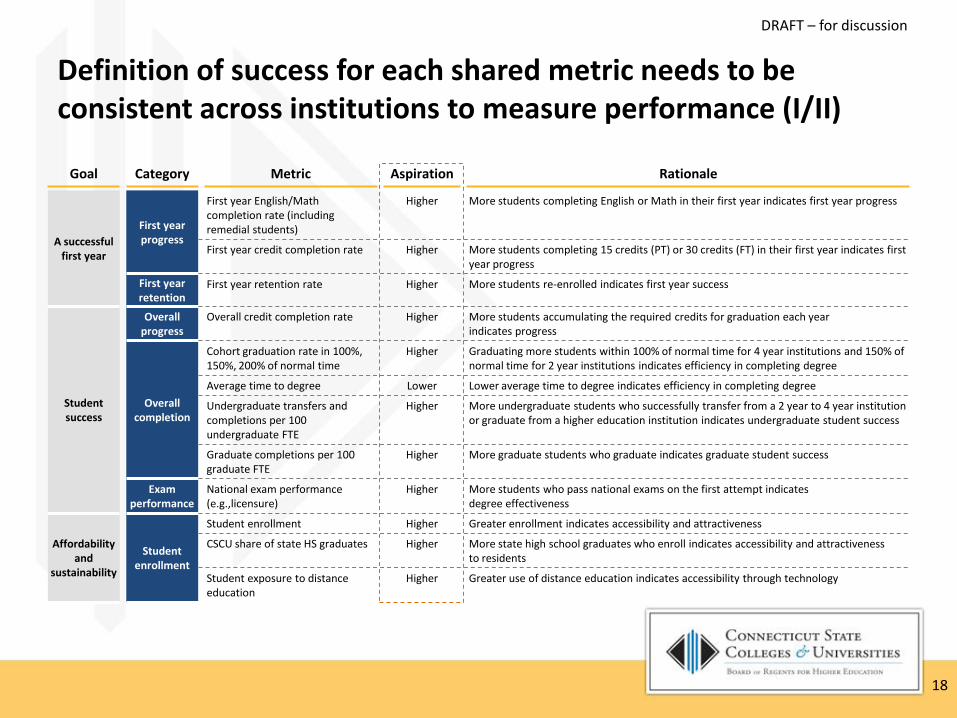
Goal Category Metric Aspiration Rationale
A successful first year
First year progress
First year English/Math completion rate (including remedial students)
Higher More students completing English or Math in their first year indicates first year progress
First year credit completion rate Higher More students completing 15 credits (PT) or 30 credits (FT) in their first year indicates first year progress
First year retention
First year retention rate Higher More students re-enrolled indicates first year success
Student success
Overall progress
Overall credit completion rate Higher More students accumulating the required credits for graduation each year indicates progress
Overall completion
Cohort graduation rate in 100%, 150%, 200% of normal time
Higher Graduating more students within 100% of normal time for 4 year institutions and 150% of normal time for 2 year institutions indicates efficiency in completing degree
Average time to degree Lower Lower average time to degree indicates efficiency in completing degree
Undergraduate transfers and completions per 100 undergraduate FTE
Higher More undergraduate students who successfully transfer from a 2 year to 4 year institution or graduate from a higher education institution indicates undergraduate student success
Graduate completions per 100 graduate FTE
Higher More graduate students who graduate indicates graduate student success
Exam performance
National exam performance (e.g.,licensure)
Higher More students who pass national exams on the first attempt indicates degree effectiveness
Affordability and
sustainability
Student enrollment
Student enrollment Higher Greater enrollment indicates accessibility and attractiveness
CSCU share of state HS graduates Higher More state high school graduates who enroll indicates accessibility and attractiveness to residents
Student exposure to distance education
Higher Greater use of distance education indicates accessibility through technology
Definition of success for each shared metric needs to be consistent across institutions to measure performance (I/II)
18

DRAFT – for discussion
Definition of success for each shared metric needs to be consistent across institutions to measure performance (II/II)
Goal Category Metric Aspiration Rationale
Affordability and
sustainability
Student enrollment
High school and early college student enrollment
Higher Greater high school and early college enrollment indicates accessibility to local high school students
Affordability Out-of-pocket cost to student Lower Lower out-of-pocket cost (tuition and fees less grant aid) to students
indicates affordability
Resource sustainability
State appropriations as a percent of revenue
Within range Consistent state funding share of total revenue indicates financial sustainability
Education and related expense as a percent of expenses
Within range Consistent education and related expense share of total expense indicates sustainability of education-related programs
Average credits to degree Within range Consistent average credits to degree indicates effectiveness of TAP and student support services
Credit hours taught per faculty Within range Consistent credit hours per faculty indicates sustainability of faculty workload
Innovation and
economic growth
Grant funding
Grant funding (e.g., for specific research projects)
Higher Greater grant funding indicates capacity to invest in research
Placement of graduates
Awards in workforce-aligned fields Higher More awards in priority fields indicates alignment of programs to workforce needs
Rate of graduate employment in state
Higher Greater graduate employment indicates marketability of graduates
Rate of graduate enrollment in graduate programs
Higher More graduates enrolled in graduate programs indicates marketability of graduates
Jobs filled through partnerships Higher More jobs filled by students indicates success of business partnerships
Equity
Student diversity
Diversity of student population Higher Greater student diversity indicates accessibility to all students
Equity of outcomes
Equity in outcomes Higher Greater equality in performance across groups indicates institutional effectiveness
19

DRAFT – for discussion
Stakeholders can use shared metrics for strategic planning and for understanding system performance
Engagement
Periodic meetings, e.g., • Workshops on system-wide progress • Workshop deep dives on subset of
metrics • Individual meetings on institutional
progress
Annual update
Executive staff meetings
Self-directed
Annual BOR update, e.g., to Higher Education and Employment Advancement Committee
Briefing by CSCU
Use of shared metrics
• Identify strategic areas for improvement • Inform policies, procedures, and operations to
improve performance on shared metrics • Share best practices across institutions
• Inform strategic direction • Inform areas for further investigation
• Inform strategic planning • Inform resource allocation
• Understand performance of the system on key higher education metrics
• Inform state goals and initiatives in higher education
• Inform resource allocation to BOR
• Understand performance and strategic direction of the system
Stakeholder
Presidents
BOR
System leadership
Students, faculty, staff, general public
State legislature
Press
20

DRAFT – for discussion
Performance can be tracked and reported on an institutional level and rolled up to a system-wide view
Current state Future state
Each institution tracks performance on institutional metrics that reflect its unique mission
Each institution tracks performance on system-wide metrics that reflect CSCU goals
Institutional performance is rolled up to view performance by institution type
Institutional performance is rolled up to view system-wide performance
4 CSUs CO
12 CCs
Each institution tracks performance on institutional metrics that reflect its unique mission
Many CSCU shared metrics may be redundant to metrics currently
measured by institutions
Select metrics can be collected centrally for broader reporting
CSCU Shared Metrics Progress Metric Goal
1
2
3
4
5
6
7
8
9
10
11
12
13
14
15
16
17
18
19
20
21
22
23
24
CSCU Shared Metrics Criteria Metric Goal
1
2
3
4
5
6
7
8
9
10
11
12
13
14
15
16
17
18
19
20
21
22
23
24
CSCU Shared Metrics Criteria Metric Goal
1
2
3
4
5
6
7
8
9
10
11
12
13
14
15
16
17
18
19
20
21
22
23
24
CSCU Shared Metrics Criteria Metric Goal
1
2
3
4
5
6
7
8
9
10
11
12
13
14
15
16
17
18
19
20
21
22
23
24
CSCU Shared Metrics Criteria Metric Goal
1
2
3
4
5
6
7
8
9
10
11
12
13
14
15
16
17
18
19
20
21
22
23
24
CSCU Shared Metrics Criteria Metric Goal
1
2
3
4
5
6
7
8
9
10
11
12
13
14
15
16
17
18
19
20
21
22
23
24
CSCU Shared Metrics Criteria Metric Goal
1
2
3
4
5
6
7
8
9
10
11
12
13
14
15
16
17
18
19
20
21
22
23
24
CSCU Shared Metrics Criteria Metric Goal
1
2
3
4
5
6
7
8
9
10
11
12
13
14
15
16
17
18
19
20
21
22
23
24
CSCU Shared Metrics Criteria Metric Goal
1
2
3
4
5
6
7
8
9
10
11
12
13
14
15
16
17
18
19
20
21
22
23
24
CSCU Shared Metrics Criteria Metric Goal
1
2
3
4
5
6
7
8
9
10
11
12
13
14
15
16
17
18
19
20
21
22
23
24
CSCU Shared Metrics Criteria Metric Goal
1
2
3
4
5
6
7
8
9
10
11
12
13
14
15
16
17
18
19
20
21
22
23
24
CSCU Shared Metrics Criteria Metric Goal
1
2
3
4
5
6
7
8
9
10
11
12
13
14
15
16
17
18
19
20
21
22
23
24
CSCU Shared Metrics Criteria Metric Goal
1
2
3
4
5
6
7
8
9
10
11
12
13
14
15
16
17
18
19
20
21
22
23
24
CSCU Shared Metrics Criteria Metric Goal
1
2
3
4
5
6
7
8
9
10
11
12
13
14
15
16
17
18
19
20
21
22
23
24
CSCU Shared Metrics Criteria Metric Goal
1
2
3
4
5
6
7
8
9
10
11
12
13
14
15
16
17
18
19
20
21
22
23
24
CSCU Shared Metrics Criteria Metric Goal
1
2
3
4
5
6
7
8
9
10
11
12
13
14
15
16
17
18
19
20
21
22
23
24
CSCU Shared Metrics Criteria Metric Goal
1
2
3
4
5
6
7
8
9
10
11
12
13
14
15
16
17
18
19
20
21
22
23
24
CSCU Shared Metrics Criteria Metric Goal
1
2
3
4
5
6
7
8
9
10
11
12
13
14
15
16
17
18
19
20
21
22
23
24 CSCU Shared Metrics Criteria Metric Goal
1
2
3
4
5
6
7
8
9
10
11
12
13
14
15
16
17
18
19
20
21
22
23
24
CSCU Shared Metrics Criteria Metric Goal
1
2
3
4
5
6
7
8
9
10
11
12
13
14
15
16
17
18
19
20
21
22
23
24
CSCU Shared Metrics Criteria Metric Goal
1
2
3
4
5
6
7
8
9
10
11
12
13
14
15
16
17
18
19
20
21
22
23
24
CSCU Shared Metrics Criteria Metric Goal
1
2
3
4
5
6
7
8
9
10
11
12
13
14
15
16
17
18
19
20
21
22
23
24
CSCU Shared Metrics Criteria Metric Goal
1
2
3
4
5
6
7
8
9
10
11
12
13
14
15
16
17
18
19
20
21
22
23
24
CSCU Shared Metrics Criteria Metric Goal
1
2
3
4
5
6
7
8
9
10
11
12
13
14
15
16
17
18
19
20
21
22
23
24
CSCU Shared Metrics Criteria Metric Goal
1
2
3
4
5
6
7
8
9
10
11
12
13
14
15
16
17
18
19
20
21
22
23
24
CSCU Shared Metrics Criteria Metric Goal
1
2
3
4
5
6
7
8
9
10
11
12
13
14
15
16
17
18
19
20
21
22
23
24
CSCU Shared Metrics Criteria Metric Goal
1
2
3
4
5
6
7
8
9
10
11
12
13
14
15
16
17
18
19
20
21
22
23
24
CSCU Shared Metrics Criteria Metric Goal
1
2
3
4
5
6
7
8
9
10
11
12
13
14
15
16
17
18
19
20
21
22
23
24
CSCU Shared Metrics Criteria Metric Goal
1
2
3
4
5
6
7
8
9
10
11
12
13
14
15
16
17
18
19
20
21
22
23
24
CSCU Shared Metrics Criteria Metric Goal
1
2
3
4
5
6
7
8
9
10
11
12
13
14
15
16
17
18
19
20
21
22
23
24
CSCU Shared Metrics Criteria Metric Goal
1
2
3
4
5
6
7
8
9
10
11
12
13
14
15
16
17
18
19
20
21
22
23
24
CSCU Shared Metrics Criteria Metric Goal
1
2
3
4
5
6
7
8
9
10
11
12
13
14
15
16
17
18
19
20
21
22
23
24
CSCU Shared Metrics Criteria Metric Goal
1
2
3
4
5
6
7
8
9
10
11
12
13
14
15
16
17
18
19
20
21
22
23
24
CSCU Shared Metrics Criteria Metric Goal
1
2
3
4
5
6
7
8
9
10
11
12
13
14
15
16
17
18
19
20
21
22
23
24
CSCU Shared Metrics Criteria Metric Goal
1
2
3
4
5
6
7
8
9
10
11
12
13
14
15
16
17
18
19
20
21
22
23
24
21

DRAFT – for discussion
Four ways to measure institutional performance Institutions can be measured by one or any combination of approaches
Description
Performance indicator
Above average
Near average
Below average
Exceeds target
Meets target
Below target
Above average
Near average
Below average
Pros
Cons
Improved
No change
Declined
Improvement over time
Performance on metric improves over last period
Most direct measure of institutional progress and feasible to implement
Does not reflect if institution performance is competitive
Performance against institutional target
Performance on metric is above institutional target set by system and institution leadership, e.g., increase enrollment by 1%
Target can be set to reflect system needs and aspirations
NA
Comparison to peers within CSCU
Performance on metric is above the average of peers within CSCU, i.e. amongst CCs and amongst CSUs
Exposes learning opportunities and focus areas within CSCU
Comparison may not take specific institutional differences into account
Comparison to peers external to CSCU
Performance on metric is above the average of IPEDS and aspirational peers external to CSCU
Reflects competitiveness of CSCU performance against relevant peers
Comparison may not take specific institutional differences into account
System roll-up can be created in all approaches
b c d a
22

DRAFT – for discussion
Poll question: Which of the ways to measure performance do you believe will be most helpful to inform progress against system-wide goals?
1. Improvement over time
2. Performance against institutional target
3. Comparison to peers within CSCU
4. Comparison to peers external to CSCU
0 / 17 Cross-tab label
0% 0% 0% 0%
1 2 3 4
23
Com

DRAFT – for discussion
Sample scorecard: performance indicator highlights areas for leadership and improvement on a metric level
Illustrative
Sample scorecard for CSCU institution
Metrics with aspiration to be higher or lower
Within range
Out of range
Key
Improved
No change
Declined
Metrics with aspiration to be in
range
Institution performance over time for each metric can be
rolled-up to view system performance over time
Needs focus
Learn from
24

DRAFT – for discussion
Approach to shared metrics scorecard roll-out Target June 1 internal release and January 1 public release of 2013/14 data
2014 2015 2016
Plan Communicate Execute Refine
Roll-out activities
Plan shared metrics initiative and engage stakeholders
Collect and validate data
Generate scorecard
Refine scorecard Develop public
communications plan, e.g., website
6/1 Internal scorecard
1/1 Public scorecard
9/1 Supplemental analysis
6/1 1/1 Release timing
9/1 3/1 12/18 Seek BOR approval
September Workshop to discuss system progress
June Feedback on preliminary scorecard Stakeholder
engagement
7/21 Workshop on set of shared metrics
8/7 Feedback on go-forward plan
October Meeting to align on communications to students, faculty, staff
Institution IR | Executive Sponsors | Executive Steering Committee | BOR
Scorecard release President engagement
25

Organizational effectiveness and efficiency initiative
26
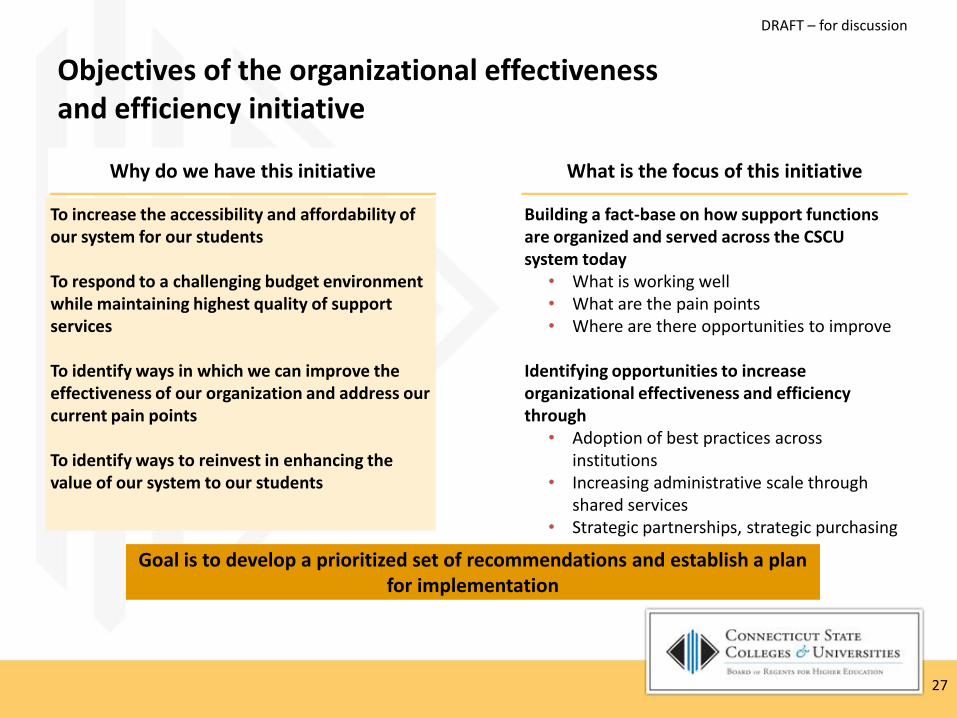
DRAFT – for discussion
Objectives of the organizational effectiveness and efficiency initiative
To increase the accessibility and affordability of our system for our students
To respond to a challenging budget environment while maintaining highest quality of support services To identify ways in which we can improve the effectiveness of our organization and address our current pain points
To identify ways to reinvest in enhancing the value of our system to our students
Building a fact-base on how support functions are organized and served across the CSCU system today
• What is working well • What are the pain points • Where are there opportunities to improve
Identifying opportunities to increase organizational effectiveness and efficiency through
• Adoption of best practices across institutions
• Increasing administrative scale through shared services
• Strategic partnerships, strategic purchasing
What is the focus of this initiative Why do we have this initiative
Goal is to develop a prioritized set of recommendations and establish a plan for implementation
27

DRAFT – for discussion
System and campus level stakeholder input informed proposed recommendations
Conversations with system leadership across functions
on early hypotheses
Insight from Presidents at budget hearings on potential
for shared services
Workshops with heads of IT, Finance, and HR
from each of the 17 campuses
Analysis of size and spend of support functions across the system
28

DRAFT – for discussion
Insight from Presidents during budget hearings on what functions have potential for shared services
Finance
• Purchasing • Accounting • Travel reimbursement • AP/AR • Grant writing • Payroll
• Payroll • Compensation and benefits • Training & development • Affirmative action reporting • Recruiting
HR
• Financial aid processing • Call center – General information, financial aid, tech
support • General business services • Marketing
• Processing for enrollment/admissions • Online low-enrolled courses • Regionally shared academic programs • Genius classrooms
Other Academics
Source: Budget presentations given by presidents to Finance committee in June 2014
29

DRAFT – for discussion
Other higher education institutions around the country are also exploring shared services
Other
State of Ohio University of Georgia system (28 institutions) Oregon University system (7 institutions) University of North Carolina Virginia Community College System
Financial management support Financial reporting Budget support Expense management Accounts payable
IT Accounts Payable/Accounts Receivable HR call center Purchasing/strategic sourcing
Developing a lessons learned / best practices portfolio
30

DRAFT – for discussion
Highlights from finance workshop with CFOs and Deans of Administration
What's working well
Collective use of resources across the system can be beneficial to institutions • Call center support for financial aid from Charter
Oak can be extended
Use of technology can help simplify work • Use of technology in the cashier's office helps
streamline billing, refunds, and collections
Local resources allow for fast response • Localized purchasing allows for timely, quick
response
Pain points
Several paper intensive processes can benefit from more automation and centralization • Accounts payable • Purchasing contracts • Data collection process for financial aid (currently
causes delays for students) • Equipment inventory (impacts audit process) • Data collection for budget and reporting
Some areas lack system-wide expertise • Need system-wide expertise on financial aid to
communicate changes, interpret regulations, and confirm method of implementation
Lack of consolidation of one financial system means duplication of work
Not enough staffing for grants
Source: Workshop with CFOs on June 17, 2014
31

DRAFT – for discussion
Highlights from workshop with heads of HR
What's working well
Some practices are working in pockets but should be expanded across the system • Self-service timesheets if used more broadly
can reduce administrative burden • Diversity training exists at Universities and
should be expanded to Community Colleges • Charter Oak's online training could be
expanded Pooled sourcing of contracts can help us become more efficient • E.g., Universities have a group pricing for
background checks
Pain points
Paper intensive processes can benefit from automation • Payroll is very paper-intensive; direct deposit
and self-reporting timesheets should be required
Need for more best practice sharing and training across institutions in the system related to: • Contract administration • Training on how to use classified job lists
Need for better system-wide expertise • Related to workers compensation and FMLA
Source: Workshop with heads of HR on June 16, 2014
32

DRAFT – for discussion
Less need for in-person interaction
Interaction can be virtual; quick response time not critical or can be enabled by technology
High level of standardization
Activities are fairly standardized across campuses and benefit from, or require, consistent approach
Less need for local knowledge
Low functional complexity, requiring CSCU familiarity rather than deep campus-specific knowledge
High scale potential High potential for economies of scale
High level of specialization
Requires specialized or deep technical skills
Benefit by central coordination
Central decision-making/oversight or consolidation of output needed
Criteria for considering move to shared services or centers of excellence (centrally or regionally)
33

DRAFT – for discussion
Key recommendations to increase organizational effectiveness and efficiency across functions (I/II)
Create centralized
shared services
• Centralize payroll and comp & benefits and a team of experts for workers comp & FMLA
• Centralize purchasing, AP, accounting , and certain grant writing activities • Consolidate compliance and accountability reports centrally for IR & Planning • Centralize Tier 2 help desk by expanding existing COSC function to serve
entire system • Centralize facilities master planning function at the system office
Create regional
centers of excellence
• Create regional teams for diversity & equity, training & development, and retirement
• Regionalize instructional design and support for firewall, telecom and network
• Implement regional communications crisis response teams
Facilities Finance HR
Other
Financial Aid and Admissions
Public Affairs IR & Planning
IT
34

DRAFT – for discussion
Key recommendations to increase organizational effectiveness and efficiency across functions (II/II)
Build strategic vendor
partnerships
• Consolidate use of strategic partners for HR benefits & policies (e.g., background checks) • Identify and partner with a vendor to streamline travel bookings and reimbursement
process • Engage with strategic partners for IT network infrastructure (WAN, telecom) • Combine into single ERP, move to the cloud, and eliminate single point of failure • Partner with a strategic vendor to streamline back-end processing of admissions and
financial aid applications
Use technology to increase
efficiency and effectiveness
• Implement self-service timesheets across community colleges and system office • Expand use of online training system to offer more trainings and track compliance • Expand use of P-cards across the system • Expand use of barcoding for fixed assets across the system • Deploy virtual desktops to reduce overall operating costs and increase security • Establish single chart of accounts and enable pull reporting from ERPs across all
institutions
Streamline policies/processes & share best
practices
• Increase effectiveness and efficiency in custodial/maintenance activities, potentially through expanded use of vendor partnerships
• Many policies, processes, and best practices have been identified as needing further examination to increase effectiveness & efficiency within functions—currently in a "parking lot" as not in scope for current phase of the initiative
Facilities Finance HR
Other
Financial Aid and Admissions
Public Affairs IR & Planning
IT
35

DRAFT – for discussion
Proposed prioritization criteria
Lower Higher
Higher
Approach opportunistically
Quick win
Little use to pursue
Long running project
Ease
of
imp
lem
en
tati
on
Payback potential
Lower
Criteria • Implementation risk • External complexity • Political resistance • Timeline to
implement
Criteria • Ability to address pain-
points • Monetary potential • Timing to realize
benefits
36

DRAFT – for discussion
Next steps
Work on prioritizing recommendations using proposed criteria
Continue dialogue on what can be reasonably achieved in what time frame
Begin laying out implementation next steps related to these recommendations
37

DRAFT – for discussion
Poll question: Given the value proposition of keeping our system affordable and accessible for students, how important is it to pursue the recommendations to enhance organizational effectiveness and efficiency?
1. Not at all important
2. Of little importance
3. Moderately important
4. Important
5. Very important
0 / 17 Cross-tab label
0% 0% 0% 0% 0%
1 2 3 4 5
38
Com

Stakeholder engagement: town halls and business survey results
39

DRAFT – for discussion
Proposed agenda for Town Halls Target for at least one Board member and one Executive Sponsor at each Town Hall
Topic Description Slides Who presents
Transform intro (~15 minutes)
• What is Transform, why we are doing it, where we are in the process
• Description of Transform • Summary of stakeholder
engagement • Value proposition • Where we are with Transform • What is the campus impact
• Combination of Campus President, BOR member, and Dr. Gray (based on who is available)
Initiative spotlights (~15 mins)
Focus on those most important to stakeholders (faculty, staff and students)
• Academic priorities: e.g., seamless transfer, smart classrooms
• Organizational effectiveness and efficiency
• Few pages on initiative highlights—progress to date and path forward
• Transform Executive Sponsor (all materials will have talking points)
• System and campus leadership
Discussion, Q&A (80 mins)
• Some “thought starter” questions
• Comments, questions, input
• Display the value proposition slide
What's next and how to get involved
(~10 mins)
• What remains for Transform (e.g., December report)
• Summary of options for how to get involved in Transform, who to contact
• High-level timeline • Options for getting involved
• Campus President
40

DRAFT – for discussion
Transform Town Hall calendar
41
September/October 2014
Monday Tuesday Wednesday Thursday Friday
1 2 3 4 5
8 9 10 11 12
3:00 pm - CCSU 11:00 am - Three Rivers 3:00 pm - ECSU 1:00 pm - SCSU
15 16 17 18 19
2:30 pm - Asnuntuck 3:00 pm - WCSU 3:30 pm - Manchester
9:00 am - Naugatuck Valley 3:00 pm - Middlesex
1:30 pm - Tunxis 2:30 pm - Quinebaug
22 23 24 25 26
6:00 pm - Charter Oak 2:00 pm - Gateway 3:00 pm - Capital
2:30 pm - Norwalk
29 30 1 2 3
2:00 pm - Northwestern 2:00 pm - Housatonic

DRAFT – for discussion
Poll question
How important are business partnerships to realizing the full value of Transform?
1. Not at all important
2. Of little importance
3. Moderately important
4. Important
5. Very important
Where are you relative to where you want to be in the extent to which your institution is forming partnerships with the business community?
1. Not yet started
2. Initial progress
3. Mid-way
4. Considerable progress
5. Fully there
42

DRAFT – for discussion
How important are business partnerships to realizing the full value of Transform?
1. Not at all important
2. Of little importance
3. Moderately important
4. Important
5. Very important
0 / 17 Cross-tab label
0% 0% 0% 0% 0%
1 2 3 4 5
43
Com

DRAFT – for discussion
Where are you relative to where you want to be in the extent to which your institution is forming partnerships with the business community?
1. Not yet started
2. Initial progress
3. Mid-way
4. Considerable progress
5. Fully there
0 / 17 Cross-tab label
0% 0% 0% 0% 0%
1 2 3 4 5
44
Com

DRAFT – for discussion
Context for Transform Business and Civic Community Survey
220 respondents to business and civic community survey, representing all major NAICS industry categories
• Greatest number of responses are from manufacturing (64), public administration (28), and health care (23) sectors
• Nearly 200 open-ended responses
Survey results can be used for three primary purposes:
1. To gain insight into the business community perspective, and to articulate the value of Transform to this community
2. Gain additional input from open-ended responses, to be used to inform
– Programming, to align to CT workforce in the near-term
– Create alignment of system-wide program offering with business needs in the longer-term
3. To inform potential partnerships at both the institution and system level
– 61 (28%) of respondents provided personal information and wish to be contacted directly
45

DRAFT – for discussion
For reference: full set of survey questions
Question 1: What sector is your business/organization in? (drop-down) Question 2: What is your business/organization size? (drop-down) Question 3: What is your role? (drop-down) Question 4: On average, how many new graduates has your business/organization hired annually in the past 3 years? (drop-down) Question 5: On average, how many new graduates do you anticipate your business/organization will hire annually in the next 3 years? (drop-down) Question 6: What skills, qualifications and expertise are needed for new employees at your business/organization today? How do you envision this changing in the next 5-10 years? (open ended, optional) Question 7: If you have hired graduates from one or more of the Connecticut State Colleges and Universities, how have these graduates performed relative to your expectations? (Option to rank for each institution: highly satisfied (1), neither satisfied nor dissatisfied (3), highly dissatisfied (5) Question 8: Today and going forward, how do you envision your business/organization will engage or collaborate with individual Connecticut State Colleges and Universities (CSCU) or the CSCU system overall? (For all that apply, select if already partner today or are interested in forming a partnership) Question 9: Please feel free to share any other comments, questions or suggestions that would be helpful to the CSCU system in the Transform effort (open-ended, optional) If you are interested in a follow-up from CSCU, to further your engagement per question 8 above, please provide your name and e-mail address here: (open-ended, optional)
46

DRAFT – for discussion
Respondent summary 220 respondents from all 17 sectors, primarily CEOs or EVPs at smaller companies
By sector
Sector #
responses Total (%)
Accommodation and Food Services 4 2
Administrative and Support and Waste Management and Remediation Services
1 0
Agriculture, Forestry, Fishing and Hunting 2 1
Arts, Entertainment, and Recreation 16 7
Construction 4 2
Education Services 17 8
Finance and Insurance 7 3
Health Care and Social Assistance 26 12
Information 2 1
Management of Companies and Enterprises 1 0
Manufacturing 64 29
Other Services (except Public Administration) 23 10
Professional, Scientific and Technical Services 13 6
Public Administration 28 13
Real Estate and Rental and Leasing 3 1
Retail Trade 5 2
Transportation and Warehousing 1 0
Wholesale Trade 3 1
Total 220 100
By company size
Company size # responses Total (%)
0-50 employees 127 58
51-200 employees 49 22
201-500 employees 12 5
501-1,000 employees 11 5
1,000+ employees 21 10
Total 220 100
By role
Respondent role # responses Total (%)
CEO, President or Chairman 96 44
Executive Vice President or Executive Director
37 17
Vice President or Divisional Manager 45 20
Sub-divisional manager or assistant manager
16 7
Other staff member 14 6
Other 12 5
Total 220 100
Source: Transform CSCU 2020 Business and Civic Community Survey, July 2014
47

DRAFT – for discussion
Key findings
Respondent businesses expect to increase hiring of new graduates modestly in next 3 years
• Percentage of respondents with businesses hiring 6-10 graduates annually up from 9% (3-year historical) to 11% (3-year forecast); increase from 5% to 9% for those hiring 11-25 graduates per year
Overall, respondents are satisfied with performance of graduates from CSCU institutions
• Respondents had option to rank satisfaction with graduates from specific institutions
• Of 372 responses, 257 (69%) indicated satisfaction or high satisfaction with graduate performance; only 14 responses (4%) indicated dissatisfaction or higher dissatisfaction
Respondents view their role primarily in providing internships, with growing interest in volunteer-based partnerships (e.g., mentors)
Respondents highlighted that soft and basic skills are needed in new employees in addition to domain-specific or other intellectual skills
• Respondents suggest it is institutional role to fill basic skills gaps—professional and personal
The business community is supportive of strengthening the CSCU system through Transform
• Respondents reinforce system value, suggest ways to improve efficacy
1
2
3
4
5
48

DRAFT – for discussion
Annual hiring of respondent businesses expected to increase modestly in next three years
7972
911
9
5100
75
50
25
0
Respondents by hiring volume (%)
Hiring timeline
Next 3 years
220
2 5
Past 3 years
220
5 2
0-5 6-10 11-25 26-50 51-75 75+
Increases anticipated in the categories of businesses hiring 6-10 graduates annually and 11-25 graduates annually Industries anticipating hiring the most workers annually in the next 3 years include: • Health Care and Social Assistance • Manufacturing • Education Services • Professional, Scientific, and Technical
Services
1
Number of new graduates business/organization hired annually in the past 3 years; and anticipated hiring in the next 3 years
Respondent businesses expect to increase hiring slightly in next 3 years
Respondent businesses expect to increase hiring slightly in next 3 years
Questions: 1) On average, how many new graduates has your business/organization hired annually in the past 3 years? (n=220) 2) On average, how many new graduates do you anticipate your business/organization will hire annually in the next 3 years? (n=220) Source: Transform CSCU 2020 Business and Civic Community Survey, July 2014
49

DRAFT – for discussion
Overall, respondents satisfied with performance of graduates from CSCU institutions
0
35
70No. responses
Institution
26
35
41
61
15 18
16 14
11 13
19 16
26
14 17
11
19
Highly dissatisfied Dissatisfied Neither satsified nor dissatisfied Satisfied Highly satisfied
Colleges Universities
Of 372, 257 (69%) responses indicate businesses was satisfied or highly satisfied with performance of institution graduates
2
Question: If you have hired graduates from one or more of the Connecticut State Colleges and Universities, how have these graduates performed relative to your expectations? (n=120) Source: Transform CSCU 2020 Business and Civic Community Survey, July 2014
Overall, respondents satisfied with performance of graduates from CSCU institutions
50

DRAFT – for discussion
Respondents most interested in providing internships, with growing interest in volunteer-based partnerships
0
50
100
150No. responses
Mode of partnership
Scholarships
26
65%
35%
Donating money
37
70%
30%
Employee volunteer
38
39%
61%
Advocating
41
66%
34%
Mentors
37%
63%
Fnd. or Regional
Ad. Board
71
39%
61%
Program Ad. Board
77
42%
58%
Cont’d ed for
employees
86
69%
31%
Contributing to course
88
60 56%
Guest lecturers
89
36% 44%
Internships
145
54%
46%
64%
Interested in partnering Partner today
Least interest in scholarships and donating money
3
Most interest in internships
Growing interest in volunteer-based partnerships (e.g., mentors, advisory board
membership)
Question: Today and going forward, how do you envision your business/organization will engage or collaborate with individual Connecticut State Colleges and Universities (CSCU) or the CSCU system overall? (For all that apply, select if already partner today or are interested in forming a partnership) (n=173) Source: Transform CSCU 2020 Business and Civic Community Survey, July 2014
Respondent interest in partnering with CSCU institutions and/or system (for each mode of partnership, option to select if already partnering or interested in partnering)
51

DRAFT – for discussion
Respondents seek specific skills in new employees, but also soft skills and basics—both personal and professional
What skills, qualifications, and expertise are needed for new employees at your business/organization today (open-ended)
• E.g., teamwork, multi-tasking, flexibility, collaboration, patience, understanding • "Excellent "soft" skills and people skills" • "Being sensitive to needs of others"
Soft skills
Basics—personal and professional
Basic skills are critical, and lacking in many graduates Basic professional skills are a necessity ... • "Basic math, grammar, sciences, computer skills" • "I would like my new employee to be able to read, write …"
... but new employees also need to have basic life skills • "... be organized and always on time" • "I need people who are prepared to work and interact in a professional environment …
graduates have no social skills or ability to interact with the public" • "Too many graduates lack basic life skills"
Intellectual skills2
• Analytic proficiency • Communications • Social media
Broad & integrative knowledge3
• Critical thinking and problem-solving
Specialized knowledge4
• Engineering, science • Nursing • Computer-based • Basic business (e.g., marketing)
Themes
Specific skills1
4
1. Categories from Association of American Colleges & Universities 2. Skills applied to complex challenges within majors and to broader problems 3. Includes key concepts and methods of inquiry; areas include sciences, social sciences, humanities, arts 4. Knowledge or applied skills in a field. Question: What skills, qualifications and expertise are needed for new employees at your business/organization today? How do you envision this changing in the next 5-10 years? (open ended, optional) Source: Transform CSCU 2020 Business and Civic Community Survey, July 2014
52

DRAFT – for discussion
Business community sees value in strengthening CSCU system Respondents desire to improve graduate ability to meet their business' needs
"I expect the college system to pick up the pieces where the local school systems have failed to teach
the student adequately in math and English"
"This is a great idea and will help streamline many of your operations allowing you to provide better
services to the community …"
"We are excited about the Transform effort and the impact it will have on our business and civic
communities …"
"Design curriculum for the jobs of current and future employers in Conn. so Conn. students stay here in the state instead of all our young people
leaving for Boston and New York..."
"Great idea. Should have happened years ago" You have resources that are best-in-class at CCSU in downtown NB...maybe they should take the lead or
be the clearing house within the system …"
Business community is supportive of Transform …
… and has ideas for how to leverage system effectively …
5
Questions: Please feel free to share any other comments, questions or suggestions that would be helpful to the CSCU system in the Transform effort. What skills, qualifications and expertise are needed for new employees at your business/organization today? How do you envision this changing in the next 5-10 years? Source: Transform CSCU 2020 Business and Civic Community Survey, July 2014
53