
Transfer RNA translocation through the ribosome.
102
Transfer RNA translocation through the ribosome. Combining large scale system simulations with experimental data. Dissertation for the award of the degree “Doctor rerum naturalium” Division of Mathematics and Natural Sciences of the Georg-August-University Göttingen submitted by Christian Blau from Merseburg 31.12.2013
Transcript of Transfer RNA translocation through the ribosome.
Transfer RNA translocation throughthe ribosome.
Combining large scale system simulations withexperimental data.
Dissertation for the award of the degree“Doctor rerum naturalium”
Division of Mathematics and Natural Sciences of theGeorg-August-University Göttingen
submitted byChristian Blau
fromMerseburg
31.12.2013

2
Thesis Committee
Prof. Dr. Helmut Grubmüller (Reviewer)1
Prof. Dr. Holger Stark (Reviewer)1
Prof. Dr. Jörg Enderlein2
Examination board
Prof. Dr. Kai Tittmann2
Dr. Iwan A. T. Schaap2
Prof. Dr. Berent L. de Groot1
Date of the oral examination
5th of March, 2014
1Max Planck Institue for Biophysical Chemistry, Göttingen2Georg-August-University Göttingen
3
Affidavit
Hiermit bestätige ich, dass ich diese Arbeit selbstständig verfasst und keineanderen als die angegebenen Quellen und Hilfsmittel verwendet habe.
Göttingen, Dezember 2013
Christian Blau
4
Contents
1 Introduction 51.1 Translation in Procaryotes . . . . . . . . . . . . . . . . . . . . . . 11
2 Concepts and Methods 202.1 Energy Landscapes and Reaction Rates . . . . . . . . . . . . . . 202.2 Computer simulation of biomolecules . . . . . . . . . . . . . . . 232.3 Cryo-EM fitting . . . . . . . . . . . . . . . . . . . . . . . . . . . . 272.4 Ensemble analysis . . . . . . . . . . . . . . . . . . . . . . . . . . . 29
3 Publications 363.1 g_contacts: Fast contact search in bio-molecular ensemble data 363.2 Energy barriers and driving forces in tRNA translocation through
the ribosome . . . . . . . . . . . . . . . . . . . . . . . . . . . . . . 41
4 Discussion 784.1 Biochemical background . . . . . . . . . . . . . . . . . . . . . . . 814.2 Cryo-EM reconstruction . . . . . . . . . . . . . . . . . . . . . . . 824.3 Cryo-EM refinement . . . . . . . . . . . . . . . . . . . . . . . . . 834.4 Force-field and sampling . . . . . . . . . . . . . . . . . . . . . . . 844.5 Transition rate estimates . . . . . . . . . . . . . . . . . . . . . . . 854.6 Interaction enthalpies and contact frequencies . . . . . . . . . . 894.7 Fast contacts search algorithm and implementation . . . . . . . 894.8 Applications of fast contacts search . . . . . . . . . . . . . . . . 904.9 Follow-up projects . . . . . . . . . . . . . . . . . . . . . . . . . . 91
5 Acknowledgements 93
6 Curriculum Vitae 94
Bibliography 95
5
1. Introduction
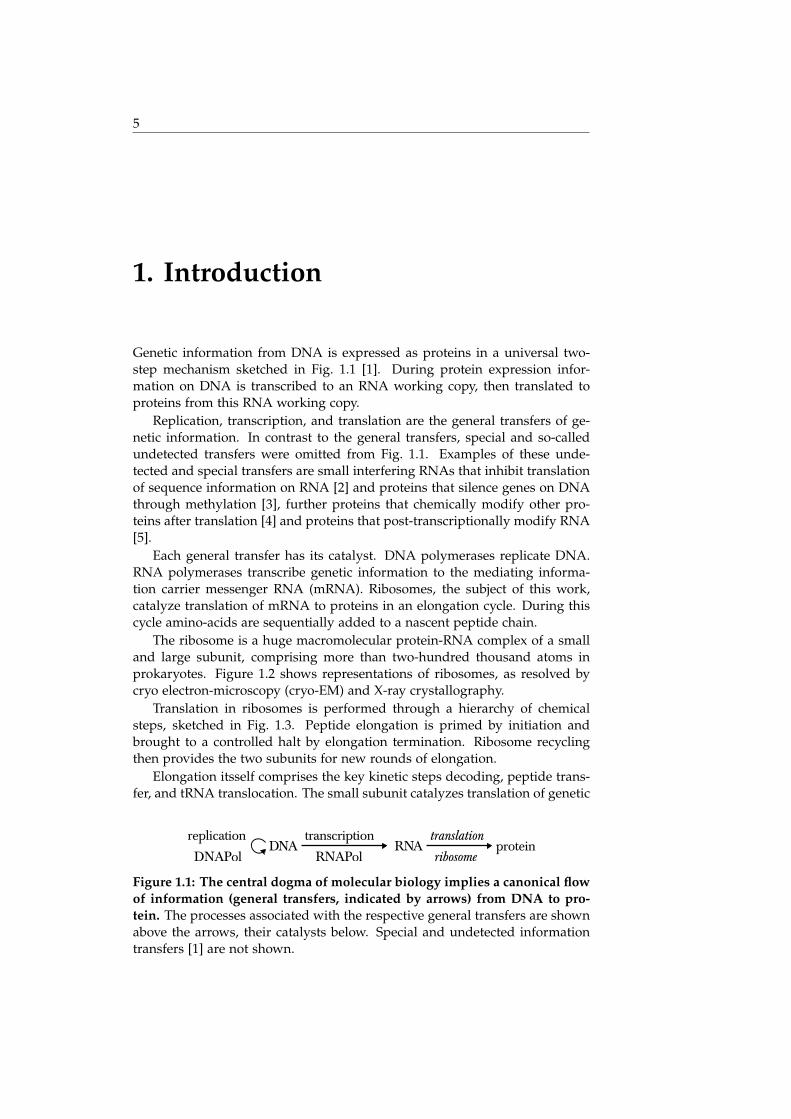
Genetic information from DNA is expressed as proteins in a universal two-step mechanism sketched in Fig. 1.1 [1]. During protein expression infor-mation on DNA is transcribed to an RNA working copy, then translated toproteins from this RNA working copy.
Replication, transcription, and translation are the general transfers of ge-netic information. In contrast to the general transfers, special and so-calledundetected transfers were omitted from Fig. 1.1. Examples of these unde-tected and special transfers are small interfering RNAs that inhibit translationof sequence information on RNA [2] and proteins that silence genes on DNAthrough methylation [3], further proteins that chemically modify other pro-teins after translation [4] and proteins that post-transcriptionally modify RNA[5].
Each general transfer has its catalyst. DNA polymerases replicate DNA.RNA polymerases transcribe genetic information to the mediating informa-tion carrier messenger RNA (mRNA). Ribosomes, the subject of this work,catalyze translation of mRNA to proteins in an elongation cycle. During thiscycle amino-acids are sequentially added to a nascent peptide chain.
The ribosome is a huge macromolecular protein-RNA complex of a smalland large subunit, comprising more than two-hundred thousand atoms inprokaryotes. Figure 1.2 shows representations of ribosomes, as resolved bycryo electron-microscopy (cryo-EM) and X-ray crystallography.
Translation in ribosomes is performed through a hierarchy of chemicalsteps, sketched in Fig. 1.3. Peptide elongation is primed by initiation andbrought to a controlled halt by elongation termination. Ribosome recyclingthen provides the two subunits for new rounds of elongation.
Elongation itsself comprises the key kinetic steps decoding, peptide trans-fer, and tRNA translocation. The small subunit catalyzes translation of genetic
Figure 1.1: The central dogma of molecular biology implies a canonical flowof information (general transfers, indicated by arrows) from DNA to pro-tein. The processes associated with the respective general transfers are shownabove the arrows, their catalysts below. Special and undetected informationtransfers [1] are not shown.
6
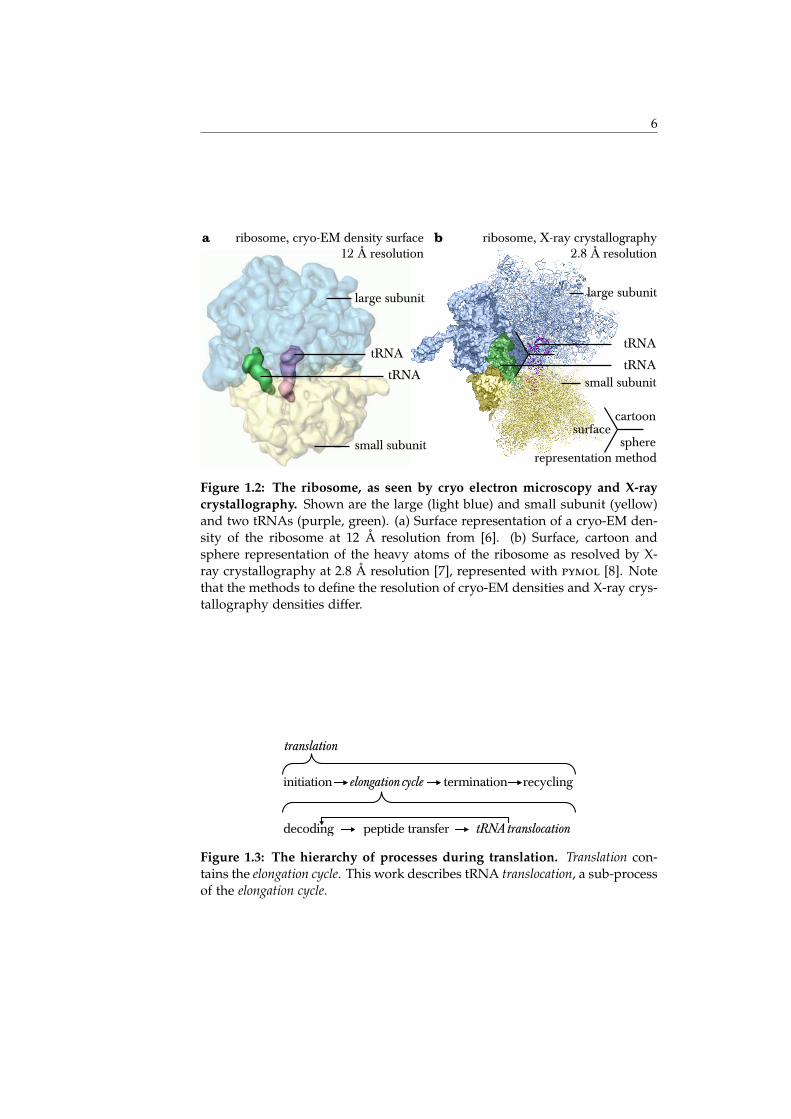
Figure 1.2: The ribosome, as seen by cryo electron microscopy and X-raycrystallography. Shown are the large (light blue) and small subunit (yellow)and two tRNAs (purple, green). (a) Surface representation of a cryo-EM den-sity of the ribosome at 12 Å resolution from [6]. (b) Surface, cartoon andsphere representation of the heavy atoms of the ribosome as resolved by X-ray crystallography at 2.8 Å resolution [7], represented with pymol [8]. Notethat the methods to define the resolution of cryo-EM densities and X-ray crys-tallography densities differ.
Figure 1.3: The hierarchy of processes during translation. Translation con-tains the elongation cycle. This work describes tRNA translocation, a sub-processof the elongation cycle.

7
Figure 1.4: The three tRNA binding sites span the small (30S) and large(50S) ribosomal sub-unit. This schematic box-plot representation of the ribo-some indicates the three ribosomal binding sites, the amino-acyl site (A site),peptidyl site (P site), and exit site(E site). The tRNA is represented as a verti-cal line, the amino-acid as disc, the mRNA codons as horizontal bars, and themRNA as horizontal line. Two discs indicate the nascent peptide chain.
code on the mRNA blueprint to cognate amino-acids by adaptor moleculescalled transfer RNA (tRNA). Following this decoding step, the large subunitcatalyzes elongation of the nascent peptide chain by peptide bond formation[9, 10]. After the ribosome catalyzed codon recognition and peptide transfer,the tRNAs move through the ribosome to prime the ribosome for a new roundof elongation.
For efficient catalysis, three specific binding sites position the tRNAs dur-ing elongation. Figure 1.4 shows these tRNA binding sites, amino-acyl site (Asite), peptidyl site (P site), and exit site (E site). Mechanisms and transitionrates for the movement of the tRNAs between their binding sites during elon-gation were revealed by spectroscopic measurements [11]. The determined re-action mechanism is sketched in Fig. 1.5, and will be laid out in greater detail,with the additional involved factors, further below. During tRNA transloca-tion, the two tRNAs move from the A to the P and from the P to the E site.Fifty intermediate states of spontaneous tRNA movement in the absence ofadditional factors and GTP hydrolysis have recently been observed using cryoelectron microscopy experiments [6].
Spontaneous tRNA translocation is an equilibrium process that consumesno energy. Yet, the tRNAs diffuse more than seven nanometers through theribosome, despite the many involved interactions and the large size of theribosome. The energy from thermal fluctuations suffices to induce large-scale, though undirected ribosome motions [6]. The very little energy gainedthrough hydrolysis of guanosine-triphosphate (GTP) by elongation factor Gsuffices to drive tRNA translocation forward through a “Brownian ratchet”mechanism by using these thermal fluctuations [12, 13].
By observing this Brownian machine through cryo-EM [6], the gap be-tween static structures of the energy minima on the energy landscape anddynamic information has been narrowed in two ways. First, the ensembleof translocation intermediate structures was vastly extended and the free en-ergy of each intermediate determined. A sketch of the resulting free energylandscape is shown in Fig. 1.6. Second, the velocity of the major rate-limitingstep that separates so called pre-translocation and post-translocation stateswas determined, and a rapid equilibrium between the pre-translocation andpost-translocation states was found.

8
Figure 1.5: The elongation cycle in box-plot representation and tRNAtranslocation as seen from cryo-EM. Panel (a) sketches the elongation cy-cle (cf. Fig. 1.4). Panel (b) shows eight representative cyro-EM densities fromfifty intermediates of spontaneous tRNA translocation through the ribosome[6]. The gray lines indicates the thick black box shown in (a) for reference.Shown are the large (light blue) and small subunit (yellow) and two tRNAs(purple, green). Resolutions of the respective cryo-EM densities are givenbelow them.
9
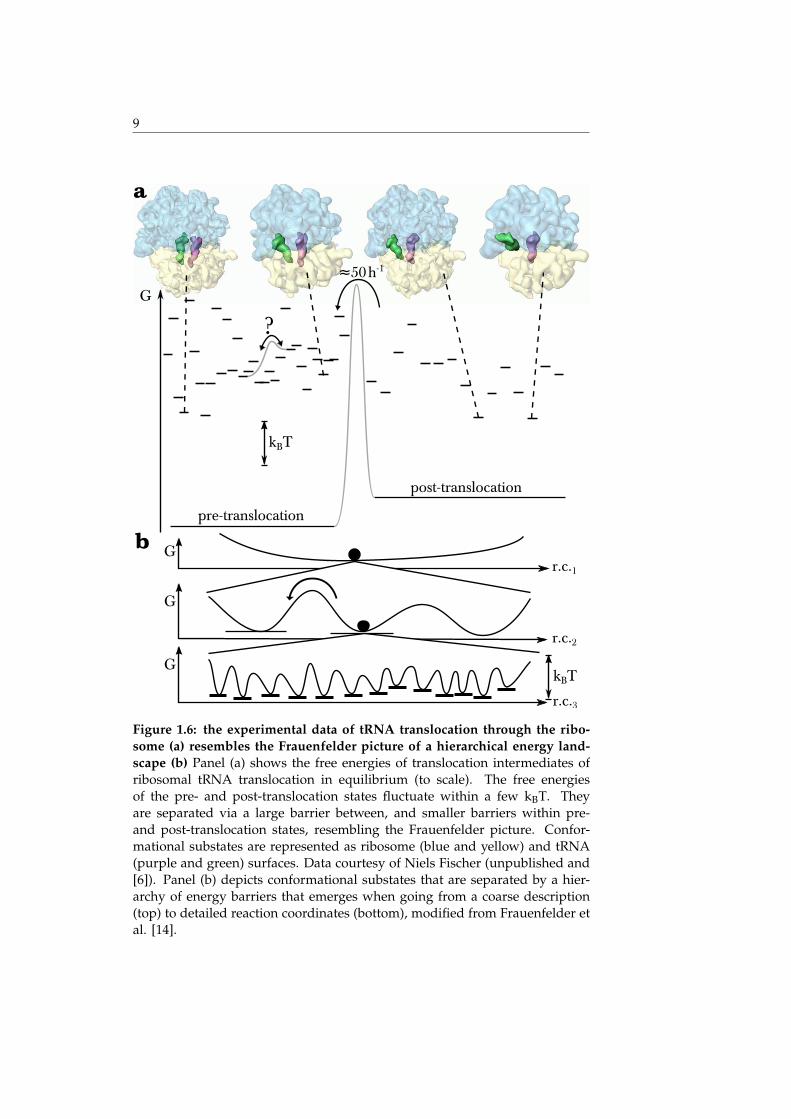
Figure 1.6: the experimental data of tRNA translocation through the ribo-some (a) resembles the Frauenfelder picture of a hierarchical energy land-scape (b) Panel (a) shows the free energies of translocation intermediates ofribosomal tRNA translocation in equilibrium (to scale). The free energiesof the pre- and post-translocation states fluctuate within a few kBT. Theyare separated via a large barrier between, and smaller barriers within pre-and post-translocation states, resembling the Frauenfelder picture. Confor-mational substates are represented as ribosome (blue and yellow) and tRNA(purple and green) surfaces. Data courtesy of Niels Fischer (unpublished and[6]). Panel (b) depicts conformational substates that are separated by a hier-archy of energy barriers that emerges when going from a coarse description(top) to detailed reaction coordinates (bottom), modified from Frauenfelder etal. [14].
10
The many translocation intermediates differ only by a few kBT in energyand are seperated by a hierarchy of barriers between the states as shown inFig. 1.6. Similarily, the study of Frauenfelder proposed a hierarchical energylandscape for proteins using myoglobine as an example [14]. Fig. 1.6 showsthe close resemblance of the energy landscape determined by Fischer et al.and the Frauenfelder picture [14, 15].
Yet unresolved are the barriers between the individual pre- and post-translocation states and the dynamics within the resolved energy minima.Further, the cryo-EM data lacks the atomic detail that would allow to namethe specific interactions responsible for the barriers.
Figure 1.2 shows an example of one of the high-resolution X-ray structuresthat provide an atom-by-atom description of residue and nucleotide inter-actions. The Nobel Prize winning crystal-structures of the ribosome were abreak-through in describing translation structurally [16]. They provide thestereochemistry of the binding sites, the interacting ribosome residues andnucleotides for stable, crystallizable states in the energy minima of the ribo-some energy landscape.
In this work, we describe the ribosome energy landscape during translo-cation by refining the cryo electron microscopy data by Fischer et al. [6] tothe structural information from X-ray crystallography [17], performing atom-istic molecular dynamics (MD) simulations and testing their results againstbiochemical information from spectroscopic measurements and evolutionaryanalysis. Though the notion that the ribosome diffuses in a Frauenfelder-typeenergy landscape has been expressed earlier by Whitford and Sanbonmatsu inthe ribosome field [18], we now provide quantitative evidence for that notion.Overall, the statistical mechanics view on ribosomal translation in this workaims to discuss tRNA translocation as proposed by Frauenfelder et al.,
“The taxonomic attitude is the conventional one of mechanisticchemistry, but the statistical viewpoint requires new concepts. Oneno longer talks about specific energy levels but about the statisticsof the energy landscape.” [14]
To estimate the heigth of the free energy barriers that hinder transition ofthe ribosome from one state to another, we assess the diffusion of the ribo-some on its high-dimensional energy landscape. We identify further kineticsteps than the pre- to post-translocation transition and determine the interac-tions between nucleotides and residues that make transitions between differ-ent states so efficient for the ribosome.
Ribosomes evolved to be fast and accurate at little energy cost. They main-tain a minute balance between speed of translation, error rate and energy con-sumption [19]. We employ the working hypothesis that the ribosome is effi-cient, because its energy landscape has been smoothened evolutionarily; speedand accuracy of translocation are achieved by fine-tuning interactions betweenribosome parts, their residues and nucleotides to a near-constant level.
A prerequisite to analyze the fine-tuning of interaction energies on a near-atomic level is a description of all atom contacts on the interface of ribosomeparts. Though finding contacting atoms of ribosome parts is conceptually
11 1.1. TRANSLATION IN PROCARYOTES
simple, finding and implementing a fast algorithm for this task is not. For ex-ample, between the large and the small subunit of the ribosome there are morethen ten billion possible atom-atom contacts. We devised and implementedan efficient algorithm to find contacting atoms on the interface between ribo-some parts, which proved to be useful for a variety of biomolecular ensembledata [20].
Before laying out the underlying assumptions in statistical physics that arenecessary to bridge energetics and kinetics of translation, we will now detailthe biochemistry of protein synthesis in prokaryotes and summarize previouscomputational approaches on translation.
Our research is published in “g_contacts: Fast contact search in bio-molecularensemble data” [21] and “Energy barriers and driving forces in tRNA translo-cation through the ribosome” [22]. An essential part of the assumed researchis laid out in the supplementary note complementing the article “Energy barri-ers and driving forces in tRNA translocation through the ribosome”. The dataanalysis methods that extract interpretable information from the simulationdata are presented in this supplement in the context of ribosome simulations,but are valuable in their own right.
1.1 Translation in Procaryotes
Translation
Translation of genetic information from mRNA to proteins occurs in all do-mains of life in four distinct steps: initiation, elongation, termination, andrecycling.
In this work, we investigate translation of the prokaryote Escherichia coli (E.coli, K-12 strain). This section will place prokaryotic elongation in the contextof translation by describing it along with initiation, termination and recycling.In the next section we will give a more detailed description of the elongationcycle, linking experimental and computational studies of elongation.
Initiation prepares ribosomes for the elongation cycle. The Shine-Dalgarnosequence on prokaryotic messenger RNA recruites a small (30S) ribosomalsubunit, facilitated by initiation factor 3 (IF3) [23, 24, 25]. The aminoacyl-site(A site) of the small subunit is kept empty by initiation factor 1 (IF1) whileinitiation factor 2 (IF2) carries an initiator tRNA to the ribosomal peptidyl-site(P site) carrying the amino acid formyl-methionine (fMet, cognate to the AUGstart codon) at its CCA-tail. When a large (50S) ribosomal subunit binds, allinitiation factors dissociate and the elongation cycle begins with a ribosome,mRNA, and fMet-tRNAfMet complex as shown in Fig. 1.7I.
During the elongation cycle, sketched in Fig. 1.7, proteins are synthesizedby the ribosome one amino acid at a time according to the correspondingmRNA template [26]. After initiation primes the ribosome with an initiatortRNA in the P site (Fig. 1.7I), all decoding of genetic information on the mRNAis performed in the A site through binding of a complex of aminoacyl tRNA(aa-tRNA) and elongation factor thermo unstable (EF-Tu) sketched in Fig. 1.7IIand in Fig. 1.8. A site accommodation positions the substrates for the peptide

1.1. TRANSLATION IN PROCARYOTES 12
Figure 1.7: The prokaryotic elongation cycle. The ribosome with its small(30S) and large subunit (50S) and its three binding sites, the amino-acylsite (A site), peptidyl site (P site) and exit-site (E site) is sketched in box-representation. I fMet-tRNAfMet (green vertical line (tRNA) and ball (amino-acid)) occupies the P site with the cognate start codon (green horizontal line).II The A site is occupied with a cognate aminoacylated tRNA (purple line(tRNA) and ball (amino-acid)) after elongation factor thermo unstable (EF-Tu) dissociation.III Peptide transfer reaction occurs (indicated by the gray ar-row). IV Upon EF-G·GTP promoted translocation, tRNAfMet leaves the exitsite (E site), preparing the ribosome for the next elongation cycle.

13 1.1. TRANSLATION IN PROCARYOTES
transfer reaction in the peptide transfer center (PTC). After peptide transferis catalyzed in the PTC (Fig. 1.7III), the nascent peptide chain is bound tothe A site tRNA [10, 27]. Subsequent tRNA translocation of the A site tRNAto the P site, and the P site tRNA to the E site, prepares the ribosome foranother of elongation cycle (Fig. 1.7IV). Binding of elongation factor GTPase(EF-G) with GTP (EF-G·GTP) drives translocation through GTP hydrolysis[28]. Translocation without EF-G still occurs, but is at least a thousand timesslower [29, 30].
An A site stop codon (UAA, UAG or UGA) initializes elongation termina-tion through binding of class-I release factors, release factor 1 (RF1, cognateto UAA and UAG codons) or release factor 2 (RF2, cognate to UAA and UGAcodons) [31]. The esther bond that binds the nascent peptide chain to theP site tRNA is cleaved off by hydrolysis caused by the bound class-I releasefactor. Subsequently class-II release factor 3 (RF3) binds in complex with GTP.GTP hydrolysis at RF3 aids the release of tRNA, mRNA and class-I releasefactors from the ribosome.
During ribosomal recycling, the small and the large ribosomal subunitdisscociate after binding of the ribosomal recycling factor (RRF) and subse-quent EF-G·GTP binding, followed by GTP hydrolysis. Both subunits are thenre-used in other elongation cycles [32].
Elongation
While giving an overview of the elongation cycle, we will highlight computa-tional studies of different aspects of the process [33]. Computer simulations ofribosomes have been carried out for almost all sub-processes of the elongationcycle [34].
The questions addressed by computer simulations of the ribosome reflectthe complexity of the fine-tuned elongation sub-processes and the complexityof the ribosome itself, an asymmetric RNA-protein compound of more thantwo hundred thousand atoms.
The first layer of complexity of nascent peptide chain elongation, and thusthe complexity of the simulation approaches, is reflected in the time-scalesits sub-processes span. They reach from pico-seconds for the proton shut-tle mechanism of the peptide transfer reaction [35] to minutes required forspontaneous tRNA translocation [29].
A second layer of complexity is encoded in the energetics of transloca-tion. Subtle differences in free energies drastically alter the reaction pathway.For example, a binding affinity difference between cognate and near-cognatetRNA of a single hydrogen-bond regulates rejection or acceptance of an ac-commodating tRNA at an error rate of one in ten thousand. Other examplesare provided by the fact that interaction of antibiotics with single ribosome nu-cleotides inhibit bacterial growth or that single amino-acid mutations changethe translation speed by orders of magnitude.

1.1. TRANSLATION IN PROCARYOTES 14
Figure 1.8: A site decoding, catalyzed by EF-Tu.(cf.Fig 1.7II) The sub-processes of initial selection and proofreading. Initial binding and subsequentcodon reading (i) is followed by codon recognition (ii). Upon GTPase activa-tion (iii), GTP hydrolysis (iv), leads to Pi release and EF-Tu rearrangements (v)that allow for A site accommodation or, alternatively, tRNA release (vi). Oncethe aa-tRNA is fully accommodated in the A site (vii), the nascent peptidechain is transferred to the A site. Modified from Rodnina [36].
A site decoding
The first step of the elongation cycle is A site decoding (Fig. 1.7I). Simu-lations of A site decoding and the factors involved were one of the firstand, to date, computationally most sampled aspects of translation, expe-dited by the relatively small length-scales involved in A site decoding andits paramount importance to translation. The key question to A site decodingis, how minute free energy differences lead to discrimination between cognateand non-cognate tRNAs, named “Pauling’s birthday party paradox” [37, 38].
The omnipresent kinetic and energetic fine-tuning, which we will inves-tigate for the process of tRNA translocation, unravels itself here in the wayspeed and accuracy of decoding are evolutionarily optimized [19]. Alongwith tRNA aminoacylation, decoding is the key step in controlling translationfidelity to an error rate of ≈ 10−3 [39]. A site decoding alone is more accuratethan 10−2 [40]. This readily implies a binding free energy difference betweencognate and near-cognate tRNA larger than 2 log 10 kBT ≈ 4.6 kBT in equi-librium. This required energy difference is relatively large compared to theexpected free energy difference of the change of a single nucleotide base, e.g.from cytosil to uracil. Two effects, both experimentally confirmed, explain thisbehavior. First, codon reading is thermodynamically coupled to the wholetRNA, not only its anti-codon [41]. Second, a non-reversible chemical stepallows to exploit the chemical difference between cognate and near-cognatetRNA multiple times [19]. Indeed, GTP-hydrolysis separates two phases ofdecoding, initial selection and proofreading (Fig. 1.8) [42, 43]. During each ofthese, aa-tRNA can dissociate from the ribosome.
15 1.1. TRANSLATION IN PROCARYOTES
Initial tRNA selection starts when, independent of the codon, the L7/L12-stalk1 recruites complexes of aa-tRNA, EF-Tu, and GTP (aa-tRNA·EF-Tu·GTP)to the empty A site (Fig. 1.8i).
The connection between residues to their evolutionary conservation wasused to classify contacts between tRNA and EF-Tu in the tRNA·EF-Tu complexdelivered to the ribosome [44]. We will observe the same connection betweentRNA-ribosome contacts and their conservation.
Though the first simulations of ribosomal proteins were carried out onthe C-terminal domain of L7/L12 [45, 46], initial tRNA recruitment by theL7/L12-stalk outlines the bounds of simulation studies. Here, the lack of high-resolution models of the complete stalk on the ribosome prevented furtherinvestigation by computer experiments [47].
Codon recognition (Fig. 1.8ii) in the ribosomal A site is targeted in antibi-otics development and has been studied along with antibiotic resistance in acombination of structural and dynamic measurements [48, 49].
We will find that stochastic processes govern translation, in contrast to theprevailing picture of a sequential progression from one static conformation toanother, as was found by in silico models of proposed stochastic gating at theA site [50, 51, 52]. They reaffirm that codon recognition does not solely dependon the local hydrogen bonding pattern between the three coding nucleotides,but involves entropic contributions of the surrounding region. Further, single-molecule Förster resonance energy transfer (sm-FRET) experiments suggestedthat thermal fluctuations are crucial for cognate tRNA selection [53].
These studies used the region surrounding the A site for simulation. Inorder to include the expected long-range coupling and the entropic contri-butions from the ribosome surrounding in our simulations we use the wholeribosome to model tRNA translocation. The significant role of these couplingswas confirmed by kinetic [54] and cryo-EM [55] measurements on the decod-ing center.
A proposed long-range coupling mechanism in the ribosome is the al-losteric threE site model of decoding, which proposed that an occupied E siteincreases the fidelity during decoding. In consequence, we would expect thatthe ribosome is transiently occupied by three tRNAs at the A, P and E site,resepctively, as seen in crystal structures. This would render the exit of theE site tRNA prior to decoding unlinkely, in contrast to the model of translo-cation that we assume for our simulations (see Fig. 1.7). However, kineticmeasurements largely refuted the allosteric E site model [56, 57]. Further con-troversies along the lines of structure-dynamics relationship were seen for anew proposed mechanism on ribosomal decoding [58, 59].
Minute conformational changes in the decoding center upon successfulcodon recognition on the small subunit of the ribosome lead to GTPase acti-vation on the large subunit through a cascade of structural changes (Fig. 1.8iii).The mechanism of GTPase activation in EF-Tu is disputed, explicit quantummechanical treatment of the chemically active region draws a diverse picture[60, 61, 62]. Simulations show that this GTPase-associated center might pro-
1Ribosomal proteins of the large and small subunit are numbered sequentially and named L#and S#, respectively.

1.1. TRANSLATION IN PROCARYOTES 16
vide the necessary flexibility for the suggested large-scale L7/L12 movements[63]. Similarily to our work, an all-atom model of the ribosome was refinedto cryo-EM data by Trabuco et al. [64]. From this model, a mechanism wasproposed on how ribosome induced conformational changes of the GTPase-switch-region control GTP hydrolysis (Fig. 1.8iv) [65]. GTP hydrolysis is thenfollowed by phosphate (Pi) release and EF-Tu unbinding (Fig. 1.8v).
The second discriminatory kinetic step after the irreversible GTP hydrol-ysis is proofreading (Fig. 1.8v). It ensures that binding of cognate tRNAsis highly favoured over non- and near-cognate binding to the A site [66, 42](Fig 1.8vi). Only after aminoacyl-tRNA is fully accommodated in the A site,the elongation cycle continues with the peptide transfer reaction (Fig. 1.8vii).
MD studies on A site accommodation upon proofreading showed that en-tropic contributions together with conformational gating helps ribosomes sep-arate cognate from near-cognate tRNAs during accommodation [67, 68]. Therecurring motif we will use also in our work is the relation computationalstudies establish between conformation, dynamics and the statistics on theunderlying energy landscape and the connection of experimental rates withsimulation results [69].
After successfull A site decoding and accommodation, the CCA-ends ofboth tRNAs are precisely positioned in the peptidyl transferase center, PTC.Immediatly afterwards, the peptide transfer reaction transfers the nascentpeptide chain from the P site tRNA to the A site tRNA. By this reaction,the nascent peptide chain is elongated by the one amino-acid carried by theA site tRNA.
Peptide transfer
The peptide transfer center is the catalytic site of the large ribosomal subunit.The interpretation of the role of the peptide transfer center experienced twomajor paradigm shifts. The first paradigm-shifting discovery was that theribosome is a ribozyme [9]. The fact that its catalytic activity is performed byRNA nucleotides, not protein, provides further evidence for the RNA-worldhypothesis [70]. The second shift occured upon the discovery of its generalcatalytic activity, where it is now believed that the PTC is a versatile catalyst ofchemical reactions due to its ability to position substrates through electrostaticand hydrogen-bonding interactions [35]. The ribosomes substrate catalysisby entropy reduction [71] re-emphazises the importance of a combination ofstructural and dynamical information to understand ribosome function.
Due to the bond-breaking and proton shuttle mechanism of the peptidetransfer reaction requires an explicit treatment of the involved quantum me-chanics. Hybrid Quantum Mechanics / Molecular Mechanics simulations sug-gested a variety of proton shuttle mechanisms [72, 73].
tRNA translocation
After the nascent peptide chain has been transferred to the A site tRNA, bothtRNAs translocate to their new binding sites as shown in Fig. 1.9. The mRNAmoves along with the tRNAs, thus exposing the next codon in the vacated
17 1.1. TRANSLATION IN PROCARYOTES
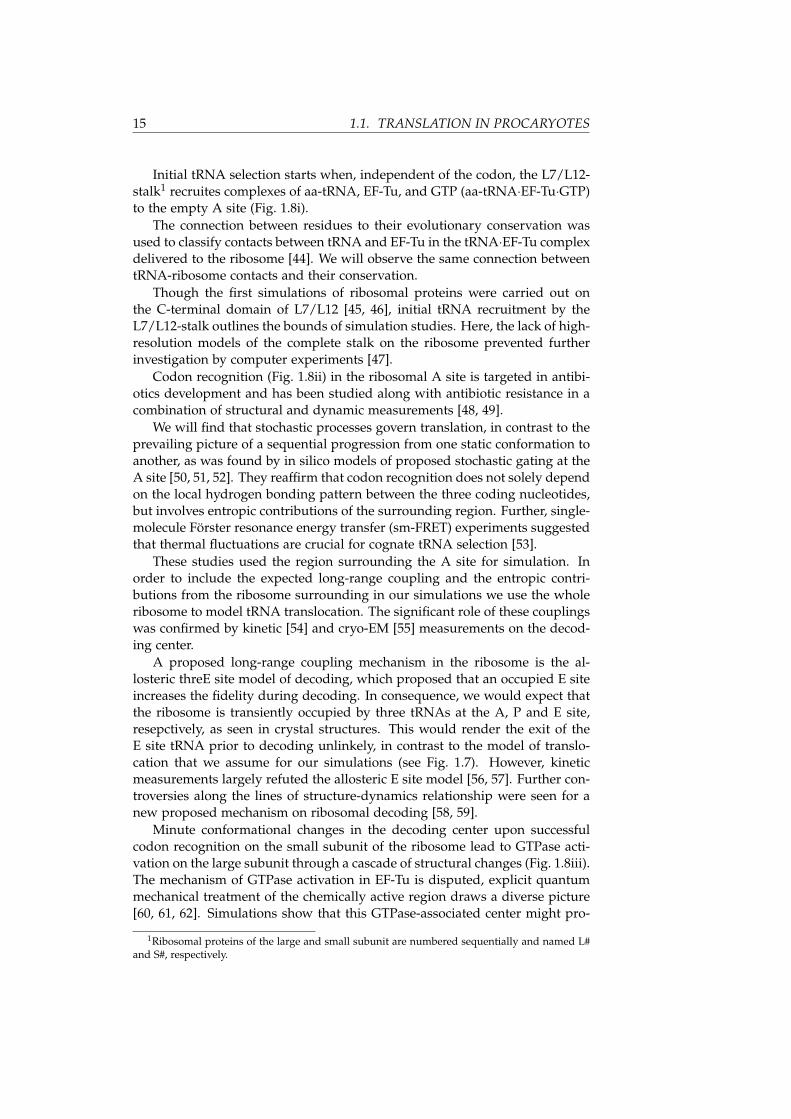
Figure 1.9: Kinetic model of (a) EF-G catalyzed translocation (b) and hy-brid state formation during tRNA translocation. (a) Upon peptide bondformation (III, cf. Fig. 1.7), EF-G·GTP binding (i) promotes tRNA transloca-tion through GTP hydrolysis (ii). After tRNA translocation and Phosphaterelease (iii) the former A site tRNA now occupies the P site and the formerP site tRNA the E site (iv). EF-G·GDP (iv) and the E site tRNA (v) dissociatefrom the ribosome, priming it for a next round of elongation (IV cf. Fig. 1.7).(b) shows the proposed kinetic model of hybrid state formation.

1.1. TRANSLATION IN PROCARYOTES 18
A site. This movement divides translocation in two steps, pre-translocationand post-translocation. The concerted motion of mRNA and tRNA is acceler-ated by EF-G binding and GTP-hydrolysis [28], but its details remain unclearso far [74]. It is known however, that EF-G stabilizes the so-called hybrid states[75, 76].
In contrast to the classic state, where both tRNAs are fully accomodatad inthe ribosomal A and P site on the small and large ribosomal subunit, hybridstates as depicted in Fig. 1.9, are pre-translocation complexes, where the tR-NAs moved towards their new respective binding sites on the large subunit,but stay put on the small subunit [77, 75, 78]. Hybrid states are named A/Pfor the tRNA bound to the A site on the small subunit and to the P site on thelarge subunit and P/E, respectively. These hybrid states are rapidly occupiedafter peptide bond formation. Peptidylation further increases the affinity oftRNA for the A/P site and promotes EF-G binding [75]. Mutation studiesshowed that A/P and P/E site movement are seperated events [79], whichsuggests a kinetic model of hybrid state formation as depicted in Fig. 1.9,where tRNAs fluctuate between classical and hybrid states [80, 78].
Earlier cryo-EM work visualized tRNAs in the A/P and P/E hybrid stateswithout bound factors [81, 82], and further found the P/E tRNA in flexibleconformation within the hybrid states [83]. The cryo-EM data we use in ourwork, shows that pre-translocation classic and hybrid states comprise a con-tinuum of ribosome conformations [6]. A sorting of these configurations ac-cording to tRNA conformations lead to the categorization of pre-translocationcomplexes into states pre1 through pre5, where the pre4 state corresponds tothe before-described hybrid state II.
The tRNA movement is coupled to the rotational movement of two smallsubunit parts, the body and the head with respect to the large subunit [84,85, 32]. Small subunit body rotation and head swiveling correlate with hybridstate formation. This rotational movement occurs sponateously [86]. In ourstudy we will address whether tRNA movement or the small subunit headand body movement dominate tRNA translocation.
Another movement that was found to correlate with P/E hybrid state for-mation is the L1-stalk movement into a closed conformation into the ribosome,where it contacts the P/E site tRNA [87, 88]. We will investigate the couplingof the L1-stalk movement to tRNA motion and if, and in what way, the L1-stalk drives the tRNA.
In contrast to the extensive computational studies on the A site, computa-tional studies of translocation are scarce, due to the large scale of movementand the unresolved role of EF-G in the process. The computational cost thatgoes along with the large scale of the simulation system was partially circum-vented using coarse-grained methods, based on shorter, thus less expensive,all-atom simulations [89]. Another approach to reduce the computational costwas to interpret cryo-EM maps using simulations of the movements of tRNAin solution [83].
A ruggedness estimate of the free energy landscape for tRNA has beengiven by a µs simulation of an intermediate state of translocation, based on thedifference between free and effective diffusion [90, 91]. The short time-scale

19 1.1. TRANSLATION IN PROCARYOTES
diffusion in the energy landscape sees barriers of ≈ 1.7kBT. This indicatesthat the necessary condition for using Kramers’ theory is fulfilled that thefree energy barriers exceed thermal flucutations for tRNA translocation in theribosome.
Elongation termination
Elongation is terminated by the recognition of a stop codon. This stop codonrecognition does not follow the established static base-pairing picture [92].The binding free energy estimates from molecular dynamics simulations sug-gest how the high specificity is achieved for binding of one protein to two dif-ferent, cognate sequences [93]. This provides another example of a dynamicpicture complementing the static-picture, in this case the “tRNA-mimicry”that emerged from previous studies based on X-ray data [94, 95, 96].
20
2. Concepts and Methods
2.1 Energy Landscapes and Reaction Rates
To describe the rich dynamics of the ribosome and its parts, the tRNA andL1-stalk movements as well as head and body rotations, we use statisticalmechanics and thereby describe tRNA translocation in terms of its macrostatesand the transitions between them.
During translation, the ribosome visits a series of metastable states, asdescribed by cryo electron microscopy and fluorescence measurements. Weconnect computer simulation of biomolecules to biochemical measurements,and make predictions of the dynamics between these states, not accessible toexperiments. Therefore, we derive relations between underlying statistical me-chanics and the measurement of experimental observables. Numerous modelassumptions are neccessary to make this connection, which will be presentedalong with the derivation.
We will conclude with an expression for the transition rates between meta-stable states in the high friction limit under the assumption of memory-lessprocesses as an extension of Kramers’ transition rate theory to multiple di-mensions. To arrive at an expression for the transition rates, we describediffusion on an energy landscape over a set of reaction coordinates. The freeenergy landscape in turn is derived from the equilibrium properties of a ther-modynamical system.
Generalized classical ensembles
An effective potential G, the free energy, for an equilibrium ensemble of ri-bosomes in configuration x and momenta p is determined by its potentialenergy E(x), its temperature T and given ensemble properties 〈Ai〉. The en-semble properties are defined by the microstate occupation probability density〈Ai〉 :=
∫Ai(r)ρ(r)dr. An explicit expression for the microstate occupation
probability density ρ follows from the assumption of maximum entropy
ρ(x) = exp(−βE(x)−∑i
λi Ai(x))/Z [97]. (2.1)
Here β = (kBT)−1 is used with the Boltzmann constant kB. Z normalizesρ, i.e. Z is the partition function for the given ensemble and the parametersλi are chosen such that −∂ ln Z/∂λi = kB〈Ai〉. The effective potential over a

21 2.1. ENERGY LANDSCAPES AND REACTION RATES
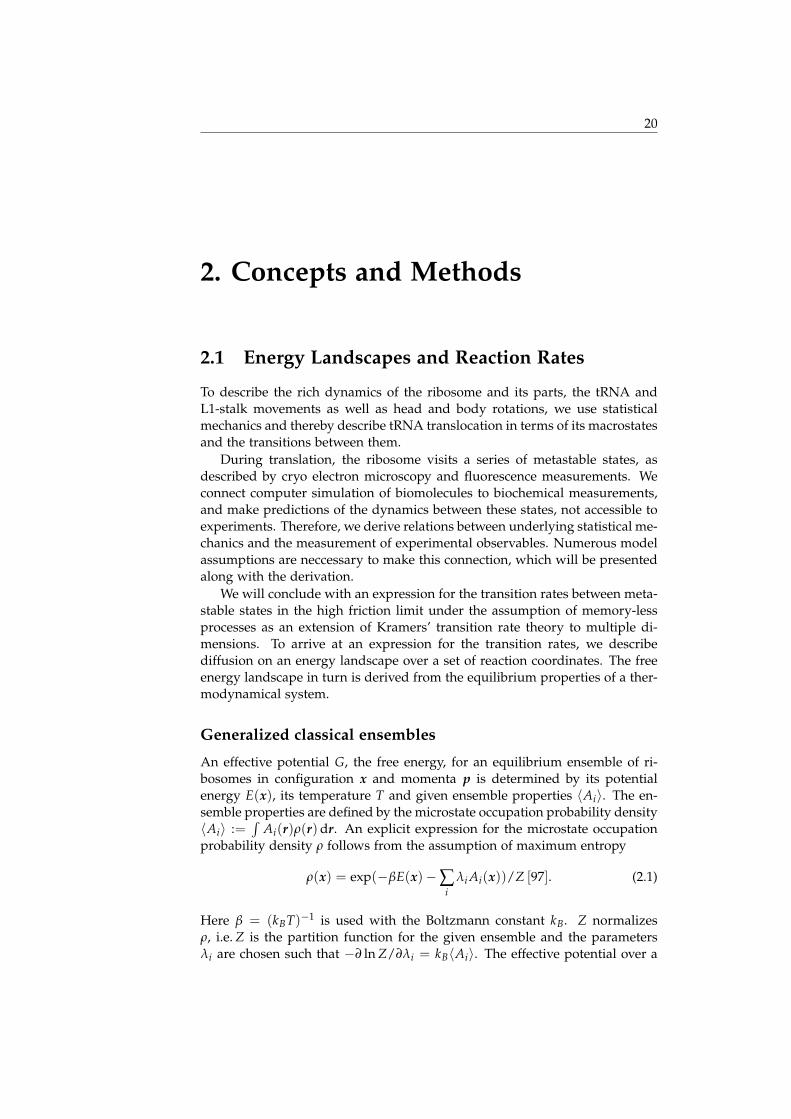
Figure 2.1: Transition between two states described by reaction coordinates.(a) Schematic contour plot of a free energy landscape. An appropriate choiceof a reaction coordinate well sepereates states A and B. The transition seam isindicated by a gray line. (b) Free energy landscape after projection onto onereaction coordinate.
configuration space subset Ω is then defined as
G(Ω) := −kBT ln∫
Ωρ = −kBT ln ρΩ . (2.2)
Reaction coordinates
Figure 2.1 shows how the effective potential G provides a means to reduce thesystem description to reaction coordinates X := f (x) by integrating over fastdegrees of freedom that are regarded noise,
G(X) = −kBT ln∫
f (x)=Xρ(x)dx . (2.3)
To reduce the vast conformational space of ribosome conformations, we de-scribes the transitions between two states in the relevant subspace Ξ for thistransition.
For systems coupled to a heat-bath this time-scale seperation is valid whenthe dynamics on the relevant subspace Ξ is governed by barriers in the ef-fecitve potential that are larger than thermal fluctuations, min(GX∈Ξ)+ kBT max(GX∈Ξ) [98, 99].
To describe transitions by reaction coordinates X, we require that theyseperate the states i, j, i.e. each value of X can be assigned to either state. Fora correct treatment of the dynamics, we further require that the states arenot seperated in any subspace orthogonal to the reaction coordinates, ΩX =x| f (x) = X.
2.1. ENERGY LANDSCAPES AND REACTION RATES 22
Probability density dynamics in an effective potential
Now that an effective equilibrium potential G(X) over reaction coordinatesis defined, a description for the dynamics of an arbitrary probability densitydistribution p(X) in this potential is obtained, the Smoluchowski equation.
By discretization of the reaction coordainte space into states i, j the treat-ment changes from probability densities ρ(X) to absolute probabilites Pi, Pj.The time-dependent occupation probability of these states i, j is described bythe generalized Master-equation,
Pi = ∑j
∫ t
0wij(t− t′)Pj(t)− wji(t− t′)Pi(t)dt′ (2.4)
where wij(t) is the time-dependent transition probability for a transition fromj to i [100]. For future calculations we make the approximation of a memory-less process in reaction coordinate space, which reduces the Master-equationto Pi = ∑j wijPj − wjiPi.
The dynamics of the probability density distribution from the Master-equation is obtained from the continuum limit. For our purpose we usethe high friction limit, where the momenta are described by a Maxwell ve-locity distribution, i.e. p(X, X, t) = p(X, t) exp(−MX/2kBT) [101, 102]. Wefurther require that in the long-time limit, the obtained equation describes theequilibrium probability distriubtion ρ(X) for all possible initial probabilitydistributions p(X). With these assumptions, the continuum limit yields theSmoluchowski equation,
p(X) = ξ−1∇ (∇+∇βG(X)) p(X), (2.5)
which describes the time dependent behaviour of the probability density witha viscous drag ξ [103, 104].
Transition rates
Now dynamics of our biomolecular system will be described in terms of tran-sition rates kAB between two meta-stable states A and B. For this we assumethat a single barrier X‡ seperates the two states which defines a first-ordersaddle-point on the free-energy landscape G(X). Additionally we assume thatinitially, all states in A are occupied according to the equilibrium occupationprobability and are unoccupied elsewhere.
With these assumptions, the rate of transition from A to B over the barrierX‡ is given by the ratio between the populations in A and barrier X‡. The fur-ther assumption of a harmonic well in A with a single minimum at X A
0 and aquasi-harmonic barrier top eventually yields the transition rate approximationused through the rest of this work [105, 106],
k ∝ ω‡1
∏di=1 ωA
i
∏di=2 ω
‡i
exp(−∆G‡/kBT) , (2.6)
where ∆G‡ = G(X‡)− G(X A0 ) and ωi denote the eigenvalues of the Hessian
of G, i.e. the curvature of the free energy surface at X A0 and X‡, respectively.
ω‡1 is the curvature in along the transition direction over the barrier top.

23 2.2. COMPUTER SIMULATION OF BIOMOLECULES
Table 2.1: Scope of molecular dynamics simulation. Adapted from van Gun-steren [108].
Crystalline Solid State Liquid State Gas PhaseMacromolecules
Reduction to few degrees Essential Reduction to fewof freedom by symmetry many-particle system particles by dilution
Quantum possible hard possibleMechanics
Classical easy Molecular dynamics trivialMechanics
Brownian dynamics
We change the treatment of our system from a probability density descriptionto the behaviour of a single system trajectory. From the requirement thatthe ensemble limit of single system trajectories reproduces the Smoluchowskyequation (2.5), the Brownian dynamics equation is obtained,
X = −ξ−1∇G(X) +√
2β−1ξR, (2.7)
where R describes Gaussian white noise with zero mean and unit variance. 1
2.2 Computer simulation of biomolecules
Our goal is to understand the structure, dynamics and energtics i.e. the phys-ical properties of the ribosome. When relativistic effects are neglected, themost general treatment is to propagate its wave-function |ψ〉 via the time-dependent Schroedinger equation,
H|ψ〉 = ihddt|ψ〉 , (2.8)
using its Hamiltonian H. By this equation all physical properties of the ri-bosome are inherently described. Molecular dynamics simulations [109] is ameans to approximate the time-dependent Schroedinger equation to an extentthat allows for computationally feasable treatment of biomolecules.
Physical approximations
Three approximations of the Schroedinger equation make a numerical solu-tion tactable for the simulation of biomolecules.
First, the Born-Oppenheimer approximation [110] seperates fast and slowmodes and thus reduces the dimensionality of the tensor-product space to
1Alternatively Brownian dynamics equations are derived as a simplification of the Langevinequation [107]. We made the respective simplifying assumptions in deriving the Somuluchowskyequation above.
2.2. COMPUTER SIMULATION OF BIOMOLECULES 24
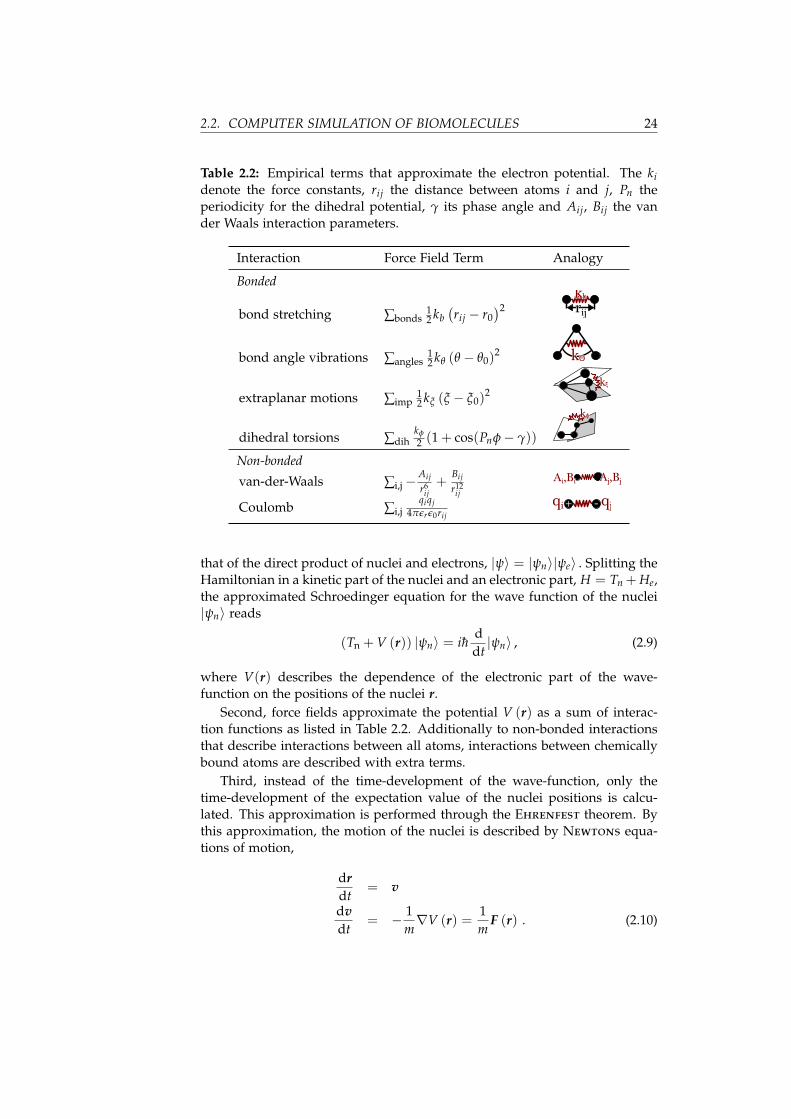
Table 2.2: Empirical terms that approximate the electron potential. The kidenote the force constants, rij the distance between atoms i and j, Pn theperiodicity for the dihedral potential, γ its phase angle and Aij, Bij the vander Waals interaction parameters.
Interaction Force Field Term Analogy
Bonded
bond stretching ∑bonds12 kb
(rij − r0
)2
bond angle vibrations ∑angles12 kθ (θ − θ0)
2 kΘ
extraplanar motions ∑imp12 kξ (ξ − ξ0)
2
dihedral torsions ∑dihkφ
2 (1 + cos(Pnφ− γ))
Non-bondedvan-der-Waals ∑i,j−
Aij
r6ij+
Bij
r12ij
Coulomb ∑i,jqiqj
4πεrε0rij
that of the direct product of nuclei and electrons, |ψ〉 = |ψn〉|ψe〉 . Splitting theHamiltonian in a kinetic part of the nuclei and an electronic part, H = Tn + He,the approximated Schroedinger equation for the wave function of the nuclei|ψn〉 reads
(Tn + V (r)) |ψn〉 = ihddt|ψn〉 , (2.9)
where V(r) describes the dependence of the electronic part of the wave-function on the positions of the nuclei r.
Second, force fields approximate the potential V (r) as a sum of interac-tion functions as listed in Table 2.2. Additionally to non-bonded interactionsthat describe interactions between all atoms, interactions between chemicallybound atoms are described with extra terms.
Third, instead of the time-development of the wave-function, only thetime-development of the expectation value of the nuclei positions is calcu-lated. This approximation is performed through the Ehrenfest theorem. Bythis approximation, the motion of the nuclei is described by Newtons equa-tions of motion,
drdt
= v
dvdt
= − 1m∇V (r) =
1m
F (r) . (2.10)
25 2.2. COMPUTER SIMULATION OF BIOMOLECULES
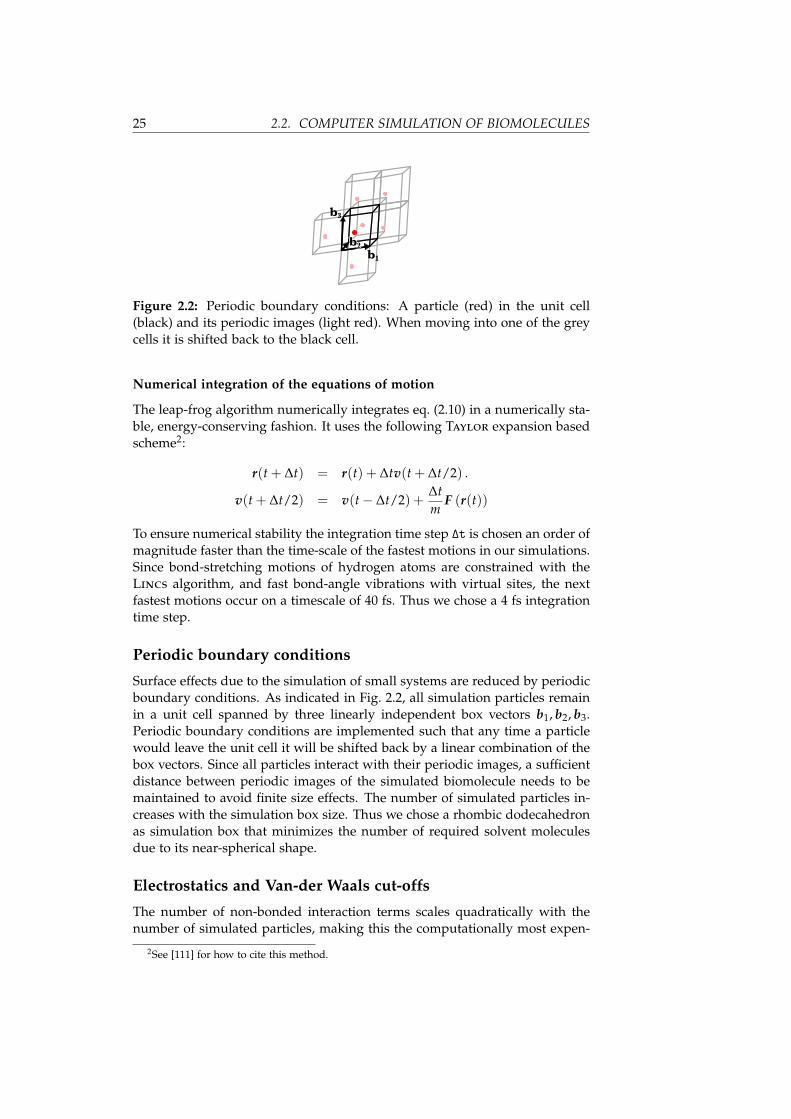
Figure 2.2: Periodic boundary conditions: A particle (red) in the unit cell(black) and its periodic images (light red). When moving into one of the greycells it is shifted back to the black cell.
Numerical integration of the equations of motion
The leap-frog algorithm numerically integrates eq. (2.10) in a numerically sta-ble, energy-conserving fashion. It uses the following Taylor expansion basedscheme2:
r(t + ∆t) = r(t) + ∆tv(t + ∆t/2) .
v(t + ∆t/2) = v(t− ∆t/2) +∆tm
F (r(t))
To ensure numerical stability the integration time step ∆t is chosen an order ofmagnitude faster than the time-scale of the fastest motions in our simulations.Since bond-stretching motions of hydrogen atoms are constrained with theLincs algorithm, and fast bond-angle vibrations with virtual sites, the nextfastest motions occur on a timescale of 40 fs. Thus we chose a 4 fs integrationtime step.
Periodic boundary conditions
Surface effects due to the simulation of small systems are reduced by periodicboundary conditions. As indicated in Fig. 2.2, all simulation particles remainin a unit cell spanned by three linearly independent box vectors b1, b2, b3.Periodic boundary conditions are implemented such that any time a particlewould leave the unit cell it will be shifted back by a linear combination of thebox vectors. Since all particles interact with their periodic images, a sufficientdistance between periodic images of the simulated biomolecule needs to bemaintained to avoid finite size effects. The number of simulated particles in-creases with the simulation box size. Thus we chose a rhombic dodecahedronas simulation box that minimizes the number of required solvent moleculesdue to its near-spherical shape.
Electrostatics and Van-der Waals cut-offs
The number of non-bonded interaction terms scales quadratically with thenumber of simulated particles, making this the computationally most expen-
2See [111] for how to cite this method.

2.2. COMPUTER SIMULATION OF BIOMOLECULES 26
sive part of the MD simulation of large systems. Since the van-der-Waals-interaction drops very fast with the distance, this interaction is cut-off at adefined distance with no significant impact on the simulation results.
In contrast, cut-off approximations of long range electrostatic interactionswere found to significantly distort simulations of nucleic acids and proteins[112, 113].
This limitation is overcome by Ewald summation that approximates elec-trostatic interaction above a cut-off in reciprocal space, accounting for long-range interactions while maintaining O(number of particles) run-time [114].
Pressure and Temperature coupling
To maintain pressure and temperature in our simulations, we use the Parinello-Rahman [115] barostat and Nosé-Hoover thermostat [116], respectively, whichimplement a weak coupling scheme. A friction term in pressure, respectivelytemperature space ensures generation of the grand-canonical ensemble. Incontrast to the weak coupling schemes, the more robust Berendsen couplingschemes [117] are used to drive systems to equilibium.
Set of starting coordinates
Our simulations rest on experimental data from X-ray diffraction experiments(stored in the pdb-database [118]) and subsequent refinement against three-dimensional cyro electron microscopy data as described below.
Limitations of Molecular Dynamics
Apart from the technical limitation of molecular dynamics to sampling lim-ited phase space, molecular dynamics faces conceptual limitations from theapproximations made above.
The effective potentials in Molecular Dynamics simulations of biomoleculesare paretrized to reproduce their properties at standard conditions for tem-perature and pressure. Simulations with parameters far from these conditionswill not match observations from other experiments.
By the way the force-field is implemented, chemical bonds cannot breakand form. Since quantum effects are subsumed in an effective potential, phe-nomena as quantum tunneling, excited states, photon absorption, ionization,resonance energy transfer, adiabatic transitions, de-localized electrons cannotbe inherently described. Yet, these effect are modelled by MD simulationsusing multiple effective potentials.
Further, polarization is not explicitly described by Molecular Dynamics.
Numerical description of the diffusion in an effective potential
To numerically estimate transition rates in an energy landscape we solve theSmoluchowsky equation by changing to the single system picture and nu-merically integrating the Browninan dynamics equation (2.7). The Brownian
27 2.3. CRYO-EM FITTING
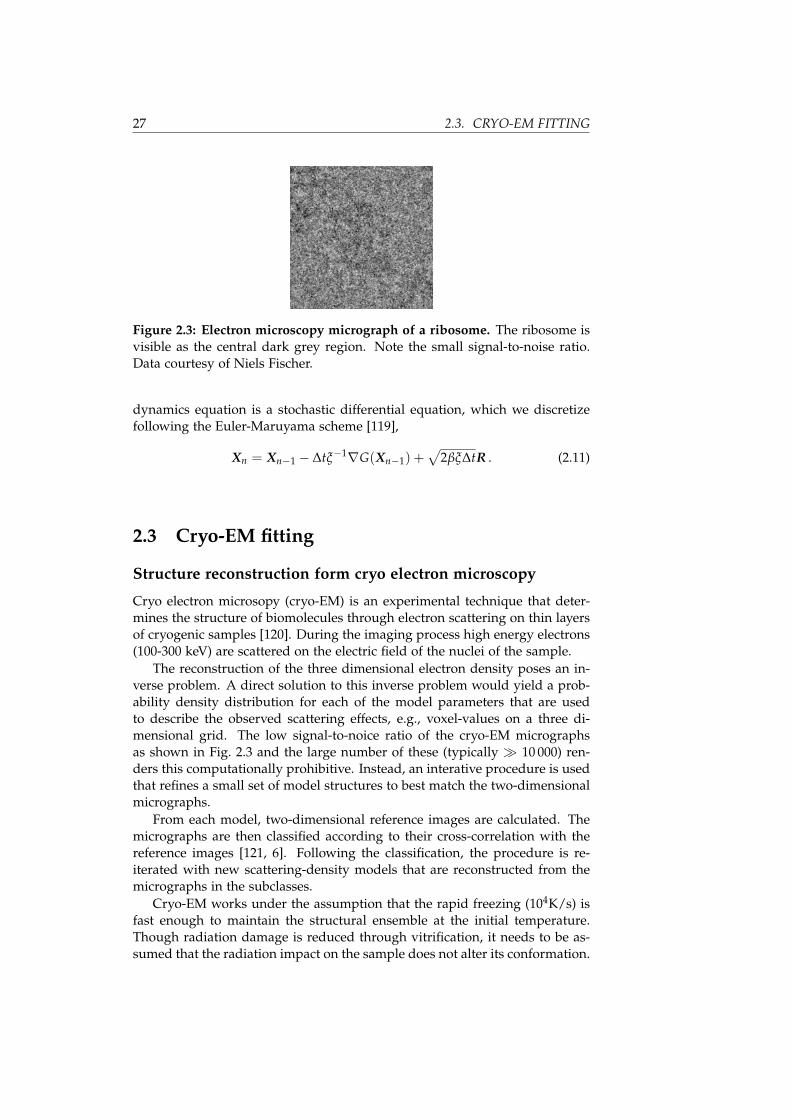
Figure 2.3: Electron microscopy micrograph of a ribosome. The ribosome isvisible as the central dark grey region. Note the small signal-to-noise ratio.Data courtesy of Niels Fischer.
dynamics equation is a stochastic differential equation, which we discretizefollowing the Euler-Maruyama scheme [119],
Xn = Xn−1 − ∆tξ−1∇G(Xn−1) +√
2βξ∆tR . (2.11)
2.3 Cryo-EM fitting
Structure reconstruction form cryo electron microscopy
Cryo electron microsopy (cryo-EM) is an experimental technique that deter-mines the structure of biomolecules through electron scattering on thin layersof cryogenic samples [120]. During the imaging process high energy electrons(100-300 keV) are scattered on the electric field of the nuclei of the sample.
The reconstruction of the three dimensional electron density poses an in-verse problem. A direct solution to this inverse problem would yield a prob-ability density distribution for each of the model parameters that are usedto describe the observed scattering effects, e.g., voxel-values on a three di-mensional grid. The low signal-to-noice ratio of the cryo-EM micrographsas shown in Fig. 2.3 and the large number of these (typically 10 000) ren-ders this computationally prohibitive. Instead, an interative procedure is usedthat refines a small set of model structures to best match the two-dimensionalmicrographs.
From each model, two-dimensional reference images are calculated. Themicrographs are then classified according to their cross-correlation with thereference images [121, 6]. Following the classification, the procedure is re-iterated with new scattering-density models that are reconstructed from themicrographs in the subclasses.
Cryo-EM works under the assumption that the rapid freezing (104K/s) isfast enough to maintain the structural ensemble at the initial temperature.Though radiation damage is reduced through vitrification, it needs to be as-sumed that the radiation impact on the sample does not alter its conformation.
2.3. CRYO-EM FITTING 28
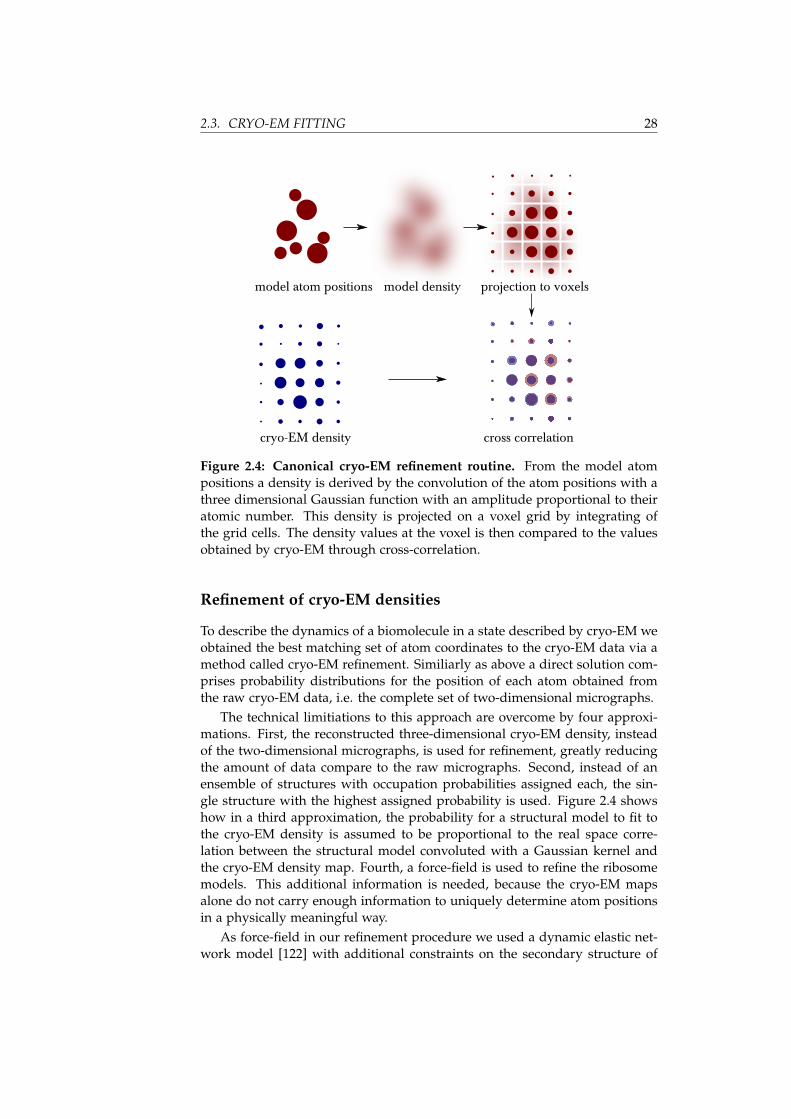
Figure 2.4: Canonical cryo-EM refinement routine. From the model atompositions a density is derived by the convolution of the atom positions with athree dimensional Gaussian function with an amplitude proportional to theiratomic number. This density is projected on a voxel grid by integrating ofthe grid cells. The density values at the voxel is then compared to the valuesobtained by cryo-EM through cross-correlation.
Refinement of cryo-EM densities
To describe the dynamics of a biomolecule in a state described by cryo-EM weobtained the best matching set of atom coordinates to the cryo-EM data via amethod called cryo-EM refinement. Similiarly as above a direct solution com-prises probability distributions for the position of each atom obtained fromthe raw cryo-EM data, i.e. the complete set of two-dimensional micrographs.
The technical limitiations to this approach are overcome by four approxi-mations. First, the reconstructed three-dimensional cryo-EM density, insteadof the two-dimensional micrographs, is used for refinement, greatly reducingthe amount of data compare to the raw micrographs. Second, instead of anensemble of structures with occupation probabilities assigned each, the sin-gle structure with the highest assigned probability is used. Figure 2.4 showshow in a third approximation, the probability for a structural model to fit tothe cryo-EM density is assumed to be proportional to the real space corre-lation between the structural model convoluted with a Gaussian kernel andthe cryo-EM density map. Fourth, a force-field is used to refine the ribosomemodels. This additional information is needed, because the cryo-EM mapsalone do not carry enough information to uniquely determine atom positionsin a physically meaningful way.
As force-field in our refinement procedure we used a dynamic elastic net-work model [122] with additional constraints on the secondary structure of
29 2.4. ENSEMBLE ANALYSIS
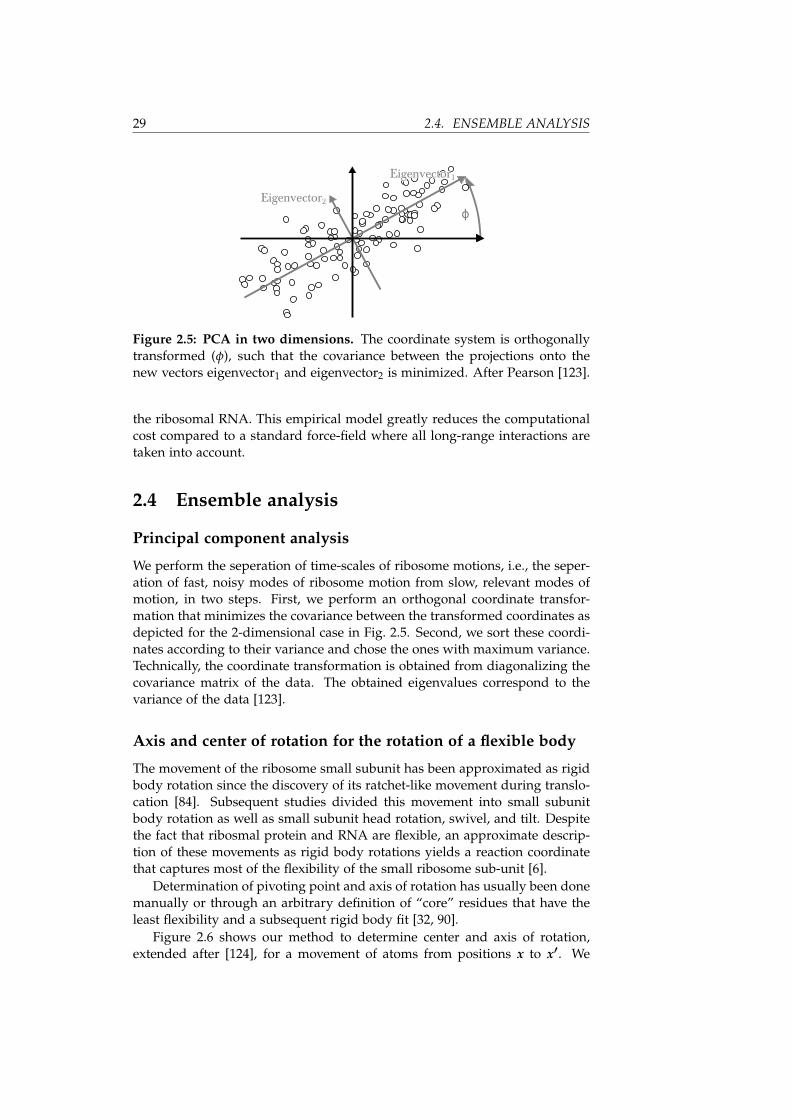
Figure 2.5: PCA in two dimensions. The coordinate system is orthogonallytransformed (φ), such that the covariance between the projections onto thenew vectors eigenvector1 and eigenvector2 is minimized. After Pearson [123].
the ribosomal RNA. This empirical model greatly reduces the computationalcost compared to a standard force-field where all long-range interactions aretaken into account.
2.4 Ensemble analysis
Principal component analysis
We perform the seperation of time-scales of ribosome motions, i.e., the seper-ation of fast, noisy modes of ribosome motion from slow, relevant modes ofmotion, in two steps. First, we perform an orthogonal coordinate transfor-mation that minimizes the covariance between the transformed coordinates asdepicted for the 2-dimensional case in Fig. 2.5. Second, we sort these coordi-nates according to their variance and chose the ones with maximum variance.Technically, the coordinate transformation is obtained from diagonalizing thecovariance matrix of the data. The obtained eigenvalues correspond to thevariance of the data [123].
Axis and center of rotation for the rotation of a flexible body
The movement of the ribosome small subunit has been approximated as rigidbody rotation since the discovery of its ratchet-like movement during translo-cation [84]. Subsequent studies divided this movement into small subunitbody rotation as well as small subunit head rotation, swivel, and tilt. Despitethe fact that ribosmal protein and RNA are flexible, an approximate descrip-tion of these movements as rigid body rotations yields a reaction coordinatethat captures most of the flexibility of the small ribosome sub-unit [6].
Determination of pivoting point and axis of rotation has usually been donemanually or through an arbitrary definition of “core” residues that have theleast flexibility and a subsequent rigid body fit [32, 90].
Figure 2.6 shows our method to determine center and axis of rotation,extended after [124], for a movement of atoms from positions x to x′. We

2.4. ENSEMBLE ANALYSIS 30
Figure 2.6: Best fitting center and axis of rotation for the the rotation ofa flexible body. From the flexible movement of a set of atoms (movementindicated by arrows from black atom positions to grey atom positions), weextract the center and axis of rotation through a non-linear least-squares fit.Panel (a) depicts the constraint used for fitting the center of rotation, where werequire that the standard deviation for all atoms from orthogonality of dx =x′− x and p = dx/2− c and is minimal. Panel (b) shows the fitting constraintto determine the axis of rotation w that requires the standard deviation for allatoms from orthogonality between dx and w is minimal. Panel (c) depicts theobtained parameters from the fitting procedurs, center of rotation and threeaxis of rotation: the axis of largest rotation, the axis of least rotation and anaxis perpendicular to the previous as well as the respective rotation angles.
define the flexible body rotation center with the respective shift vector dx =x′ − x as
argminc
∑i(dxi(dxi − 2c))2 . (2.12)
Now the same diagonalization approach as in the principal components anal-ysis described above yields the center of rotation. Similarly, the axis of rotationis determined from the solution to the following eigenvalue problem,
argminw
∑i(dxiw)2 = argmin
ww
(∑
idxidxT
i
)wT . (2.13)
Here, the other two eigenvectors describe the axis of minimum rotation aswell as an axis perpendicular to the axis of maximum and minimum rotation,which are also used to characterize the rotational movement. Overall we ob-tain a center of rotation as well as three axis of rotation and the respectiverotation angles from the movement of atoms from one position to another. Toaverage the determined rotations from the many movements between singlesnapshots in ensemble data, we use a quaternion-based average [125]. A plainaverage is used for the center of rotation.
Transition Rate estimates
We will now describe how we estimated the free energy barriers between ri-bosome translocation intermediates and a global attempt rate A as well as aglobal barrier calibration factor c. This estimate is also laid out in the Supple-mentary Information in [22], due to the space limitations in the supplement, in

31 2.4. ENSEMBLE ANALYSIS
Figure 2.7: From a sparse sampling of an energy landscape in states A (red),B (black), and C (blue) we estimate the transition rates ki→jbetween all pairsof states.
Figure 2.8: Harmonic approximation (black) to the underlying energy land-scape (grey) and effect of the global parameters c and ∆G‡
0 to the energybarrier estimate ∆G‡
est . The unknown energy landscape underlying trajecto-ries starting in states A, B is approximated by two harmonic functions withmean µA,B and standard deviation ΣA,B.

2.4. ENSEMBLE ANALYSIS 32
a very condensed way that, for example, only implicitely states how the mini-mum free energy intersection point of two n-dimensional quadratic forms wascalculated. Thus, we now expand on the points that were only mentioned inpassing in [22].
Fig. 2.7 shows the sparse sampling of an energy landscape states A, B,and C with trajectories x(t)A, x(t)B, and x(t)C and the respective tansitionrates kA→B, kA→C, kB→C, . . . indicated by arrows. We aim at estimating thesetransition rates, even though no overlap in sampling these states has beenobserved (cf. Fig. 2.7, States A and C).
We estimate transition rates from ensembles of trajectories x(t)i in threesteps. First, we estimate the transition state energy ∆G‡
est for transitions be-tween all individual pairs of trajectories from a harmonic approximation tothe energy landscape using the respective trajectory, as shown in Fig. 2.8.
Second, we combine all local transition energy barrier estimates to esti-mate two global fitting parameters, a gauge parameter c and global attemptfrequency ν using estimated transition probabilities from transitions observedin the trajectory ensemble.
Third, we estimate the transition rate between all pairs of states, using thegauged transition state energy ∆G‡ = c∆G‡
est and global attempt frequency νusing Kramers’ theory.
Harmonic Approximation to the Energy Landscape
The set of coordinates from sampling two states allows us to estimate theenergy barrier between them through a harmonic approximation to the en-ergy landscape. First we link the covariance and mean of a trajectory to theTaylor expansion of the local energy landscape, second we use the harmonicapproximations to find the isocommiter surface and the saddle point on it.
The Taylor expansion of an energy landscape at a local energy minimumx0 is
G (x) = G(x0) +12(x− x0)
T S (x− x0) +O((x− x0)3). (2.14)
The projection of a trajectory to lower dimensions is approximated by a mul-tivariate Gaussian with mean µ and covariance matrix Σ
p (x) = p0 exp(−1
2(x− µ)TΣ−1(x− µ)
). (2.15)
From G(x) = −kbT log p(x) it follows that
G (x) = G (µ) +12
kBT (x− µ)T Σ−1 (x− µ) . (2.16)
Comparing eqn. (2.14) with eqn. (2.16) shows that the local harmonic approx-imation to the energy landscape is given by mean and variance of the under-lying probability distribution.
Figure 2.9 shows the harmonic apprixmation to two trajectories startingin states A,B with means µA and µB and covariances ΣA and ΣB. Under theassumption that our system shows the same diffusion behaviour on the en-ergy landscape everywhere, GA(x) = GB(x) defines the iso-commiter surface,

33 2.4. ENSEMBLE ANALYSIS
Figure 2.9: Energy barrier estimate from a harmonic approximation to theenergy landscape. A randomly generated energy landscape depicted in (a)was sampled using a Metropolis-Monte-Carlo algorithmm, starting from twolow energy configurations. Each of the sampled point clouds was approx-imated by their mean and covariance as described in (2.4). The result ofthis quasi-harmonic approximation to the underlying energy landscape is de-picted in (b). The grey line depicts the iso-commiter surface, the grey dot thesaddle point.
starting from which it is equally likely to end in A and B. The lowest energyvalue on the iso-commiter surface
minGA(x)=GB(x)
GA (x) . (2.17)
dominates the transition timescales and is used to estimate the transition ratein Kramers’ rate theory introduced above. For free energy potentials of form(2.16) for states A and B, a Lagrange multiplier approach,
∇x,λ (GA(x) + λ(GB(x)− GA(x)) != 0,
yields the neccessary and sufficient conditions to fulfill 2.17.(
Σ−1B −
λ− 1λ
Σ−1A
)x‡ − Σ−1
B µB = 0
x‡T(
Σ−1B − Σ−1
A
)x‡T − 2x‡TΣ−1
B µB+
µTBΣ−1
B µB + 2 (GB(µB)− GA(µA)) = 0, (2.18)
where, without loss of generality, µA = 0. Though we found no closed formanalytical expression for 2.18, a numerical search on λ is straightforward.
The transition state energy estimate ∆G‡est for a transition from state A to
B is given by ∆G‡est = GA(x‡)− GA(µA).
Global Parameters in Trajectory Ensembles
We calibrate the estimated free energy barrier by a linear model
∆G‡ = c∆G‡est + ∆G‡
0 (2.19)
with calibration factor c as depicted in Fig. 2.8 and an off-set ∆G‡0 .

2.4. ENSEMBLE ANALYSIS 34
Figure 2.10: A transition occured, when the normalized distance betweentwo states is smaller than unity.
With ∆G‡ as the lowest saddle point energy on the energy landscape andan attempt rate ν to cross the barrier at a temperature T, Kramers’ rate theorygives the transition rate as
k = ν exp(−∆G‡
kBT
). (2.20)
The use of the linear model for the free energy barrier callibration yieldsour model for the transition rate
k = ν exp
(−∆G‡
0kBT
)exp
(−c
∆G‡est
kBT
)= ν exp
(−c
∆G‡est
kBT
)(2.21)
where the free energy barrier offset is absorbed into the global attemt rateν. To avoid overfitting of sparse data, we assume that the diffusiveness andthe ruggedness of the energy landscape is similar in all sampled regions andtherefore use one global value for the gauge factor c and the attempt rate ν.We now extract the model parameters c and ν by comparing the probabilityto observe a transition between two states in simulation time t, using ourrate estimates and the two model parameters c and ν to the actually observedtransition frequencies.
Determination of gauge factor c and global attempt rate
To obtain the transition frequencies between states in our simulations, we firstdefine transitions between two states, given our ensemble data. To this aim weintroduce a normalized distance between two trajectories shown in Fig. 2.10.It is given as the minimum distance between any a(t) ∈ A and b(t) ∈ B,normalized by the average distance between subsequent points,
dAB(τ) =mint<τ |a(t)− b(t)|
〈|r(t)− r(t + ∆t)|〉t,A,B. (2.22)
We consider a transition if dAB(τ) < 1. Given our model parameters c, νand the estimated free energy barrier, we can now express the probability toobserve such a transition within simulation time p(t) from reaction kinetics as
p(t) = 1− exp (−kt). (2.23)

35 2.4. ENSEMBLE ANALYSIS
We determined k above in eq. 2.21, so that we can write the transition proba-bility as
p(t, ∆G‡est) = 1− exp
[−ν exp
(−c∆G‡
estkBT
)t
]. (2.24)
Now, a fit of this model to transition frequencies that were observed in theensemble data to observed in the simulations, allows to obtain the modelparameters ν and c.
36
3. Publications
3.1 g_contacts: Fast contact search in bio-molecularensemble data
Of particular interest to the function of the ribosome are areas where its func-tional parts, e.g. tRNAs, the small and the large subunit, contact each other.Due to the detailed all-atom description of the ribosome, finding contacts be-tween ribosome parts is computationally very expensive when following anaive approach – checking all pairwise distances of atoms in the small andthe large subunit requires more than 1.3 · 1010(87 352 times 154 576) distancecalculations for one snapshot of the trajectory. In the following paper we im-plemented an approach that drastically reduces the run-time that is needed tofind contacts in large systems.
This article, published in “Computer Physics Communications”, was con-ceived and written by myself under supervision of Helmut Grubmüller.

Computer Physics Communications 184 (2013) 2856–2859
Contents lists available at ScienceDirect
Computer Physics Communications
journal homepage: www.elsevier.com/locate/cpc
g_contacts: Fast contact search in bio-molecular ensemble data,
Christian Blau, Helmut Grubmuller ∗
Max Planck Institute for Biophysical Chemistry, Am Fassberg 11, 37077 Göttingen, Germany
a r t i c l e i n f o
Article history:Received 6 June 2013Received in revised form1 July 2013Accepted 13 July 2013Available online 29 July 2013
Keywords:Range searchMolecular dynamicsDecomposition schemeGromacs
a b s t r a c t
Short-range interatomic interactions govern many bio-molecular processes. Therefore, identifying closeinteraction partners in ensemble data is an essential task in structural biology and computationalbiophysics. A contact search can be cast as a typical range search problem for which efficient algorithmshave been developed. However, none of those has yet been adapted to the context of macromolecularensembles, particularly in a molecular dynamics (MD) framework. Here a set-decomposition algorithmis implemented which detects all contacting atoms or residues in maximum O(N log(N)) run-time, incontrast to the O(N2) complexity of a brute-force approach.
Program summaryProgram title: g_contactsCatalogue identifier: AEQA_v1_0Program summary URL: http://cpc.cs.qub.ac.uk/summaries/AEQA_v1_0.htmlProgram obtainable from: CPC Program Library, Queen’s University, Belfast, N. IrelandLicensing provisions: Standard CPC licence, http://cpc.cs.qub.ac.uk/licence/licence.htmlNo. of lines in distributed program, including test data, etc.: 8945No. of bytes in distributed program, including test data, etc.: 981604Distribution format: tar.gzProgramming language: C99.Computer: PC.Operating system: Linux.RAM: ≈Size of input frameClassification: 3, 4.14.External routines: Gromacs 4.6[1]Nature of problem: Finding atoms or residues that are closer to one another than a given cut-off.Solution method: Excluding distant atoms from distance calculations by decomposing the given set ofatoms into disjoint subsets.Running time: ≤ O(N log(N))References:[1] S. Pronk, S. Pall, R. Schulz, P. Larsson, P. Bjelkmar, R. Apostolov, M. R. Shirts, J.C. Smith, P. M. Kasson,D. van der Spoel, B. Hess and Erik Lindahl, Gromacs 4.5: a high-throughput and highly parallel open sourcemolecular simulation toolkit, Bioinformatics 29 (7) (2013).
© 2013 The Authors. Published by Elsevier B.V. All rights reserved.
1. Introduction
Molecular dynamics (MD) integrators allow simulations of largebio-molecular systems comprising millions of atoms on nanosec-ond to millisecond time scales [1,2]. These simulations produce a
This paper and its associated computer program are available via the ComputerPhysics Communication homepage on ScienceDirect (http://www.sciencedirect.com/science/journal/00104655). This is an open-access article distributed under the terms of the CreativeCommons Attribution License, which permits unrestricted use, distribution, andreproduction in any medium, provided the original author and source are credited.∗ Corresponding author.
E-mail addresses: [email protected] (C. Blau), [email protected](H. Grubmuller).
substantial amount of trajectory data, which typically consist of104–106 structure ‘‘snapshots’’ (frames). The computational effortto generate the trajectory data scales with O(N log(N)), where Nis the number of simulated particles. Efficient analysis tools to ex-tract certain observables from these data are required that exhibita comparable scaling behavior to the algorithms that generate thetrajectory data.
Identifying all atoms of a solute molecule which interactwith the solvent, or all close atoms from different subunits ofa molecular complex, is a recurring task. From a computationalperspective, these tasks require one to identify all pairs of atomsthat are closer to one another than a defined minimum contactdistance. This task has been described as a spherical range searchproblem [3].
0010-4655/$ – see front matter© 2013 The Authors. Published by Elsevier B.V. All rights reserved.http://dx.doi.org/10.1016/j.cpc.2013.07.018

C. Blau, H. Grubmuller / Computer Physics Communications 184 (2013) 2856–2859 2857
Fig. 1. Decomposition reduces the number of distance calculations during the contactsearch between two sets of atoms. (a) The number of required distance calculations(black lines) is reduced by decomposing the set of atomsA (left) into disjoint subsetsA1, A2 (right). The distances to b are only calculated if b lies within the boundingbox of the atoms in Ai or is closer to the bounding box than the minimum contactdistance d, indicated by the width of the yellow and gray frames. (b) Generalizationof (a) to an arbitrary set B. Another bounding box of the set B is determined andchecked for overlap with A. (c) In the next step, the biggest remaining subset is splitalong the median. The resulting subsets of B are again checked for overlap with A.(d) The implemented set-decomposition scheme given in pseudo-code.
Here, we describe the efficient implementation of an algorithmto obtain contacting atom pairs of two sets of atoms and respectivetrajectory contact frequencies. The modified k-dimensional treeapproach employed has a worst-case run-time of ∝ O(N log(N))for two sets of sizeN comparedwith a run-time∝ O(N2)of a brute-force approach. This high efficiency is achieved by excluding setsof distant atoms from the distance calculation. Combined with theexcellent scaling properties of the method on parallel machines,this advantage will be particularly pronounced in future exascalecomputing applications.
The routine is implemented within gromacs [4]. Due to theversatile implementation, it can also be applied to other three-dimensional contact searches. Extension to higher dimensions isstraightforward.
2. Methods
2.1. Task
Given two sets of labeled atoms, A = ai and B = bj, and aminimum contact distance d, the task of the algorithm describedhere is to identify all contacting atom pairs, i.e., all pairs of atomindices (i, j) with ∥ai − bj∥ < d. A brute-force approach wouldrequire the calculation of the Euclidean distance between all pos-sible pairs of atoms. The set decomposition scheme implementedhere drastically reduces the number of necessary distance calcula-tions and therefore the run-time.
2.2. Algorithm
For simplicity of presentation, we first assume the special casewhere one of the two sets, B, contains only one atom b (Fig. 1(a)).This case will subsequently be generalized to arbitrary sets A, B(Fig. 1(b), (c)).
As a first step, the minimum bounding box (bbox, yellow) ofset A with sides aligned to the x, y, and z axes is determined. Ifthe distance of b to the box boundary along the direction of thethree coordinates exceeds a given contact distance d, b is not incontact with A, and the contact search terminates. Otherwise, A isdecomposed into two subsets A = A1 ∪A2 [3]. If the distance of the
two child bboxes (gray, yellow) of subset A1 to b or A2 to b exceedsd, the respective subset is discarded. Alternatively, the child bbox isfurther decomposed into two disjoint subsets (not shown), and soon. Decomposition is terminatedwhen all subsets contain less thana given minimum number of atoms. As a final step, the distancesof b to all atoms in the remaining subsets are determined, and theindices i are stored for which ∥ai − b∥ < d.
Fig. 1(b) generalizes the above decomposition procedure to aset B comprising more than one atom. In this case, the bbox is alsodetermined for B (blue), and B is also recursively split into subsets.For each subset Bq, all sets Ap overlappingwith Bq are stored.Whenthe decomposition terminates, only the distances for atompairs i, jin stored pairs of sets Ap, Bq need to be calculated.
2.3. Application to ensemble data
The algorithm is applied to each frame of a given trajectory.Atom pair contacts are counted each frame. From these, the con-tact frequency is calculated by dividing the contact count bythe number of frames analyzed. In addition to atom contact fre-quencies, residue contact frequencies are determined by defin-ing two residues to be in contact if any of their respective atomsare in contact.
2.4. Efficiency
Four particular properties of the implemented algorithm renderit efficient. First, subsets are decomposed along the median atomcoordinates, which allows for the application of the median sortalgorithm [5] such that the number of atoms in each subset is bal-anced in minimum run-time. Second, the order of atoms is keptfrom the previously analyzed frame. Thus the sorting effort is re-duced if similar frames are analyzed. Third, after splitting a set Apinto subsets Ap1 , Ap2 , overlap with subsets Bq ⊂ B only needs to bechecked if Bq overlapped with Ap in the previous step, thus savinga large fraction of overlap checks for newly generated sets. Fourth,decomposition is stopped as soon as the brute-force approach toidentify contacts between subsets Ap, Bq becomes on averagemoreefficient than further decomposition at an empirically determinedupper boundary for the minimum set size nmin.
3. Software structure
The contact search algorithm described here is implemented inC99. It uses the gromacs application programming interface (API)provided with the MD package gromacs 4.6 [4].
4. Run description
4.1. Data input
Input arguments are trajectory file names (flagged -f), a gro-macs index file name that contains two index groups specifyingeach set of atoms (-n), a floating-point number that holds themin-imum contact distance in nm (-d, by default d = 0.3 nm), and thethreshold for the largest number of atoms in any node (-bsize).If the option (-resndx) is chosen, a gromacs structure file (-s) isread.
4.2. Optional switches
The optional switch -nopbc ignores periodic boundary condi-tions, speeding up the calculation; -resndx calculates the con-tacts between two groups of residues instead of two groups ofatoms.
4.3. Data output
Contact frequencies are written to an output file (name givenin -o). If the flag -resndx is set, an additional index file (name
2858 C. Blau, H. Grubmuller / Computer Physics Communications 184 (2013) 2856–2859
given in -on) is written, which contains one index group for eachcontacting residue and its atom indices.
4.4. Example runs
We performed example runs on a typical test case as well as ona worst-case scenario.
A typical case is provided by a simulation of adenosine triphos-phate (ATP) molecules in solution which bind to ribonucleic acid(RNA) [6]. We used an MD simulation of a solvated RNA moleculecomprising 1166 atoms and two ATP molecules in solution com-prising 86 atoms. The atom pairs and contact frequencies of RNAand ATP that are closer than d = 0.3 nm were determined for20000 frames of the simulation. The index-file reads:[ RNA ]1 2 3 4 5 6 7 8 9 10 11 12 13...1161 1162 1163 1164 1165 1166[ ATP ]1167 1168 1169 1170 1171 1172...1248 1249 1250 1251 1252 1253 .
The command to analyze the given trajectory traj.xtc is:g_contacts -f traj.xtc -n index.ndx .
A worst-case scenario is provided by two highly overlappingsets of atoms, where many set decompositions are required, andonly a few subsets can be excluded from the contact search. Theexample considered here is a contact search in trajectories of a 1 nssimulation of TIP3P water in a periodic cubic water box of 5, 6, 7,8 and 9 nm length (i.e., 12 426, 21483, 34251, 51393, and 72768atoms, respectively), which were screened for contacts betweensets of N consecutively labeled atoms. Contacts were searchedbetween N = 1, 21, 41, . . . , 981 atoms. The default distance cut-off of d = 0.3 nm was applied.
The respective index-file for N = 21 and a 12426 atom simu-lation reads:[ group_1 ]1 2 3 4 5 6 7 8 9 10 11 12 1314 15 16 17 18 19 20 21[ group_2 ]6213 6214 6215 6216 6217 6218...6228 6229 6230 6231 6232 6233 .
The analysis of the trajectory stored in traj.xtc was per-formed issuing the following command:g_contacts -f traj.xtc -n index.ndx .
The residue-based contact search determines contacts betweenwater molecules, and was performed usingg_contacts -s traj.gro -f traj.xtc -resndx .
5. Comparison with other methods
To compare the set-decomposition algorithm and the brute-force approach, the CPU clock cycles were counted that wererequired for the respective contact search and the storage of thecontacts, excluding trajectory-file reading routines.
For the system containing ATP and RNA, the required CPU cyclesfor contact search and storage were recorded for 101 analyzedframes, which were analyzed every 0.2 ns in a 20 ns trajectory. Aspeed-up of 9.1-fold was obtained for the implementation of theset decomposition algorithm over the brute-force approach.
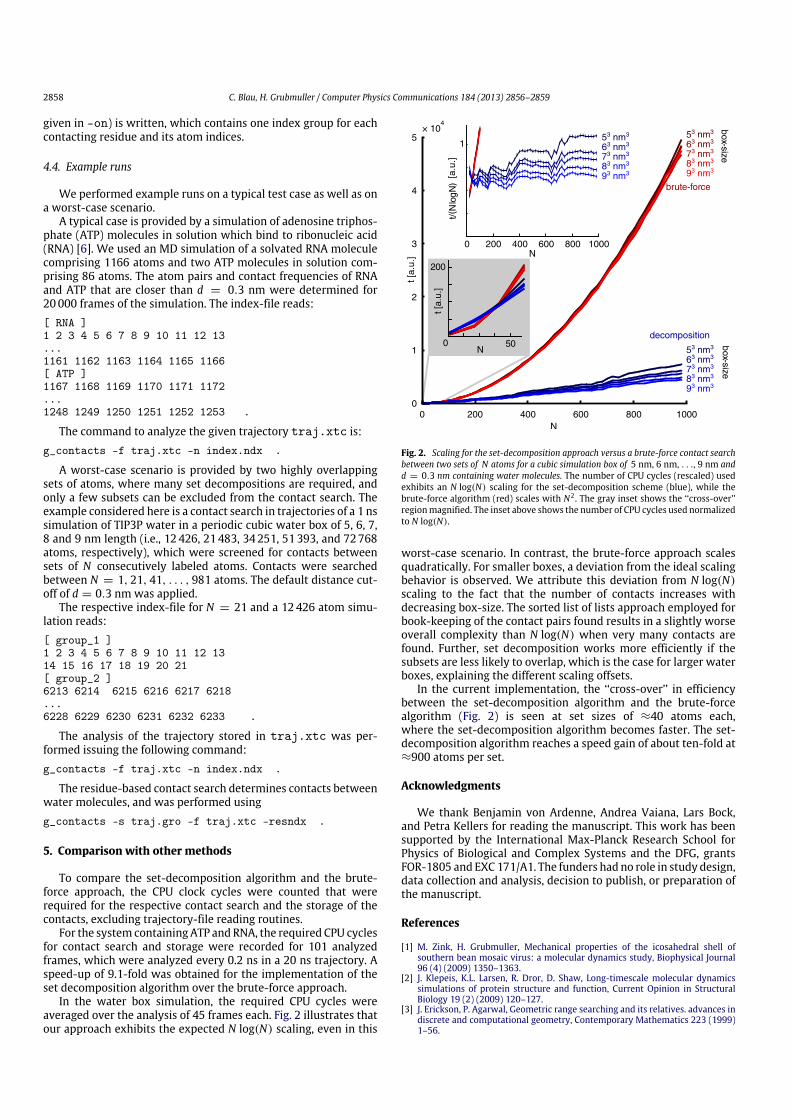
In the water box simulation, the required CPU cycles wereaveraged over the analysis of 45 frames each. Fig. 2 illustrates thatour approach exhibits the expected N log(N) scaling, even in this
Fig. 2. Scaling for the set-decomposition approach versus a brute-force contact searchbetween two sets of N atoms for a cubic simulation box of 5 nm, 6 nm, . . ., 9 nm andd = 0.3 nm containing water molecules. The number of CPU cycles (rescaled) usedexhibits an N log(N) scaling for the set-decomposition scheme (blue), while thebrute-force algorithm (red) scales with N2 . The gray inset shows the ‘‘cross-over’’regionmagnified. The inset above shows the number of CPU cycles used normalizedto N log(N).
worst-case scenario. In contrast, the brute-force approach scalesquadratically. For smaller boxes, a deviation from the ideal scalingbehavior is observed. We attribute this deviation from N log(N)scaling to the fact that the number of contacts increases withdecreasing box-size. The sorted list of lists approach employed forbook-keeping of the contact pairs found results in a slightly worseoverall complexity than N log(N) when very many contacts arefound. Further, set decomposition works more efficiently if thesubsets are less likely to overlap, which is the case for larger waterboxes, explaining the different scaling offsets.
In the current implementation, the ‘‘cross-over’’ in efficiencybetween the set-decomposition algorithm and the brute-forcealgorithm (Fig. 2) is seen at set sizes of ≈40 atoms each,where the set-decomposition algorithm becomes faster. The set-decomposition algorithm reaches a speed gain of about ten-fold at≈900 atoms per set.
Acknowledgments
We thank Benjamin von Ardenne, Andrea Vaiana, Lars Bock,and Petra Kellers for reading the manuscript. This work has beensupported by the International Max-Planck Research School forPhysics of Biological and Complex Systems and the DFG, grantsFOR-1805 and EXC 171/A1. The funders had no role in study design,data collection and analysis, decision to publish, or preparation ofthe manuscript.
References
[1] M. Zink, H. Grubmuller, Mechanical properties of the icosahedral shell ofsouthern bean mosaic virus: a molecular dynamics study, Biophysical Journal96 (4) (2009) 1350–1363.
[2] J. Klepeis, K.L. Larsen, R. Dror, D. Shaw, Long-timescale molecular dynamicssimulations of protein structure and function, Current Opinion in StructuralBiology 19 (2) (2009) 120–127.
[3] J. Erickson, P. Agarwal, Geometric range searching and its relatives. advances indiscrete and computational geometry, Contemporary Mathematics 223 (1999)1–56.

C. Blau, H. Grubmuller / Computer Physics Communications 184 (2013) 2856–2859 2859
[4] S. Pronk, S. Pall, R. Schulz, P. Larsson, P. Bjelkmar, R. Apostolov, M.R. Shirts,J.C. Smith, P.M. Kasson, D.V.D. Spoel, B. Hess, E. Lindahl, Gromacs 4.5: ahigh-throughput and highly parallel open source molecular simulation toolkit,Bioinformatics 29 (7) (2013) 845–854.
[5] D. Knuth, The Art of Computer Programming, Vol. 3: Sorting and Searching,Addison-Wesley, Reading, MA, 1973.
[6] T. Dieckmann, E. Suzuki, J. Feigon, G.K. Nakamura, Solution structure of an atp-binding rna aptamer reveals a novel fold, RNA 2 (7) (1996) 628–640.
413.2. ENERGY BARRIERS AND DRIVING FORCES IN TRNA
TRANSLOCATION THROUGH THE RIBOSOME
3.2 Energy barriers and driving forces in tRNA translo-cation through the ribosome
In the following publication we describe how tRNA translocate through theribosome through a combination of MD simulations, cryo-EM, X-ray data,spectroscopic measurements and bioinformatics analysis. In this publication Ishare first authorship with Lars V Bock. For this publication I predominantlycontributed
• Transition rate estimates
• Determination of a kinetic sequence of states
• Check of stereochemical parameters of the models
• Quantification of 30S head and body rotation
I made essential contributions to
• Writing of the manuscript
• Figure preparation
• Refinement of the atomic models against cryo-EM maps
• Comparision to recent crystal structures
• Definition of reaction coordiantes for collective motions
• Check of conservation of contact residues
• Interaction enthalpy estimates
“The proposed manuscript comes across as a summary of a Magnum opus thesisin which gaps are left in the foundations, even with a supplement that is over-whelming in size. [. . . ] As it stands, it is impossible to know whether the plausibleconclusions are the result of robust ribosome physics shining through unsubstanti-ated methodology, or a happy accident that might prove irreproducible.”Anonymus
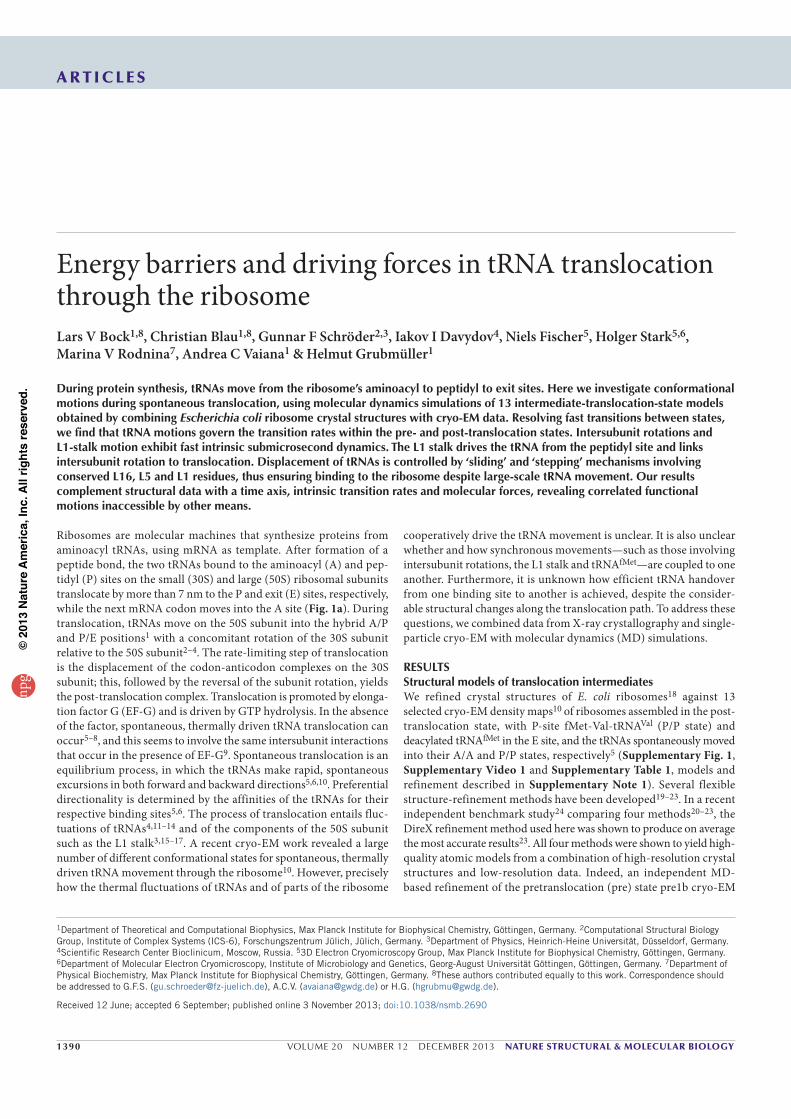
1390 VOLUME 20 NUMBER 12 DECEMBER 2013 nature structural & molecular biology
a r t i c l e s
Ribosomes are molecular machines that synthesize proteins from aminoacyl tRNAs, using mRNA as template. After formation of a peptide bond, the two tRNAs bound to the aminoacyl (A) and pep-tidyl (P) sites on the small (30S) and large (50S) ribosomal subunits translocate by more than 7 nm to the P and exit (E) sites, respectively, while the next mRNA codon moves into the A site (Fig. 1a). During translocation, tRNAs move on the 50S subunit into the hybrid A/P and P/E positions1 with a concomitant rotation of the 30S subunit relative to the 50S subunit2–4. The rate-limiting step of translocation is the displacement of the codon-anticodon complexes on the 30S subunit; this, followed by the reversal of the subunit rotation, yields the post-translocation complex. Translocation is promoted by elonga-tion factor G (EF-G) and is driven by GTP hydrolysis. In the absence of the factor, spontaneous, thermally driven tRNA translocation can occur5–8, and this seems to involve the same intersubunit interactions that occur in the presence of EF-G9. Spontaneous translocation is an equilibrium process, in which the tRNAs make rapid, spontaneous excursions in both forward and backward directions5,6,10. Preferential directionality is determined by the affinities of the tRNAs for their respective binding sites5,6. The process of translocation entails fluc-tuations of tRNAs4,11–14 and of the components of the 50S subunit such as the L1 stalk3,15–17. A recent cryo-EM work revealed a large number of different conformational states for spontaneous, thermally driven tRNA movement through the ribosome10. However, precisely how the thermal fluctuations of tRNAs and of parts of the ribosome
cooperatively drive the tRNA movement is unclear. It is also unclear whether and how synchronous movements—such as those involving intersubunit rotations, the L1 stalk and tRNAfMet—are coupled to one another. Furthermore, it is unknown how efficient tRNA handover from one binding site to another is achieved, despite the consider-able structural changes along the translocation path. To address these questions, we combined data from X-ray crystallography and single-particle cryo-EM with molecular dynamics (MD) simulations.
RESULTSStructuralmodelsoftranslocationintermediatesWe refined crystal structures of E. coli ribosomes18 against 13 selected cryo-EM density maps10 of ribosomes assembled in the post- translocation state, with P-site fMet-Val-tRNAVal (P/P state) and deacylated tRNAfMet in the E site, and the tRNAs spontaneously moved into their A/A and P/P states, respectively5 (Supplementary Fig. 1, Supplementary Video 1 and Supplementary Table 1, models and refinement described in Supplementary Note 1). Several flexible structure-refinement methods have been developed19–23. In a recent independent benchmark study24 comparing four methods20–23, the DireX refinement method used here was shown to produce on average the most accurate results23. All four methods were shown to yield high-quality atomic models from a combination of high-resolution crystal structures and low-resolution data. Indeed, an independent MD-based refinement of the pretranslocation (pre) state pre1b cryo-EM
1Department of Theoretical and Computational Biophysics, Max Planck Institute for Biophysical Chemistry, Göttingen, Germany. 2Computational Structural Biology Group, Institute of Complex Systems (ICS-6), Forschungszentrum Jülich, Jülich, Germany. 3Department of Physics, Heinrich-Heine Universität, Düsseldorf, Germany. 4Scientific Research Center Bioclinicum, Moscow, Russia. 53D Electron Cryomicroscopy Group, Max Planck Institute for Biophysical Chemistry, Göttingen, Germany. 6Department of Molecular Electron Cryomicroscopy, Institute of Microbiology and Genetics, Georg-August Universität Göttingen, Göttingen, Germany. 7Department of Physical Biochemistry, Max Planck Institute for Biophysical Chemistry, Göttingen, Germany. 8These authors contributed equally to this work. Correspondence should be addressed to G.F.S. ([email protected]), A.C.V. ([email protected]) or H.G. ([email protected]).
Received 12 June; accepted 6 September; published online 3 November 2013; doi:10.1038/nsmb.2690
Energy barriers and driving forces in tRNA translocation through the ribosomeLars V Bock1,8, Christian Blau1,8, Gunnar F Schröder2,3, Iakov I Davydov4, Niels Fischer5, Holger Stark5,6, Marina V Rodnina7, Andrea C Vaiana1 & Helmut Grubmüller1
Duringproteinsynthesis,tRNAsmovefromtheribosome’saminoacyltopeptidyltoexitsites.Hereweinvestigateconformationalmotionsduringspontaneoustranslocation,usingmoleculardynamicssimulationsof13intermediate-translocation-statemodelsobtainedbycombiningEscherichia coliribosomecrystalstructureswithcryo-EMdata.Resolvingfasttransitionsbetweenstates,wefindthattRNAmotionsgovernthetransitionrateswithinthepre-andpost-translocationstates.IntersubunitrotationsandL1-stalkmotionexhibitfastintrinsicsubmicroseconddynamics.TheL1stalkdrivesthetRNAfromthepeptidylsiteandlinksintersubunitrotationtotranslocation.DisplacementoftRNAsiscontrolledby‘sliding’and‘stepping’mechanismsinvolvingconservedL16,L5andL1residues,thusensuringbindingtotheribosomedespitelarge-scaletRNAmovement.Ourresultscomplementstructuraldatawithatimeaxis,intrinsictransitionratesandmolecularforces,revealingcorrelatedfunctionalmotionsinaccessiblebyothermeans.
npg
© 2
013
Nat
ure
Am
eric
a, In
c. A
ll rig
hts
rese
rved
.
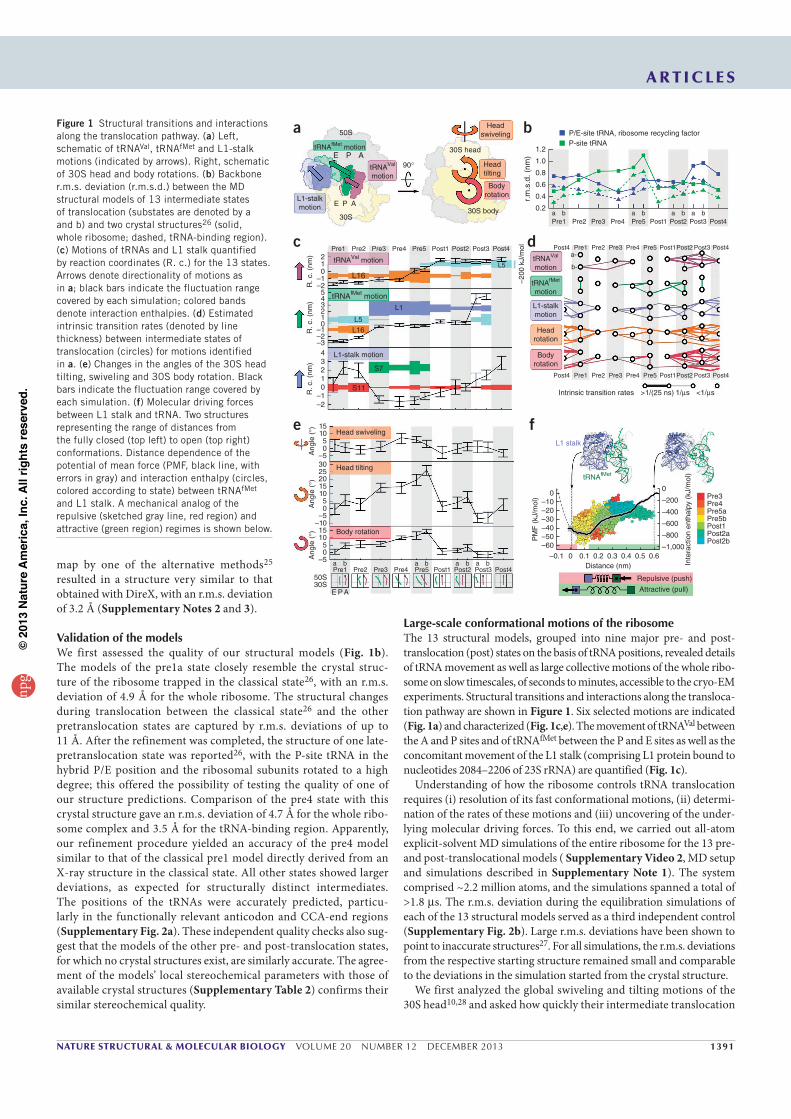
nature structural & molecular biology VOLUME 20 NUMBER 12 DECEMBER 2013 1391
a r t i c l e s
map by one of the alternative methods25 resulted in a structure very similar to that obtained with DireX, with an r.m.s. deviation of 3.2 Å (Supplementary Notes 2 and 3).
ValidationofthemodelsWe first assessed the quality of our structural models (Fig. 1b). The models of the pre1a state closely resemble the crystal struc-ture of the ribosome trapped in the classical state26, with an r.m.s. deviation of 4.9 Å for the whole ribosome. The structural changes during translocation between the classical state26 and the other pretranslocation states are captured by r.m.s. deviations of up to 11 Å. After the refinement was completed, the structure of one late-pretranslocation state was reported26, with the P-site tRNA in the hybrid P/E position and the ribosomal subunits rotated to a high degree; this offered the possibility of testing the quality of one of our structure predictions. Comparison of the pre4 state with this crystal structure gave an r.m.s. deviation of 4.7 Å for the whole ribo-some complex and 3.5 Å for the tRNA-binding region. Apparently, our refinement procedure yielded an accuracy of the pre4 model similar to that of the classical pre1 model directly derived from an X-ray structure in the classical state. All other states showed larger deviations, as expected for structurally distinct intermediates. The positions of the tRNAs were accurately predicted, particu-larly in the functionally relevant anticodon and CCA-end regions (Supplementary Fig. 2a). These independent quality checks also sug-gest that the models of the other pre- and post-translocation states, for which no crystal structures exist, are similarly accurate. The agree-ment of the models’ local stereochemical parameters with those of available crystal structures (Supplementary Table 2) confirms their similar stereochemical quality.
Large-scaleconformationalmotionsoftheribosomeThe 13 structural models, grouped into nine major pre- and post- translocation (post) states on the basis of tRNA positions, revealed details of tRNA movement as well as large collective motions of the whole ribo-some on slow timescales, of seconds to minutes, accessible to the cryo-EM experiments. Structural transitions and interactions along the transloca-tion pathway are shown in Figure 1. Six selected motions are indicated (Fig. 1a) and characterized (Fig. 1c,e). The movement of tRNAVal between the A and P sites and of tRNAfMet between the P and E sites as well as the concomitant movement of the L1 stalk (comprising L1 protein bound to nucleotides 2084–2206 of 23S rRNA) are quantified (Fig. 1c).
Understanding of how the ribosome controls tRNA translocation requires (i) resolution of its fast conformational motions, (ii) determi-nation of the rates of these motions and (iii) uncovering of the under-lying molecular driving forces. To this end, we carried out all-atom explicit-solvent MD simulations of the entire ribosome for the 13 pre- and post-translocational models ( Supplementary Video 2, MD setup and simulations described in Supplementary Note 1). The system comprised ~2.2 million atoms, and the simulations spanned a total of >1.8 µs. The r.m.s. deviation during the equilibration simulations of each of the 13 structural models served as a third independent control (Supplementary Fig. 2b). Large r.m.s. deviations have been shown to point to inaccurate structures27. For all simulations, the r.m.s. deviations from the respective starting structure remained small and comparable to the deviations in the simulation started from the crystal structure.
We first analyzed the global swiveling and tilting motions of the 30S head10,28 and asked how quickly their intermediate translocation
50S
30S head
Headswiveling
Headtilting
Bodyrotation
30S body
tRNAfMet motion
L1-stalkmotion
tRNAVal
motion
30S
E P A
E P A90°
r.m
.s.d
. (nm
)
1.2
1.0
0.8
0.6
0.4
0.2a b a b a b a bPre1 Pre2 Pre3 Pre4 Pre5 Post1 Post2 Post3 Post4
P/E-site tRNA, ribosome recycling factorP-site tRNA
a b
tRNAVal
motion
tRNAfMet
motion
L1-stalkmotion
Headrotation
Bodyrotation
Pre1a-
b-
Post4 Pre2 Pre3 Pre4 Pre5 Post1Post2 Post3 Post4
Pre1Post4
Intrinsic transition rates >1/(25 ns) 1/µs <1/µs
Pre2 Pre3 Pre4 Pre5 Post1Post2 Post3 Post4
R. c
. (nm
)R
. c. (
nm)
R. c
. (nm
)
–200
kJ/
molPre1 Pre2
tRNAVal motion
tRNAfMet motion
L1-stalk motion
S11
S7
L5
L5
Pre3 Pre4 Pre5 Post1 Post2 Post3 Post4210
–1–2543210
–1–2–343210
–1–2
L16
L16
L1
dc
Ang
le (
°)A
ngle
(°)
Ang
le (
°)
Head swiveling
Head tilting
Body rotation
151050
–5302520151050
–5–10151050
–5 a
E P A
b a b a b a bPre1
50S30S
Pre2 Pre3 Pre4 Pre5 Post1 Post2 Post3 Post4
L1 stalk
tRNAfMet
0–10–20–30
PM
F (
kJ/m
ol)
Inte
ract
ion
enth
alpy
(kJ
/mol
)
–40–50–60
0
–200
–400
–600
–800
–1,000–0.1 0 0.1 0.2 0.3
Distance (nm)
Repulsive (push)
Attractive (pull)
0.4 0.5 0.6
Pre3Pre4Pre5aPre5bPost1Post2aPost2b
fe
Figure 1 Structural transitions and interactions along the translocation pathway. (a) Left, schematic of tRNAVal, tRNAfMet and L1-stalk motions (indicated by arrows). Right, schematic of 30S head and body rotations. (b) Backbone r.m.s. deviation (r.m.s.d.) between the MD structural models of 13 intermediate states of translocation (substates are denoted by a and b) and two crystal structures26 (solid, whole ribosome; dashed, tRNA-binding region). (c) Motions of tRNAs and L1 stalk quantified by reaction coordinates (R. c.) for the 13 states. Arrows denote directionality of motions as in a; black bars indicate the fluctuation range covered by each simulation; colored bands denote interaction enthalpies. (d) Estimated intrinsic transition rates (denoted by line thickness) between intermediate states of translocation (circles) for motions identified in a. (e) Changes in the angles of the 30S head tilting, swiveling and 30S body rotation. Black bars indicate the fluctuation range covered by each simulation. (f) Molecular driving forces between L1 stalk and tRNA. Two structures representing the range of distances from the fully closed (top left) to open (top right) conformations. Distance dependence of the potential of mean force (PMF, black line, with errors in gray) and interaction enthalpy (circles, colored according to state) between tRNAfMet and L1 stalk. A mechanical analog of the repulsive (sketched gray line, red region) and attractive (green region) regimes is shown below.
npg
© 2
013
Nat
ure
Am
eric
a, In
c. A
ll rig
hts
rese
rved
.

1392 VOLUME 20 NUMBER 12 DECEMBER 2013 nature structural & molecular biology
a r t i c l e s
states interconvert. To this end, we deter-mined pivot points, rotation axes and angles for 30S head and body motion (Fig. 1e; reac-tion coordinates described in Supplementary Note 2). During the transition from pre1 to pre5, the angles of 30S head tilting and body rotation gradually increase before returning to low values in the pre5-post1 transition. In the post3 state, the rotation angles are even lower than in pre1 or post1, and they finally return to their initial value in post4, thus closing the conformational cycle of the 30S subunit due to tRNA release from the E site. As can be seen from the amplitude of rapid (>107/s) fluctuations extracted from the simulations, large-scale motions occur not only on the millisecond time scale accessible to single-molecule experiments29 but also on the submicrosecond time scale. Moreover, the large overlaps between the fluctuation ampli-tudes of several adjacent states suggest fast transitions between these states, in particular for 30S head swiveling. Conversely, lack of an overlap between adjacent states (for example, between pre4 and pre5 or between pre5 and post1 for tRNAVal) indicates transitions between states that are slower than 100 ns.
SlowtRNAmovementgovernsoveralltransitionratesTo determine which of the observed motions limit the overall intercon-version rates between the states, we quantified the overlaps between all states and translated them into free-energy barriers and intrin-sic (order of magnitude) transition times of the individual collective motions (Fig. 1d, Supplementary Note 2 and Supplementary Fig. 3). Whereas individual motions may be intrinsically fast in isolation, their coupling to slower motions limits the respective overall transition rates. Accordingly, we used the slowest transition between each pair of states in Figure 1d to estimate the overall transition rates. For all transitions between states with the exception of post1-post2, the slow-est estimated rate is markedly slower than microseconds. This result agrees with rates determined by bulk kinetics30,31 and single-molecule studies32–34 for tRNA translocation (milliseconds) as well as with those for L1 stalk–tRNA interactions12 and intersubunit rotation29 (seconds). A cluster of high free-energy barriers (i.e., slow transition times) is found at the transition from pre to post states, thus support-ing the notion that the pre-to-post transition is the rate-limiting step of spontaneous translocation5,10. For the tRNA transitions, low transition barriers for tRNAVal within the pre and post states mostly correlate with high barriers for tRNAfMet and vice versa. Together with the fact that the movements of the two tRNAs are coupled by base-pairing to the mRNA (Supplementary Fig. 4), this finding implies that, although intrinsically rapid, the excursions of tRNAfMet between adjacent states (for example, pre5b and post2a) are governed by the slow movement of tRNAVal. Therefore, tRNA motion governs not only the overall rate
of translocation35 but also, to a large extent, the dynamics within the pre and post states. In contrast, intrinsic rates for L1-stalk dynamics were present in the submicrosecond range, except for the slower move-ment from pre to post and from pre2 to pre3. Notably, our simulations revealed a large number of alternative microsecond and submicrosec-ond transitions of the tRNAs and the L1 stalk (Fig. 1d).
RapidintersubunitrotationscoupletoslowtRNAmovementAll individual transition barriers for 30S motions turned out to be remarkably low, such that the intrinsic motions of the 30S subunit, despite its large size, take place in the submicrosecond range, similarly to the movements of the L1 stalk. The slowest 30S head transitions were found between states pre2 and pre3 as well as between pre5 and post1, consistent with barriers inferred from cryo-EM and biochemi-cal experiments5,10. The abundance of low barriers for motions of individual components seems to be a general feature of ribosome dynamics, and this underscores the important role of coupling between collective motions of both tRNAs and the ribosome3.
One example of such coupling is the stabilization of high inter-subunit rotation by tRNAs, which has been previously observed29. Our simulations showed that, in state pre5b, the large head tilting and body rotation (angles at ~20° and ~15°, Fig. 1e) are stabilized by strong interactions involving the tRNAs and a network of contacts between the two subunits, comprising L5 on the 50S subunit and S13 and S19 on the 30S subunit (Figs. 1c and 2b). In the classical state, these interactions form bridge B1b13 (sketched in Fig. 2a). Removal of the tRNAs in state pre5b should thus weaken these intersubunit interactions with respect to the pre1 state. As a consequence, the highly rotated states should also be destabilized, and a smaller population of large rotation angles should thus be observed. To test this hypothesis, we carried out additional MD simulations of ribosomes in the pre5b state from which the tRNAs were removed (Fig. 2b,c; rapid angular rearrangement described in Supplementary Note 3). These simulations indeed showed weakened interactions between the B1b residues (Fig. 2a,b) as well as decreased 30S body-rotation angles (Fig. 2c and Supplementary Fig. 5). Indeed, additional cryo-EM data of vacant ribosomes (Supplementary Note 1) revealed a markedly reduced population of high body- rotation angles (~50% for angles of 10° and above, Fig. 2d). Apparently, our structural models and simulations are sufficiently accurate to capture the underlying small energy differences. A similar effect
0.25
a
b
c
d
0.20
0.15
Fre
quen
cy (
1/°)
Fre
quen
cy (
1/(k
J/m
ol))
Fra
ctio
n of
par
ticle
s
0.10
0.05
0
0.25
0.20
0.15
0.10
0.05
0
0.25
0.30
0.20
0.15
0.10
0.05
0–5–300 –250 –200 –150 –100 –50 0 0 5
30S body rotation (°)
Pre5b with tRNAs
Pre1 to pre5Without tRNAs
Pre5b without tRNAs
Pre5b with tRNAs
Pre5b with tRNAs
tRNAVal No tRNA
L5 L550S 50S
S13 S13
30S 30S
B1b
Pre5b without tRNAs
Pre5b without tRNAs
Stronger binding
B1b (L5-S13, L5-S19)
Interaction enthalpy (kJ/mol)
Fitted pre5bstructure
10 15
Figure 2 Effect of the tRNAs on the large-angle 30S body rotations. (a) Schematic of the tRNA-L5-S13 interaction network. (b) Histogram of intersubunit interaction enthalpy for bridge B1b residues, calculated from simulations of the pre5b structural model with (blue) and without tRNA (green). (c) Histogram of respective rotation angles derived from MD simulations. The arrow marks the angle of the starting structure as reference. (d) Histogram of 30S body-rotation angles derived from cryo-EM analysis of ribosomes in the absence of tRNAs (green) compared to those of states pre1 to pre5 (cyan).
npg
© 2
013
Nat
ure
Am
eric
a, In
c. A
ll rig
hts
rese
rved
.
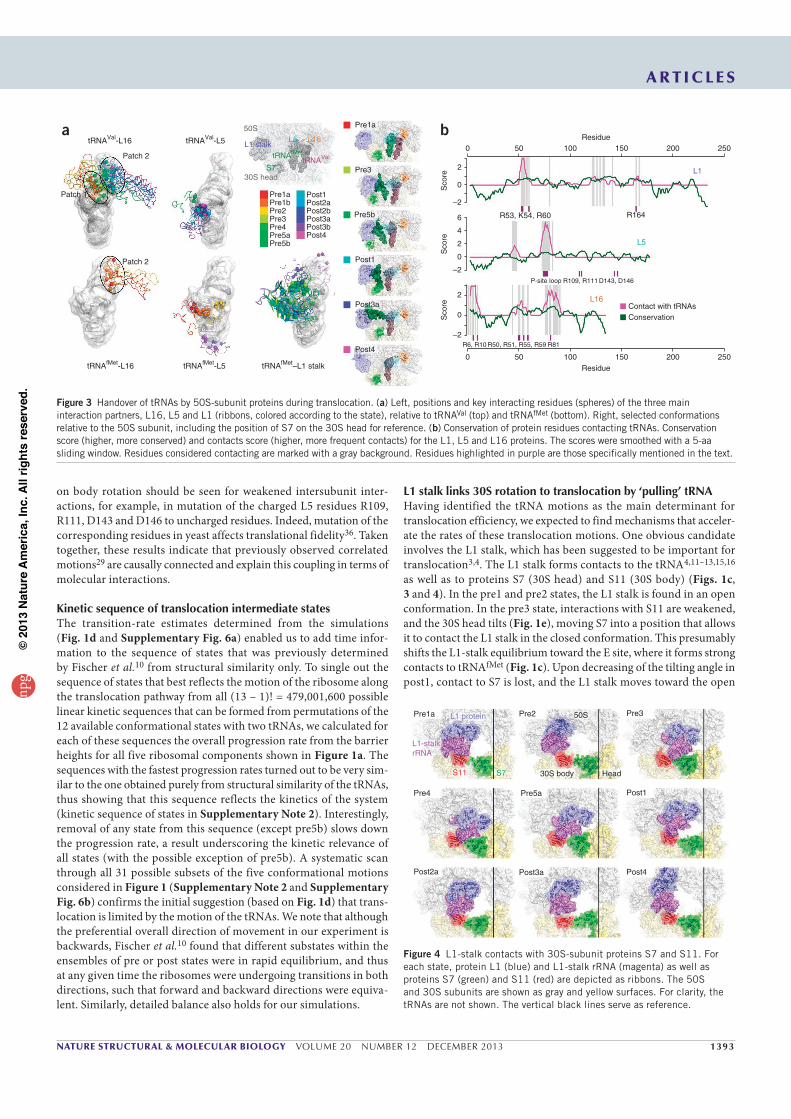
nature structural & molecular biology VOLUME 20 NUMBER 12 DECEMBER 2013 1393
a r t i c l e s
on body rotation should be seen for weakened intersubunit inter-actions, for example, in mutation of the charged L5 residues R109, R111, D143 and D146 to uncharged residues. Indeed, mutation of the corresponding residues in yeast affects translational fidelity36. Taken together, these results indicate that previously observed correlated motions29 are causally connected and explain this coupling in terms of molecular interactions.
KineticsequenceoftranslocationintermediatestatesThe transition-rate estimates determined from the simulations (Fig. 1d and Supplementary Fig. 6a) enabled us to add time infor-mation to the sequence of states that was previously determined by Fischer et al.10 from structural similarity only. To single out the sequence of states that best reflects the motion of the ribosome along the translocation pathway from all (13 – 1)! = 479,001,600 possible linear kinetic sequences that can be formed from permutations of the 12 available conformational states with two tRNAs, we calculated for each of these sequences the overall progression rate from the barrier heights for all five ribosomal components shown in Figure 1a. The sequences with the fastest progression rates turned out to be very sim-ilar to the one obtained purely from structural similarity of the tRNAs, thus showing that this sequence reflects the kinetics of the system (kinetic sequence of states in Supplementary Note 2). Interestingly, removal of any state from this sequence (except pre5b) slows down the progression rate, a result underscoring the kinetic relevance of all states (with the possible exception of pre5b). A systematic scan through all 31 possible subsets of the five conformational motions considered in Figure 1 (Supplementary Note 2 and Supplementary Fig. 6b) confirms the initial suggestion (based on Fig. 1d) that trans-location is limited by the motion of the tRNAs. We note that although the preferential overall direction of movement in our experiment is backwards, Fischer et al.10 found that different substates within the ensembles of pre or post states were in rapid equilibrium, and thus at any given time the ribosomes were undergoing transitions in both directions, such that forward and backward directions were equiva-lent. Similarly, detailed balance also holds for our simulations.
L1stalklinks30Srotationtotranslocationby‘pulling’tRNAHaving identified the tRNA motions as the main determinant for translocation efficiency, we expected to find mechanisms that acceler-ate the rates of these translocation motions. One obvious candidate involves the L1 stalk, which has been suggested to be important for translocation3,4. The L1 stalk forms contacts to the tRNA4,11–13,15,16 as well as to proteins S7 (30S head) and S11 (30S body) (Figs. 1c, 3 and 4). In the pre1 and pre2 states, the L1 stalk is found in an open conformation. In the pre3 state, interactions with S11 are weakened, and the 30S head tilts (Fig. 1e), moving S7 into a position that allows it to contact the L1 stalk in the closed conformation. This presumably shifts the L1-stalk equilibrium toward the E site, where it forms strong contacts to tRNAfMet (Fig. 1c). Upon decreasing of the tilting angle in post1, contact to S7 is lost, and the L1 stalk moves toward the open
tRNAVal-L16
tRNAfMet-L16 tRNAfMet-L5 tRNAfMet–L1 stalk
Patch 2
Patch 2
Pre1a
Pre1aPre1bPre2Pre3Pre4Pre5aPre5b
50S
30S head
L5 L16
tRNAValtRNAfMet
S7
L1 stalk
Pre3
Pre5b
Post1
Post1Post2aPost2b
Post3bPost4
Post3a
Post3a
Post4
Patch 1
tRNAVal-L5a b
Residue
Residue
0
2
50
R53, K54, R60
R109, R111 D143, D146
R6, R10 R50, R51, R55, R59 R81
P-site loop
R164
L5
L16
L1
Sco
reS
core
Sco
re
100 150 200 250
0 50 100 150 200
Contact with tRNAsConservation
250
0
–2
2
0
–2
2
4
6
0
–2
Figure 3 Handover of tRNAs by 50S-subunit proteins during translocation. (a) Left, positions and key interacting residues (spheres) of the three main interaction partners, L16, L5 and L1 (ribbons, colored according to the state), relative to tRNAVal (top) and tRNAfMet (bottom). Right, selected conformations relative to the 50S subunit, including the position of S7 on the 30S head for reference. (b) Conservation of protein residues contacting tRNAs. Conservation score (higher, more conserved) and contacts score (higher, more frequent contacts) for the L1, L5 and L16 proteins. The scores were smoothed with a 5-aa sliding window. Residues considered contacting are marked with a gray background. Residues highlighted in purple are those specifically mentioned in the text.
Pre1a Pre2 Pre3
Pre5a
30S body Head
50S
S11 S7
L1-stalkrRNA
L1 protein
Pre4 Post1
Post4Post3aPost2a
Figure 4 L1-stalk contacts with 30S-subunit proteins S7 and S11. For each state, protein L1 (blue) and L1-stalk rRNA (magenta) as well as proteins S7 (green) and S11 (red) are depicted as ribbons. The 50S and 30S subunits are shown as gray and yellow surfaces. For clarity, the tRNAs are not shown. The vertical black lines serve as reference.
npg
© 2
013
Nat
ure
Am
eric
a, In
c. A
ll rig
hts
rese
rved
.

1394 VOLUME 20 NUMBER 12 DECEMBER 2013 nature structural & molecular biology
a r t i c l e s
conformation, maintaining its contact to the tRNAfMet throughout the post states.
Because structural analyses alone do not provide evidence on whether the L1 stalk accelerates tRNA translocation, we needed to establish that the concerted motion is actually driven by the L1 stalk and not by the tRNA. We calculated the underlying molecular driv-ing forces from our equilibrium simulations of each state (interaction enthalpy) as well as from additional umbrella-sampling simulations (L1 stalk–tRNAfMet potential of mean force, Supplementary Note 2). The interaction enthalpy and binding free energy changed with the distance between the L1 stalk and tRNAfMet (Fig. 1f). The positive slopes imply that both the interaction enthalpy and free energy are attractive. These two independent data sets suggest that the L1 stalk actively pulls the tRNA after contact is established in the pre3 state, thereby accelerating tRNA barrier crossing. The opposite repulsive scenario, i.e., the tRNA pushing the L1 stalk, which would slow down barrier crossing, is incompatible with the observed free-energy curve. This result explains both the lower translation rates37 and the higher stability of the classical tRNA states14 observed for L1-depleted ribo-somes, and it links 30S body and head rotation through the L1 stalk to the motion of the tRNA. That the total interaction enthalpy (Fig. 1f) shows the same distance dependency as the binding free energy (albeit with larger values due to partial enthalpy-entropy compensation) suggests that the analysis of interaction enthalpies, to a good approxi-mation, can be used to reveal main interaction sites.
A closer analysis of the interaction enthalpies seen between L1 and the tRNA suggests residues R53, K54, R60 and R164 of L1, which are highly conserved (Fig. 3b), as the main interaction sites. L1 residues R53, R60 and R164 contacted residue Ψ55 of the tRNAfMet (Supplementary Table 3). Mutations of the Ψ55•G18 base pair are known to decrease translocation rates by 80-fold38, thus supporting the notion that attractive interactions with the L1 stalk actively decrease the barrier for tRNA translocation. A similar effect would be expected from a complementary mutation of the identified L1 residues.
L5andL16facilitatetRNAtranslocationDuring translocation, the two tRNAs are handed over from protein L16 to L5 and then to L1. We identified the strong tRNA interac-tions (identified by enthalpy contributions, Fig. 1c) with these large- subunit proteins and analyzed how the position, structure and contact sites of these proteins change from the perspective of the tRNAs in each state along the tRNA pathway from the A to the E site (Fig. 3a). Notably, more state-specific contacts to the tRNAs were generally seen for ribosomal proteins than for rRNA (Supplementary Note 3). Considerable motions of all involved components are observed; nevertheless, the tRNA remains tightly bound to these proteins, thus enabling accurate adjustment of the tRNA binding free energy. The continuous sequence of interactions might serve to lower free-energy barriers that otherwise would impede tRNA transloca-tion. Indeed, sequence analysis of proteins L1, L5 and L16 revealed significantly higher conservation of the residues identified by contact analysis (overall P value = 6.62 × 10⁻⁸ obtained from a one-sided permutation test in which the sample comprised n = 550 individual amino acids from the proteins), thus corroborating their functional relevance (Fig. 3b; conservation of contact residues described in Supplementary Note 2).
How are the large structural motions reconciled with the main-tained interactions between the tRNA and the ribosome along the translocation path? Closer inspection of interactions revealed two main mechanisms: stepping and sliding. During the A/A-to-P/P
transition, tRNAVal remained in contact with L16 (Figs. 3a and 5). We used two adjacent interaction patches on L16 (R50, R51, R55 and R59; R6, R10 and R81), each involving positively charged, highly conserved arginines (Fig. 3b) that interacted with different parts of the negatively charged tRNA backbone. Upon hybrid-state forma-tion (pre4 to pre5)—when the acceptor stem of tRNAVal moved into the P site of the 50S subunit while the L16 conformation remained unchanged—the contact region on tRNAVal switched from the first to the second patch. We observed similar interactions with the second patch on L16 for the tRNAfMet in its P/P configuration, suggesting that these contacts can stabilize any tRNA in the P site. During the tRNA handover from L16 to L5, the binding of tRNAVal to L16 became weaker (Fig. 1c), whereas the binding to L5 remained strong in pre5b and throughout the post states. Strong contacts between the tRNAVal C56 and the highly conserved P-site loop of L5 (ref. 39) (A74–I78, Fig. 3b) were also present in the pre5b state. This finding, together with the large intersubunit rotation angle in the pre5b state, suggests that the tRNA movement is coupled to the intersubunit rotation through L5. In the subsequent post states, the contacts of the L5 P-site loop shifted down the D loop of the tRNAVal (Fig. 3a), additionally involving nucleotide G19.
In contrast to interactions involved in the stepping motion of the rather rigid protein L16, interactions between tRNAfMet and L5 (Fig. 3a) were much less localized and were more dynamic. In the pre1 and pre2 states, tRNAfMet-L5 contacts shifted from the D loop to the T loop of the tRNA. Upon handover to the L1 stalk in the pre3 state, these contacts to L5 were lost, but new contacts between L5 and the anticodon stem-loop were formed just before the tRNA left the ribosome (in post4). Here, the P-site loop of L5 slides smoothly over the tRNA, thereby flexibly adapting to the changing tRNA position and orientation. Mutations of the P-site loop of L5 in yeast ribosomes impair tRNA binding39, underscoring the importance of L5 as a guide for the movement of the P-site tRNA. The L1 stalk pro-vides the final contact for tRNAfMet after being handed over from L5 and L16. Interactions of L1 with tRNAfMet, involving the tRNA back-bone and the highly conserved, positively charged L1 residues (R53, K54, R60 and R164), were established in the pre3 state and remained unchanged from pre3 to post2.
DISCUSSIONEach of the three different mechanisms facilitating tRNA transloca-tion (summarized in Fig. 5) rests on mutual couplings between the tRNAs and parts of their binding region. First, the precise positioning
a b cStepping Sliding Pulling90°
50S
30S
L162 1
E P A E P PA E P A
Pre4-pre5 Pre1-pre2 Pre3-post3
L5
L1L5
S7
F
Figure 5 Three mechanisms facilitating tRNA translocation. (a) Two distinct contact patches of L16 stabilize A- and P-site positioning of the tRNA (here tRNAVal, purple) on the 50S subunit. Moving from A to P site, the tRNA steps from patch 1 to patch 2. (b) As the tRNA moves into the hybrid P/E conformation (here tRNAfMet, green), the P loop of L5 maintains a flexible contact (magenta) by sliding along the tRNA (green). (c) In pre3, high intersubunit rotations stabilize the closed L1-stalk conformation through S7. After back rotation (post1), this interaction is lost, and the L1 stalk moves into the open conformation, thereby pulling the tRNA into the E site.
npg
© 2
013
Nat
ure
Am
eric
a, In
c. A
ll rig
hts
rese
rved
.

nature structural & molecular biology VOLUME 20 NUMBER 12 DECEMBER 2013 1395
a r t i c l e s
of the tRNAs in A and P sites is achieved by interactions with L16. To accommodate tRNA motions, L16 ‘steps’ through discontinu-ous contact patches. Second, the flexible P-site loop of L5 facilitates seamless tRNA sliding across the P site. Third, L1 exerts force to pull the tRNA out of the P site and hence requires internal rigid-ity. From real-time single-molecule fluorescence resonance energy transfer experiments, the L1 stalk is known to remain associated with the tRNA throughout translocation12. Our analysis suggests that L1 forms only one stable, highly conserved contact patch with the tRNA and moves with it as a rather rigid body. The L1 stalk trans-mits the intersubunit rotation through S7–L1 stalk interactions and promotes tRNA translocation by reducing free-energy barriers between adjacent binding sites. The abundance of interactions between charged, highly conserved residues of ribosomal proteins and the tRNA backbone may provide a general means for the trans-port of different tRNA species, independently of their sequence, through the ribosome.
Although translocation is a function inherent to the ribosome itself7,8, the movement, particularly on the 30S subunit, is dra-matically facilitated by EF-G. Although the full description of EF-G–dependent translocation is currently not feasible, owing to the lack of structural information, the present work provides insights into the reaction landscape underlying the movement. The simulations provide a view of the energy ‘valley’ of spontaneous translocation, which allows the tRNAs to move by large distances while maintaining sufficient binding with the ribosome components. Gross deviations from this overall pathway would require a very large energy input and thus seem unlikely even in the presence of EF-G. Rather, EF-G might use the energy of binding and GTP hydro-lysis to flatten the energy barriers of the rate-limiting step(s) and to provide the directional bias for forward movement. Understanding the way by which EF-G remodels the free-energy landscape into efficient tRNA translocation is one of the most important future challenges in the field.
Our combined crystallography–cryo-EM–simulation approach reveals fast, large-scale motions of the ribosome, on microsecond time scales, that govern tRNA translocation. Where the small over-lap between the fast time scales accessible here and the slower ones observable by bulk kinetics30,31 and single-molecule studies12,29,32–34 allows a direct comparison, the obtained transition rates agree within the respective error bounds. Our approach quantifies, from first prin-ciples, the picture of a stochastic molecular machine10,30,33, which fluctuates12,14,15,29,35 between nearly isoenergetic Frauenfelder-type conformational states through collective and coupled structural tran-sitions40 (Supplementary Video 3). Of all the movements described above, the highest intrinsic barriers are found for tRNA movement throughout the whole translocation pathway. This finding suggests a possible explanation for the strong effect of different tRNA species5,6 on the rate of spontaneous translocation. Our picture shows how the 30S head and body rotations, through coordinated L1-stalk, S7 and S11 motions, promote and control tRNA translocation. This complements structural1,3,4,10,11,13,18,26,28,36,39,41–43 and single-molecule data12,14,15 with intrinsic transition rates of functionally relevant and coupled motions, interaction energies and the underlying molecular driving forces. We begin to uncover the ‘gears and wheels’ of tRNA trans-location through the ribosome from first principles, in terms of a stochastic molecular machine.
METHODSMethods and any associated references are available in the online version of the paper.
Accession codes. Three-dimensional density maps have been deposited at the Electron Microscopy Data Bank, under accession codes EMD-2472 (pre1b), EMD-2473 (pre5a), EMD-2474 (post2b), EMD-2475 (post3a). The atomic coordinates have been deposited at the Protein Data Bank under accession codes 3J4V, 3J52 (pre1a); 3J4W, 3J4X (pre1b); 3J4Z, 3J50 (pre2); 3J4Y, 3J51 (pre3); 3J53, 3J54 (pre4); 3J55, 3J56 (pre5a); 3J57, 3J58 (pre5b); 3J59, 3J5A (post1); 3J5B, 3J5C (post2a); 3J5D, 3J5E (post2b); 3J5F, 3J5G (post3a); 3J5H, 3J5I (post3b); and 3J5J, 3J5K (post4). Details can be found in Supplementary Table 4.
Note: Any Supplementary Information and Source Data files are available in the online version of the paper.
ACkNowLeDGMeNtSWe thank B. de Groot, U. Zachariae, C. Kutzner, R. Jahn, G. Hummer, B. Roux, W. Wintermeyer and C. Rotte for discussions and critical reading of the manuscript. M.V.R. and H.S. acknowledge financial support of the Deutsche Forschungsgemeinschaft (DFG) (Sonderforschungsbereich grant 860 and DFG-Forschergruppe 1805). Financial support for L.V.B., C.B., A.C.V. and H.G. comes from the Max Planck Society, International Max Planck Research School for Physics of Biological and Complex Systems and DFG-Forschergruppe 1805. We thank the computer center Garching (RZG) and the Gesellschaft fuer wissenschaftliche Datenverarbeitung Goettingen (GWDG) for technical assistance; computer time has been provided by the RZG.
AUtHoR CoNtRIBUtIoNSL.V.B. and A.C.V. prepared the ribosome model; G.F.S. refined the model against the cryo-EM maps; L.V.B. performed the molecular dynamics simulations; L.V.B. and C.B. analyzed the data with mentoring by A.C.V. and H.G.; C.B., L.V.B., A.C.V. and H.G. developed and implemented analysis methods for rate estimation; I.I.D. carried out the sequence-conservation analysis; N.F. performed the cryo- EM experiments and analysis; H.S., H.G. and M.V.R. conceived of the project. All authors discussed the results and wrote the manuscript.
CoMPetING FINANCIAL INteReStSThe authors declare no competing financial interests.
Reprints and permissions information is available online at http://www.nature.com/reprints/index.html.
1. Moazed, D. & Noller, H.F. Intermediate states in the movement of transfer RNA in the ribosome. Nature 342, 142–148 (1989).
2. Frank, J. & Agrawal, R.K. A ratchet-like inter-subunit reorganization of the ribosome during translocation. Nature 406, 318–322 (2000).
3. Tama, F., Valle, M., Frank, J. & Brooks, C.L. Dynamic reorganization of the functionally active ribosome explored by normal mode analysis and cryo-electron microscopy. Proc. Natl. Acad. Sci. USA 100, 9319–9323 (2003).
4. Valle, M. et al. Locking and unlocking of ribosomal motions. Cell 114, 123–134 (2003).
5. Konevega, A.L. et al. Spontaneous reverse movement of mRNA-bound tRNA through the ribosome. Nat. Struct. Mol. Biol. 14, 318–324 (2007).
6. Shoji, S., Walker, S.E. & Fredrick, K. Reverse translocation of tRNA in the ribosome. Mol. Cell 24, 931–942 (2006).
7. Spirin, A.S. Energetics of the ribosome. Prog. Nucleic Acid Res. Mol. Biol. 21, 39–62 (1978).
8. Noller, H.F., Yusupov, M.M., Yusupova, G.Z., Baucom, A. & Cate, J.H. Translocation of tRNA during protein synthesis. FEBS Lett. 514, 11–16 (2002).
9. Liu, Q. & Fredrick, K. Contribution of intersubunit bridges to the energy barrier of ribosomal translocation. Nucleic Acids Res. 41, 565–574 (2013).
10. Fischer, N., Konevega, A.L., Wintermeyer, W., Rodnina, M.V. & Stark, H. Ribosome dynamics and tRNA movement by time-resolved electron cryomicroscopy. Nature 466, 329–333 (2010).
11. Agirrezabala, X. et al. Visualization of the hybrid state of tRNA binding promoted by spontaneous ratcheting of the ribosome. Mol. Cell 32, 190–197 (2008).
12. Fei, J., Kosuri, P., MacDougall, D. & Gonzalez, R. Coupling of ribosomal L1 stalk and tRNA dynamics during translation elongation. Mol. Cell 30, 348–359 (2008).
13. Julián, P. et al. Structure of ratcheted ribosomes with tRNAs in hybrid states. Proc. Natl. Acad. Sci. USA 105, 16924–16927 (2008).
14. Munro, J.B., Altman, R.B., O’Connor, N. & Blanchard, S.C. Identification of two distinct hybrid state intermediates on the ribosome. Mol. Cell 25, 505–517 (2007).
npg
© 2
013
Nat
ure
Am
eric
a, In
c. A
ll rig
hts
rese
rved
.
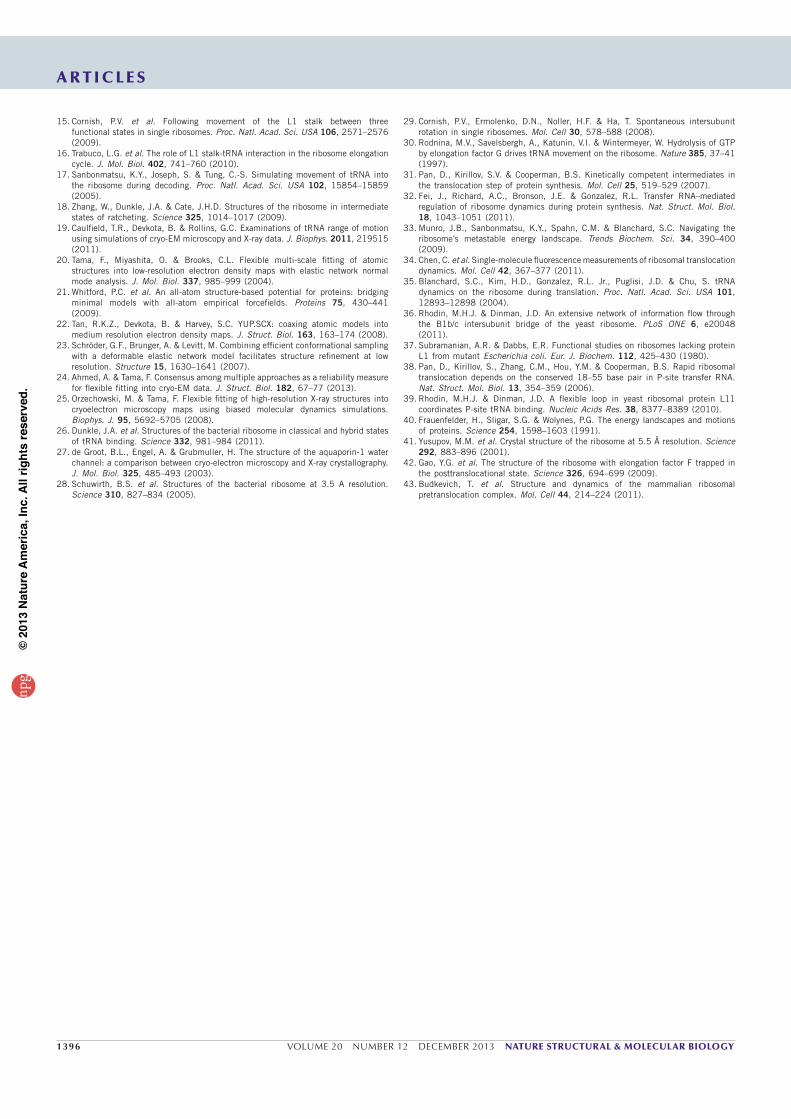
1396 VOLUME 20 NUMBER 12 DECEMBER 2013 nature structural & molecular biology
a r t i c l e s
15. Cornish, P.V. et al. Following movement of the L1 stalk between three functional states in single ribosomes. Proc. Natl. Acad. Sci. USA 106, 2571–2576 (2009).
16. Trabuco, L.G. et al. The role of L1 stalk-tRNA interaction in the ribosome elongation cycle. J. Mol. Biol. 402, 741–760 (2010).
17. Sanbonmatsu, K.Y., Joseph, S. & Tung, C.-S. Simulating movement of tRNA into the ribosome during decoding. Proc. Natl. Acad. Sci. USA 102, 15854–15859 (2005).
18. Zhang, W., Dunkle, J.A. & Cate, J.H.D. Structures of the ribosome in intermediate states of ratcheting. Science 325, 1014–1017 (2009).
19. Caulfield, T.R., Devkota, B. & Rollins, G.C. Examinations of tRNA range of motion using simulations of cryo-EM microscopy and X-ray data. J. Biophys. 2011, 219515 (2011).
20. Tama, F., Miyashita, O. & Brooks, C.L. Flexible multi-scale fitting of atomic structures into low-resolution electron density maps with elastic network normal mode analysis. J. Mol. Biol. 337, 985–999 (2004).
21. Whitford, P.C. et al. An all-atom structure-based potential for proteins: bridging minimal models with all-atom empirical forcefields. Proteins 75, 430–441 (2009).
22. Tan, R.K.Z., Devkota, B. & Harvey, S.C. YUP.SCX: coaxing atomic models into medium resolution electron density maps. J. Struct. Biol. 163, 163–174 (2008).
23. Schröder, G.F., Brunger, A. & Levitt, M. Combining efficient conformational sampling with a deformable elastic network model facilitates structure refinement at low resolution. Structure 15, 1630–1641 (2007).
24. Ahmed, A. & Tama, F. Consensus among multiple approaches as a reliability measure for flexible fitting into cryo-EM data. J. Struct. Biol. 182, 67–77 (2013).
25. Orzechowski, M. & Tama, F. Flexible fitting of high-resolution X-ray structures into cryoelectron microscopy maps using biased molecular dynamics simulations. Biophys. J. 95, 5692–5705 (2008).
26. Dunkle, J.A. et al. Structures of the bacterial ribosome in classical and hybrid states of tRNA binding. Science 332, 981–984 (2011).
27. de Groot, B.L., Engel, A. & Grubmuller, H. The structure of the aquaporin-1 water channel: a comparison between cryo-electron microscopy and X-ray crystallography. J. Mol. Biol. 325, 485–493 (2003).
28. Schuwirth, B.S. et al. Structures of the bacterial ribosome at 3.5 A resolution. Science 310, 827–834 (2005).
29. Cornish, P.V., Ermolenko, D.N., Noller, H.F. & Ha, T. Spontaneous intersubunit rotation in single ribosomes. Mol. Cell 30, 578–588 (2008).
30. Rodnina, M.V., Savelsbergh, A., Katunin, V.I. & Wintermeyer, W. Hydrolysis of GTP by elongation factor G drives tRNA movement on the ribosome. Nature 385, 37–41 (1997).
31. Pan, D., Kirillov, S.V. & Cooperman, B.S. Kinetically competent intermediates in the translocation step of protein synthesis. Mol. Cell 25, 519–529 (2007).
32. Fei, J., Richard, A.C., Bronson, J.E. & Gonzalez, R.L. Transfer RNA–mediated regulation of ribosome dynamics during protein synthesis. Nat. Struct. Mol. Biol. 18, 1043–1051 (2011).
33. Munro, J.B., Sanbonmatsu, K.Y., Spahn, C.M. & Blanchard, S.C. Navigating the ribosome’s metastable energy landscape. Trends Biochem. Sci. 34, 390–400 (2009).
34. Chen, C. et al. Single-molecule fluorescence measurements of ribosomal translocation dynamics. Mol. Cell 42, 367–377 (2011).
35. Blanchard, S.C., Kim, H.D., Gonzalez, R.L. Jr., Puglisi, J.D. & Chu, S. tRNA dynamics on the ribosome during translation. Proc. Natl. Acad. Sci. USA 101, 12893–12898 (2004).
36. Rhodin, M.H.J. & Dinman, J.D. An extensive network of information flow through the B1b/c intersubunit bridge of the yeast ribosome. PLoS ONE 6, e20048 (2011).
37. Subramanian, A.R. & Dabbs, E.R. Functional studies on ribosomes lacking protein L1 from mutant Escherichia coli. Eur. J. Biochem. 112, 425–430 (1980).
38. Pan, D., Kirillov, S., Zhang, C.M., Hou, Y.M. & Cooperman, B.S. Rapid ribosomal translocation depends on the conserved 18–55 base pair in P-site transfer RNA. Nat. Struct. Mol. Biol. 13, 354–359 (2006).
39. Rhodin, M.H.J. & Dinman, J.D. A flexible loop in yeast ribosomal protein L11 coordinates P-site tRNA binding. Nucleic Acids Res. 38, 8377–8389 (2010).
40. Frauenfelder, H., Sligar, S.G. & Wolynes, P.G. The energy landscapes and motions of proteins. Science 254, 1598–1603 (1991).
41. Yusupov, M.M. et al. Crystal structure of the ribosome at 5.5 Å resolution. Science 292, 883–896 (2001).
42. Gao, Y.G. et al. The structure of the ribosome with elongation factor F trapped in the posttranslocational state. Science 326, 694–699 (2009).
43. Budkevich, T. et al. Structure and dynamics of the mammalian ribosomal pretranslocation complex. Mol. Cell 44, 214–224 (2011).
npg
© 2
013
Nat
ure
Am
eric
a, In
c. A
ll rig
hts
rese
rved
.
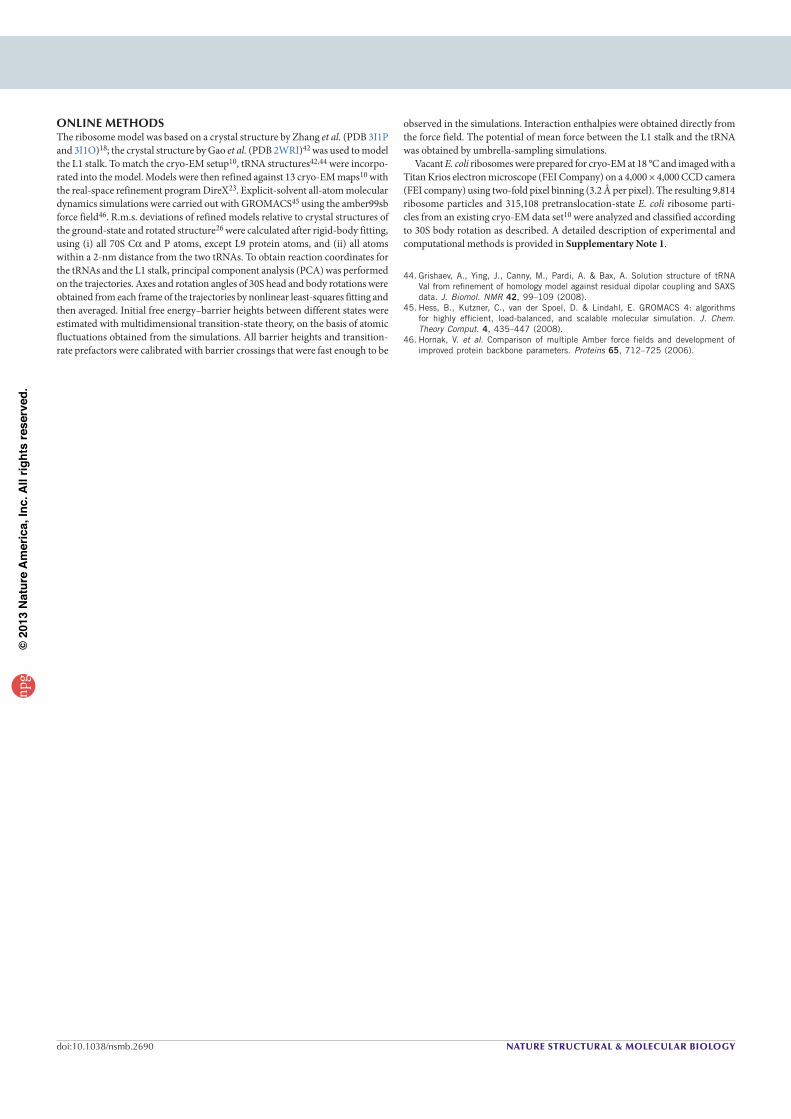
nature structural & molecular biologydoi:10.1038/nsmb.2690
ONLINEMETHODSThe ribosome model was based on a crystal structure by Zhang et al. (PDB 3I1P and 3I1O)18; the crystal structure by Gao et al. (PDB 2WRI)42 was used to model the L1 stalk. To match the cryo-EM setup10, tRNA structures42,44 were incorpo-rated into the model. Models were then refined against 13 cryo-EM maps10 with the real-space refinement program DireX23. Explicit-solvent all-atom molecular dynamics simulations were carried out with GROMACS45 using the amber99sb force field46. R.m.s. deviations of refined models relative to crystal structures of the ground-state and rotated structure26 were calculated after rigid-body fitting, using (i) all 70S Cα and P atoms, except L9 protein atoms, and (ii) all atoms within a 2-nm distance from the two tRNAs. To obtain reaction coordinates for the tRNAs and the L1 stalk, principal component analysis (PCA) was performed on the trajectories. Axes and rotation angles of 30S head and body rotations were obtained from each frame of the trajectories by nonlinear least-squares fitting and then averaged. Initial free energy–barrier heights between different states were estimated with multidimensional transition-state theory, on the basis of atomic fluctuations obtained from the simulations. All barrier heights and transition-rate prefactors were calibrated with barrier crossings that were fast enough to be
observed in the simulations. Interaction enthalpies were obtained directly from the force field. The potential of mean force between the L1 stalk and the tRNA was obtained by umbrella-sampling simulations.
Vacant E. coli ribosomes were prepared for cryo-EM at 18 °C and imaged with a Titan Krios electron microscope (FEI Company) on a 4,000 × 4,000 CCD camera (FEI company) using two-fold pixel binning (3.2 Å per pixel). The resulting 9,814 ribosome particles and 315,108 pretranslocation-state E. coli ribosome parti-cles from an existing cryo-EM data set10 were analyzed and classified according to 30S body rotation as described. A detailed description of experimental and computational methods is provided in Supplementary Note 1.
44. Grishaev, A., Ying, J., Canny, M., Pardi, A. & Bax, A. Solution structure of tRNA Val from refinement of homology model against residual dipolar coupling and SAXS data. J. Biomol. NMR 42, 99–109 (2008).
45. Hess, B., Kutzner, C., van der Spoel, D. & Lindahl, E. GROMACS 4: algorithms for highly efficient, load-balanced, and scalable molecular simulation. J. Chem. Theory Comput. 4, 435–447 (2008).
46. Hornak, V. et al. Comparison of multiple Amber force fields and development of improved protein backbone parameters. Proteins 65, 712–725 (2006).
npg
© 2
013
Nat
ure
Am
eric
a, In
c. A
ll rig
hts
rese
rved
.

Supplementary Information
Energy barriers and driving forces of tRNAtranslocation through the ribosome
Lars V. Bock, Christian Blau1, Gunnar F. Schröder, Iakov I. Davydov, Niels Fischer,Holger Stark, Marina V. Rodnina, Andrea C. Vaiana, Helmut Grubmüller
Contents
Supplementary Figures 2
Supplementary Tables 2
Supplementary Note 1 (Methods) 111.1 General molecular dynamics setup . . . . . . . . . . . . . . . . . . . . . . . . . . . . . . . . . . . . 111.2 Models of the ribosome including tRNAs . . . . . . . . . . . . . . . . . . . . . . . . . . . . . . . . 111.3 Refinement of the atomic models against cryo-EM maps* . . . . . . . . . . . . . . . . . . . . . . . 131.4 Choice of models for simulation . . . . . . . . . . . . . . . . . . . . . . . . . . . . . . . . . . . . . 141.5 MD simulations of the refined models . . . . . . . . . . . . . . . . . . . . . . . . . . . . . . . . . . 141.6 Cryo-EM analysis of global ribosome conformation . . . . . . . . . . . . . . . . . . . . . . . . . . 15
Supplementary Note 2 (Analysis) 152.1 Comparison to recent crystal structures* . . . . . . . . . . . . . . . . . . . . . . . . . . . . . . . . 152.2 Independent MD based refinement . . . . . . . . . . . . . . . . . . . . . . . . . . . . . . . . . . . . 152.3 Definition of reaction coordinates for collective motions* . . . . . . . . . . . . . . . . . . . . . . . 162.4 Transition rate estimates** . . . . . . . . . . . . . . . . . . . . . . . . . . . . . . . . . . . . . . . . . 162.5 tRNA contacts with the ribosome and mRNA* . . . . . . . . . . . . . . . . . . . . . . . . . . . . . 182.6 Conservation of contact residues in L1, L5, and L16* . . . . . . . . . . . . . . . . . . . . . . . . . 192.7 L1-stalk interaction with the 30S subunit . . . . . . . . . . . . . . . . . . . . . . . . . . . . . . . . 192.8 L1-tRNAfMet potential of mean force . . . . . . . . . . . . . . . . . . . . . . . . . . . . . . . . . . . 192.9 Bridge B1b interaction enthalpy* . . . . . . . . . . . . . . . . . . . . . . . . . . . . . . . . . . . . . 202.10 Kinetic sequence of states** . . . . . . . . . . . . . . . . . . . . . . . . . . . . . . . . . . . . . . . . 202.11 Kinetic sequence of states for subsets of ribosome component movements** . . . . . . . . . . . . 21
1parts where I made a substantial contribution are marked *, parts where I predominantly contributed are marked **
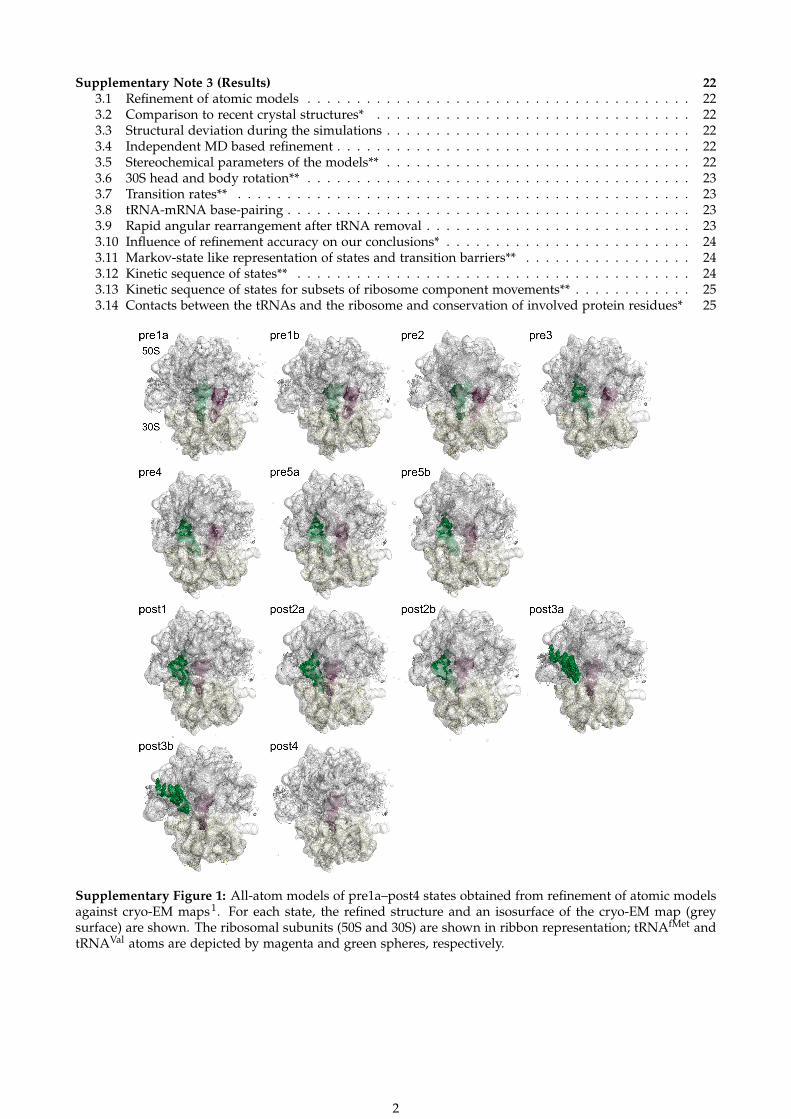
Supplementary Note 3 (Results) 223.1 Refinement of atomic models . . . . . . . . . . . . . . . . . . . . . . . . . . . . . . . . . . . . . . . 223.2 Comparison to recent crystal structures* . . . . . . . . . . . . . . . . . . . . . . . . . . . . . . . . 223.3 Structural deviation during the simulations . . . . . . . . . . . . . . . . . . . . . . . . . . . . . . . 223.4 Independent MD based refinement . . . . . . . . . . . . . . . . . . . . . . . . . . . . . . . . . . . . 223.5 Stereochemical parameters of the models** . . . . . . . . . . . . . . . . . . . . . . . . . . . . . . . 223.6 30S head and body rotation** . . . . . . . . . . . . . . . . . . . . . . . . . . . . . . . . . . . . . . . 233.7 Transition rates** . . . . . . . . . . . . . . . . . . . . . . . . . . . . . . . . . . . . . . . . . . . . . . 233.8 tRNA-mRNA base-pairing . . . . . . . . . . . . . . . . . . . . . . . . . . . . . . . . . . . . . . . . . 233.9 Rapid angular rearrangement after tRNA removal . . . . . . . . . . . . . . . . . . . . . . . . . . . 233.10 Influence of refinement accuracy on our conclusions* . . . . . . . . . . . . . . . . . . . . . . . . . 243.11 Markov-state like representation of states and transition barriers** . . . . . . . . . . . . . . . . . 243.12 Kinetic sequence of states** . . . . . . . . . . . . . . . . . . . . . . . . . . . . . . . . . . . . . . . . 243.13 Kinetic sequence of states for subsets of ribosome component movements** . . . . . . . . . . . . 253.14 Contacts between the tRNAs and the ribosome and conservation of involved protein residues* 25
Supplementary Figure 1: All-atom models of pre1a–post4 states obtained from refinement of atomic modelsagainst cryo-EM maps1. For each state, the refined structure and an isosurface of the cryo-EM map (greysurface) are shown. The ribosomal subunits (50S and 30S) are shown in ribbon representation; tRNAfMet andtRNAVal atoms are depicted by magenta and green spheres, respectively.
2
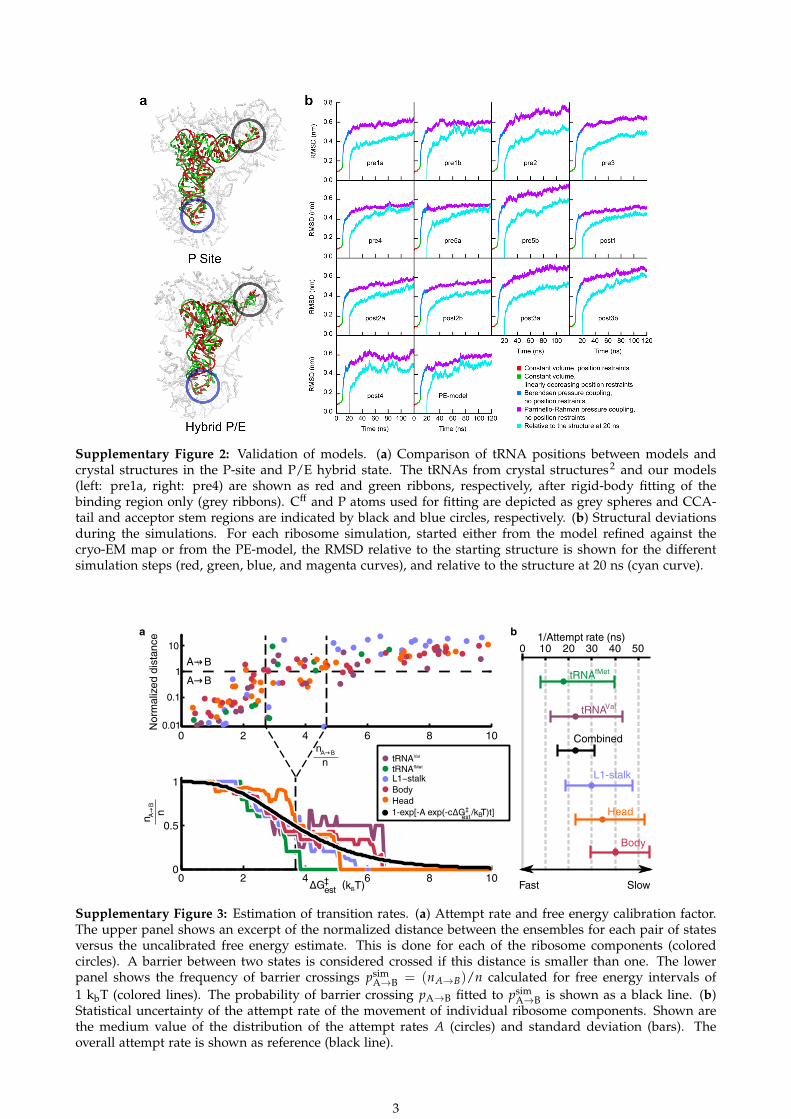
Supplementary Figure 2: Validation of models. (a) Comparison of tRNA positions between models andcrystal structures in the P-site and P/E hybrid state. The tRNAs from crystal structures2 and our models(left: pre1a, right: pre4) are shown as red and green ribbons, respectively, after rigid-body fitting of thebinding region only (grey ribbons). Cff and P atoms used for fitting are depicted as grey spheres and CCA-tail and acceptor stem regions are indicated by black and blue circles, respectively. (b) Structural deviationsduring the simulations. For each ribosome simulation, started either from the model refined against thecryo-EM map or from the PE-model, the RMSD relative to the starting structure is shown for the differentsimulation steps (red, green, blue, and magenta curves), and relative to the structure at 20 ns (cyan curve).
Supplementary Figure 3: Estimation of transition rates. (a) Attempt rate and free energy calibration factor.The upper panel shows an excerpt of the normalized distance between the ensembles for each pair of statesversus the uncalibrated free energy estimate. This is done for each of the ribosome components (coloredcircles). A barrier between two states is considered crossed if this distance is smaller than one. The lowerpanel shows the frequency of barrier crossings psim
A→B = (nA→B)/n calculated for free energy intervals of1 kbT (colored lines). The probability of barrier crossing pA→B fitted to psim
A→B is shown as a black line. (b)Statistical uncertainty of the attempt rate of the movement of individual ribosome components. Shown arethe medium value of the distribution of the attempt rates A (circles) and standard deviation (bars). Theoverall attempt rate is shown as reference (black line).
3

Supplementary Figure 4: Quality of tRNA-mRNA base-paring. For each state, histograms of the distancesbetween codon residues of the mRNA and the corresponding anticodon residues of the two tRNAs are shown.
Supplementary Figure 5: Fast relaxation motions of the ribosome after tRNA removal during the simulations.Shown are time-traces of 30S head tilting, head swiveling, and body rotation angles (left panel), as well as ofinteraction enthalpies (right panel) for intersubunit bridge B1b, derived from four independent simulations.Blue curves refer to the two simulations started from the refined structure of the pre5b state with boundtRNAs, the green ones refer to simulations started from the same structure after removal of the tRNAs.
4
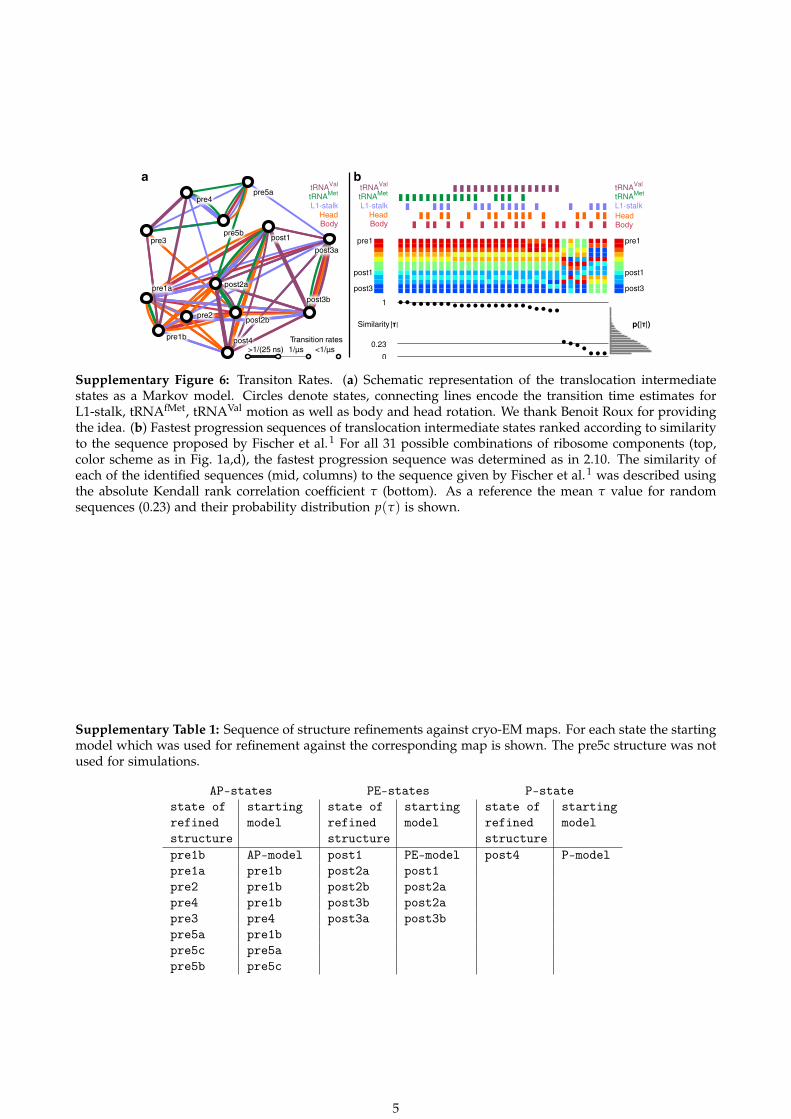
Supplementary Figure 6: Transiton Rates. (a) Schematic representation of the translocation intermediatestates as a Markov model. Circles denote states, connecting lines encode the transition time estimates forL1-stalk, tRNAfMet, tRNAVal motion as well as body and head rotation. We thank Benoit Roux for providingthe idea. (b) Fastest progression sequences of translocation intermediate states ranked according to similarityto the sequence proposed by Fischer et al.1 For all 31 possible combinations of ribosome components (top,color scheme as in Fig. 1a,d), the fastest progression sequence was determined as in 2.10. The similarity ofeach of the identified sequences (mid, columns) to the sequence given by Fischer et al.1 was described usingthe absolute Kendall rank correlation coefficient τ (bottom). As a reference the mean τ value for randomsequences (0.23) and their probability distribution p(τ) is shown.
Supplementary Table 1: Sequence of structure refinements against cryo-EM maps. For each state the startingmodel which was used for refinement against the corresponding map is shown. The pre5c structure was notused for simulations.
AP-states PE-states P-statestate ofrefinedstructure
startingmodel
state ofrefinedstructure
startingmodel
state ofrefinedstructure
startingmodel
pre1b AP-model post1 PE-model post4 P-modelpre1a pre1b post2a post1pre2 pre1b post2b post2apre4 pre1b post3b post2apre3 pre4 post3a post3bpre5a pre1bpre5c pre5apre5b pre5c
5

Supplementary Table 2: Stereochemical parameters of our models compared to those of crystal structures.Shown are deviation of the distributions of key stereochemical parameters from distributions found in theprotein data bank (PDB) for the 50S and 30S subunits. The upper part of each table shows deviations fromthe mean values in standard deviations σ. The relative width of the distribution compared to the standarddistribution is shown in the lower part.
(a) 30S
Models(pre1a–post4) Dunkle et al.2 Zhang et al.3
PDB id 100ns refined 3R8N 3R8O 3I1Q 3I1ZRamachandran -3.12 -7.62 -7.44 -7.52 -6.73 -6.96χ1-χ2-rotamers -2.04 -5.97 -6.97 -7.10 -6.26 -6.25Backbone -2.23 -4.66 -3.27 -3.47 -2.41 -2.39Bond length 1.40 1.57 0.85 0.85 0.59 0.57Bond angles 1.91 2.24 1.20 1.22 1.20 1.15Omega angles 1.15 2.17 1.62 1.66 0.93 0.87Side chain planarity 0.96 2.30 0.39 0.38 0.23 0.21Improper dihedrals 1.04 1.90 0.75 0.72 0.53 0.46Inside-Outside dist. 0.99 1.03 1.01 1.02 1.02 1.03
(b) 50S
Models(pre1a–post4) Dunkle et al.2 Zhang et al.3
PDB id 100ns refined 3R8S 3R8T 3I1R 3I20Ramachandran -3.05 -7.67 -5.75 -6.52 -6.01 -7.15χ1-χ2-rotamers -2.00 -5.95 -5.89 -6.23 -6.05 -5.78Backbone -1.98 -5.13 -1.92 -2.04 -2.78 -3.64Bond length 1.33 1.48 1.49 1.04 0.77 0.61Bond angles 1.98 2.34 1.53 1.38 1.40 1.21Omega angles 1.14 2.22 1.52 1.47 1.20 0.87Side chain planarity 1.00 2.32 0.50 0.41 0.31 0.20Improper dihedrals 1.05 1.95 0.92 0.79 0.72 0.44Inside-Outside dist. 0.99 1.02 0.99 0.99 1.00 1.03
Supplementary Table 3: Accession codes for models of spontaneous tRNA translocation. Shown are the EM-DataBank accession codes for the cryo-EM densities used for refinement and the resolution of the respectivecryo-EM maps. PDB-id codes are given for the 30S and 50S ribosomal subunit.
state EMDB id resolution [Å] PDB id 30S PDB id 50Spre1a 1716 12 3J4V 3J52pre1b 2472 12 3J4W 3J4Xpre2 1717 20 3J4Z 3J50pre3 1718 17 3J4Y 3J51pre4 1719 13 3J53 3J54pre5a 2473 15 3J55 3J56pre5b 1720 17 3J57 3J58post1 1721 12 3J59 3J5Apost2a 1722 17 3J5B 3J5Cpost2b 2474 17 3J5D 3J5Epost3a 2475 20 3J5F 3J5Gpost3b 1723 15 3J5H 3J5Jpost4 1724 9 3J5J 3J5K
6
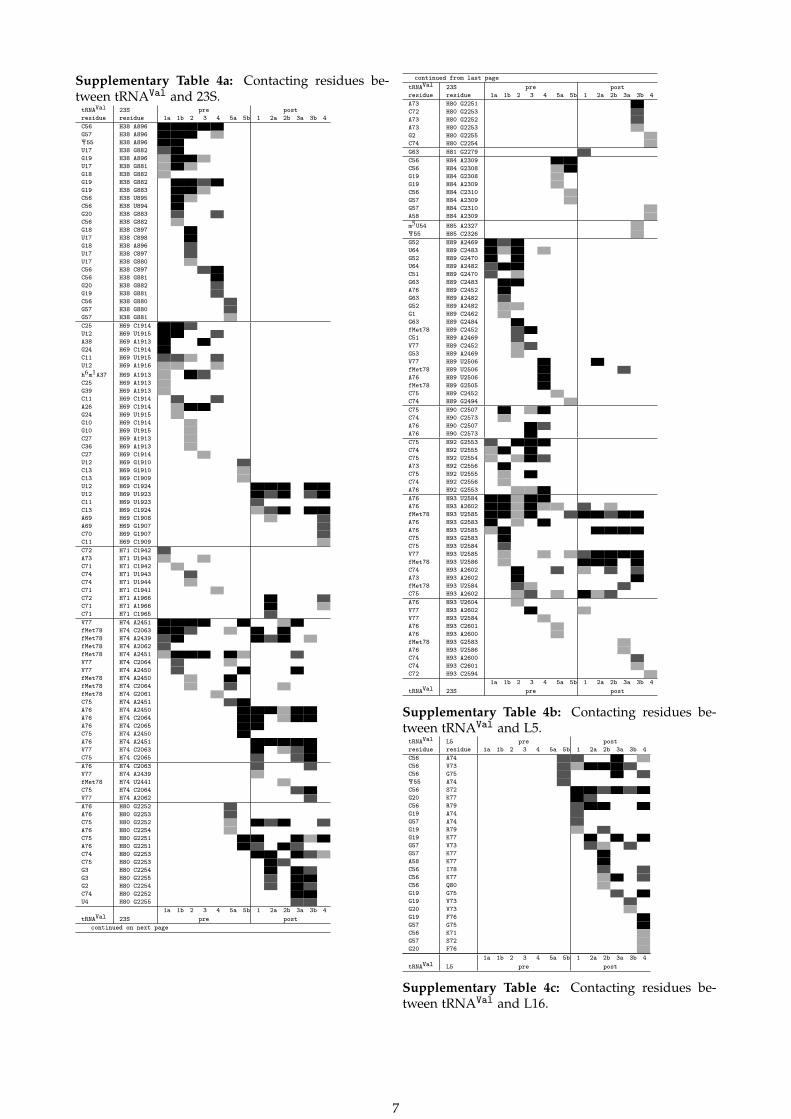
Supplementary Table 4a: Contacting residues be-tween tRNAVal and 23S.tRNAVal 23S pre postresidue residue 1a 1b 2 3 4 5a 5b 1 2a 2b 3a 3b 4C56 H38 A896G57 H38 A896Ψ55 H38 A896U17 H38 G882G19 H38 A896U17 H38 G881G18 H38 G882G19 H38 G882G19 H38 G883C56 H38 U895C56 H38 U894G20 H38 G883C56 H38 G882G18 H38 C897U17 H38 C898G18 H38 A896U17 H38 C897U17 H38 G880C56 H38 C897C56 H38 G881G20 H38 G882G19 H38 G881C56 H38 G880G57 H38 G880G57 H38 G881C25 H69 C1914U12 H69 U1915A38 H69 A1913G24 H69 C1914C11 H69 U1915U12 H69 A1916h6m1A37 H69 A1913C25 H69 A1913G39 H69 A1913C11 H69 C1914A26 H69 C1914G24 H69 U1915G10 H69 C1914G10 H69 U1915C27 H69 A1913C36 H69 A1913C27 H69 C1914U12 H69 G1910C13 H69 G1910C13 H69 C1909U12 H69 C1924U12 H69 U1923C11 H69 U1923C13 H69 C1924A69 H69 C1908A69 H69 G1907C70 H69 G1907C11 H69 C1909C72 H71 C1942A73 H71 U1943C71 H71 C1942C74 H71 U1943C74 H71 U1944C71 H71 C1941C72 H71 A1966C71 H71 A1966C71 H71 C1965V77 H74 A2451fMet78 H74 C2063fMet78 H74 A2439fMet78 H74 A2062fMet78 H74 A2451V77 H74 C2064V77 H74 A2450fMet78 H74 A2450fMet78 H74 C2064fMet78 H74 G2061C75 H74 A2451A76 H74 A2450A76 H74 C2064A76 H74 C2065C75 H74 A2450A76 H74 A2451V77 H74 C2063C75 H74 C2065A76 H74 C2063V77 H74 A2439fMet78 H74 U2441C75 H74 C2064V77 H74 A2062A76 H80 G2252A76 H80 G2253C75 H80 G2252A76 H80 C2254C75 H80 G2251A76 H80 G2251C74 H80 G2253C75 H80 G2253G3 H80 C2254G3 H80 G2255G2 H80 C2254C74 H80 G2252U4 H80 G2255
1a 1b 2 3 4 5a 5b 1 2a 2b 3a 3b 4tRNAVal 23S pre post
continued on next page
continued from last pagetRNAVal 23S pre postresidue residue 1a 1b 2 3 4 5a 5b 1 2a 2b 3a 3b 4A73 H80 G2251C72 H80 G2253A73 H80 G2252A73 H80 G2253G2 H80 G2255C74 H80 C2254G63 H81 G2279C56 H84 A2309C56 H84 G2308G19 H84 G2308G19 H84 A2309C56 H84 C2310G57 H84 A2309G57 H84 C2310A58 H84 A2309m5U54 H85 A2327Ψ55 H85 C2326G52 H89 A2469U64 H89 C2483G52 H89 G2470U64 H89 A2482C51 H89 G2470G63 H89 C2483A76 H89 C2452G63 H89 A2482G52 H89 A2482G1 H89 C2462G63 H89 G2484fMet78 H89 C2452C51 H89 A2469V77 H89 C2452G53 H89 A2469V77 H89 U2506fMet78 H89 U2506A76 H89 U2506fMet78 H89 G2505C75 H89 C2452C74 H89 G2494C75 H90 C2507C74 H90 C2573A76 H90 C2507A76 H90 C2573C75 H92 G2553C74 H92 U2555C75 H92 U2554A73 H92 C2556C75 H92 U2555C74 H92 C2556A76 H92 G2553A76 H93 U2584A76 H93 A2602fMet78 H93 U2585A76 H93 G2583A76 H93 U2585C75 H93 G2583C75 H93 U2584V77 H93 U2585fMet78 H93 U2586C74 H93 A2602A73 H93 A2602fMet78 H93 U2584C75 H93 A2602A76 H93 U2604V77 H93 A2602V77 H93 U2584A76 H93 C2601A76 H93 A2600fMet78 H93 G2583A76 H93 U2586C74 H93 A2600C74 H93 C2601C72 H93 C2594
1a 1b 2 3 4 5a 5b 1 2a 2b 3a 3b 4tRNAVal 23S pre post
Supplementary Table 4b: Contacting residues be-tween tRNAVal and L5.tRNAVal L5 pre postresidue residue 1a 1b 2 3 4 5a 5b 1 2a 2b 3a 3b 4C56 A74C56 V73C56 G75Ψ55 A74C56 S72G20 K77C56 R79G19 A74G57 A74G19 R79G19 K77G57 V73G57 K77A58 K77C56 I78C56 K77C56 Q80G19 G75G19 V73G20 V73G19 F76G57 G75C56 K71G57 S72G20 F76
1a 1b 2 3 4 5a 5b 1 2a 2b 3a 3b 4tRNAVal L5 pre post
Supplementary Table 4c: Contacting residues be-tween tRNAVal and L16.
7
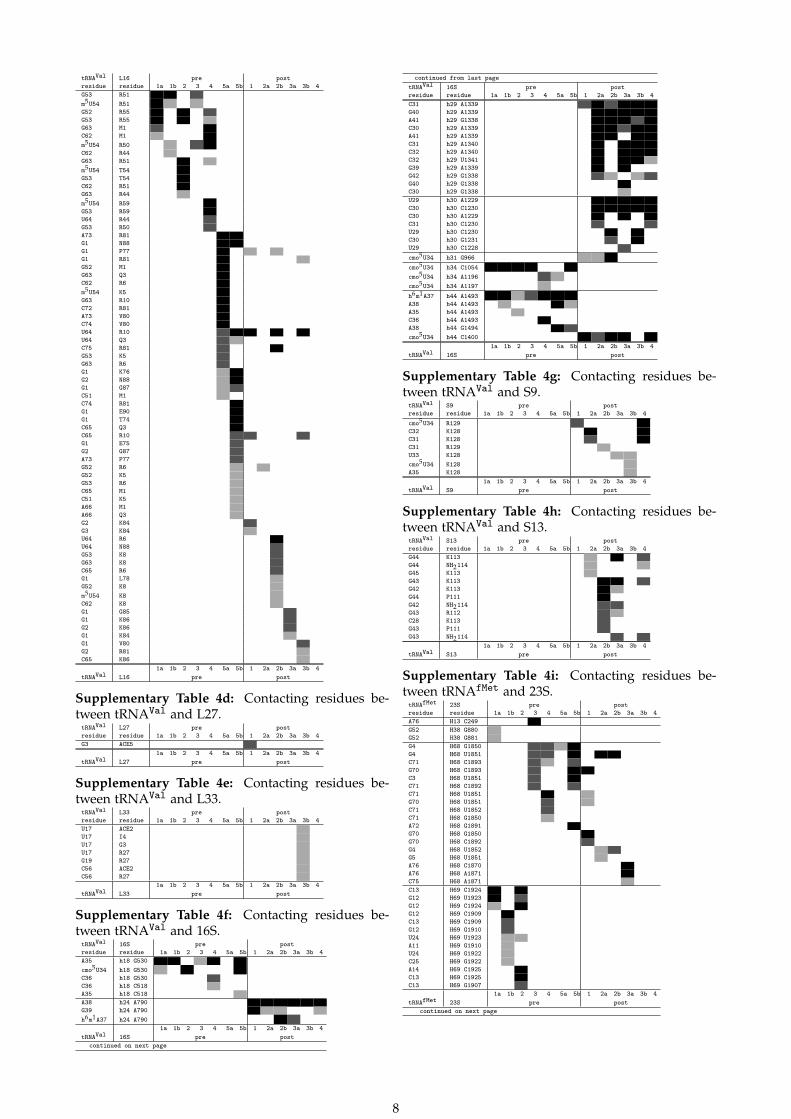
tRNAVal L16 pre postresidue residue 1a 1b 2 3 4 5a 5b 1 2a 2b 3a 3b 4G53 R51m5U54 R51G52 R55G53 R55G63 M1C62 M1m5U54 R50C62 R44G63 R51m5U54 T54G53 T54C62 R51G63 R44m5U54 R59G53 R59U64 R44G53 R50A73 R81G1 N88G1 P77G1 R81G52 M1G63 Q3C62 R6m5U54 K5G63 R10C72 R81A73 V80C74 V80U64 R10U64 Q3C75 R81G53 K5G63 R6G1 K76G2 N88G1 G87C51 M1C74 R81G1 E90G1 T74C65 Q3C65 R10G1 E75G2 G87A73 P77G52 R6G52 K5G53 R6C65 M1C51 K5A66 M1A66 Q3G2 K84G3 K84U64 R6U64 N88G53 K8G63 K8C65 R6G1 L78G52 K8m5U54 K8C62 K8G1 G85G1 K86G2 K86G1 K84G1 V80G2 R81C65 K86
1a 1b 2 3 4 5a 5b 1 2a 2b 3a 3b 4tRNAVal L16 pre post
Supplementary Table 4d: Contacting residues be-tween tRNAVal and L27.tRNAVal L27 pre postresidue residue 1a 1b 2 3 4 5a 5b 1 2a 2b 3a 3b 4G3 ACE5
1a 1b 2 3 4 5a 5b 1 2a 2b 3a 3b 4tRNAVal L27 pre post
Supplementary Table 4e: Contacting residues be-tween tRNAVal and L33.tRNAVal L33 pre postresidue residue 1a 1b 2 3 4 5a 5b 1 2a 2b 3a 3b 4U17 ACE2U17 I4U17 G3U17 R27G19 R27C56 ACE2C56 R27
1a 1b 2 3 4 5a 5b 1 2a 2b 3a 3b 4tRNAVal L33 pre post
Supplementary Table 4f: Contacting residues be-tween tRNAVal and 16S.tRNAVal 16S pre postresidue residue 1a 1b 2 3 4 5a 5b 1 2a 2b 3a 3b 4A35 h18 G530cmo5U34 h18 G530C36 h18 G530C36 h18 C518A35 h18 C518A38 h24 A790G39 h24 A790h6m1A37 h24 A790
1a 1b 2 3 4 5a 5b 1 2a 2b 3a 3b 4tRNAVal 16S pre post
continued on next page
continued from last pagetRNAVal 16S pre postresidue residue 1a 1b 2 3 4 5a 5b 1 2a 2b 3a 3b 4C31 h29 A1339G40 h29 A1339A41 h29 G1338C30 h29 A1339A41 h29 A1339C31 h29 A1340C32 h29 A1340C32 h29 U1341G39 h29 A1339G42 h29 G1338G40 h29 G1338C30 h29 G1338U29 h30 A1229C30 h30 C1230C30 h30 A1229C31 h30 C1230U29 h30 C1230C30 h30 G1231U29 h30 C1228cmo5U34 h31 G966cmo5U34 h34 C1054cmo5U34 h34 A1196cmo5U34 h34 A1197h6m1A37 h44 A1493A38 h44 A1493A35 h44 A1493C36 h44 A1493A38 h44 G1494cmo5U34 h44 C1400
1a 1b 2 3 4 5a 5b 1 2a 2b 3a 3b 4tRNAVal 16S pre post
Supplementary Table 4g: Contacting residues be-tween tRNAVal and S9.tRNAVal S9 pre postresidue residue 1a 1b 2 3 4 5a 5b 1 2a 2b 3a 3b 4cmo5U34 R129C32 K128C31 K128C31 R129U33 K128cmo5U34 K128A35 K128
1a 1b 2 3 4 5a 5b 1 2a 2b 3a 3b 4tRNAVal S9 pre post
Supplementary Table 4h: Contacting residues be-tween tRNAVal and S13.tRNAVal S13 pre postresidue residue 1a 1b 2 3 4 5a 5b 1 2a 2b 3a 3b 4G44 K113G44 NH2114G45 K113G43 K113G42 K113G44 P111G42 NH2114G43 R112C28 K113G43 P111G43 NH2114
1a 1b 2 3 4 5a 5b 1 2a 2b 3a 3b 4tRNAVal S13 pre post
Supplementary Table 4i: Contacting residues be-tween tRNAfMet and 23S.tRNAfMet 23S pre postresidue residue 1a 1b 2 3 4 5a 5b 1 2a 2b 3a 3b 4A76 H13 C249G52 H38 G880G52 H38 G881G4 H68 G1850G4 H68 U1851C71 H68 C1893G70 H68 C1893C3 H68 U1851C71 H68 C1892C71 H68 U1851G70 H68 U1851C71 H68 U1852C71 H68 G1850A72 H68 G1891G70 H68 G1850G70 H68 C1892G4 H68 U1852G5 H68 U1851A76 H68 C1870A76 H68 A1871C75 H68 A1871C13 H69 C1924G12 H69 U1923G12 H69 C1924G12 H69 C1909C13 H69 C1909G12 H69 G1910U24 H69 U1923A11 H69 G1910U24 H69 G1922C25 H69 G1922A14 H69 C1925C13 H69 C1925C13 H69 G1907
1a 1b 2 3 4 5a 5b 1 2a 2b 3a 3b 4tRNAfMet 23S pre post
continued on next page
8
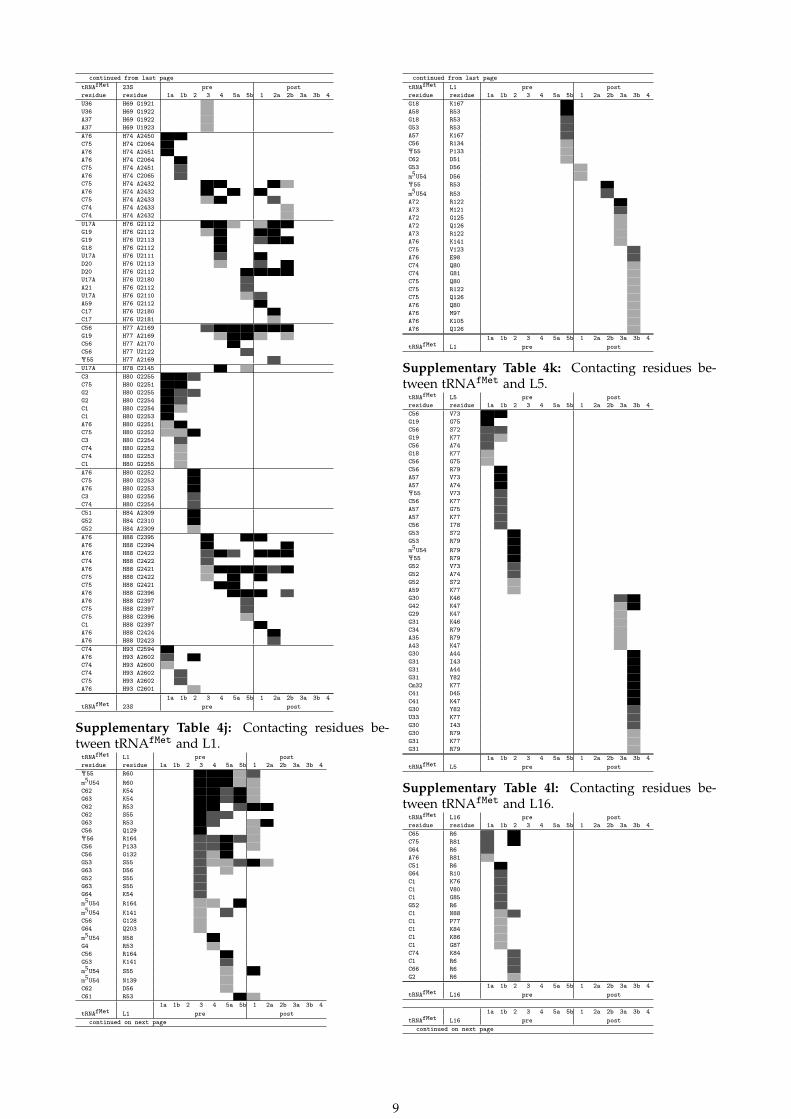
continued from last pagetRNAfMet 23S pre postresidue residue 1a 1b 2 3 4 5a 5b 1 2a 2b 3a 3b 4U36 H69 G1921U36 H69 G1922A37 H69 G1922A37 H69 U1923A76 H74 A2450C75 H74 C2064A76 H74 A2451A76 H74 C2064C75 H74 A2451A76 H74 C2065C75 H74 A2432A76 H74 A2432C75 H74 A2433C74 H74 A2433C74 H74 A2432U17A H76 G2112G19 H76 G2112G19 H76 U2113G18 H76 G2112U17A H76 U2111D20 H76 U2113D20 H76 G2112U17A H76 U2180A21 H76 G2112U17A H76 G2110A59 H76 G2112C17 H76 U2180C17 H76 U2181C56 H77 A2169G19 H77 A2169C56 H77 A2170C56 H77 U2122Ψ55 H77 A2169U17A H78 C2145C3 H80 G2255C75 H80 G2251G2 H80 G2255G2 H80 C2254C1 H80 C2254C1 H80 G2253A76 H80 G2251C75 H80 G2252C3 H80 C2254C74 H80 G2252C74 H80 G2253C1 H80 G2255A76 H80 G2252C75 H80 G2253A76 H80 G2253C3 H80 G2256C74 H80 C2254C51 H84 A2309G52 H84 C2310G52 H84 A2309A76 H88 C2395A76 H88 C2394A76 H88 C2422C74 H88 C2422A76 H88 G2421C75 H88 C2422C75 H88 G2421A76 H88 G2396A76 H88 G2397C75 H88 G2397C75 H88 G2396C1 H88 G2397A76 H88 C2424A76 H88 U2423C74 H93 C2594A76 H93 A2602C74 H93 A2600C74 H93 A2602C75 H93 A2602A76 H93 C2601
1a 1b 2 3 4 5a 5b 1 2a 2b 3a 3b 4tRNAfMet 23S pre post
Supplementary Table 4j: Contacting residues be-tween tRNAfMet and L1.tRNAfMet L1 pre postresidue residue 1a 1b 2 3 4 5a 5b 1 2a 2b 3a 3b 4Ψ55 R60m5U54 R60C62 K54G63 K54C62 R53C62 S55G63 R53C56 Q129Ψ56 R164C56 P133C56 G132G53 S55G63 D56G52 S55G63 S55G64 K54m5U54 R164m5U54 K141C56 G128G64 Q203m5U54 N58G4 R53C56 R164G53 K141m5U54 S55m5U54 N139C62 D56C61 R53
1a 1b 2 3 4 5a 5b 1 2a 2b 3a 3b 4tRNAfMet L1 pre post
continued on next page
continued from last pagetRNAfMet L1 pre postresidue residue 1a 1b 2 3 4 5a 5b 1 2a 2b 3a 3b 4G18 K167A58 R53G18 R53G53 R53A57 K167C56 R134Ψ55 P133C62 D51G53 D56m5U54 D56Ψ55 R53m5U54 R53A72 R122A73 M121A72 G125A72 Q126A73 R122A76 K141C75 V123A76 E98C74 Q80C74 G81C75 Q80C75 R122C75 Q126A76 Q80A76 M97A76 K105A76 Q126
1a 1b 2 3 4 5a 5b 1 2a 2b 3a 3b 4tRNAfMet L1 pre post
Supplementary Table 4k: Contacting residues be-tween tRNAfMet and L5.tRNAfMet L5 pre postresidue residue 1a 1b 2 3 4 5a 5b 1 2a 2b 3a 3b 4C56 V73G19 G75C56 S72G19 K77C56 A74G18 K77C56 G75C56 R79A57 V73A57 A74Ψ55 V73C56 K77A57 G75A57 K77C56 I78G53 S72G53 R79m5U54 R79Ψ55 R79G52 V73G52 A74G52 S72A59 K77G30 K46G42 K47G29 K47G31 K46C34 R79A35 R79A43 K47G30 A44G31 I43G31 A44G31 Y82Cm32 K77C41 D45C41 K47G30 Y82U33 K77G30 I43G30 R79G31 K77G31 R79
1a 1b 2 3 4 5a 5b 1 2a 2b 3a 3b 4tRNAfMet L5 pre post
Supplementary Table 4l: Contacting residues be-tween tRNAfMet and L16.tRNAfMet L16 pre postresidue residue 1a 1b 2 3 4 5a 5b 1 2a 2b 3a 3b 4C65 R6C75 R81G64 R6A76 R81C51 R6G64 R10C1 K76C1 V80C1 G85G52 R6C1 N88C1 P77C1 K84C1 K86C1 G87C74 K84C1 R6C66 R6G2 R6
1a 1b 2 3 4 5a 5b 1 2a 2b 3a 3b 4tRNAfMet L16 pre post
1a 1b 2 3 4 5a 5b 1 2a 2b 3a 3b 4tRNAfMet L16 pre post
continued on next page
9

continued from last pagetRNAfMet L16 pre postresidue residue 1a 1b 2 3 4 5a 5b 1 2a 2b 3a 3b 4
Supplementary Table 4m: Contacting residues be-tween tRNAfMet and L27.tRNAfMet L27 pre postresidue residue 1a 1b 2 3 4 5a 5b 1 2a 2b 3a 3b 4G2 G6G2 ACE5C1 ACE5
1a 1b 2 3 4 5a 5b 1 2a 2b 3a 3b 4tRNAfMet L27 pre post
Supplementary Table 4n: Contacting residues be-tween tRNAfMet and L28.tRNAfMet L28 pre postresidue residue 1a 1b 2 3 4 5a 5b 1 2a 2b 3a 3b 4C75 H19
1a 1b 2 3 4 5a 5b 1 2a 2b 3a 3b 4tRNAfMet L28 pre post
Supplementary Table 4o: Contacting residues be-tween tRNAfMet and L33.tRNAfMet L33 pre postresidue residue 1a 1b 2 3 4 5a 5b 1 2a 2b 3a 3b 4Ψ55 R27Ψ55 T28C56 R27C56 T28C65 R27C65 K26C66 K26C51 K29G52 K29C66 R27G52 P30G64 R27C65 I4C66 I4C1 I4C1 E6C74 G3A73 ACE2A73 G3C74 ACE2C74 I4C67 R27G64 K52C65 K52A37 P30A38 P30U36 P30G29 K29U36 T28U36 K29C28 K29C34 R27A35 R27A35 T28
1a 1b 2 3 4 5a 5b 1 2a 2b 3a 3b 4tRNAfMet L33 pre post
Supplementary Table 4p: Contacting residues be-tween tRNAfMet and 16S.tRNAfMet 16S pre postresidue residue 1a 1b 2 3 4 5a 5b 1 2a 2b 3a 3b 4A37 h23 G693A38 h23 A694A37 h23 A694A38 h23 A695U36 h23 G693C39 h23 A694A38 h23 G693C39 h23 G693C39 h24 A790A38 h24 A790A37 h24 A790U36 h24 A790U36 h24 U789A37 h24 U789U33 h28 C1383C34 h28 C1383C41 h29 A1339G30 h29 A1339G31 h29 A1340C40 h29 A1339Cm32 h29 U1341G31 h29 A1339C41 h29 G1338Cm32 h29 A1340G29 h29 G1338G42 h29 G1338G31 h29 U1341G42 h29 A1339A43 h29 G1338G29 h29 A1339G30 h29 A1340C41 h29 A1340G30 h29 G1338U36 h29 A1339G29 h30 A1229G30 h30 C1230G42 h30 A1229A44 h30 C1228
1a 1b 2 3 4 5a 5b 1 2a 2b 3a 3b 4tRNAfMet 16S pre post
continued on next page
continued from last pagetRNAfMet 16S pre postresidue residue 1a 1b 2 3 4 5a 5b 1 2a 2b 3a 3b 4G30 h30 A1229G29 h30 C1230A43 h30 C1228A43 h30 A1229G31 h30 C1230G29 h30 C1228C28 h30 C1228C34 h31 G966A35 h31 G966C34 h44 C1400
1a 1b 2 3 4 5a 5b 1 2a 2b 3a 3b 4tRNAfMet 16S pre post
Supplementary Table 4q: Contacting residues be-tween tRNAfMet and S7.tRNAfMet S7 pre postresidue residue 1a 1b 2 3 4 5a 5b 1 2a 2b 3a 3b 4Cm32 Q85U33 S82U33 T83A38 T83C40 A146C41 R142G42 R142Cm32 T83Cm32 Y84C40 M143C41 K135G29 K135U33 Q85C34 R78C40 N147C41 A146Cm32 R78U33 R78
1a 1b 2 3 4 5a 5b 1 2a 2b 3a 3b 4tRNAfMet S7 pre post
Supplementary Table 4r: Contacting residues be-tween tRNAfMet and S9.tRNAfMet S9 pre postresidue residue 1a 1b 2 3 4 5a 5b 1 2a 2b 3a 3b 4U33 R129C34 R129Cm32 R129A35 R129Cm32 K128G31 R129G30 R129G31 K128
1a 1b 2 3 4 5a 5b 1 2a 2b 3a 3b 4tRNAfMet S9 pre post
Supplementary Table 4s: Contacting residues be-tween tRNAfMet and S11.tRNAfMet S11 pre postresidue residue 1a 1b 2 3 4 5a 5b 1 2a 2b 3a 3b 4A38 R52C39 R55C39 R52
1a 1b 2 3 4 5a 5b 1 2a 2b 3a 3b 4tRNAfMet S11 pre post
Supplementary Table 4t: Contacting residues be-tween tRNAfMet and S13.tRNAfMet S13 pre postresidue residue 1a 1b 2 3 4 5a 5b 1 2a 2b 3a 3b 4A44 K109A43 K109A44 R112G45 R112A44 P111G29 R112C28 K113A44 K113C28 R112C28 NH2114A43 K113A43 NH2114U27 K113G42 NH2114A43 R112G42 K113U27 NH2114A44 NH2114G45 K113G29 NH2114
1a 1b 2 3 4 5a 5b 1 2a 2b 3a 3b 4tRNAfMet S13 pre post
10
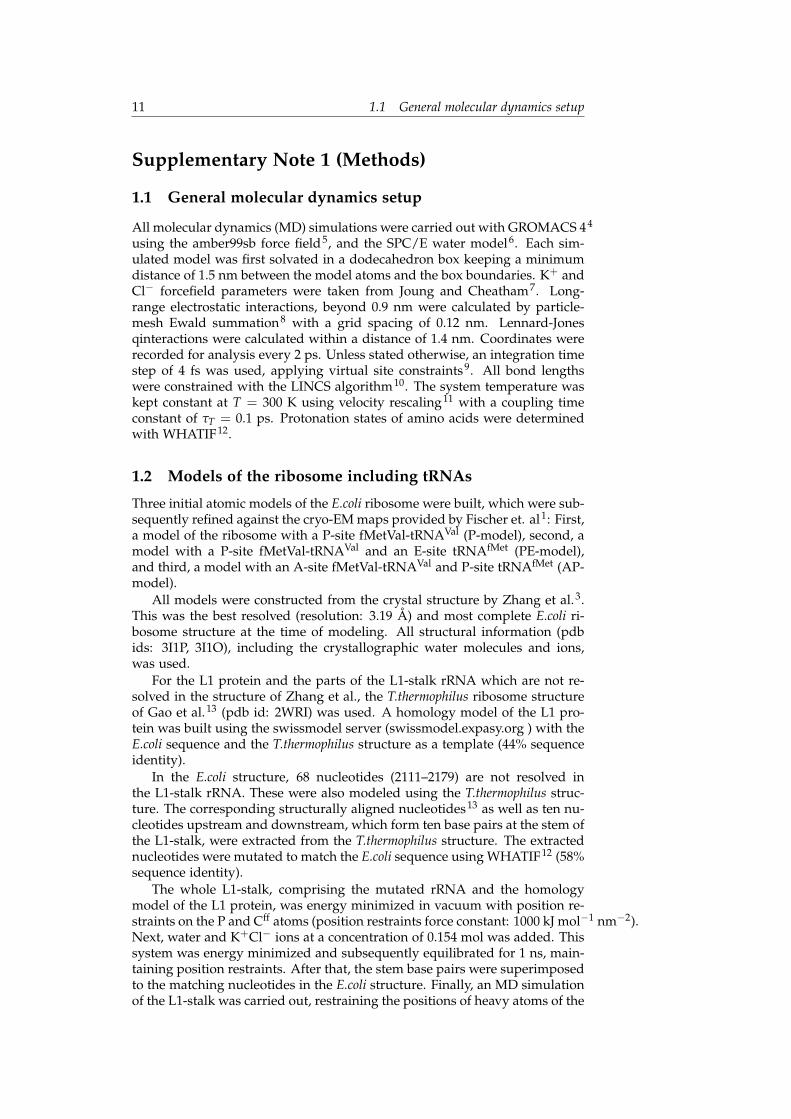
11 1.1 General molecular dynamics setup
Supplementary Note 1 (Methods)
1.1 General molecular dynamics setup
All molecular dynamics (MD) simulations were carried out with GROMACS 44
using the amber99sb force field5, and the SPC/E water model6. Each sim-ulated model was first solvated in a dodecahedron box keeping a minimumdistance of 1.5 nm between the model atoms and the box boundaries. K+ andCl− forcefield parameters were taken from Joung and Cheatham7. Long-range electrostatic interactions, beyond 0.9 nm were calculated by particle-mesh Ewald summation8 with a grid spacing of 0.12 nm. Lennard-Jonesqinteractions were calculated within a distance of 1.4 nm. Coordinates wererecorded for analysis every 2 ps. Unless stated otherwise, an integration timestep of 4 fs was used, applying virtual site constraints9. All bond lengthswere constrained with the LINCS algorithm10. The system temperature waskept constant at T = 300 K using velocity rescaling11 with a coupling timeconstant of τT = 0.1 ps. Protonation states of amino acids were determinedwith WHATIF12.
1.2 Models of the ribosome including tRNAs
Three initial atomic models of the E.coli ribosome were built, which were sub-sequently refined against the cryo-EM maps provided by Fischer et. al1: First,a model of the ribosome with a P-site fMetVal-tRNAVal (P-model), second, amodel with a P-site fMetVal-tRNAVal and an E-site tRNAfMet (PE-model),and third, a model with an A-site fMetVal-tRNAVal and P-site tRNAfMet (AP-model).
All models were constructed from the crystal structure by Zhang et al.3.This was the best resolved (resolution: 3.19 Å) and most complete E.coli ri-bosome structure at the time of modeling. All structural information (pdbids: 3I1P, 3I1O), including the crystallographic water molecules and ions,was used.
For the L1 protein and the parts of the L1-stalk rRNA which are not re-solved in the structure of Zhang et al., the T.thermophilus ribosome structureof Gao et al.13 (pdb id: 2WRI) was used. A homology model of the L1 pro-tein was built using the swissmodel server (swissmodel.expasy.org ) with theE.coli sequence and the T.thermophilus structure as a template (44% sequenceidentity).
In the E.coli structure, 68 nucleotides (2111–2179) are not resolved inthe L1-stalk rRNA. These were also modeled using the T.thermophilus struc-ture. The corresponding structurally aligned nucleotides13 as well as ten nu-cleotides upstream and downstream, which form ten base pairs at the stem ofthe L1-stalk, were extracted from the T.thermophilus structure. The extractednucleotides were mutated to match the E.coli sequence using WHATIF12 (58%sequence identity).
The whole L1-stalk, comprising the mutated rRNA and the homologymodel of the L1 protein, was energy minimized in vacuum with position re-straints on the P and Cff atoms (position restraints force constant: 1000 kJ mol−1 nm−2).Next, water and K+Cl− ions at a concentration of 0.154 mol was added. Thissystem was energy minimized and subsequently equilibrated for 1 ns, main-taining position restraints. After that, the stem base pairs were superimposedto the matching nucleotides in the E.coli structure. Finally, an MD simulationof the L1-stalk was carried out, restraining the positions of heavy atoms of the

1.2 Models of the ribosome including tRNAs 12
stem to those of the target E.coli structure. The force constant of the restrain-ing potential was linearly increased from 0 to 500 kJ mol−1 nm−2 within 5 ns.The resulting L1-stalk structure was finally incorporated into the model.
Helix 38 (H38) of the large ribosomal subunit forms contacts to the smallsubunit via intersubunit bridge B1a14. Nucleotides G879–C897 of this helixare not resolved in the E.coli structure. Secondary structure prediction soft-ware S2S15 predicted a pentaloop for the tip of the helix. The nucleotidesof a pentaloop from an NMR structure16 (pdb id: 1NA2) were mutated tomatch H38 sequence using WHATIF. To fit this rRNA structural motif intothe model of the ribosome, the same protocol as for the L1-stalk rRNA wasused.
The ribosomes used for the cryo-EM experiments contained an fMetVal-tRNAVal. Since no high resolution structure was available, a solution struc-ture of tRNAVal from a refinement of a homology model against residualdipolar coupling and SAXS data (pdb id: 2K4C)17 was used for the models.
The T.thermophilus structure by Yusupova et al.18 (pdb id: 2HGP) containsa P-site tRNAPhe and a 50 nucleotide long mRNA. This structure was rigid-body fitted to our model using structurally aligned nucleotides18 from 16SrRNA of the small subunit. The fitted coordinates of the tRNA phosphatesand of the mRNA were stored for later use. From this mRNA structure,the A-, P-, and E-site codons as well as three upstream and downstream nu-cleotides were extracted. These nucleotides were mutated with WHATIF tomatch the sequence of the mRNA used in the cryo-EM experiments. Appro-priate tRNA modifications and the dipeptide were added to match experi-mental conditions1. Atom types for fMet were obtained with ANTECHAM-BER19, partial charges were determined using DFT-b3lyp with a 6-31/G*basis set. Side chain charges are the same as in Met. On the backbone, onlythe charges of the formylamino cap changed more than 5 %. The modifiedfMetVal-tRNAVal structure was then fitted as a rigid body to the P atomsobtained from the fitted Yusupova structure. Next, a 1 ns simulation of thetRNA and the mRNA in solvent with position restraints on the P and C1’atoms was carried out. In the subsequent 5 ns simulation, positions of P andC1’ atoms were restrained to those of the fitted Yusupova structure, therebylinearly increasing the force constant from 0 to 1000 kJ mol−1 nm−2 duringthe simulation. The resulting tRNA structure was then included into theribosome model, yielding the P-model.
The T.thermophilus structure by Gao et al.13 (pdb id: 2WRI) contains an E-site tRNAfMet. The 30S subunit structure was rigid body fitted to our modelusing structurally aligned nucleotides13 from 16S rRNA. Nucleotide modifi-cations were added to the tRNA to match the modifications of the tRNAs inthe cryo-EM experiments and a 1 ns simulation of the tRNA in solvent withposition restraints on the P and C1’ atoms was performed. The resultingtRNA structure was then included into the P-model, yielding the PE-model.
For the AP-model, the same tRNA structures were used as for the PE-model, but the tRNAVal was fitted into the A- and the tRNAfMet into theP-site. Almost the same protocol as for the addition of the P-site tRNAVal
was used, except that the tRNAVal has 77 nucleotides and the tRNAPhe fromthe Yusupova structure which was used for fitting has 76 nucleotides. Allthe nucleotides, except for 5 nucleotides upstream and 5 nucleotides down-stream of the insertion, were used for the rigid body fitting and the positionrestraints in the simulation.

13 1.3 Refinement of the atomic models against cryo-EM maps*
1.3 Refinement of the atomic models against cryo-EM maps*
The three ribosome models obtained from crystal structures as described inthe previous paragraph were used as starting structures for subsequent re-finement against the 13 different cryo-EM density maps, to provide an all-atom interpretation of each individual conformational state. Initial place-ment of a starting model into a density map was done using the rigid-bodyfit feature of the program Chimera20. The real-space refinement programDireX21 was then used for all refinements. DireX computes a density mapfrom an atomic model and refines the atomic coordinates to maximize theoverlap between this model map and the cryo-EM density map. The qualityof the refinement by DireX has been found to be similar or better than thatof other established methods in a comparative study22. The model densitymaps were generated using a Gaussian kernel with a width adapted to theresolution of the corresponding cryo-EM density map.
For each refinement, 2000 steps were performed which took 36 hours onaverage on one core of an Intel Core 2 Quad Processor Q9300 (2.5 GHz).
The initial AP-, PE-, and P-models were refined against the map whichmost closely resembled the state of the model (respectively: pre1b, post1,and post4). Subsequently, fitted structures were used as starting models forrefinement against the remaining 10 maps in the sequence described in Sup-plementary Table 1.
Due to a program bug during the refinement process with DireX, in the30S subunit, the tRNAs and the mRNA, several amino acids and nucleotideshad wrong chiralities. In the structures extracted after 20 ns pre-equilibration,the errors were corrected by placing the chiral center atom on the oppo-site side of the plane defined by the three chiral neighbor heavy atoms. Tothat goal, the bond vector between the chiral center atom and the respectivebound hydrogen atom was used for shifting the chiral center and the boundhydrogen atom. Subsequently, the bound hydrogen atom was flipped to theother side of the chiral center atom using the same bond vector. Alternatively,for the C2’ in nucleotide sugars, chiral errors were corrected by swappingthe positions of the O2’ and H2’ atoms. All corrected structures were againenergy-minimized. Since all the simulations were started from the structurescontaining these errors, we performed a 60 ns simulation from the energy-minimized corrected pre5b structure at 20 ns to make sure that these errorsdo not influence our results and conclusions. The pre5b state was chosen, be-cause the refined structure contained the highest number of errors of all thestructures. The root mean square deviation (RMSD) relative to the structureat 20 ns was calculated, a Principal Component Analysis (PCA) of tRNAVal,tRNAfMet, and L1-stalk motions was carried out and the intersubunit rotationangles were calculated as described in 2.3. The results were compared to thetwo independent pre5b simulations which started from different structures at20 ns in order to see the effect of different starting structures (representing thesame state) compared to the effect of changed chiralities in two simulationsstarting from the same structure. The PCAs of the tRNAs and the L1-stalkmotions as well as the intersubunit rotation angles showed larger differencesbetween the simulations starting from different structures than the differencedue to the changed chiralities. The RMSD of the simulation started from thecorrected structure was not markedly different from that of the other two sim-ulations of the pre5b state. Hence, possible inaccuracies due to changed chi-ralities are found to be smaller than the statistical uncertainty due to limitedsampling and, therefore, not significant. Next, we investigated the effect thechanged chiralities have on our identification of residues involved in contacts
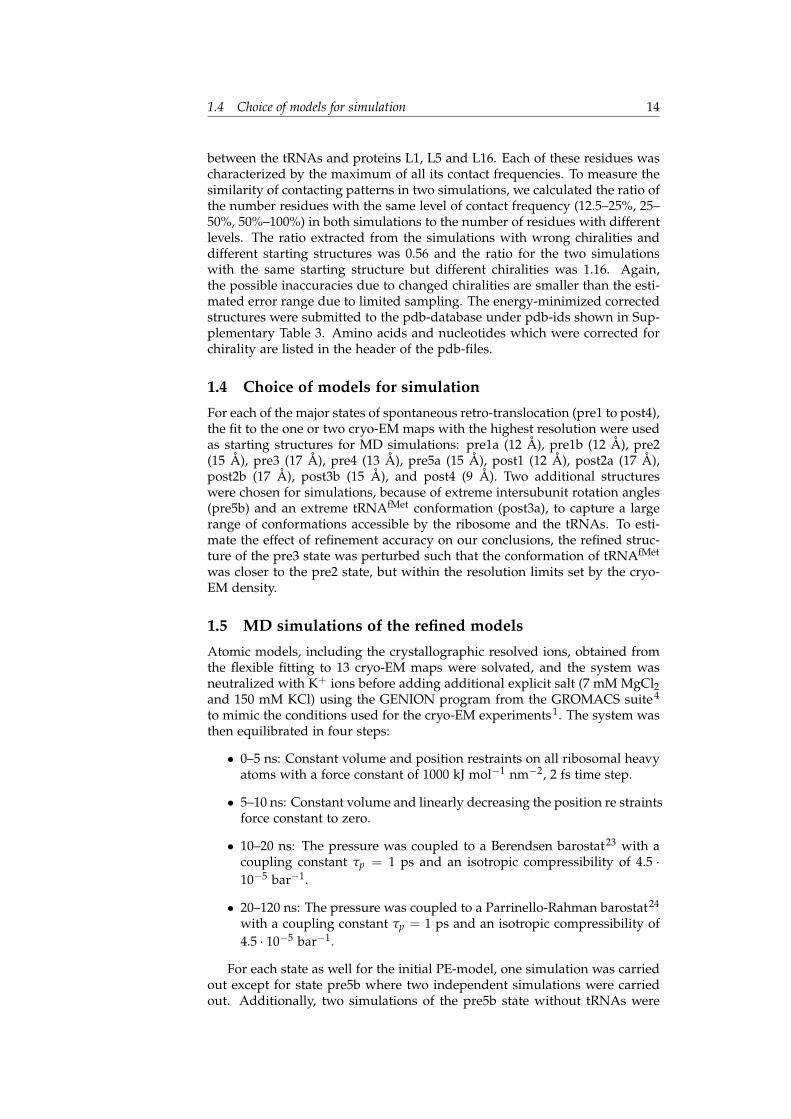
1.4 Choice of models for simulation 14
between the tRNAs and proteins L1, L5 and L16. Each of these residues wascharacterized by the maximum of all its contact frequencies. To measure thesimilarity of contacting patterns in two simulations, we calculated the ratio ofthe number residues with the same level of contact frequency (12.5–25%, 25–50%, 50%–100%) in both simulations to the number of residues with differentlevels. The ratio extracted from the simulations with wrong chiralities anddifferent starting structures was 0.56 and the ratio for the two simulationswith the same starting structure but different chiralities was 1.16. Again,the possible inaccuracies due to changed chiralities are smaller than the esti-mated error range due to limited sampling. The energy-minimized correctedstructures were submitted to the pdb-database under pdb-ids shown in Sup-plementary Table 3. Amino acids and nucleotides which were corrected forchirality are listed in the header of the pdb-files.
1.4 Choice of models for simulation
For each of the major states of spontaneous retro-translocation (pre1 to post4),the fit to the one or two cryo-EM maps with the highest resolution were usedas starting structures for MD simulations: pre1a (12 Å), pre1b (12 Å), pre2(15 Å), pre3 (17 Å), pre4 (13 Å), pre5a (15 Å), post1 (12 Å), post2a (17 Å),post2b (17 Å), post3b (15 Å), and post4 (9 Å). Two additional structureswere chosen for simulations, because of extreme intersubunit rotation angles(pre5b) and an extreme tRNAfMet conformation (post3a), to capture a largerange of conformations accessible by the ribosome and the tRNAs. To esti-mate the effect of refinement accuracy on our conclusions, the refined struc-ture of the pre3 state was perturbed such that the conformation of tRNAfMet
was closer to the pre2 state, but within the resolution limits set by the cryo-EM density.
1.5 MD simulations of the refined models
Atomic models, including the crystallographic resolved ions, obtained fromthe flexible fitting to 13 cryo-EM maps were solvated, and the system wasneutralized with K+ ions before adding additional explicit salt (7 mM MgCl2and 150 mM KCl) using the GENION program from the GROMACS suite4
to mimic the conditions used for the cryo-EM experiments1. The system wasthen equilibrated in four steps:
• 0–5 ns: Constant volume and position restraints on all ribosomal heavyatoms with a force constant of 1000 kJ mol−1 nm−2, 2 fs time step.
• 5–10 ns: Constant volume and linearly decreasing the position re straintsforce constant to zero.
• 10–20 ns: The pressure was coupled to a Berendsen barostat23 with acoupling constant τp = 1 ps and an isotropic compressibility of 4.5 ·10−5 bar−1.
• 20–120 ns: The pressure was coupled to a Parrinello-Rahman barostat24
with a coupling constant τp = 1 ps and an isotropic compressibility of4.5 · 10−5 bar−1.
For each state as well for the initial PE-model, one simulation was carriedout except for state pre5b where two independent simulations were carriedout. Additionally, two simulations of the pre5b state without tRNAs were

15 1.6 Cryo-EM analysis of global ribosome conformation
completed. Here, the tRNAs were removed from the structure refined againstthe pre5b state and the ribosome structure was subsequently solvated andequilibrated in the same way as the other structures.
1.6 Cryo-EM analysis of global ribosome conformation
Cryo-EM grids of vacant E.coli ribosomes were prepared at 18C under con-trolled environmental conditions25 and imaged under cryo conditions witha Titan Krios electron microscope (FEI Company, the Netherlands) at 300 kVand defoci ranging from 1 µm to 2.5 µm on a Eagle 4k x 4k CCD camera(FEI Company, the Netherlands) using 2fold pixel binning, resulting in a fi-nal pixel size of 3.2 Å. Ribosome particles were selected semi-atomically withBoxer26 and corrected locally for the CTF27. The resulting 9814 ribosomeparticles were coarsened twofold to a pixel size of 6.4 Å and classified ac-cording to 30S body rotation in 2.5 steps as described1. Pre-translocationstate ribosome particles (315108 in total) were obtained from an existingdataset of E.coli ribosome complexes prepared for cryo-EM at different time-points of the retro-translocation reaction, using the same buffer and tem-perature of 18C as for the vacant ribosomes28;1. Hierarchical classificationresulted in 34 groups of ribosome particles representing structurally distinctpre-translocation states1. For each population of pre-translocation ribosomes,the 30S body rotation of the corresponding cryo-EM reconstruction was de-termined. In Fig. 2, the fraction of particles as a function of 30S body rotationwas plotted in 2.5 steps for all pre-translocation state ribosomes and vacantribosomes, respectively. Image processing was generally performed usingIMAGIC-529 and exhaustive alignment30.
Supplementary Note 2 (Analysis)
2.1 Comparison to recent crystal structures*
To compare our models to existing crystal structures for each state, an averagestructure was calculated from the last 10 ns of each trajectory. The root meansquare deviations (RMSD) of these structures relative to two E.coli ribosomecrystal structures (pdb ids: 3R8S, 3R8T2) were calculated after rigid-body fit-ting using all resolved 70S Cff and P atoms, except L9 protein atoms (Fig. 1b).
Of particular importance for our analysis is the quality of our models inthe tRNA binding region. To assess the accuracy of the models in this region,the RMSD of the Cff and P atoms which are within a 2-nm distance to the twotRNAs in any of the models was calculated after rigid-body fitting (Fig. 1b).
2.2 Independent MD based refinement
In order to provide an independent test of our refinement procedure, weperformed an additional refinement of the AP-model against the pre1b cryo-EM map using an all-atom explicit solvent MD simulation with an additionalbiasing potential and no further restraints. This biasing potential maximizescorrelation between the atomic model, using an adapted Gaussian kernel asdescribed above, and the cryo-EM map31;32. The model density maps werecalculated for each simulation time step, an effective potential constant31 ofk = 106 kJ/mol and a total simulation time of 2.7 ns were used. The AP-model was solvated in a cubic simulation box which matches the geometryof the cryo-EM map.

2.3 Definition of reaction coordinates for collective motions* 16
2.3 Definition of reaction coordinates for collective motions*
Principal component analysis*
Principal component analysis (PCA)33 was carried out for tRNAVal, tRNAfMet,and the L1-stalk using all the simulations of the whole ribosome. To definecommon sub-spaces, all trajectories were first superimposed by least squarefit, using Cff and P atoms of the 50S subunit excluding the L1-stalk. Next,the Cff and P atoms of the tRNAs and the L1-stalk were extracted from thetrajectories. For each of the three ribosomal components the extracted trajec-tories of all states were concatenated, and the atomic displacement covariancematrix was calculated. The trajectories of each state were then projected onthe first eigenvector of this matrix. The projections divided by
√N, where
N is the number of atoms used to construct the covariance matrix, yieldedthe reaction coordinates (r.c.). The minimum and maximum of this reactioncoordinate for each state are shown in Fig. 1c. The projections on the firstthree eigenvectors were used to estimate transition rates (see below).
In order to calculate the distance dependence of the interaction enthalpies,i.e. the sum of electrostatic and Lennard-Jones interactions, between tRNAfMet
and the L1 protein, a distance coordinate was obtained from a PCA using Cff
and P atoms of the tRNA and the L1-stalk. The atomic displacement covari-ance matrix was constructed from the trajectories of those states in which thetRNA and the L1 were in contact (pre3–pre2b). The projection on the firsteigenvector of this matrix, divided by
√N, where N is the number of atoms
used to construct the covariance matrix, was used as the distance coordinate,where the smallest value observed in the simulations was set to zero.
30S head and body rotation**
Head and body rotations were quantified by comparing structures of eachstate, extracted from the respective trajectories at 200 ps intervals, to thepost1a structure at 20 ns. The post1a structure was used to define zero degreebody and head rotations. To define the axes of rotation and pivoting points,we extended a non-linear least squares fitting method34 to also include theaxis of minimal and median rotation. Final mean pivoting point and axes ofrotation for head and body movement were determined by quaternion-basedaveraging35 over all rotations obtained from all structures of all states. Ro-tation angles were then calculated relative to the mean axes of rotation andpivoting points.
2.4 Transition rate estimates**
Transition rates were estimated in two steps. Firstly, initial estimates for thefree energy barrier heights ∆G‡
est were obtained from a fluctuation analysis ofthe trajectories of all states. Secondly, these barrier estimates were calibratedby comparing passage frequencies obtained from the initial barrier estimatesto passage frequencies actually observed in the simulations, to yield the freeenergy barriers ∆G‡. The calibrated free energy barrier heights ∆G‡ werethen used to calculate the transition rates shown in Fig. 1d.
Free energy barrier estimates**
The initial free energy barrier estimates ∆G‡est for the transitions between all
states for the motions of the L1-stalk, both tRNAs, and 30S head and body
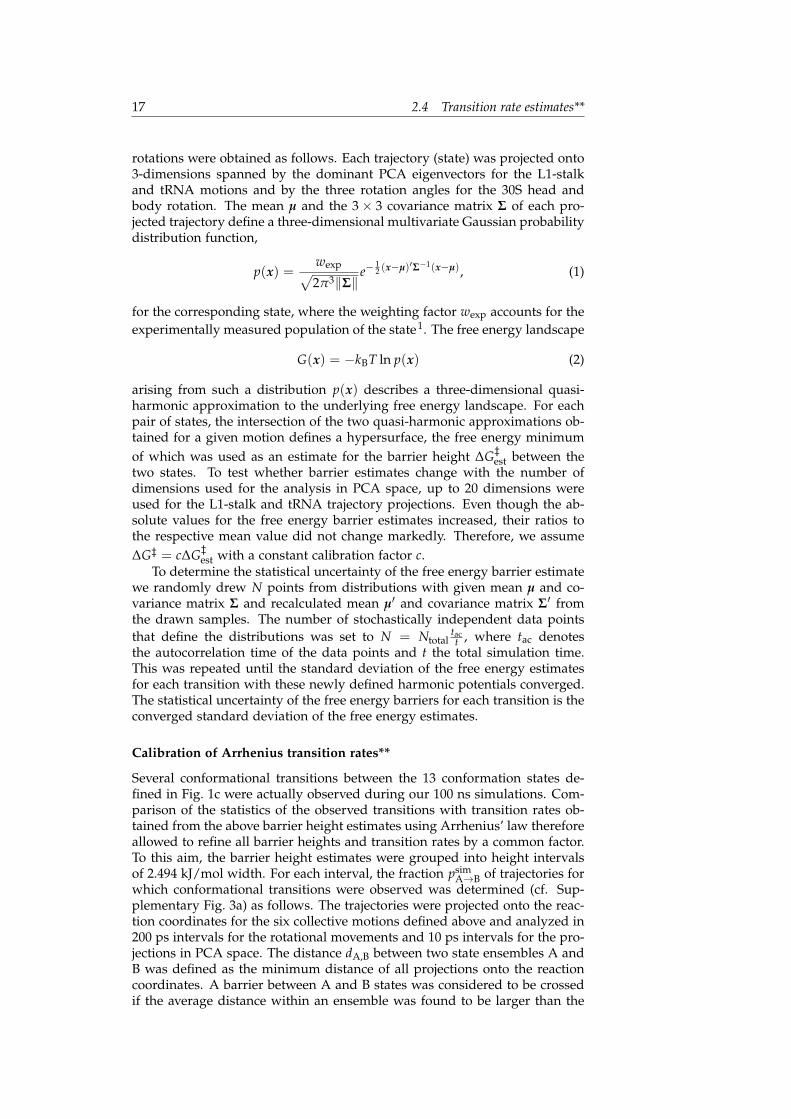
17 2.4 Transition rate estimates**
rotations were obtained as follows. Each trajectory (state) was projected onto3-dimensions spanned by the dominant PCA eigenvectors for the L1-stalkand tRNA motions and by the three rotation angles for the 30S head andbody rotation. The mean µ and the 3× 3 covariance matrix Σ of each pro-jected trajectory define a three-dimensional multivariate Gaussian probabilitydistribution function,
p(x) =wexp√2π3‖Σ‖
e−12 (x−µ)′Σ−1(x−µ), (1)
for the corresponding state, where the weighting factor wexp accounts for theexperimentally measured population of the state1. The free energy landscape
G(x) = −kBT ln p(x) (2)
arising from such a distribution p(x) describes a three-dimensional quasi-harmonic approximation to the underlying free energy landscape. For eachpair of states, the intersection of the two quasi-harmonic approximations ob-tained for a given motion defines a hypersurface, the free energy minimumof which was used as an estimate for the barrier height ∆G‡
est between thetwo states. To test whether barrier estimates change with the number ofdimensions used for the analysis in PCA space, up to 20 dimensions wereused for the L1-stalk and tRNA trajectory projections. Even though the ab-solute values for the free energy barrier estimates increased, their ratios tothe respective mean value did not change markedly. Therefore, we assume∆G‡ = c∆G‡
est with a constant calibration factor c.To determine the statistical uncertainty of the free energy barrier estimate
we randomly drew N points from distributions with given mean µ and co-variance matrix Σ and recalculated mean µ′ and covariance matrix Σ′ fromthe drawn samples. The number of stochastically independent data pointsthat define the distributions was set to N = Ntotal
tact , where tac denotes
the autocorrelation time of the data points and t the total simulation time.This was repeated until the standard deviation of the free energy estimatesfor each transition with these newly defined harmonic potentials converged.The statistical uncertainty of the free energy barriers for each transition is theconverged standard deviation of the free energy estimates.
Calibration of Arrhenius transition rates**
Several conformational transitions between the 13 conformation states de-fined in Fig. 1c were actually observed during our 100 ns simulations. Com-parison of the statistics of the observed transitions with transition rates ob-tained from the above barrier height estimates using Arrhenius’ law thereforeallowed to refine all barrier heights and transition rates by a common factor.To this aim, the barrier height estimates were grouped into height intervalsof 2.494 kJ/mol width. For each interval, the fraction psim
A→B of trajectories forwhich conformational transitions were observed was determined (cf. Sup-plementary Fig. 3a) as follows. The trajectories were projected onto the reac-tion coordinates for the six collective motions defined above and analyzed in200 ps intervals for the rotational movements and 10 ps intervals for the pro-jections in PCA space. The distance dA,B between two state ensembles A andB was defined as the minimum distance of all projections onto the reactioncoordinates. A barrier between A and B states was considered to be crossedif the average distance within an ensemble was found to be larger than the
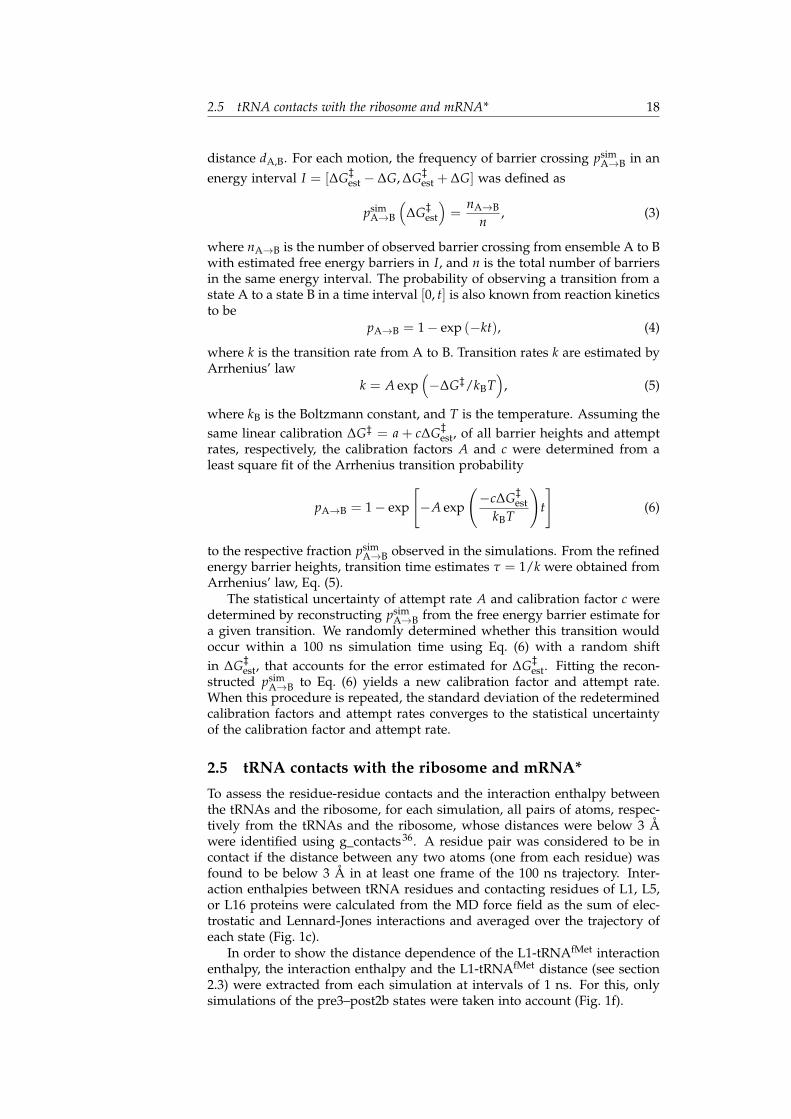
2.5 tRNA contacts with the ribosome and mRNA* 18
distance dA,B. For each motion, the frequency of barrier crossing psimA→B in an
energy interval I = [∆G‡est − ∆G, ∆G‡
est + ∆G] was defined as
psimA→B
(∆G‡
est
)=
nA→B
n, (3)
where nA→B is the number of observed barrier crossing from ensemble A to Bwith estimated free energy barriers in I, and n is the total number of barriersin the same energy interval. The probability of observing a transition from astate A to a state B in a time interval [0, t] is also known from reaction kineticsto be
pA→B = 1− exp (−kt), (4)
where k is the transition rate from A to B. Transition rates k are estimated byArrhenius’ law
k = A exp(−∆G‡/kBT
), (5)
where kB is the Boltzmann constant, and T is the temperature. Assuming thesame linear calibration ∆G‡ = a + c∆G‡
est, of all barrier heights and attemptrates, respectively, the calibration factors A and c were determined from aleast square fit of the Arrhenius transition probability
pA→B = 1− exp
[−A exp
(−c∆G‡
estkBT
)t
](6)
to the respective fraction psimA→B observed in the simulations. From the refined
energy barrier heights, transition time estimates τ = 1/k were obtained fromArrhenius’ law, Eq. (5).
The statistical uncertainty of attempt rate A and calibration factor c weredetermined by reconstructing psim
A→B from the free energy barrier estimate fora given transition. We randomly determined whether this transition wouldoccur within a 100 ns simulation time using Eq. (6) with a random shiftin ∆G‡
est, that accounts for the error estimated for ∆G‡est. Fitting the recon-
structed psimA→B to Eq. (6) yields a new calibration factor and attempt rate.
When this procedure is repeated, the standard deviation of the redeterminedcalibration factors and attempt rates converges to the statistical uncertaintyof the calibration factor and attempt rate.
2.5 tRNA contacts with the ribosome and mRNA*
To assess the residue-residue contacts and the interaction enthalpy betweenthe tRNAs and the ribosome, for each simulation, all pairs of atoms, respec-tively from the tRNAs and the ribosome, whose distances were below 3 Åwere identified using g_contacts36. A residue pair was considered to be incontact if the distance between any two atoms (one from each residue) wasfound to be below 3 Å in at least one frame of the 100 ns trajectory. Inter-action enthalpies between tRNA residues and contacting residues of L1, L5,or L16 proteins were calculated from the MD force field as the sum of elec-trostatic and Lennard-Jones interactions and averaged over the trajectory ofeach state (Fig. 1c).
In order to show the distance dependence of the L1-tRNAfMet interactionenthalpy, the interaction enthalpy and the L1-tRNAfMet distance (see section2.3) were extracted from each simulation at intervals of 1 ns. For this, onlysimulations of the pre3–post2b states were taken into account (Fig. 1f).

19 2.6 Conservation of contact residues in L1, L5, and L16*
To monitor tRNA-mRNA base-pairing, the minimal distance between theatoms from each codon nucleotide on the mRNA and the corresponding an-ticodon residue on the tRNA was calculated from each simulation.
Contacts between tRNA nucleosides and residues of the ribosomal pro-teins as well as the rRNA were found to have different levels of state-specifity,e.g some contacts are only present in a single state and others are presentin several states. To asses the level of state-specifity, a contact entropy wascalculated as follows: ∑13
i=1− fi ln( fi), where fi is the normalized contact fre-quency in state i. With this definition, contacts that are more state-specifichave a smaller contact entropy than less specific ones.
2.6 Conservation of contact residues in L1, L5, and L16*Protein sequences of L1, L5 and L16 proteins were retrieved from the UniProtdatabase37. 6,029 individual sequences of L1; 6,125 sequences of L5; and6,031 sequences of L16 protein were used. To reduce computational com-plexity, sequences that had more than 90% identity were combined to a sin-gle cluster, each cluster represented by a single characteristic sequence. 1,174characteristic sequences for L1; 1,106 sequences for L5; and 859 sequences forL16 protein were analyzed. Individual sequences were manually curated inorder to exclude incomplete sequences leaving 1,153 sequences of L1, 1,079sequences of L5 and 852 sequences of L16 protein.
Multiple sequence alignments were performed using Muscle software38.To construct a phylogenetic tree, incomplete positions of multiple sequencealignments were eliminated using Gblocks39 software. Phylogenetic treeswere constructed based on maximum-likelihood with JTT40 model usingPhyML41. Rate4Site software with JTT model was used to calculate conserva-tion42. Calculation was performed using empirical Bayesian approach, whichwas shown to be superior to the maximum-likelihood method for site-specificconservation scores42. Conservation score was calculated for each individualposition of the complete multiple sequence alignment. E. coli sequences wereused as a reference. The conservation scores calculated by Rate4Site were in-verted such that values higher than zero indicate conservation degree whichis higher than for the protein in general, whereas values lower than zeroindicate less than average conservation.
In order to calculate the contact score, frequencies of contacts betweentRNA and protein in every substate were used. For each pair of tRNA-proteincontacts, the maximum contact frequency over all substates was determined.For every protein residue, the contact score was calculated as a sum of fre-quencies from all of its contact frequencies of different interactions. Residuesthat had a contact score of > 0.8 were considered contacting.
2.7 L1-stalk interaction with the 30S subunitTo monitor the interaction between the L1-stalk and the 30S subunit, the in-teraction enthalpy between the L1-stalk rRNA and proteins S7 and S11 wascalculated. To that aim, the sum of electrostatic and Lennard-Jones interac-tions were averaged over the trajectory of each state (Fig. 1c).
2.8 L1-tRNAfMet potential of mean force
The potential of mean force (PMF) between the L1-stalk and the tRNAfMet
was calculated using the extended umbrella sampling simulations43. Themotion of the system was restricted at selected positions along the vector

2.9 Bridge B1b interaction enthalpy* 20
describing the distance between L1-stalk and tRNA (see section 2.3). First,20 equally spaced positions xi (i = 1, · · · , 20) were chosen between the mini-mum and maximum value of the projection onto the distance vector observedin the simulations (pre3–post2b). For each i, the structure of the L1-stalk andthe tRNA whose projection onto the vector was closest to xi was then ex-tracted from the trajectories. Next, the obtained structures were solvated (asdescribed in section 1.1) and subsequently energy minimized. An additionalharmonic umbrella potential with a force constant of kU = 100 kJ/mol/nm2
and centered at xi was applied to the Cff and P atoms of the tRNA and theL1-stalk to restrain the movement along the distance vector.
Next, the solvent was equilibrated for 5 ns using position restraints ontRNA and the L1-stalk heavy atoms with a force constant of k = 1000 kJ/mol/nm2.Subsequently, the system was simulated for 20 ns with the umbrella potential,but without position restraints.
The distances extracted from the 20 20-ns simulations were used to con-struct the free energy landscape (Fig. 1f) using the weighted histogram anal-ysis method (WHAM)44. The WHAM implementation g_wham45 was usedand the statistical errors were calculated by bootstrapping new trajectoriesbased on the umbrella histograms.
2.9 Bridge B1b interaction enthalpy*
The 50S part of intersubunit bridge B1b14 was defined as the set of residuesof protein L5 that are in contact (see section 2.5) with the 30S residues inat least one of the states. The 30S part was defined as the set of all the30S residues that are in contact with L5 in at least one of the states. Theinteraction enthalpy between 50S and 30S part of the intersubunit bridge wasextracted as in section 2.5 from the pre5b simulation at intervals of 2 ps.
2.10 Kinetic sequence of states**
From all reaction sequences (i.e. one permutation of all states, pre1a, pre1b,pre2a, . . ., post3b), we determined the one which best matches the observedset of transition rates as follows. We assume the best matching reactionsequence to be the one that yields the shortest overall half-time τ. Thisoverall half-time is proportional to the sum of the half-times of the statetransitions τA→B ∝ exp
(∆G‡
A→B
). The highest transition barrier estimates
dominate the overall half-time, so only the barrier for the ribosomal com-ponent governing the transition for a given pair of states was taken into ac-count. The sequence with the shortest overall half-time of states minimizes
∑transitionsi exp
(∆G‡max
i
), where ∆G‡max
i is the highest barrier of all the bar-riers estimated for the individual ribosome components for transition i. Toavoid that only very high barrier estimates with large errors dominate thecalculation, barrier estimates higher than 50 kT were set to 50 kT.
To check whether the omission of possible “off-track” states allows fora faster reaction sequence, we performed the above analysis for the fastestprogression sequences with single states omitted. Two cases have been ex-cluded here, which trivially enhance the progression rate. First, if end-statesare omitted, the reaction sequence trivially becomes faster (e.g. choosing thesimple sequence “pre3 pre4”). Second, if two barriers that include at leastone capped barrier are replaced by just one capped barrier (e.g. replacing“pre2 pre3 pre4” by “pre2 pre4”). Excluding the two above trivial acceler-ations of the overall rate, we calculated the fastest progression rate for all

21 2.11 Kinetic sequence of states for subsets of ribosome component movements**
left non-trivial combinations of omitting states from the fastest progressionsequences.
2.11 Kinetic sequence of states for subsets of ribosome com-ponent movements**
To assess which movements of individual ribosome components dominatethe kinetic sequence of tRNA translocation, we calculated the fastest progres-sion sequence using the movements of all ribosome components, of individ-ual ribosome components, or of a combination of them. To that aim, onlythe maximum free energy barriers from the respective subsets of ribosomecomponents were used for calculating the fastest progression sequences. Toquantify the similarity of these sequences to the sequence introduced by Fis-cher et al.1, the Kendall rank correlation coefficient τ was used, which reflectsthe minimum number of swaps of neighbouring states that are required toyield the desired sequence. Because a fully reversed sequence with negativeτ leaves the progression rate unchanged, the absolute value of τ was used.Further, to account for the cases where the sequence presented by Fischer etal.1 contains multiple substates for single states that have no specific orderassigned (pre1a, pre1b, etc.) the maximum absolute τ for comparison to anypermutation of substates was used.
After translocation, the tRNAs occupy other positions than before translo-cation, while body, head and L1-stalk return to their initial positions. Toquantify how the derived sequences are affected by this fact, we determineda second set of reaction sequences with the first position fixed to a pre1 state.

3.1 Refinement of atomic models 22
Supplementary Note 3 (Results)
3.1 Refinement of atomic models
The AP-, PE-, and E-model were refined against 13 cryo-EM maps usingDireX21. The complete set of all-atom ribosome models for the differentstates is depicted in Supplementary Fig. 1.
3.2 Comparison to recent crystal structures*
Supplementary Figure 2a compares tRNA positions in our models with tRNApositions in two crystal structures2 after aligning the binding site regions.For the comparison the pre1a and pre4 models were used which have thelowest RMSDs to these crystal structures (Fig. 1b). Even though the tRNAsused in our simulations and the tRNAs from the crystal structure representdifferent tRNA-species, they adopt almost the same position, especially inthe functionally important anticodon and CCA-tail regions.
3.3 Structural deviation during the simulations
For each simulation, the root mean square deviations (RMSD) relative to therespective starting structure and relative to the structure at 20 ns are shownin Supplementary Fig. 2b. In all simulations an RMSD of less than 8 Å wasobtained, which is very low for a system of this size. Typical values obtainedby other authors are ∼10 Å46. Note that the PE-model simulation startedfrom a crystal structure and thus can serve as a benchmark for the quality ofthe EM-fitted structures47. Notably, the RMSD values for the fitted structuresare similar or only slightly larger, thus underscoring the quality of thesestructures.
3.4 Independent MD based refinement
The independent MD based refinement against the pre1b cryo-EM map re-sulted in an RMSD of 3.26 Å relative to the corresponding structure obtainedusing DireX. Further, an RMSD of 4.54 Å was observed between the MD re-fined structure and the above mentioned crystal structure with a ribosomeincluding a P-site tRNA2. A comparable RMSD of 5.31 Å was found for theDireX refined pre1b structure (cf. Fig. 1b, solid green line).
The fact that the two structures obtained by the two refinement methodsare more similar to each other than to the reference crystal structure suggeststhat the refinement quality is independent of the choice of an elastic networkbased or an MD based refinement method.
3.5 Stereochemical parameters of the models**
To further assess the quality of our models, we have carried out a statisticalanalysis of various stereochemical quantities. Supplementary Table 2 showsthe deviation of the distributions of our models from those obtained from theprotein data bank (PDB). To fully incorporate the additional effect of the sim-ulations, the energy-minimzed refined structures and the energy-minimizedstructures after 100 ns of free MD simulation were used. Stereochemical pa-rameters were calculated using WHATCHECK48 and then averaged over allmodels (pre1a–post4). The ribosomal environment provides different con-ditions for protein and RNA folds than for most of the protein and RNA
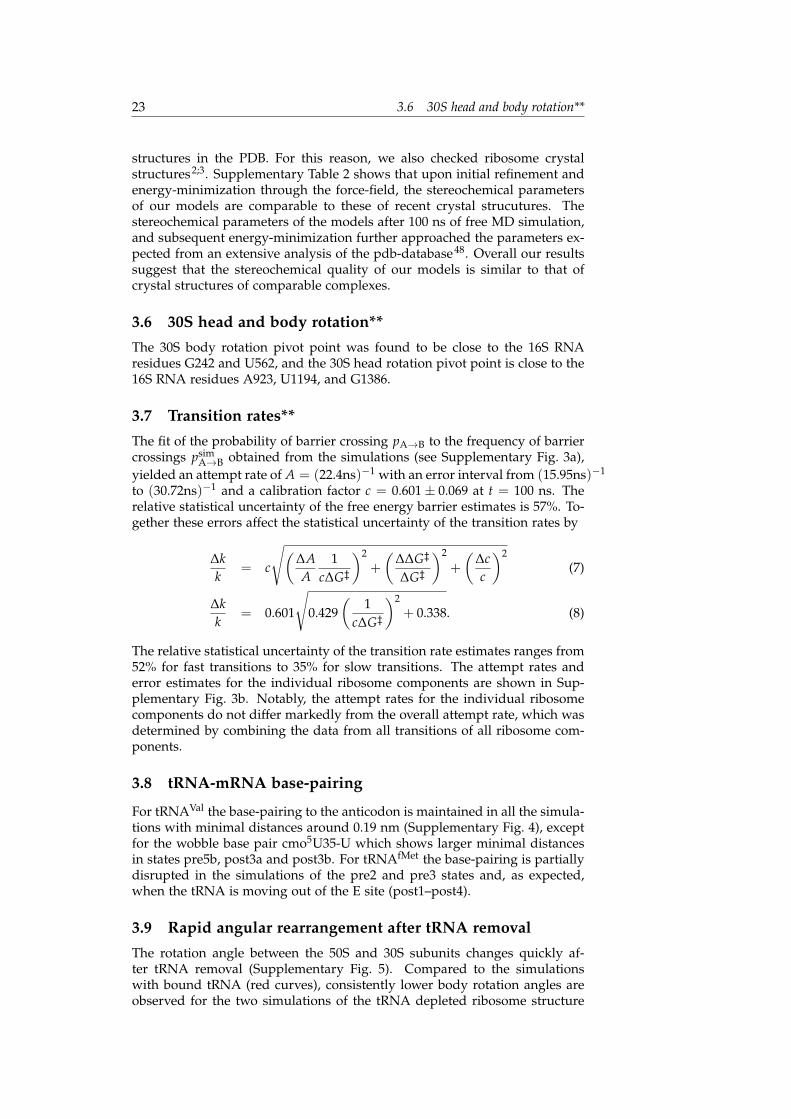
23 3.6 30S head and body rotation**
structures in the PDB. For this reason, we also checked ribosome crystalstructures2;3. Supplementary Table 2 shows that upon initial refinement andenergy-minimization through the force-field, the stereochemical parametersof our models are comparable to these of recent crystal strucutures. Thestereochemical parameters of the models after 100 ns of free MD simulation,and subsequent energy-minimization further approached the parameters ex-pected from an extensive analysis of the pdb-database48. Overall our resultssuggest that the stereochemical quality of our models is similar to that ofcrystal structures of comparable complexes.
3.6 30S head and body rotation**
The 30S body rotation pivot point was found to be close to the 16S RNAresidues G242 and U562, and the 30S head rotation pivot point is close to the16S RNA residues A923, U1194, and G1386.
3.7 Transition rates**
The fit of the probability of barrier crossing pA→B to the frequency of barriercrossings psim
A→B obtained from the simulations (see Supplementary Fig. 3a),yielded an attempt rate of A = (22.4ns)−1 with an error interval from (15.95ns)−1
to (30.72ns)−1 and a calibration factor c = 0.601± 0.069 at t = 100 ns. Therelative statistical uncertainty of the free energy barrier estimates is 57%. To-gether these errors affect the statistical uncertainty of the transition rates by
∆kk
= c
√(∆AA
1c∆G‡
)2+
(∆∆G‡
∆G‡
)2
+
(∆cc
)2(7)
∆kk
= 0.601
√0.429
(1
c∆G‡
)2+ 0.338. (8)
The relative statistical uncertainty of the transition rate estimates ranges from52% for fast transitions to 35% for slow transitions. The attempt rates anderror estimates for the individual ribosome components are shown in Sup-plementary Fig. 3b. Notably, the attempt rates for the individual ribosomecomponents do not differ markedly from the overall attempt rate, which wasdetermined by combining the data from all transitions of all ribosome com-ponents.
3.8 tRNA-mRNA base-pairing
For tRNAVal the base-pairing to the anticodon is maintained in all the simula-tions with minimal distances around 0.19 nm (Supplementary Fig. 4), exceptfor the wobble base pair cmo5U35-U which shows larger minimal distancesin states pre5b, post3a and post3b. For tRNAfMet the base-pairing is partiallydisrupted in the simulations of the pre2 and pre3 states and, as expected,when the tRNA is moving out of the E site (post1–post4).
3.9 Rapid angular rearrangement after tRNA removal
The rotation angle between the 50S and 30S subunits changes quickly af-ter tRNA removal (Supplementary Fig. 5). Compared to the simulationswith bound tRNA (red curves), consistently lower body rotation angles areobserved for the two simulations of the tRNA depleted ribosome structure

3.10 Influence of refinement accuracy on our conclusions* 24
(green). The interaction enthalpies of intersubunit bridge B1b between residuesof the 50S protein L5 (109–111, 114, 135, 141, 143, 145–146, 177) and 30S pro-teins S13 (2, 6, 8, 56-57, 60, 63–65, 69–70) and S19 (26) were calculated. Theinteraction enthalpies were found to be weaker for simulations without tR-NAs, indicating that the presence of tRNAs leads to a stabilization of largerotation angles by bridge B1b in the pre5b state. Figure 2b,c show histogramsof B1b interaction enthalpies and 30S body rotation angles extracted from thelast 50 ns of the simulations.
3.10 Influence of refinement accuracy on our conclusions*
To estimate if and to which extent our conclusions might be affected by pos-sible structural inaccuracies resulting from our refinement of an X-ray struc-ture against the 13 cryo-EM maps has on our conclusions, we repeated asimulation and our analyses using the pre3 structure with the tRNAfMet inan artificially perturbed conformation. This perturbed structure also obeysall stereochemical and energetic constraints set by the force field and is withinthe resolution limits set by the cryo-EM map of the pre3 state, with a tRNAconformation closer to that of the pre2 state. From a simulation starting fromthis perturbed structure, for the reaction coordinates (r.c.) shown Figs. 1c,e,one would expect the changes to mostly affect tRNAfMet motion, such thatit is similar to the motion in the pre2 state. Indeed, the r.c. values for thismotion are lower in the perturbed simulation, close to those observed in thepre2 state, and the tRNAfMet-L1 interaction enthalpy is weakened (data notshown). The tRNAVal-L16 interaction enthalpies are weaker in the pre3 statethan in the neighbouring states. Any change in the tRNAVal conformationin this state is expected to result in a stronger interaction enthalpy, as is thecase for the perturbed simulation. The changes observed, however, wouldnot have changed the qualitative picture of the interaction enthalpies offeredby Fig. 1c. Interestingly, the changes in body rotation angle observed in theperturbed pre3 state reflect the coupling between tRNA conformation andbody rotation reported in the main text (compare Fig. 2). The influence of theperturbation on the other motions is small.
Upon replacement of the pre3 state by the perturbed pre3 state in the thetransition rate estimation, the barrier heights for head rotation and tRNAVal
motion did not change significantly. In particular, only transition barrierslarger than ∼4 kT are affected corresponding to rates slower than 1/µs, thusleaving Fig. 1d unchanged.
3.11 Markov-state like representation of states and transitionbarriers**
Supplementary Fig. 6a shows a schematic representation of the translocationintermediate states as a Markov model.
3.12 Kinetic sequence of states**
The sequences of translocation intermediate states with the shortest overallhalf-time within the range of the stochastical uncertainties of the correctionfactor and barrier heights are pre1a, pre1b, pre2, pre4, pre3, pre5b, pre5a,post2a, post2b, post1, post3a, post3b and pre1a, pre1b, pre2, pre3, pre4,pre5b, pre5a, post2a, post1, post2b, post3a, post3b. They closely resemblethe sequence derived by Fischer et al.1 based on structural similarity.

25 3.13 Kinetic sequence of states for subsets of ribosome component movements**
Omitting states in the proposed sequences did not yield a faster overallhalf-time, with the exception of omitting the pre5b state. According to thisanalysis only pre5b is a possible ”off-track“ state, suggesting that all otherstates are kinetically relevant.
3.13 Kinetic sequence of states for subsets of ribosome com-ponent movements**
As shown in 3.12, sequences based on structural similarity reflect kinetic se-quences, i.e. the ones with the fastest progression rate for the whole ribo-some. Since sequence of translocation intermediate states presented by Fis-cher et al.1 is based on structural similarity of the tRNAs, the fastest progres-sion sequence based only on the barriers heights impeding tRNA movementsshould also match this structure based sequence. To test this idea, we deter-mined the sequences, including all 12 states with two tRNAs, with the fastestprogression rate for all 31 possible subsets of ribosome components. Indeed,Supplementary Fig. 6b shows that all fastest progression sequences includ-ing only tRNA movements match the structure based sequence. Further, theinclusion of movements of other ribosome components leaves sequence ofstates essentially unchanged, suggesting that the movement of the tRNAsdominates the movements of the other ribosome components. As a negativecontrol, we looked at the fastest progression sequences from body, head andL1-stalk movements without tRNA movements. Indeed, completely differentsequences were obtained, whose τ values are comparable to those of ran-domly drawn sequences (Supplementary Fig. 6b). Some of these sequencecontain multiple pre to post transtions.
Since the fastest progression sequences with the first position fixed to apre1 state are almost as similar to the structure based sequence as the oneswith an unfixed first state (data not shown), we conclude that the fact thatthe tRNAs occupy different positions before and after translocation, whilebody, head and L1-stalk return to their initial positions does not markedlyinfluence the determined sequences.
3.14 Contacts between the tRNAs and the ribosome and con-servation of involved protein residues*
The frequencies of contacts between the two tRNAs and the ribosome weredetermined for all states from the respective trajectories as described above.The contacting residues of L1, L5, and L16 are generally found to be clus-tered, e.g., D51–R60, R122–K141 and R164–K167 in L1, I43–K47, S72–Y82 inL5, M1–R10, R44–R59 and K76–E90 in L16 protein (Fig. 3b). All these contact-ing fragments have a high conservation degree and appear more conservedthan the protein on average.
To test whether contacting residues had in fact a higher degree of con-servation than the rest of the protein, we used a one-sided permutationtest49. Differences in means were calculated for the contacting and non-contacting surface residues. Then, the same difference was calculated forevery possible permutation of contacting and non-contacting groups. Thep-values were calculated as a proportion of sampled mean differences largerthan the observed value. The significance level was set at 0.05 (or 5%). In-deed, tRNA-contacting residues have a higher conservation degree for L1(p-value=0.0019), L5 (p-value=0.027) and L16 (p-value=1.05× 10⁻⁵) proteins,with an overall p-value=6.62× 10⁻⁸. The high degree of evolutionary conser-vation of the protein residues which were identified to contact tRNA during

SUPPLEMENTARY REFERENCES 26
translocation provides an independent evidence for their potential functionalimportance.
Overall, the contact entropy of tRNA-rRNA contacts is larger than that oftRNA-protein contacts: 64 % of the tRNA-rRNA contacts, but only 38 % ofthe tRNA-protein contacts have a contact entropy above 0.5. This means thatthere are more state-specific contacts between the tRNAs and the proteins,which is an interesting finding in itself.
Supplementary Tables 4a–4t list the frequencies of contacts between tRNAVal
and the ribosome for each state. Supplementary Tables ??–?? list the contactsbetween tRNAfMet and the ribosome. The gray-scale level of the cells in-dicates the frequency of atom-atom contacts corresponding to the residuepairs, white (0–12.5%), light gray (12.5–25%), dark gray (25–50%), and black(50–100%).
Supplementary References
[1] Fischer, N., Konevega, A., Wintermeyer, W., Rodnina, M. & Stark, H. Ribosome dynamicsand trna movement by time-resolved electron cryomicroscopy. Nature 466, 329–333 (2010).
[2] Dunkle, J. A. et al. Structures of the bacterial ribosome in classical and hybrid states of trnabinding. Science 332, 981 (2011).
[3] Zhang, W., Dunkle, J. A. & Cate, J. H. D. Structures of the ribosome in intermediate statesof ratcheting. Science 325, 1014 (2009).
[4] Hess, B., Kutzner, C., van der Spoel, D. & Lindahl, E. Gromacs 4: algorithms for highlyefficient, load-balanced, and scalable molecular simulation. J. Chem. Theory. Comput. 4, 435–447 (2008).
[5] Hornak, V. et al. Comparison of multiple amber force fields and development of improvedprotein backbone parameters. Proteins 65, 712–725 (2006).
[6] Berendsen, H. J. C., Grigera, J. R. & Straatsma, T. P. The missing term in effective pairpotentials. J. Phys. Chem. 91, 6269–6271 (1987).
[7] Joung, I. S. & Cheatham, T. E. Determination of alkali and halide monovalent ion parame-ters for use in explicitly solvated biomolecular simulations. J. Phys. Chem. B 112, 9020–9041(2008).
[8] Essmann, U. et al. A smooth particle mesh ewald method. J. Chem. Phys. 103, 8577–8593(1995).
[9] Feenstra, K. A., Hess, B. & Berendsen, H. J. C. Improving efficiency of large time-scalemolecular dynamics simulations of hydrogen-rich systems. J. Comput. Chem. 20, 786–798(1999).
[10] Hess, B. P-lincs: a parallel linear constraint solver for molecular simulation. J. Chem. TheoryComput. 4, 116–122 (2008).
[11] Bussi, G., Donadio, D. & Parrinello, M. Canonical sampling through velocity rescaling. J.Chem. Phys. 126, 014101 (2007).
[12] Vriend, G. What if: a molecular modeling and drug design program. J. Mol. Graphics 8,52–56 (1990).
[13] Gao, Y. et al. The structure of the ribosome with elongation factor g trapped in the post-translocational state. Science 326, 694–699 (2009).
[14] Yusupov, M. et al. Crystal structure of the ribosome at 5.5 angstrom resolution. Science 292,883–896 (2001).
[15] Jossinet, F. & Westhof, E. Sequence to structure (s2s): display, manipulate and interconnectrna data from sequence to structure. Bioinformatics 21, 3320 (2005).

27 SUPPLEMENTARY REFERENCES
[16] Theimer, C. A., Finger, L. D., Trantirek, L. & Feigon, J. Mutations linked to dyskeratosiscongenita cause changes in the structural equilibrium in telomerase rna. P. Natl. Acad. Sci.USA 100, 449–454 (2003).
[17] Grishaev, A., Ying, J., Canny, M. D., Pardi, A. & Bax, A. Solution structure of trna val fromrefinement of homology model against residual dipolar coupling and saxs data. J. Biomol.NMR 42, 99–109 (2008).
[18] Yusupova, G., Jenner, L., Rees, B., Moras, D. & Yusupov, M. Structural basis for messengerrna movement on the ribosome. Nature 444, 391–394 (2006).
[19] Wang, J., Wang, W., Kollman, P. A. & Case, D. A. Automatic atom type and bond typeperception in molecular mechanical calculations. J. Mol. Graph. Model. 25, 247–260 (2006).
[20] Pettersen, E. F. et al. Ucsf chimera - a visualization system for exploratory research andanalysis. J. Comput. Chem. 25, 1605–1612 (2004).
[21] Schröder, G., Brunger, A. & Levitt, M. Combining efficient conformational sampling with adeformable elastic network model facilitates structure refinement at low resolution. Struc-ture 15, 1630–1641 (2007).
[22] Ahmed, A. & Tama, F. Consensus among multiple approaches as a reliability measure forflexible fitting into cryo-em data. Journal of Structural Biology 182, 67–77 (2013).
[23] Berendsen, H. J. C., Postma, J. P. M., van Gunsteren, W. F., DiNola, A. & Haak, J. R. Molec-ular dynamics with coupling to an external bath. J. Chem. Phys. 81, 3684–3690 (1984).
[24] Parrinello, M. & Rahman, A. Polymorphic transitions in single crystals: A new moleculardynamicsmethod. J. Appl. Phys. 52, 7182 (1981).
[25] Bellare, J. R., Davis, H. T., Scriven, L. E. & Talmon, Y. Controlled environment vitrificationsystem: an improved sample preparation technique. J. Electron Micr. Tech. 10, 87–111 (1988).
[26] Ludtke, S. J., Baldwin, P. R. & Chiu, W. Eman: semiautomated software for high-resolutionsingle-particle reconstructions. J. Struct. Biol. 128, 82–97 (1999).
[27] Sander, B., Golas, M. M. & Stark, H. Automatic ctf correction for single particles basedupon multivariate statistical analysis of individual power spectra. J. Struct. Biol. 142, 392–401 (2003).
[28] Konevega, A. L. et al. Spontaneous reverse movement of mrna-bound trna through theribosome. Nat. Struct. Mol. Biol. 14, 318–324 (2007).
[29] van Heel, M., Harauz, G., Orlova, E. V., Schmidt, R. & Schatz, M. A new generation of theimagic image processing system. J. Struct. Biol. 116, 17–24 (1996).
[30] Sander, B., Golas, M. M. & Stark, H. Corrim-based alignment for improved speed in single-particle image processing. J. Struct. Biol. 143, 219–228 (2003).
[31] Orzechowski, M. & Tama, F. Flexible fitting of high-resolution x-ray structures into cryo-electron microscopy maps using biased molecular dynamics simulations. Biophysical Journal95, 5692–5705 (2008).
[32] Ratje, A. H. et al. Head swivel on the ribosome facilitates translocation by means of intra-subunit trna hybrid sites. Nature 468, 713–716 (2010).
[33] Amadei, A., Linssen, A. B. & Berendsen, H. J. C. Essential dynamics of proteins. Proteins17, 412–425 (1993).
[34] Halvorsen, K., Lesser, M. & Lundberg, A. A new method for estimating the axis of rotationand the center of rotation. J. Biomech. 32, 1221 – 1227 (1999).
[35] Gramkow, C. On averaging rotations. Int. J. Comput. Vision 42, 7–16 (2001).
[36] Blau, C. & Grubmuller, H. g_contacts: Fast contact search in bio-molecular ensemble data.Computer Physics Communications – (2013). Doi:10.1016/j.cpc.2013.07.018.
[37] Apweiler, R. et al. Ongoing and future developments at the Universal Protein Resource.Nucleic Acids Res. 39, D214–219 (2011).
[38] Edgar, R. C. MUSCLE: a multiple sequence alignment method with reduced time and spacecomplexity. BMC Bioinformatics 5, 113 (2004).

SUPPLEMENTARY REFERENCES 28
[39] Talavera, G. & Castresana, J. Improvement of phylogenies after removing divergent and am-biguously aligned blocks from protein sequence alignments. Syst. Biol. 56, 564–577 (2007).
[40] Jones, D. T., Taylor, W. R. & Thornton, J. M. The rapid generation of mutation data matricesfrom protein sequences. Comput. Appl. Biosci. 8, 275–282 (1992).
[41] Guindon, S. et al. New algorithms and methods to estimate maximum-likelihood phyloge-nies: assessing the performance of PhyML 3.0. Syst. Biol. 59, 307–321 (2010).
[42] Mayrose, I., Graur, D., Ben-Tal, N. & Pupko, T. Comparison of site-specific rate-inferencemethods for protein sequences: empirical Bayesian methods are superior. Mol. Biol. Evol.21, 1781–1791 (2004).
[43] Roux, B. The calculation of the potential of mean force using computer simulations. Comput.Phys. Commun. 91, 275–282 (1995).
[44] Kumar, S., Rosenberg, J., Bouzida, D., Swendsen, R. H. & Kollman, P. A. The weightedhistogram analysis method for free-energy calculations on biomolecules. i. the method. J.Comput. Chem. 13, 1011–1021 (1992).
[45] Hub, J. S., de Groot, B. L. & van der Spoel, D. g_wham - a free weighted histogramanalysis implementation including robust error and autocorrelation estimates. J. Chem.Theory Comput. 6, 3713–3720 (2010).
[46] Brandman, R., Brandman, Y. & Pande, V. S. A-site residues move independently from p-siteresidues in all-atom molecular dynamics simulations of the 70s bacterial ribosome. PLoSOne 7, e29377 (2012).
[47] de Groot, B. L., Engel, A. & Grubmüller, H. The structure of the aquaporin-1 water channel:a comparison between cryo-electron microscopy and x-ray crystallography. J. Mol. Biol. 325,485–493 (2003).
[48] Hooft, R. W. W., Vriend, G., Sander, C. & Abola, E. Errors in protein structures. Nature 381,272–272 (1996).
[49] Röhmel, J. Precision intervals for estimates of the difference in success rates for binaryrandom variables based on the permutation principle. Biometrical journal 38, 977–993 (2007).

78
4. Discussion
We will discuss the findings that were presented in the publications “Energybarriers and driving forces in tRNA translocation through the ribosome”[22]and the respective supplementary information with a focus on my personalcontributions. Then we will, in retrospect, discuss the assumptions, limita-tions and potential improvements to the methods used to obtain these resultsin the following sections. We will show, where different approaches mighthave been used and highlight new possible applications of the developedmethods.
We built an all-atom model of the ribosome using X-ray crystallographydata and refined it to thirteen cryo-EM densities from Fischer et. al [6] (Sup-plementary Fig. 1 in [22]). By that refinement we obtained an all-atom de-scription of intermediate states of tRNA translocation.
Validity and predictive power of our refined ribosome models has beenconfirmed by the agreement between our model and ribosome conformationslater found in X-ray structures [32] (Fig.1b in [22]). Bond length and angle dis-tribution quality as well as the overall stereochemical quality of our ribosomemodels matches that of X-ray structures (Supplementary Table 2 in [22]). Weconclude from our findings that models from cryo-EM refinement can parallelthe accuracy of X-ray structures, if the refinement is based on high-resolutioncryo-EM data and a good starting model. This high model quality further al-lows to reliably perform MD simulations with the refined models as startingstructures.
Quantifying ribosome movements from cryo-EM densities requires man-ual guidance in segmenting cryo-EM densities (Fig. 1.2a shows a segmentedribosome cryo-EM density). Instead, our refined models directly show themovement of the tRNAs, L1-stalk and small subunit body and head. We gen-erated ensembles from the refined models of the thirteen substates by 100 nsMD simulations. To identify the interaction patterns on ribosome parts thatare crucial for tRNA translocation, we first identified the movements that gov-ern translocation by exploring the structure of the ribosome free energy land-scape.
We initially proposed that the structure of the free energy landscape oftRNA translocation is governed by a hierarchy of barriers, as suggested byFrauenfelder (Fig. 1.6). Indeed, we found that this postulated hierarchy ofenergy barriers impedes the movement of the tRNAs, the L1-stalk as well asbody and head rotations (Fig. 1d in [22]). The Frauenfelder picture, in whicha hierarchy of energy barriers governs transitions between states with similar
79
free energy (Fig. 2.1), was initially proposed for myoglobin [14]. We find itconfirmed for the much larger and more complex ribosome.
Whereas the cryo-EM experiment determined the occupation probabilitiesof the energy minima in the energy landscape, our free energy barrier esti-mates through a harmonic approximation to the ensemble data estimated theprobability to find ribosome parts in transition states between two transloca-tion intermediates. Our simulations further allowed us not only to determinethe free energies of the transition states, but also how fast transitions occurfrom one state to another. To that aim, we linked the energy barriers to tran-sition rates using the fact that our molecular dynamics method (eq. (2.11))provides the correct thermodynamical ensemble and, additionally, dynamicinformation. We exploited this dynamic information by determining an over-all attempt rate and geometry factor by comparing observed transitions in oursimulation time to the expected transition probabilities from the free energybarrier estimate (section 2.4 and Supplementary Information in [22]).
The uncovered hierarchy of barriers (Fig. 1d in [22]) suggests a classifica-tion of ribosome substates into early pre states (pre1 and pre2), late pre-states(pre3-pre5), early post (post1-post2) and late post states (post3). The free en-ergy barrier between the pre2 and the pre3 state has been identified beforefrom the population analysis of small subunit body and head conformations[6]. We now find that not only body and head rotation impede the transitionfrom pre2 to pre3, but also the movement of both tRNAs. In fact, in the ma-jority of other states it is the tRNA movement, not body and head rotations,that impedes transitions.
Though translocation is presented as a sequence of intermediates, the ac-tual transition dynamic is a stochastic process in an energy landscape [6, 126].So far, it was unclear whether the sequence of translocation intermediatesin [6] is kinetically relevant. We tested the kinetic relevance of this linearsequence based on structural similarity by comparing it to the sequence ofstates that would show the fastest overall progression. To perform the meta-dynamics analysis that describes translocation as this stochastic process, wediscretized the continuum of translocation substates by a Markov model (Sup-plementary Fig. 5), where we assume that transitions in our Markov modelare given by the slowest of our estimated intrinsic transition rates. Using ourMarkov state model, we obtained the fastest progression sequence of substatesthat almost coincides with the sequence derived from purely geometric sort-ing, except for a swap between the post1 and post2 states. Together with thebarriers seen between these states, our data would now suggest to group thepost1 and post2 states into one.
We have also addressed the question whether “dead-end” states exist intRNA translocation using the same framework (Supplementary Information sec-tion 3.12). On the one hand this seems unlikely in the context of a ribosomethat evolved to be highly efficient, on the other hand these states might exist askinetic controls. Our results suggested pre5b is a “dead end”, though removalof this state from the fastest progression sequence did not significantly alterthe overall sequence progression rate. More precise kinetic data on the transi-tion rates from the pre5 states would be required to increase the significance
80
of this finding. The current rate estimates, especially for transitions from pre5states to the early post states are coarse due to the large barriers that slow thepre- to post-translocation state transition.
After describing the ribosome dynamics as a concerted motion of tRNA,L1-stalk, body, and head movements, we assessed the influence of the indi-vidual parts on the meta-dynamics described by the Markov model above byexcluding the rate limiting effect of individual movements, as well as com-binations of ribosome movements (Supplementary Information Fig. 6b). Theanalysis allowed us to conclude that tRNA movements determine the kineticsequence of states.
We extracted how ribosome parts individually contribute to the barriersbetween states and showed a possible way to connect them to the overallribosome transitions with our Markov model. These rates for the movementof single ribosome parts were obtained using complete ribosome simulations,whereas, to estimate the transition rates, we treated them as independent fromthe ribosome. This procedure allowed us to extract “intrinsic” transition rates,and to disentangle the mutual influence of the ribosome parts.
We further asked, what interactions create the free energy barriers andhow they are overcome. Detailed protein residue and RNA nucleotide inter-actions are not accessible to cryo-EM, but through our thirteen all-atom de-scriptions of translocation intermediates. The stability of these interactions isan ensemble property whereas our refined models represent single ribosomeconformations. This ensemble property of cryo-EM densities, is reflected inthe smeared out cryo-EM densities of the flexible ribosome parts (compare thegreen and purple tRNA densities of the two 12Å resolution cryo-EM densitiesin Fig. 1.5b), but lacks the resolution to identify interactions on a per-residuelevel. From our simulation ensemble information we extracted the interactionstability, i.e. the contact frequency between the tRNAs and ribosomal proteins(Fig. 1c in [22]). This extraction of contact frequencies from 50 000 confor-mational snapshots was only possible through the efficient contact findingalgorithm we developed [21].
We identified three main tRNAs interaction partners on the large riboso-mal subunit, L1, L5 and L16 (Fig. 1c in [22]). The tRNAs interact in distinctpatches with L16 and L5, stepping along L16 and sliding along L5 (Fig. 5in [22]), and interact in one strong contact patch with the L1-stalk that servesto pull the tRNA out of the ribosome.
To address whether the identified mechanisms are anecdotal or universalto prokaryotic translocation, we further analysed the obtained contact fre-quencies. We assumed that the contacting residues should be more than av-erage conserved if they are universally relevant. Through a comparison ofmore than 6 000 protein sequences we found that contact patches are indeedconserved (Fig. 3b in [22]).
The underlying experimental data as well as each of the above describedsteps, the model building, the cryo-EM refinement, MD simulations, contactsanalysis, free energy barrier estimates, attempt rate and geometry factor deter-mination as well as the Markov model of translocation are based on numerousassumptions, which we will discuss now. Further, we will show where the de-

81 4.1. BIOCHEMICAL BACKGROUND
veloped methods are not limited to the ribosome, but applicable to relatedsystems.
4.1 Biochemical background
The biochemical setup used to gather the cryo-EM data for our ribosomemodel refinement is special in many ways. First, it uses an in vitro model as-say of E. coli ribosomes. Second, it does not use EF-G and GTP to drive translo-cation, but thermal fluctuations in equilibrium. Third, the used buffer condi-tions and the specific tRNA pair tRNAVal/tRNAfMet favor retro-translocation,not the canonical forward translocation [127].
In vitro assays neglect cellular effects. In vivo, translocation rates are dom-inated by the availability of cognate tRNA [128] and influenced, e.g., by molec-ular crowding in the cell and the number of ribosomes reading mRNA in closeproximity to each other [129, 130]. Though these effects do affect the overallprotein expression rate, we assume that they do not alter the fundamentalproperties of ribosome function we want to explore. Their influence on ri-bosome function is only understood, if we understand translation in its mostbasic setting.
Escherichia coli is an established model organism in spectroscopic, X-ray,and cryo-EM measurements. Mechanisms that are specific for E. coli mightbe mistaken as general features of prokaryotic translocation. However, theextremely high evolutionary conservation of ribosomes and the large struc-tural similarity to extromphile prokaryotes from completely different environ-ments, such as Haloarcula marismortui, Thermus thermophilus, and Deinococcusradiodurans renders it unlike that the features we describe are specific to E.coli. In contrast, we find many key features of prokaryotic ribosomes even ineukaryotes [131, 132] — to an extent that a common naming convention forribosomal proteins in eukaryotes and prokaryotes is being developed.
The biological relevance of the cryo-EM data we used has been challengedon the grounds that the tRNAs translocate “backwards” through the ribosome.Due to initial excess of tRNAfMet in solution, the preferred tRNAfMet pathwayis the seemingly paradox tRNAfMet entry through the ribosomal exit site, andsubsequent movement to the peptidyl site. However, after 20 minutes, the ex-cess concentration of tRNAfMet is depleted [6] and the system is equilibrated1.In an equilibrium system, all processes are time-independent, thus the retro-translocation setup cannot have any influence on the translocation pathway.Indeed, different translocation pathways for forward and retro-translocationin equilibrium would generate directed motion without energy cost, a per-petuum mobile. Further, Fischer et al. showed that during equilibration onlythe ratio between pre-and post-translocation state population changes, not thepopulations within pre- and post-translocation states.
Yet, the special buffer conditions and the combination tRNA species re-quired to induce retro-translocation in an excess of tRNAfMet might affect the
1More precisely it approached equilibrium beyond measurable deviations, true equilibrium isonly reached in the infinite limit.

4.2. CRYO-EM RECONSTRUCTION 82
translocation pathway. Though the tRNA species does affect the overall rate oftranslocation [133], we expect little influence on the tRNA translocation path-way. First, the tRNAs are very similar in structure and ribosome binding sitesvery narrowly fit the tRNAs, sterically prohibiting large deviations. Second,the observed order-of-magnitude difference in rates translates to a free energydifference of (log 10)kBT ≈ 2.3kBT, which is below the error margin of ourrate estimates.
Though we do expect an influence of the buffer conditions on our esti-mated transition rates, a rigidifying effect of Mg2+ ions on RNA [134], forexample, we do not expect a large effect on our conclusions, because ion re-arrangement on RNA is very slow compared to our simulation time-scales[134].
Through the use of GTP, EF-G drives translocation forward, i.e. in pres-ence of EF-G and GTP, the pre-translocation states are rapidly depleted andthe occupation of post-translocation states is favoured. However, it is un-known to what extent EF-G alters the reaction pathway during tRNA translo-cation. Yet, we assume that the fundamental principles of movement of tRNAthrough the ribosome remain unchanged, because the available structuraldata [135, 136, 137, 138] suggests that EF-G mainly acts to prevent backwardtranslocation. Further, our estimated interaction enthalpies largely exceed theenergy provided by GTP hydrolysis, rendering a complete change in the free-energy valley that defines tRNA translocation unlikely.
Still, EF-G catalyzed GTP hydrolysis might act as a “gate-opener” to adistinct free energy “valley” in which tRNAs move during EF-G catalyzedtranslocation. Here, by the very long (20 min) equilibration time that the usedcryo-EM setup allowed, we would very likely already observe such a second“valley”. Overall, though the translocation kinetics are definitely affected bythe presence of EF-G, we assumed that translocation paths and ribosome-tRNA interactions are very similar with and without EF-G present.
4.2 Cryo-EM reconstruction
For our refinement, we used a subset of the sharpened cryo-EM density mapsinstead of the raw data, ca. 2 million cryo-EM micrographs. Though thecryo-EM reconstruction method carfully tested against overfitting of the datathrough crossover refinement, a small inherent bias towards the ensemble ofobtained cryo-EM densities and to the assigned free energies remains. Thisis due to the fact that for a reconstruction of cryo-EM maps configurationalspace is binned to yield a sufficient number of micrographs to reconstructa cryo-EM density. The hierarchical sorting routine that was employed, forexample, bins body rotations in 5 steps. Fig. 4.1 shows that any partitioningof state space changes the free energy landscape. Uneven partitioning mighteven introduce artificial high energy transition state intermediates, an effectthat was avoided in the hierarchical sorting routine employed by Fischer et al.
The fact that a different sorting routine, e.g. a shift of the 30S body rotationbins by one degree, would result in a slightly different reconstructed ensembleof structures with different assigned free energies shows that the cryo-EM raw

83 4.3. CRYO-EM REFINEMENT
Figure 4.1: Partioning in state space changes a flat free energy landscape G0and introduces a free energy barrier.
data ensemble information is not fully exploited.A potential way to further exploit the cryo-EM raw data would be the as-
signment of free energies to ribosome configurations that were generated inour MD simulations using the 2d projection images from cryo-EM. To performthis task, the ribosome configurations would be projected into two dimensionsand subsequently assigned to cryo-EM micrographs. A subsequent countingof the assigned projections would yield an occupation probability for a ribo-some configuration directly from the cryo-EM raw data. Sifting through themost likely configurations would in turn yield a reconstruction method simi-lar to electron density reconstruction methods from free-electron laser diffrac-tion images.
4.3 Cryo-EM refinement
From the ensemble of fifty available cryo-EM density maps we choose a sub-set of thirteen translocation intermediates. First, we selected the best resolvedcryo-EM densities of major tRNA configurations (pre1-post4 states). Wherecryo-EM maps with significantly differing features for these major tRNA con-figurations had been resolved, we complemented our initial set with thesemaps (in the pre1, pre5, post2 and post3 state) to best represent the completeset of fifty resolved cryo-EM densities.
Few of the many possible atom configurations that fit cryo-EM data arebiologically and physically meaningful. Cryo-EM refinement poses an incom-plete problem where additional constraints, a force-field, need to be intro-duced to obtain the desired, physically and biologically relevant, atom config-urations. With these additional constraints however, the refined structures arean overinterpretation of cryo-EM data if not cross-validated independently.
Of the variety of cryo-EM refinement procedures we chose to maximizethe cross-correlation of the atom structure to the cryo-EM density over usingthe inverted cryo-EM density as an additional attractive potential energy termin the force-field [139]. This eliminated the need for strong constraints on

4.4. FORCE-FIELD AND SAMPLING 84
secondary structure that were necessary in previous approaches to refine cryo-EM densities of the ribosome [64].
To test the influence of the refinement procedure choice on the resultingconformation, we used DireX [122] and implemented a refinement based onthe algorithm of Orzechowski et al. [140], using a physical potential as a force-field instead of the dynamic elastic network model used in DireX. The im-proved results with the physical potential at the expense of increased compu-tational cost suggests that initial configurations obtained by refinement withDireX should be further refined using a physical potential.
Though all atom positions were available from the refinement proceduresand our refinement did predict a crystal structure conformation (Fig.1b in [22])within the range of thermal fluctuations, we made sure not to over-interpretour refined structures by ensemble and spacial averages. The ensemble aver-ages were performed over all frames of MD simulations of the refined struc-tures and thus minimzed the effect of artifacts in the single refinement struc-ture. The spacial averages were performed over protein residues and RNAnucleotides, when describing local interactions.
Two key questions are to be addressed in future refinement approaches.First, present refinement procedures yield a single conformation, whereas thecryo-EM map represents a conformation ensemble. This issue is currentlybeing addressed by Vaiana et al. through implementing a target functionthat maximizes the cross-correlation to an average map from an ensemble ofstructures, as proposed in [141].
The second question is, how strongly a force-field may influence the cryo-EM refinement without overfitting the data. A force-field free refinement, willyield a very high correlation at the cost of an unphysical, chemically mean-ingless structure, whereas a refinement guided predominantly by the force-field would result in poor correlation to the input density. The weighting λbetween force-field V(x) and experimental input C(x) might be addressed us-ing a Hamiltonian replica-exchange method [142], where multiple refinementHamiltonians H(λ) = λV(x) + (1− λ)C(x) are used simultaneously. The en-semble reweighting technique would further yield the required ensemble ofrefined structures as described above and might prevent the common refine-ment problem where refinement algorithms are trapped in local minima.
4.4 Force-field and sampling
The conclusions we draw for mechanisms of tRNA translocation from oursimulations rely on a sufficiently accurate description by the MD force-fieldand sampling of ribosome conformations.
Apart from the conventional limitations sketched in section 2.2, due tothe high flexibility and charge of RNA compared to proteins, parametrizationof RNA force-fields for simulations is especially challenging [134, 143]. Cor-rectly accounting for long-range electrostatic interactions is crucial for RNAsimulations [143]. To accurately model these long-range electrostatic interac-tions, we used the particle-mesh-ewald method [144]. The accurate descrip-tion of RNA-ion interactions poses an additional challenge to the force-field

85 4.5. TRANSITION RATE ESTIMATES
[143]. Though the ion parameters by Joung et al. [145] largely improvedthe simulation properties of monovalent ions and especially prevents theirunphysical aggregation in solution as observed in previous ribosome simu-lations [146], the interactions of Mg2+ with RNA are not fully described bycurrent models. However, multivalent ions in our simulations were placed intheir binding sites as resolved in crystal structures. Because ion rearrange-ment on RNA is much slower than the time-scales of our simulations, weassume that these short-comings in force-field parametrization do not affectour conclusions [134].
Influence of the force-field parameters on the simulation results is usuallytested by performing the same set of simulations with another force-field. Wedid not perform this canonical test against another force-fields, because noother force-field for RNA and protein simulations with modified RNA nu-cleotide parameters was available that was parametrized independently fromthe amber99sb-ildn force-field [147] we used.
Despite the vast computational time (≈ 2 · 106 CPU hours) that we used forsampling ribosome conformations with highly efficient algorithms [148], wecannot rule out that single simulations are “stuck” in improbable excursions inthe free energy landscape. To test how robust our conclusions are with respectto excursions in the energy landscape, we performed one of our simulationswith an improbable, distorted, tRNA conformation in the pre3 state. We foundthat our conclusions were not affected and that the overall conclusions remainvalid. Multiple parallel simulations from the same refined conformations havenow been performed to address this concern further. Yet, essential movementson the meso-scale between the 100ns dynamics from our simulations and themuch larger time-scales reflected in the cryo-EM data might not be covereddue to our limited sampling.
To address our limited sampling of ribosome conformations, we extendedour sampling capacities over the past three years. Accessible ribosome sim-ulation time-scales, and thus the available sampling, increased by a factor often through an increase in computer power and more efficient simulation al-gorithms, such as domain-decomposition, electro-static calculations and theuse of graphical processing units.
4.5 Transition rate estimates
The limited sampling time will also have a direct effect on the estimated freeenergy barriers of the ribosome. Figure 4.2 shows a one-dimensional examplesystem, where limited sampling of two intial configurations creates an ap-parent free energy barrier in a flat free energy landscape. The estimated freeenergy barrier in this system only vanishes after infinitely long sampling.
Also in our simulations, barriers might be overestimated due to limitedsampling. First, the large differences in free energy barrier estimates from con-formationally close states speak against a locally flat ribosome energy land-scape. Second, the observed range of attempt rates for ribosome parts between(20 ns)−1 and (40 ns)−1 (Supplementary Fig.3b in [22]) indicates that in thesame simulation different ribosome parts experience different dynamics, also

4.5. TRANSITION RATE ESTIMATES 86
Figure 4.2: Sampling on a flat energy landscape from two distinct confor-mations within limited time induces a barrier between states. Sampling ina flat energy landscape (G∞ in the chart on the bottom left) started simultane-ously in states A and B at t = 0 (left charts). Propagation of the probabilitydensities through the Smoluchowsky equation up to t=1 shows that the bar-rier between states A and B only vanishes for t → ∞, even assuming perfectsampling at all time points.
contradicting a locally flat free energy landscape. Overestimation of barriersdue to limited sampling is further accounted for by the global geometry factorc.
The different approximations that were made to obtain the free energybarrier estimates and then, via global attempt rate and geometry factor, thetransition rates, introduce systematic errors. For example, the harmonic ap-proximation yields poor results, if the underlying energy-landscape is veryanharmonic. Note however, that for the relatively small structural deviationsfrom the starting structures during our simulations, the second order Taylor-expansion of the energy landscape captures the essential features of the localfree energy landscape. The quality of the estimates will be increased in futureapplications by taking into account the local geometry at the barrier top andin the minima via eq. (2.20).
Fig. 4.1 shows that the way state space is partitioned strongly influencesthe obtained free energy profile and the estimated barriers. A method weused to partition ribosome conformational space is the choice of a few reac-tion coordinates (by principal component analysis) as shown in Fig. 2.1. If,for example, the reaction coordinate shown in Fig. 2.1 is oriented at anotherangle, the separation of states A and B is less pronounced. Fig. 4.3 showsan example, where the seperation of states vanishes all together. A rotationof the reaction coordinates in Fig 4.3 by π/2, however, will separate the twostates in one reaction coordinate. A method that finds these rotations is thefull correlation analysis [149]. This method empirically minimizes the mutualinformation, thus maximizes the separation, between reaction coordintates bya series of orthogonal transformations of the reaction coordinates obtained by

87 4.5. TRANSITION RATE ESTIMATES
Figure 4.3: A free energy barrier in a two dimensional energy landscapedisappears upon projection on the individual reaction coordinates. Twostates A and B are well separated by an energy barrier in the two-dimensionalproduct space (top right) of reaction coordinate one and two (r.c. 1 and r.c.2),but have no barrier in the individual reaction coordinates. In consequence,the inclusion of multiple dimensions is necessary for good free energy barrierestimates. If r.c.1 and r.c.2 describe different ribosome parts, this shows thatcoupling between ribosome parts might induce free energy barriers that areinvisible if the parts are treated independently.

4.5. TRANSITION RATE ESTIMATES 88
PCA. Applied to our simulations, it will yield reaction coordinates that betterpronounce free energy barriers. However, we expect that we well capture thefree energy barriers impeding the movement of ribosome parts with three re-action coordinates, since the inclusion of additional reaction coordinates didnot change the relative height of the estimated free energy barriers (data notshown). On the other hand, the relative free energy barrier heights did changesignificantly with the inclusion of a second and third reaction coordinate, in-dicating that a naive one- or two-dimensional harmonic approximation to thefree energy landscape is insufficient.
We extracted a single attempt rate for all transitions from our ribosomesimulations by comparing the frequency of succesfull attempts to overcomeenergy barriers in our simulations to the estimated height of these barriers.Longer simulations would also see attempts to overcome larger barriers, andin turn lead to a lower attempt rate estimate, thus the single attempt rate weobserve is coupled to the time-scale of the simulation and to the height ofthe free energy barriers we analyze. Dropping the assumption of one singleattempt rate and instead using subsets of translocation intermediates to anattempt rate for each subset of states might provide a tool to uncover specialfeatures of the free energy landscape of a limited subset of translocation in-termediates, though more extended sampling of ribosome configurations willbe needed for such an approach.
In modeling the transition rates we did not consider the following three ef-fects. First, we did not analyze other 50S subunit movements than the L1-stalk.Due to the very similar conformation of the 50S subunit, L1-stalk excluded,throughout all tRNA translocation states, we did not expect a significant con-tribution to the overal ribosome movement. Second, for the ribosome to tran-sition from from one translocation intermediate state to another, the concertedmotion of all its parts will be required. We assumed, that the slowest of thesemotions dominates the transition. Especially if the time-scales for the indi-vidual transition of the slowest ribosome parts is similar, this will affect theoverall ribosome transition rate even if these movements are energetically un-coupled. We did not consider this second effect in our analysis, because weexpect the error in the estimates of the individual rates to be larger than this“concerted motion” effect. Third, as sketched in Fig. 4.3, the transitions mightbe hindered by larger energy barriers than estimated due to energetic cou-pling between different ribosome parts, which we did not yet cover in ouranalysis.
To overcome high barriers hindering transitions and reveal the pathwaysthat connect the minima on the free energy landscape, sampling might beenhanced at the cost of restricting the system to chosen reaction coordinates.One of these methods is umbrella sampling, which we already employed toyield the free energy profile of the tRNA L1-stalk interaction (Fig.1f in [22]).Possible other approaches are temperature replica exchange simulations orsimulations where the cryo-EM density of another state is used as a biasingpotential. Our harmonic approximation in the free energy landscape alsoestimates the location of the free energy barrier (eq. 2.18) and thus yields atransition state approximation we did not employ so far.
89 4.6. INTERACTION ENTHALPIES AND CONTACT FREQUENCIES
The transition rate estimates might help to perform meta-dynamics onother sparsely sampled energy landscapes, e.g. the energy landscape of pro-tein folding and also to extract local diffusion properties in energy landscapes[150] from local attempt rate estimates.
4.6 Interaction enthalpies and contact frequencies
Interaction enthalpies have been described on a per-residue basis betweentRNA and the large subunit proteins L1, L5, and L16 after filtering relevantresidue-nucleotide interactions according to contact frequencies. Other inter-actions will also drive tRNA translocation, e.g. the interactions between thelarge and the small ribosomal subunit. The analysis of these interactions wentbeyond the scope of the publication [22]. Preliminary analysis by Bock et al.showed that, similar to tRNA translocation, 30S body and head rotation ismade efficient through levelling the interaction enthalpy [151]. Though um-brella sampling and interaction enthalpy analysis revealed that the L1-stalkpulls the tRNA, it remains unclear what drives the L1-stalk.
The contact frequencies between tRNA and ribosomal proteins L1, L5,and L16 from our simulations (Supplementary Tables 4a-4t in [22]) reflectthe strength of residue-nucleotide interactions per translocation intermediatestate. Thus they directly suggest residues for mutagenesis that might stabilizeor destabilize specific translocation intermediates.
4.7 Fast contacts search algorithm and implementa-tion
Though initially developed for finding contacts between ribosome parts, theimplementation of the fast contacts search algorithm addresses the issue of thescaling of data analysis algorithms in the simulation field. Extracting mean-ingful information from simulation data is as important as the data generationitself, but most efforts so far have been spent on increasing the efficiency ofsampling algorithms, whereas data analysis tools scale poorly. We imple-mented an algorithm that scales approximately on the order of n log n, wheren is this particle number. This scaling now is similar to the MD algorithms[148].
Yet, algorithms for finding atoms in near vicinity to each other were pre-viously employed in molecular dynamics simulations. One example is the“neighbor-list” approach used in MD simulations, where a contact search ismade efficient through keeping a list of neighbours from previous simulationframes. We did not use this approach explicitly in our algorithm, because theframes we analyzes are too uncorrelated to efficiently employ the neighbor-information from previously analyzed frames. However, by initially reusingthe atom sorting from previous frames, we implicitly use this neighbor infor-mation in our implementation.
Another frequently used approach is a “grid-search” that assignes atoms togrid-cells, or, even more efficiently, to nodes of a balanced octree and reduces

4.8. APPLICATIONS OF FAST CONTACTS SEARCH 90
computational cost by calculating distances only for atoms that were assignedto related grid cells or nodes, respectively. Such an algorithm is very efficientfor multiple distance queries, but not used in our approach, because of thelarge overhead of initially creating the grid or octree structure. Our algorithmimplicitly uses the advantages of the octree approach. It is implicit in theso-called bboxes and their repeated splitting (cf. Fig.1 in [21]). In contrastto a standard octree approach, only the nodes of the octree structure (calledbboxes in [21]) are created that contribute to find contacts within the givendistance.
A theoretical proof for the lower- and upper bounds of scaling and datastorage needs for the fast contact search went beyond the scope of our work,but exhaustive empirical testing did not show significant deviation from theassumed n log n scaling (Fig. 2 in [21] and scaling of intersubunit contactssearch between differently sized parts of ribosome subunits, data not shown).The scaling behaviour of our fast contact search appears worse than the re-porting time for other range searches, log n. However, the pre-processing timeis the crucial factor for our applications, because we query each data set onlyonce. Thus we match the expected n log n scaling behaviour of other reportedefficient algorithms if the necessary pre-processing is considered [152].
4.8 Applications of fast contacts search
On the ribosome, during A-site decoding, small configurational changes aretransmitted to trigger a response in distant sites (cf. section 1.1). Further in-tersubunit interactions might serve as a “dial control” of tRNA translocation.An analysis of contact patch changes that is now made possible with our im-plementation of efficient contacts search, can serve as a tool to explain howthese configurational changes are transmitted through the ribosome.
Our implementation of a fast contact search algorithm in g_contacts, al-lowed to identify the contacts that are involved in allosteric transitions inhemoglobin [20]. Further it has been applied to study the impact of pointmutations to EF-Tu, and as a tool to identify flipped lipid head groups incoarse-grain simulations (Leonov and Bubnis, personal communication).
Another application of our fast contact search implementation lies in thecharacterization of intrinsically disordered proteins. These proteins do nothave a defined fold, but explore a large variety of conformations. Standardmethods to characterize ensemble data fail in this case, e.g. the root meansquare deviation measure with respect to a reference structure, because a welldefined reference structure is missing. Also contact maps that describe thepair-wise interactions of protein residues are not applicable due to the unde-fined fold and thus wide variety of residue-residue interactions. This problemis solved by the extension of this contact map to a contact frequency map thatreflects the averaged contact map over a large ensemble of conformations. Ourimplementation of fast contacts search now allows calculation of this contactfrequency map, which was previously prohibitively expensive.
Further the conatct frequency map provides a similarity measure compara-ble to the widely used RMSD, but which does not rely on a reference structure.

91 4.9. FOLLOW-UP PROJECTS
Here the deviation of the contact frequency map averaged over a simulationwindow from the contact frequency map of the whole simulation is used.
4.9 Follow-up projects
With our ribosome simulations and the respective analysis tools we laid thefoundations for a series of follow up studies that we will present now.
Translation comprises a hierarchy of chemical processes (Fig. 1.3). Themethods developed in this work, the ribosome model, cryo-EM refinementroutines, the fast contact search, and our method to characterize the ribosomefree energy landscape, will facilitate the study of the processes adjacent toelongation: A-site decoding, peptide bond formation and termination, and,further up the tier, ribosomal initiation, termination, and recycling.
The prerequisite for these further studies is accompanying structural datato refine and validate our all-atom ribosome model. With this data on hand,the same methods to characterize the ribosome free energy landscape and theinteractions of its parts, will indeed aid to advance to the “post-structural” eraof ribosome research also in other processes than translocation [126].
This structural data is already on hand for a biochemical complex thatoccurs during selenocysteine (Sec) incoorporation in peptide elongation. Se-lenocystein is a non-canonical amino-acid that is essential for a variety ofprokaryotes, archea and eukaryotes. It is part of the catalytic center of se-lenoproteins that catalyses redox-reactions. The mechanism of selenocysteinincorporation into proteins is unusual, because the tRNA that delivers Sec tothe ribosome reads a stop codon. This reading is only performed if the down-stream mRNA exhibits a special fold, which is triggered through the mRNAselenocystein insertion (SECIS) sequence. This special fold triggers selB bid-ing, which in turn aids Sec-tRNASec accommodation to the ribosme similar toEF-Tu. Due to the low yield of the ribosomal elongation factor selB promotedaccommodation of Sec-tRNASec, structure determination has been difficult.Now, a high-resolution cryo-EM density will allow to model the ribosome inatomic detail in complex with SelB (Fischer et al., personal communication).From that starting point, we aim at understanding how the SECIS fold isrecognised by selB and how selB aids selenocystein incorporation through theensemble information that is provided by MD simulations of this complex. Incontrast to the approach of this thesis, where we extracted general featuresof translocation from a special setup, we aim here at the selenocystein spe-cific ribosome interactions. The current problems in refining high-resolutioncryo-EM densities of the selB-ribosome complex might be overcome by theHamiltonian replica exchange protocol described above.
Translocation in eukaryotes is yet less understood than in prokaryotes.The novel high-resolution crystal structures of eukaryotic ribosomes [131] al-low MD simulations on the resolved states, as performed by Sanbonmatsuet al. (conference proceedings), though the structural detail of translocationintermediate states and detailed kinetic information of tRNA translocation ineukaryotes is still lacking and renders a similar approach to ours challengingat the time [132].

4.9. FOLLOW-UP PROJECTS 92
An outstanding challenge that is closest related to the presented work is tounderstand the role of EF-G in translocation. The transition rate estimates inour work already provide a hypothetical mechanism for EF-G (Fig.1d in [22]).By binding to the pre3 state EF-G binding might block the excursions of thetRNAVal as well as the body from the pre3 and pre4 to the pre1 state conforma-tions (cf. purple and red lines connecting pre3, pre4 and pre1b in Fig. 1d [22]).Until recently, the lack of structural data prohibited a computational studyof EF-G dynamics on the ribosome. Now, new crystal structures of EF-Gbound to the ribosome have been solved and provide atomic models for EF-Gbinding to the ribosome [136, 137, 138]. Here, cryo-EM structures of furthertranslocation intermediates with EF-G would provide the necessary additionalinformation to follow the same approach as in this thesis.

93
5. Acknowledgements
I would like to thank Prof. Helmut Grubmüller for his honest support and afair share of his time. Lars Bock and Andrea Vaiana, for their patience withme in a truly colloborative project. Niels Fischer for his time to explain anddiscuss his cryo-EM data. Holger Stark and Marina Rodnina for their aid inconceiving the manuscript for [22] and insight into the current state-of-the artin cryo-EM and the ribosome field. Wolfgang Wintermeyer for his advice onthe manuscript for [22]. Martin Fechner and Ansgar Eszterman for systemadministration beyond expected. Eveline Heineman for efficient and prag-matic organisation of the department. Petra Kellers for thorough manuscriptreading as well as teaching of style and writing. Benjamin von Ardenne, SarahRauscher and Timo Graen for reading the thesis manuscript. Vytautas Gapšys,Bela Voss, Greg Bubnis and Martin Hoefling for scientific discussions. MartinStumpe and Martin Vesper for a good start in the department and practi-cal advise. I thank Antje Erdmann, Frauke Bergmann and Michaela Böttcherfor their support through the GGNB program and patience in answering myquestions.
Eventually, I shall acknowledge funding from the Excellence Stipends ofthe International Max-Planck Research School as well as the DFG ExcellenceCluster 171 (Nanoscale Microscopy and Molecular Physiology of the Brain).

94
6. Curriculum Vitae
Personal Data
Address Lange-Geismar-Strasse 237073 Göttingen
Email [email protected]
Place of Birth Merseburg
Nationality German
Education
2010-date PhD student at MPI-BPC Göttingen
Jan 2011 – Jun 2013 Excellence Stipend of the International Max-Planck Research School
2009 Diploma in Physics at Georg-August-University GöttingenEffect of posttranscriptional modifications and Mg2+ ions on tRNA struc-ture and flexibility
Sep 2003 Internship at Institute for Low Temperature Plasma Physics Greifswald
2003 Abitur Georg Cantor Gymnasium Halle/Saale
Work Experience
Nov 2006 – Feb 2007 Logistics Admin InBev Praha
Sep 2006 – Nov 2006 Communication Specialist (Quality Assistance) Icon Communication Cen-tres Praha
95
Bibliography
[1] F Crick. Central Dogma Of Molecular Biology, Nature, 227(5258), 561–, 1970.
[2] A. J Hamilton and D. C Baulcombe. A species of small antisense RNA in posttranscriptionalgene silencing in plants., Science, 286(5441), 950–2, 1999.
[3] A Bird. Perceptions of epigenetics., Nature, 447(7143), 396–8, 2007.
[4] S Prabakaran, G Lippens, H Steen, and J Gunawardena. Post-translational modification: na-ture’s escape from genetic imprisonment and the basis for dynamic information encoding.,Wiley interdisciplinary reviews. Systems biology and medicine, 4(6), 565–83, 2012.
[5] H Grosjean. DNA and RNA modification enzymes: structure, mechanism, function andevolution, 2009.
[6] N Fischer, A Konevega, W Wintermeyer, M Rodnina, and H Stark. Ribosome dynamicsand tRNA movement by time-resolved electron cryomicroscopy, Nature, 466(7304), 329–333,2010.
[7] M Selmer, C. M Dunham, F. V Murphy, A Weixlbaumer, S Petry, A. C Kelley, J. R Weir, andV Ramakrishnan. Structure of the 70S ribosome complexed with mRNA and tRNA, Science,313(5795), 1935–1942, 2006.
[8] W DeLano. The PyMOL Molecular Graphics System, 2002.
[9] T. R Cech. Structural biology - The ribosome is a ribozyme, Science, 289(5481), 878–879,2000.
[10] M. V Rodnina, M Beringer, and W Wintermeyer. How ribosomes make peptide bonds,Trends in Biochemical Sciences, 32, 20–26, 2006.
[11] J Chen, A Tsai, S O’Leary, A Petrov, and J Puglisi. Unraveling the dynamics of ribosometranslocation., Current Opinion in Structural Biology, 22(6), 804–14, 2012.
[12] A Spirin. The ribosome as a conveying thermal ratchet machine., Journal of biological chem-istry, 284(32), 21103–19, 2009.
[13] J Frank and R Gonzalez. Structure and Dynamics of a Processive Brownian Motor: TheTranslating Ribosome, Annual Review of Biochemistry, 79(1), 381–412, 2010.
[14] H Frauenfelder, S. G Sligar, and P. G Wolynes. The energy landscapes and motions ofproteins., Science, 254(5038), 1598–603, 1991.
[15] J Munro, K Sanbonmatsu, , and S Blanchard. Navigating the ribosome’s metastable energylandscape, Trends in Biochemical Sciences, 34(8), 390–400, 2009.
[16] J Noeske and J. H. D Cate. Structural basis for protein synthesis: snapshots of the ribosomein motion., Current Opinion in Structural Biology, 22(6), 743–9, 2012.
[17] W Zhang, J. A Dunkle, and J. H. D Cate. Structures of the Ribosome in Intermediate Statesof Ratcheting, Science, 325(5943), 1014–1017, 2009.
[18] P. C Whitford, R. B Altman, P Geggier, D. S Terry, and J. B Munro. in Ribosomes : Structure,Function, and Dynamics, (Springer Vienna, VIENNA). pages 303–319. 2011.
[19] I Wohlgemuth, C Pohl, J Mittelstaet, A Konevega, and M Rodnina. Evolutionary optimiza-tion of speed and accuracy of decoding on the ribosome., Philosophical transactions - RoyalSociety. Biological sciences, 366(1580), 2979–86, 2011.

BIBLIOGRAPHY 96
[20] M Vesper and B de Groot. Collective dynamics underlying allosteric transitions inhemoglobin., PLoS Computational Biology, 9(9), e1003232, 2013.
[21] C Blau and H Grubmuller. g_contacts: Fast contact search in bio-molecular ensemble data,Computer Physics Communications, 184(12), 2856 – 2859, 2013.
[22] L. V Bock, C Blau, G. F Schroder, I. I Davydov, N Fischer, H Stark, M. V Rodnina, A. C Va-iana, and H Grubmuller. Energy barriers and driving forces in tRNA translocation throughthe ribosome, Nature Structural & Molecular Biology, advance online publication, –, Novem-ber 2013.
[23] B Laursen, H Sorensen, H Sorensen, K Mortensen, and H. S Petersen. Initiation of proteinsynthesis in bacteria., Microbiology and molecular biology reviews, 69(1), 101–23, 2005.
[24] A Myasnikov, A Simonetti, S Marzi, and B Klaholz. Structure-function insights intoprokaryotic and eukaryotic translation initiation., Current Opinion in Structural Biology,19(3), 300–9, 2009.
[25] P Milon and M Rodnina. Kinetic control of translation initiation in bacteria., Critical reviewsin biochemistry and molecular biology, 47(4), 334–48, 2012.
[26] B Cooperman, Y Goldman, C Chen, I Farrell, and J Kaur. in Ribosomes : Structure, Function,and Dynamics, (Springer Vienna, VIENNA). pages 339–348. 2011.
[27] E. K. Y Leung, N Suslov, N Tuttle, R Sengupta, and J Piccirilli. The mechanism of peptidyltransfer catalysis by the ribosome, volume 80 of Annual Review of Biochemistry. StanfordUniversity Press, Palo Alto, Calif., 2011.
[28] M Rodnina, A Rodnina, V Savelsbergh, W Katunin, and Wintermeyer. Hydrolysis of GTPby elongation factor G drives tRNA movement on the ribosome, Nature, 385(6611), 37–41,1997.
[29] L. P Gavrilova, O. E Kostiashkina, V. E Koteliansky, N. M Rutkevitch, and A. S Spirin.Factor-free () and factor-dependent systems of translation of polyuridylic acid by Es-cherichia coli ribosomes., Journal of Molecular Biology, 101(4), 537–52, 1976.
[30] S Shoji, S Walker, and K Fredrick. Reverse translocation of tRNA in the ribosome., MolecularCell, 24(6), 931–942, 2006.
[31] B Klaholz. Molecular recognition and catalysis in translation termination complexes., Trendsin Biochemical Sciences, 36(5), 282–92, 2011.
[32] J. A Dunkle, L Wang, M. B Feldman, A Pulk, V. B Chen, G. J Kapral, J Noeske, J. S Richard-son, S. C Blanchard, and J. H. D Cate. Structures of the Bacterial Ribosome in Classical andHybrid States of tRNA Binding, Science, 332(6032), 981–984, 2011.
[33] J Panecka and J Trylska. in Theroy and applications in computational chemistry: the first decadeof the second millenium, (American Institute of Physics, New York). volume 1456 of AIPConference Proceedings. pages 207–214. 2012.
[34] J Aqvist, C Lind, J Sund, and G Wallin. Bridging the gap between ribosome structureand biochemistry by mechanistic computations., Current Opinion in Structural Biology, 22(6),815–23, 2012.
[35] M Rodnina. The ribosome as a versatile catalyst: reactions at the peptidyl transferasecenter., Current Opinion in Structural Biology, 23(4), 595–602, 2013.
[36] M Rodnina. in Ribosomes : Structure, Function, and Dynamics, (Springer Vienna, VIENNA).pages 199–212. 2011.
[37] H Noller. How does the ribosome sense a cognate tRNA?, Journal of Molecular Biology,425(20), 3776–7, 2013.
[38] P Moore. Ribosomal ambiguity made less ambiguous., Proceedings of the National Academyof Sciences of the United States of America, 110(24), 9627–8, 2013.
[39] N Reynolds, B Lazazzera, and M Ibba. Cellular mechanisms that control mistranslation.,Nature Reviews Microbiology, 8(12), 849–56, 2010.
[40] I Wohlgemuth, C Pohl, and M Rodnina. Optimization of speed and accuracy of decodingin translation., EMBO Journal, 29(21), 3701–9, 2010.

97 BIBLIOGRAPHY
[41] L Cochella and R Green. An active role for tRNA in decoding beyond codon:anticodonpairing., Science, 308(5725), 1178–80, 2005.
[42] M Rodnina, K Gromadski, U Kothe, and H.-J Wieden. Recognition and selection of tRNAin translation., FEBS Letters, 579(4), 938–42, 2005.
[43] R. A Marshall, C Aitken, M Dorywalska, and J Puglisi. Translation at the Single-MoleculeLevel, Annual Review of Biochemistry, 77, 177–203, 2008.
[44] J Eargle, A Black, A Sethi, L Trabuco, and Z. L Schulten. Dynamics of Recognition betweentRNA and elongation factor Tu., Journal of Molecular Biology, 377(5), 1382–405, 2008.
[45] J Aqvist, M Leijonmarck, O Tapia, and W. F van Gunsteren. A molecular dynamics studyof the C-terminal fragment of the L7/L12 ribosomal protein. Secondary structure motionin a 150 picosecond trajectory., Journal of Molecular Biology, 183(3), 461–77, 1985.
[46] Dagget and M Levitt. A molecular dynamics simulation of the c-terminal fragment of theL7/L12 ribosomal-protein in solution, Chemical Physics, 158(2-3), 501–512, 1991.
[47] M Diaconu, F Schlunzen, U Kothe, N Fischer, J Harms, A Tonevitsky, H Stark, M Rodnina,and M Wahl. Structural basis for the function of the ribosomal L7/12 stalk in factor bindingand GTPase activation., Cell, 121(7), 991–1004, 2005.
[48] H Demirci, F Murphy, E Murphy, S Gregory, A Dahlberg, and G Jogl. A structural basisfor streptomycin-induced misreading of the genetic code., Nature communications, 4, 1355,2013.
[49] A Tsai, S Uemura, M Johansson, E Puglisi, R. A Marshall, C Aitken, J Korlach, M Ehrenberg,and J Puglisi. The impact of aminoglycosides on the dynamics of translation elongation.,Cell Reports, 3(2), 497–508, 2013.
[50] A. C Vaiana, E Westhof, and P Auffinger. A molecular dynamics simulation study of anaminoglycoside/A-site RNA complex: conformational and hydration patterns., Biochimie,88(8), 1061–73, 2006.
[51] K. Y Sanbonmatsu. Energy landscape of the ribosomal decoding center., Biochimie, 88(8),1053–9, 2006.
[52] A Vaiana and K Sanbonmatsu. Stochastic gating and drug-ribosome interactions., Journalof Molecular Biology, 386(3), 648–61, 2009.
[53] T.-H Lee, S Blanchard, H Kim, J Puglisi, and S Chu. The role of fluctuations in tRNAselection by the ribosome., Proceedings of the National Academy of Sciences of the United Statesof America, 104(34), 13661–5, 2007.
[54] P Khade, X Shi, and S Joseph. Steric complementarity in the decoding center is importantfor tRNA selection by the ribosome., Journal of Molecular Biology, 425(20), 3778–89, 2013.
[55] X Agirrezabala, E Schreiner, L Trabuco, J Lei, R. O Meoz, K Schulten, R Green, and JFrank. Structural insights into cognate versus near-cognate discrimination during decod-ing., EMBO Journal, 30(8), 1497–507, 2011.
[56] Y. P Semenkov, W Wintermeyer, and M. V Rodnina. The ”allosteric three-site model” ofelongation cannot be confirmed in a well-defined ribosome system from Escherichia coli.,Proceedings of the National Academy of Sciences of the United States of America, 93(22), 12183–8,1996.
[57] A Petropoulos and R Green. Further in vitro exploration fails to support the allostericthree-site model., Journal of Biological Chemistry, 287(15), 11642–8, 2012.
[58] N Demeshkina, L Jenner, E Westhof, M Yusupov, and G Yusupova. A new understandingof the decoding principle on the ribosome., Nature, 484(7393), 256–9, 2012.
[59] N Demeshkina, L Jenner, E Westhof, M Yusupov, and G Yusupova. New structural insightsinto the decoding mechanism: translation infidelity via a GuU pair with Watson-Crickgeometry., FEBS Letters, 587(13), 1848–57, 2013.
[60] B. L Grigorenko, M. S Shadrina, I. A Topol, J. R Collins, and A. V Nemukhin. Mechanism ofthe chemical step for the guanosine triphosphate (GTP) hydrolysis catalyzed by elongationfactor Tu., Biochimica et Biophysica Acta, 1784(12), 1908–17, 2008.
BIBLIOGRAPHY 98
[61] A Adamczyk and A Warshel. Converting structural information into an allosteric-energy-based picture for elongation factor Tu activation by the ribosome., Proceedings of the NationalAcademy of Sciences of the United States of America, 108(24), 9827–32, 2011.
[62] A Aleksandrov and M Field. Mechanism of activation of elongation factor Tu by ribosome:catalytic histidine activates GTP by protonation., RNA, 19(9), 1218–25, 2013.
[63] I Besseova, K Reblova, N Leontis, and J Sponer. Molecular dynamics simulations suggestthat RNA three-way junctions can act as flexible RNA structural elements in the ribosome.,Nucleic Acids Research, 38(18), 6247–64, 2010.
[64] L. G Trabuco, E Villa, K Mitra, J Frank, and K Schulten. Flexible fitting of atomic structuresinto electron microscopy maps using molecular dynamics, Structure, 16(5), 673–683, 2008.
[65] E Villa, J Sengupta, L. G Trabuco, J LeBarronc, W. T Baxterc, T. R Shaikhc, R. A Grassuccid,P Nissene, M Ehrenberg, K Schulten, and J Frank. Ribosome-induced changes in elonga-tion factor Tu conformation control GTP hydrolysis, Proceedings of the National Academy ofSciences of the United States of America, 106(4), 1063–1068, 2009.
[66] R. C Thompson and P. J Stone. Proofreading of the codon-anticodon interaction on ribo-somes., Proceedings of the National Academy of Sciences of the United States of America, 74(1),198–202, 1977.
[67] P Whitford, P Geggier, R Altman, S Blanchard, J Onuchic, and K Sanbonmatsu. Accommo-dation of aminoacyl-tRNA into the ribosome involves reversible excursions along multiplepathways, RNA, 16(6), 1196–1204, 2010.
[68] T Caulfield and B Devkota. Motion of transfer RNA from the A/T state into the A-siteusing docking and simulations., Proteins, 80(11), 2489–500, 2012.
[69] P Whitford, J Onuchic, and K Sanbonmatsu. Connecting energy landscapes with experi-mental rates for aminoacyl-tRNA accommodation in the ribosome., Journal of the AmericanChemical Society, 132(38), 13170–1, 2010.
[70] H White. Coenzymes as fossils of an earlier metabolic state, Journal of Molecular Evolution,7(2), 101–104, 1976.
[71] A Sievers, M Beringer, M Rodnina, and R Wolfenden. The ribosome as an entropy trap.,Proceedings of the National Academy of Sciences of the United States of America, 101(21), 7897–901, 2004.
[72] S Trobro and J Aqvist. Mechanism of peptide bond synthesis on the ribosome, PNAS, 102,12395–12400, 2005.
[73] P Sharma, Y Xiang, M Kato, and A Warshel. What are the roles of substrate-assistedcatalysis and proximity effects in peptide bond formation by the ribosome?, Biochemistry,44(34), 11307–14, 2005.
[74] M Rodnina and W Wintermeyer. The ribosome as a molecular machine: the mechanismof tRNA-mRNA movement in translocation., Biochemical Society transactions, 39(2), 658–62,2011.
[75] Y. P Semenkov, M. V Rodnina, and W Wintermeyer. Energetic contribution of tRNA hybridstate formation to translocation catalysis on the ribosome, Nature structural biology, 7(11),1027–1031, 2000.
[76] P. C Spiegel, D. N Ermolenko, and H. F Noller. Elongation factor G stabilizes the hybrid-state conformation of the 70S ribosome, RNA, 13(9), 1473–1482, 2007.
[77] D Moazed and H. F Noller. Intermediate states in the movement of transfer RNA in theribosome., Nature, 342(6246), 142–8, 1989.
[78] J. B Munro, R. B Altman, N O’Connor, and S. C Blanchard. Identification of two distincthybrid state intermediates on the ribosome, Molecular Cell, 25(4), 505–517, 2007.
[79] S. E Walker, S Shoji, D Pan, B. S Cooperman, and K Fredrick. Role of hybrid tRNA-bindingstates in ribosomal translocation, Proceedings of the National Academy of Sciences, 105(27),9192–9197, 2008.
[80] H Kim, J Yeom, H Ha, J Kim, and K Lee. Functional analysis of the residues C770 and G771of E coli 16S rRNA implicated in forming the intersubunit bridge B2c of the ribosome,Journal of microbiology and biotechnology, 17(7), 1204–1207, 2007.
99 BIBLIOGRAPHY
[81] X Agirrezabala, J Lei, J Brunelle, R Ortiz-Meoz, R Green, and J Frank. Visualization ofthe Hybrid State of tRNA Binding Promoted by Spontaneous Ratcheting of the Ribosome,Molecular Cell, 32(2), 190–197, 2008.
[82] P Julian, A Konevega, S Scheres, M Lazaro, D Gil, and W Wintermeyer. Structure ofratcheted ribosomes with tRNAs in hybrid states, Proceedings of the National Academy ofSciences of the United States of America, 105(44), 16924–16927, 2008.
[83] W Li and J Frank. Transfer RNA in the hybrid P/E state: Correlating molecular dynamicssimulations with cryo-EM data, Proceedings of the National Academy of Sciences of the UnitedStates of America, 104(42), 16540–16545, 2007.
[84] J Frank and R. K Agrawal. A ratchet-like inter-subunit reorganization of the ribosomeduring translocation., Nature, 406(6793), 318–22, 2000.
[85] A Ratje, J Loerke, A Mikolajka, M Brunner, P Hildebrand, and A Starosta. Head swivel onthe ribosome facilitates translocation by means of intra-subunit tRNA hybrid sites, Nature,468(7324), 713–U143, 2010.
[86] P Cornish, D Ermolenko, H Noller, T Ha, and D Ermolenko. Spontaneous intersubunitrotation in single ribosomes., Molecular Cell, 30(5), 578–588, 2008.
[87] J Fei, A Richard, J Bronson, and R Gonzalez. Transfer RNA-mediated regulation of ribo-some dynamics during protein synthesis, Nature structural & molecular biology, 18(9), 1043–U106, 2011.
[88] L Trabuco, E Schreiner, J Eargle, P Cornish, and T Ha. The Role of L1 Stalk-tRNA Interactionin the Ribosome Elongation Cycle, Journal of Molecular Biology, 402(4), 741–760, 2010.
[89] Z Zhang, K Sanbonmatsu, and G Voth. Key intermolecular interactions in the E. coli70S ribosome revealed by coarse-grained analysis., Journal of the American Chemical Society,133(42), 16828–38, 2011.
[90] P. C Whitford, S. C Blanchard, J. H. D Cate, and K. Y Sanbonmatsu. Connecting the Kineticsand Energy Landscape of tRNA Translocation on the Ribosome, PLoS Computational Biology,9(3), e1003003, 03 2013.
[91] R Zwanzig. Diffusion in a rough potential., Proceedings of the National Academy of Sciences ofthe United States of America, 85(7), 2029–30, 1988.
[92] I Fernandez, C Ng, A Kelley, G Wu, Y.-T Yu, and V Ramakrishnan. Unusual base pairingduring the decoding of a stop codon by the ribosome., Nature, 500(7460), 107–10, 2013.
[93] J Sund, M Ander, and J Aqvist. Principles of stop-codon reading on the ribosome., Nature,465(7300), 947–50, 2010.
[94] M Laurberg, H Asahara, A Korostelev, J Zhu, S Trakhanov, and H Noller. Structural basisfor translation termination on the 70S ribosome., Nature, 454(7206), 852–7, 2008.
[95] A Weixlbaumer, H Jin, C Neubauer, R Voorhees, S Petry, A Kelley, and V Ramakrishnan.Insights into translational termination from the structure of RF2 bound to the ribosome.,Science, 322(5903), 953–6, 2008.
[96] A Korostelev, H Asahara, L Lancaster, M Laurberg, A Hirschi, J Zhu, S Trakhanov, W Scott,and H Noller. Crystal structure of a translation termination complex formed with releasefactor RF2., Proceedings of the National Academy of Sciences of the United States of America,105(50), 19684–9, 2008.
[97] E Jaynes. Information Theory and Statistical Mechanics, Physical review, 106(4), 620–630,1957.
[98] J Bryngelson and P Wolynes. Intermediates and Barrier Crossing in a Random Energy-Model (with Applications to Protein Folding), Journal of physical chemistry, 93(19), 6902–6915, 1989.
[99] P Hanggi, P Talkner, and M Borkovec. Reaction-Rate Theory - 50 Years after Kramers,Reviews of modern physics, 62(2), 251–341, 1990.
[100] V Kenkre, E Montroll, and M Shlesinger. Generalized master equations for continuous-timerandom walks, Journal of Statistical Physics, 9(1), 45–50, 1973.
[101] H Kramers. Brownian motion in a field of force and the diffusion model of chemicalreactions, Physica, 7, 284–304, 1940.

BIBLIOGRAPHY 100
[102] H Brinkman. Brownian Motion in a Field of Force and the Diffusion Theory of ChemicalReactions, Physica, 22(U), 29–34, 1956.
[103] M Von Smoluchowski. Uber Brownsche Molekularbewegung unter Einwirkung aussererKrafte und deren Zusammenhang mit der verallgemeinerten diffusionsgleichung, Ann.Phys, 48, 1103, 1915.
[104] S Chandrasekhar. Stochastic problems in physics and astronomy, Revs Modern Physics, 15(1),2–89, 1943.
[105] R Landauer and J Swanson. Frequency Factors in Thermally Activated Process, physicalreview, 121(6), 1668–&, 1961.
[106] J Langer. Theory of Nucleation Rates, Physical Review Letters, 21(14), 973–&, 1968.
[107] P Langevin. Sur la théorie du mouvement brownien, Comptes rendus hebdomadaires desséances de l’Académie des sciences, 146, 530–533, 1908.
[108] W. E van Gunsteren and H. J. C Berendsen. Computer Simulation Of Molecular DynamicsMethodology Applications and Perspectives In Chemistry, Angewandte Chemie. Internationaledition in English, 29(9), 992–1023, 1990.
[109] B. J Alder and T. E Wainwright. Studies in Molecular Dynamics. I. General Method, TheJournal of Chemical Physics, 31(2), 459–466, 1959.
[110] M Born and R Oppenheimer. Zur Quantentheorie der Molekeln, Annalen der Physik, 389(20),457–484, 1927.
[111] E Hairer, C Lubich, and G Wanner. Geometric numerical integration illustrated by theStormer-Verlet method, Acta numerica, 12, 399–450, 2003.
[112] P Auffinger and E Westhof. RNA solvation: A molecular dynamics simulation perspective,Biopolymers, 56(4), 266–274, 2000.
[113] J Norberg and L Nilsson. Molecular dynamics applied to nucleic acids, Accounts of ChemicalResearch, 35(6), 465–472, 2002.
[114] T Darden, D York, and L Pedersen. Particle mesh Ewald: An N-log(N) method for Ewaldsums in large systems, Journal of Chemical Physics, 98, 10089–10092, 1993.
[115] S Nose and M. L Klein. Constant Pressure Molecular-dynamics for Molecular-systems,Molecular Physics, 50(5), 1055–1076, 1983.
[116] W Hoover. Canonical Dynamics - Equilibrium Phase-Space Distributions, Physical review.A, Atomic, molecular, and optical physics, 31(3), 1695–1697, 1985.
[117] H. J. C Berendsen, J. P. M Postma, W. F van Gunsteren, A DiNola, and J. R Haak. Moleculardynamics with coupling to an external bath, Journal of Chemical Physics, 81(8), 3684–3690,October 1984.
[118] F. C Bernstein, T. F Koetzle, G. J. B Williams, E. F Meyer, M. D Brice, J. R Rodgers, OKennard, T Shimanouchi, and M Tasumi. Protein Data Bank - Computer-Based ArchivalFile For Macromolecular Structures, Journal of Molecular Biology, 112(3), 535–542, 1977.
[119] D Ermak and J McCammon. Brownian Dynamics with Hydrodynamic Interactions, theJournal of chemical physics, 69(4), 1352–1360, 1978.
[120] J Dubochet, M Adrian, J Lepault, J. J Chang, J. C Homo, A. W McDowall, and P Schultz.Cryo-electron microscopy of vitrified specimens., Quarterly reviews of biophysics, 21(2), 129–228, 1988.
[121] B Sander, H Stark, and M. M Golas. Corrim-based alignment for improved speed in single-particle image processing., Journal of structural biology, 143(3), 219–28, 2003.
[122] G. F Schroder, A. T Brunger, and M Levitt. Combining efficient conformational samplingwith a deformable elastic network model facilitates structure refinement at low resolution,Structure, 15(12), 1630–1641, 2007.
[123] K Pearson. On lines and planes of closest fit to systems of points in space., PhilosophicalMagazine, 2(7-12), 559–572, 1901.
[124] K Halvorsen, M Lesser, and A Lundberg. A new method for estimating the axis of rotationand the center of rotation, Journal of Biomechanics, 32(11), 1221 – 1227, 1999.
101 BIBLIOGRAPHY
[125] C Gramkow. On Averaging Rotations, International Journal of Computer Vision, 42, 7–16, 2001.
[126] P Moore. How Should We Think About the Ribosome?, Annual review of biophysics, 41(1),1–19, 2012.
[127] A. L Konevega, N Fischer, Y. P Semenkov, H Stark, W Wintermeyer, and M. V Rodnina.Spontaneous reverse movement of mRNA-bound tRNA through the ribosome, Nature struc-tural & molecular biology, 14(4), 318–324, 2007.
[128] W. F Anderson. The effect of tRNA concentration on the rate of protein synthesis., Proceed-ings of the National Academy of Sciences of the United States of America, 62(2), 566–73, 1969.
[129] J. R Warner, A Rich, and P. M Knopf. A multiple ribosomal structure in protein synthesis.,Proceedings of the National Academy of Sciences of the United States of America, 49(1), 122–9,1963.
[130] S Proshkin, A. R Rahmouni, A Mironov, and E Nudler. Cooperation between translat-ing ribosomes and RNA polymerase in transcription elongation., Science, 328(5977), 504–8,2010.
[131] A Ben-Shem, N de Loubresse, S Melnikov, L Jenner, G Yusupova, and M Yusupov. Thestructure of the eukaryotic ribosome at 3.0 Å resolution., Science, 334(6062), 1524–9, 2011.
[132] D Wilson. The Structure and Function of the Eukaryotic Ribosome, Cold Spring Harborperspectives in biology, 4(5), 2012.
[133] H Gingold and Y Pilpel. Determinants of translation efficiency and accuracy., MolecularSystems Biology, 7, 481, 2011.
[134] D. E Draper. A guide to ions and RNA structure, RNA, 10(3), 335–343, 2004.
[135] Y Gao, M Selmer, C Dunham, A Weixlbaumer, A Kelley, and V Ramakrishnan. The Struc-ture of the Ribosome with Elongation Factor G Trapped in the Posttranslocational State,Science, 326(5953), 694–699, 2009.
[136] A Pulk and J. H. D Cate. Control of ribosomal subunit rotation by elongation factor G.,Science, 340(6140), 1235970–U77, 2013.
[137] D Tourigny, I Fernandez, A Kelley, V Ramakrishnan, and I FernÃandez. Elongation fac-tor G bound to the ribosome in an intermediate state of translocation., Science, 340(6140),1235490–U148, 2013.
[138] J Zhou, L Lancaster, J Donohue, and H Noller. Crystal structures of EF-G-ribosome com-plexes trapped in intermediate states of translocation., Science, 340(6140), 1236086–U69,2013.
[139] A Ahmed and F Tama. Consensus among multiple approaches as a reliability measure forflexible fitting into cryo-EM data., Journal of structural biology, 182(2), 67–77, 2013.
[140] M Orzechowski and F Tama. Flexible Fitting of High-Resolution X-Ray Structures intoCryoelectron Microscopy Maps Using Biased Molecular Dynamics Simulations, BiophysicalJournal, 95(12), 5692–5705, 2008.
[141] J Pitera and J Chodera. On the Use of Experimental Observations to Bias Simulated En-sembles, Journal of Chemical Theory and Computation, 8(10), 3445–3451, 2012.
[142] K Hukushima and K Nemoto. Exchange Monte Carlo method and application to spin glasssimulations, Journal Of The Physical Society Of Japan, 65(6), 1604–1608, 1996.
[143] Y Hashem and P Auffinger. A short guide for molecular dynamics simulations of RNAsystems, Methods, 47(3), 187–197, 2009.
[144] U Essmann, L Perera, M. L Berkowitz, T Darden, H Lee, and L. G Pedersen. A smoothparticle mesh Ewald method, Journal of Chemical Physics, 103(19), 8577–8593, 1995.
[145] I Joung. Determination of alkali and halide monovalent ion parameters for use in explicitlysolvated biomolecular simulations, The journal of physical chemistry. B, 112(30), 9020–9041,2008.
[146] K Sanbonmatsu, S Joseph, and C Tung. Simulating movement of tRNA into the ribosomeduring decoding, Proceedings of The National Academy of Sciences of the United States, 102(44),15854–15859, Nov 1 2005.

BIBLIOGRAPHY 102
[147] V Hornak, R Abel, A Okur, B Strockbine, A Roitberg, and C Simmerling. Comparison ofmultiple Amber force fields and development of improved protein backbone parameters,Proteins: Structure, Function, and Bioinformatics, 65(3), 712–725, 2006.
[148] B Hess, C Kutzner, D van der Spoel, and E Lindahl. GROMACS 4: Algorithms for highlyefficient, load-balanced, and scalable molecular simulation, Journal of Chemical Theory andComputation, 4(3), 435–447, 2008.
[149] O. F Lange and H Grubmueller. Full correlation analysis of conformational protein dynam-ics, Proteins, 70(4), 1294–1312, 2008.
[150] B Wang, J Kuo, S Bae, and S Granick. When Brownian diffusion is not Gaussian., NatureMaterials, 11(6), 481–5, 2012.
[151] C Blau, L Bock, G Schroeder, N Fischer, H Stark, A Vaiana, and H Grubmuller. ContactsBetween Ribosome Parts Refined by Molecular Dynamics Simulations, Biophysical journal,102(3), 69A–69A, 2012.
[152] J Erickson and P Agarwal. Geometric range searching and its relatives. Advances in Dis-crete and Computational Geometry, Contemporary Mathematics, 223, 1–56, 1999.


![SMALL ORGAN4 Is a Ribosome Biogenesis Factor · SMALL ORGAN4 Is a Ribosome Biogenesis Factor Involved in 5.8S Ribosomal RNA Maturation1[OPEN] Rosa Micol-Ponce,a,2,3 Raquel Sarmiento-Mañús,a,2](https://static.fdocuments.net/doc/165x107/60b23bf6ec73ad33ea5d9718/small-organ4-is-a-ribosome-biogenesis-small-organ4-is-a-ribosome-biogenesis-factor.jpg)