Transfer of radionuclides and toxic elements from the ...
93
Transfer of radionuclides and toxic elements from the Princess mine dump to water in Roodepoort, South Africa Sibusiso Goodwill Dlamini 11111111 Im Ill 11 1 11111 M06007261EI Mini-dissertation submitted in partial fulfilment of the requirements for the degree Master of Science in Applied Radiation Science and Technology at the Mafikeng Campus of the North-West University Supervisor: Prof M. M. Mathuthu Co-Supervisor: Prof M. V. Tshivhase November 2014 /lCCY'.1.: ..... _ . ---·•-..--·-·---- L·"··- .. b .~. -~....... •. ... • 1 .... ;:_ =-rv
Transcript of Transfer of radionuclides and toxic elements from the ...

Transfer of radionuclides and toxic elements from the Princess mine dump to water in Roodepoort, South Africa
Sibusiso Goodwill Dlamini
11111111 Im Ill 11 111111 M06007261EI
Mini-dissertation submitted in partial fulfilment of the requirements for the degree Master of Science in Applied Radiation Science and Technology at the Mafikeng Campus of the
North-West University
Supervisor: Prof M. M. Mathuthu
Co-Supervisor: Prof M. V. Tshivhase
November 2014
/lCCY'.1.: ..... _ . ---·•-..--·-·----L·"··- .. b ~ .~. -~....... •. ... • 1 .... ;:_ =-rv

DECLARATION
I declare that this dissertation is my own, unaided work. It is being submitted for the degree
of Master of Science in Applied Radiation Science and Technology in the North-West
University, Mafikeng. It has not been submitted before for any degree or examination in
any other University.
Signature: ... .. ... ... ........ ........ .. ... .... ..... .
Date: ................. .............. ... ...... ..... .
ii

ACKNOWLEDGEMENTS
First and foremost, I would like to give thanks to the Almighty God for the blessing of life.
Thank you Lord for the energy and ability you provided me, which enabled me to begin and
finally complete this study. Without your Grace I would not have made it.
I also extend my sincere gratitude to the following:
1) The North-West University for admitting me to pursue a Masters degree in the
applied radiation science and technology.
2) My supervisor, Prof Manny Mathuthu, for the immeasurable guidance, attention and
support that you gave me throughout the duration of this study. You dedicated your
time and energy to ensure that we reach the desired goals. May God richly bless
you and your family
3) My co-supervisor, Prof Victor Tshivhase, for your valuable inputs you gave to
ensure that the objectives of this research are met. Though you are a busy man,
you made time for me and for that I will always be grateful.
4) Prof Arnaud Faanhof for sharing your experience in the nuclear chemistry field and
nuclear in general anytime when we requested without getting tired of us.
5) The Department of Animal Health for allowing us to digest our samples in your
microwave and also to run them in their ICP-MS. I thank you for trusting us with
your lab. Special thanks to Mpho Tlaole and Motsei for their technical assistance.
6) The staff at Centre for Applied Radiation Science and Technology (CARST) who
made me feel at home even though away from my home. Your hospitality enabled
me to do this research motivated and encouraged.
iii

7) My Masters Degree colleagues, Melusi Magagula and Thulani Dlamini, for helping
me out anytime I needed assistance of any kind. You guys showed the true
definition of friends.
8) My family for all the support that you gave me while I was away from home. You
kept reminding me that you are behind me and wishing me the best. I can never ask
for a better family, you are the BEST!!!!Samukelisiwe and Siyabonga, thank you for
always remembering that I am your big brother and supporting my choice of
furthering my studies.
9) My church, Mmabatho Alliance, for welcoming me as your child and making me a
part of your family. It is true when they say actions speak louder than words; you
showed me true unconditional love. I thank God for giving us some time to share the
Word of God together.
iv

ABSTRACT
High concentrations of radionuclides and toxic elements in gold mine tailings facilities
present a health hazard to the environment and people living near that area. The research
was aimed at determining the transfer of radionuclides and toxic elements from the
Princess mine dump to water in the Roodepoort area , South Africa. The study focused
mainly on the dump and considered it as the main (only) source of pollution to the water.
To achieve this, the water samples were taken at sampling points near the dump and
along the flowing part of the stream ( drainage pipe) before it joined other water sources.
Water sampling was done twice; once in the dry season and again during the rainy
season. Soil sampling was done on the surface (15 cm) and also 100 cm below the
surface. For analysis of the soil samples, a Portable Detection Unit based on HPGe
Coaxial Detector (Baltic Scientific Instruments GCD-35190) in the nuclear physics
laboratory at CARST was used. The water samples were run using an ICP-MS at the
Animal Health Department at the North-West University, Mafikeng Campus. An alpha
spectrometer at a SANAS accredited laboratory (Testing Laboratory T0111) was also used
to analyze water samples for selected radionudides. The average activity for uranium and
thorium in soil were calculated to be 129±36 Bq/kg and 18.1 ± 4.0 Bq/kg, respectively. In
water, sampled during rainy season, thorium and uranium ranged from 1.02E+01 to
1.69E+02µg/f and 1.55E+02 to 5.17E+03 µg/f, respectively. The estimated radiological
dose due to direct ingestion of the untreated water was calculated for all the age groups.
For children,< lyear, it ranged from 1.27 to 10.20 mSv/a, for 1 to 2 year olds, from 0.26 to
4.29 mSv/a, for 2 to 7 years, from 0.20 to 3.33 mSv/a, for 7 to 12 years, from 0.19 to 3.27
mSv/a, for 12 to 17 years, from 0.29 to 5.53 mSv/a and for adults> 17 years, from 0.27 to
4.52 mSv/a . The dose limit set by Strahlengschutz-Komission of 0.500 mSv/a, the WHO
screening value of 0.100 mSv/a and • the 0.25 mSv/a set by the South African National
Nuclear Regulator were exceeded by the maximum annual levels from the water samples
in this research. Radionuclides identified and measured using alpha spectrometry were
23au , 234U, 230Th, 226Ra, 21op0 , 23su, 227Th, 223Ra, 232Th, 22aTh and 224Ra.
V

Table of Contents
DECLARATION ..... .... ........... .. ........... ..... .... ........ ...... ................. ..... .. .... ... .................... .. ............................ ii
ACKNOWLEDGEMENTS ........ ....... ....................... .. .... ............... ........ ..... ........ ........ ... .... .. ..... ......... ..... ..... iii
ABSTRACT .... ...... ... ....... .... ..... ...... .. .... ............................ ... .. ... .. ........................... ...... ...... ...... ........... ...... .... v
LIST OF ABBREVIATIONS ................ .......... .......................................................................................... viii
LIST OF FIGURES .. ..... ....... .................................... ............... ............... .. .... .............................................. ix
LIST OF TABLES ...... .. ....... .. .. ....................... .... .... ............... ... ............... ... .... ............................................. x
CHAPTER 1: INTRODUCTION AND PROBLEM STATEMENT ........................................................... l
1.1 Introduction ..... .. ....................................................... ...... .... .... .......................................................... 1
1.1.1 Radioactivity in Water ............................. ........ ...... ....... ..... ........ ................................................ 2
1.1.2 Acid Mine Drainage ............ ... .. .. ...... ..... ......... ..................... .... ...... ............... ..... ........ .. .......... .... 3
1.1.3 Toxic Elements ..... ... ........................ .............................................................. .. ............ ..... ........ 4
1.1.4 Site Location ...................................................... ....................................................................... 6
1 .2 Problem Statement .......................................................................................................................... 7
CHAPTER 2: RESEARCH AIMS AND OBJECTIVES .... .. ............................ ........ .. ............ .. ...... .......... . 9
2.1 Research Aims ..................................................... .............. ....... .... .................................................. 9
2 .2 Research Objectives .... .......... ... .. ........ ...... ...................................................................................... 9
2.3 Justification ......... ... .... ...... .......... ... ......... ..... ........ .......... ... .......... .... ... .. ... ... .... ..... ... .......... ..... ......... .. . 9
CHAPTER 3: LITERATURE REVIEW ......... .. ........ ................ .. .. ...................... ......... .. ........................... 11
3.1 Background Information on Radioactivity .... .. ... .................................. .. .. .. ................................... 11
3.2 Radionuclide Decay .......... ........... ..... ...... ............. .... .. ...... ............. ......... ........ .. ............... .............. 12
3.2.1 Alpha Decay ............... ............................................. ................................................................ 12
3.2.2 Beta Decay .... ... .. ........ .. ..... ............................... .. ... .. ....... ....... ............ .. .......... .. ... ..................... 13
3.2.3 Gamma Emission .. ........ ... ............ ........................ ................ .. .. ... .. ......... ... ... .......................... 14
3.3 Decay Chains ......................... ................... ........... .... ..... .. .... ........... .......... .. ............................ ....... 16
3.4 Dose Measurement and Calculation .... ...... ....... ........ .... ..................... .. ............................ ... ......... 16
3.4.1 Absorbed Dose .................................................................................... ... ............ ..... ............... 17
3.4.2 Equivalent Dose ... ... .................... .. ......... .. ................... ........... ..................................... ..... ...... 17
3.4.3 Effective Dose .... .................................. .... ... .. .... .............. ........ .. .. ..... ....... ................................ 20
3 .5 Effects of Varying Levels of Dose to the Body .... ....... ...... .. .... ... ................... ............................... 21
3.6 Theory on Calculation of 238U and 232Th from Daughter Nuclides ................ ........ ..................... 24
3.6.1 Radioactive Equilibrium ... ...... .. .... ...... ...... .............................................. .. ..... ......... ................ 24
3. 7 Measurement of Radioactivity ............. .... ........................ .. ... .. ...... ....................... ..... ... .. ............... 27
vi

3.7.1 Classification of Detectors Used to Measure Radiation ............ .. ... .. ............. ..... ..... .. ... ... .... 28
3.7.2 The High Purity Germanium Detector (HPGe) ...................... .... .. ........................................ 29
3.7.3 The Inductively Coupled Plasma Mass Spectrometry {ICP-MS) .. .. .. .. ....... ............. ...... ... ... 30
3.7.4 Alpha Spectrometry ...... ........ .......... .............. ... ......................... ..... .... ..................................... 30
3.8 Literature Search (on radioactivity and radionuclides in water and soil) ..... ... ... .. ...... ............... 31
CHAPTER 4: METHODS OF INVESTIGATION ... ..... .... ...... ........ ... .......................................... ............ 38
4.1 Sampling ................ .. .. .... .. ... .... ........... ....... .... .. ........ ...... .... ............................................. .... ...... ...... 38
4.1.1 Soil Sampling ............. ............... ...... ................... ... ... ... ...... ... ................................. ... .... .. ......... 38
4.1.2 Water Sampling ........... ... ..... ...... ...... ................ .. .... .. ....... .. ........ ................. ...... ... .................... 39
4.2 Sample Preparation ................................. .... .......... .... .... .. ...... ... ...... ... ... .... .............. .... ............. ... .. 40
4.2.1 Gamma Spectroscopy ......... ........... .. .. ............ ........ .. ..... .......................... .... ..... ........ .... .. ....... 40
4.2.2 Mass Spectroscopy ..... ... ................................ .. .. ........ ... ....... ..... ................ .. .............. .... ....... .. 40
4.2.3 Alpha Spectrometry ... ......... ........................... ... .. ...................... ...... ......... .. ................... ... .. ..... 40
4.3 Sample Data Acquisition ................... ........ ........... ....... .. .. .. ....... .... ........... ... ........... ........................ 42
4.3.1 Soil Samples ................ ............... .... ............ .. ... ... .. .... ......... ..... .. ... ........ ........... ......... ....... ........ 42
4.3.2 Water Samples ...................... .... ... .. ...... .. ........ .. .. .... .. .......... ... ..... ......................... ....... ..... .. .... . 42
4.4 Sample Data Analysis .................. .... ... .............. ..... ... ....... ..... ...... ....... ....... ..... .. ... .... ....... .... ......... .. 43
CHAPTER 5: RESULTS AND DISCUSSION .......... ... .. .. ....... .. ............. ...... ... ........... ......................... ... 45
5.1 Domestic Water Use ... ...... ............. .... ........................................ .. ................. .... .. ....... .......... .. ....... 45
5.2 Agricultural Water Use - Irrigation ........ ..... ............. ......... ....... .... .. .. .............................................. 55
5.3 Agricultural Water Use - Livestock Watering .......... ........ ................. .......................................... . 56
5.4 Comparison to Mafikeng Water .... ...... .... .................... ...... ......... .. .............................. ... ................ 61
5.5 Limitations of the Study .......... ... ....................... .. ................................................ .. .... ...... .... ... .... .... 62
5.6 Future Work .. .................... .. .. ....... .. .... ..... .... .. .... .... ....... ..... ............. .. ... .... .. ... .................................. 62
CHAPTER 6: CONCLUSION ............ ..... ................... .... ..... ... ........ .. ... ... ............................... ..... .......... ... 63
REFERENCES ... .... .... ..................... ..................... ......... ................ ... ... ... ........... ...... ....... ......................... 65
APPENDICES .. .. ....... .. .... ... ......... ...... .... ..... ...................... .... ... .. ..... .. ....... ..... .. ...... ......... ..... ... ..... ...... ........ 72
vii

LIST OF ABBREVIATIONS
TSF Tailings Storage Facility
NORM
IAEA
HPGe
ICP-MS
XRF
INAA
TWQR
DWA
GPS
AMD
NNR
CPEP
US EPA
SSK
WHO
BTRC
ICRP
EDTA
CARST
Naturally Occurring Radioactive Material
International Atomic Energy Agency
High Purity Germanium detector
Inductively Coupled Plasma Mass Spectrometry
X-Ray Fluorescence
Instrumental Neutron Activation Analysis
Target Water Quality Range
Department of Water Affairs
Global Positioning System
Acid Mine Drainage
National Nuclear Regulator
Contemporary Physics Education Project
l NWU _I
LJBRARYJ
United States Environmental Protection Agency
Strahlenschutz-Kommission
World Health Organization
A name given to a sampling point of a place in Mafikeng where people
reside
International Commission on Radiological Protection
Ethylened iaminetetraacetic acid
Center for Applied Radiation Science and Technology
viii

LIST OF FIGURES
Figure 1: Schematic diagram showing various aspects of the generation and dispersal of acid mine drainage in and around tailings dumps in the Witwatersrand goldfields ....................................... .. .... .. 4
Figure 2: Plot of human response with change in concentration of drug .. ........ ....... ................ ..... .... .... 5
Figure 3: An aerial view of the Princess mine dump ................. ........ ........................................... .......... 7
Figure 4: Different exposure pathways to the general public (NNR regulatory guide (RG-002)) .. ..... 8
Figure 5: Example of a gamma emission by an excited atom of 22Na ............................................. .. . 15
Figure 6: Penetration power of alpha and beta particles, and gamma ray ...... ..... ... .. ...... .. ............ ..... 16
Figure 7: Plot of dependence of radiation weighting factor with energy for neutrons ... ... ... .. ............. 19
Figure 8: The public safety assessment process (NNR regulatory guide (RG-002)) ........... ......... .... 22
Figure 9: Plot of activity with time showing the condition where no equilibrium is reached (Krane, 1998) ................................. .. ................... ............ ............. ....... .. ..... ...... ... ...... ... ......................... ..... ...... .. :·· · 25
Figure 10: Plot of activity with time to show the transient equilibrium condition (Krane, 1998) .. ...... 26
Figure 11: Plot of activity with time showing secular equilibrium being reached (Krane, 1998) .... ... 27
Figure 12: Map showing the sampling points around the dump marked with yellow pins and red alphabets ..... .. .. .... .. .. ... ... ........ ................................. ... ... .................. ......... ... ........ ..... ... .................. .. .......... 38
Figure 13: One of the water sampling points which is the entrance to the drainage pipe from the mine dump ..... ...... .. ........ .............. ... ............ .......................................... .......... .............. ........................... 39
Figure 14: NexlON 300Q ICP-MS (Perkin Elmer) used for the water analysis ............ ............ .......... 43
Figure 15a: Plot of Thorium concentrations in mBq/L ......... ........ .... .. ..... ..................... ........................ 46
Figure 15b: Plot of Uranium concentrations in mBq/L .... .... .. .... ......... ... .. .. ........ ........ ....................... .. . 47
Figure 16: A plot of the yearly dose for the different age groups compared at all sampling points . 49
Figure 17a: Plot of varying concentrations of selected toxic elements at sampling point A ..... ..... .. . 52
Figure 17b: Plot of varying concentrations of selected toxic elements at sampling point C ...... ...... . 53
Figure 17c: Plot of varying concentrations of selected toxic elements at sampling point E .............. 53 Figure 17d: Plot of varying concentrations of selected toxic elements at sampling point Z1 ........... 54
Figure 17e: Plot of varying concentrations of selected toxic elements at sampling point Z2 ........... 54 Figure 17f: Plot of varying concentrations of selected toxic elements at sampling point Zm .. ........ . 55
ix

LIST OF TABLES
Table 1: Examples of radioactivity in natural and artificial materials (DWAF, 2002) .................. ........ . 2
Table 2: List of Toxic Elements (Squibb, 2002) .. .. .. ...... .................... .. .... ................ .. ............ .... ........ .. .... 6
Table 3: Radiation weighting factors, WR (ICRP, 2007) ...... ... ............. ... ... ..................... ..... ....... ..... ...... 18
Table 4: Tissue weighting factors (IAEA, 2011 ) .................... .. .. .. .... .. ............ .. ...... .... .. ............. .. ........... 21
Table 5: Description and Effects of Different Doses and Dose Rates (DWAF, 2002) ......... .. .. .......... 23
Table 6: Uranium and Thorium concentrations in µg/L .. .... .. .. ...... .. ................ .... .. ...... .. .. ... ............ .. .... 46
Table 7: Uranium and Thorium concentrations in mBq/f .... .. ...... .. ... .................. .......... ........ ...... .. .... .... 46
Table 8: Uranium and Thorium yearly dose (mSv/a) for different age groups .... .. .. .. ................... .. .... 48
Table 9: Activity concentrations of nuclides in filtered samples (mBq/L) ..................... .. ................ .. ... 50
Table 10: Dose rate calculations (mSv/a) ...... .. .. .. ........ .. ............. ........ .... .. ................... .. .. .. .... ............. .. 51
Table 11: Concentrations of toxic elements in water (µg/f) ........ .... .. ........ .... ...... .. .. .......... .. .. .... .......... . 51
Table 12: Selected water quality criteria for irrigational water (mg/f) .. .. ...... .. ............ .......................... 56
Table 13: The comparison of limit set for water to be consumed by livestock against concentrations
at each sampling point ......................... .. ...... .. ..... .. ....................... .. .... .. ......... ................. ..... .. .... ..... .... .. ... 57
Table 14: Concentrations of uranium and thorium in soil samples close to the water sampling points ..... ... .... .... .... .... .......... .... .. ........ .......... .... .. ............... ....... ... .... .. .. .. ..... .... ....... .. .... ........ ....... ....... ...... ... .......... 59
Table 15: Comparison of concentration of Uranium and Thorium at two water points with that in soil ...... .... ... ............... ... ... .......... ... .. .. ... .. .............. .. ... ...... .. ... ... ........ .... .. .... ......... .... ... ............... ... ... ... ... .. .. ..... .. . 60
Table 16: Selected elements concentration from water sampled at BRTC (µg/f) .......... .. ........ ... ..... . 61
Table 17: A comparison of data with that collected by Fayazi (µg/f) ........ .............. .. .. .... .. .................. 62
X

CHAPTER 1: INTRODUCTION AND PROBLEM STATEMENT
1.1 Introduction
"The discovery of the Witwatersrand Goldfields in 1886 led to the development of South
Africa's world-class gold mining industry, which has dominated the global gold mining
industry for 120 years", reported the Virtual Metals Research and Consulting Limited
(www.goldinsouthafrica.com). The mining industry is of economic value to the Government
of South Africa since it is a source of revenue and it offers quite a large number of job
opportunities to the people (Lesikar et al. , 2009).
The Witwatersrand basin has been mined for more than 100 years and has produced more
than 41000 tonnes of gold. South Africa produced 394 tonnes of gold in 2001 which was
the lowest production since 1956 (Mbendi Information Systems, 2003).
During the mining process a lot of waste is produced which is then dumped at selected
places near the mine. These places are referred to as mine dumps and/or tailings storage
facilities (TSF's).
During the extraction of gold the byproducts (tailings) are discarded and they then present
a hazard to humans as well as the environment since these tailings contain toxic elements
and radioactive elements which remain active for a very long period of time. These
radionuclides are present in soil, rock and can also be found in groundwater and surface
water (Lesikar et al. , 2009).
Naturally occurring radioactive materials (NORMs) have been there (in existence) since
the beginning of times. These NORMs are found almost everywhere, from the earth's
crust, walls of buildings, in plants and water (Department of minerals and energy, 2005).
Radioactive elements with long half-lives (long-lived) such as uranium, thorium, potassium
and any of their decay products such as radium and radon are examples of NORMs.
These radionuclides that occur in nature can be broken down into two groups. In the
primordial group, the half-life of the nuclide is comparable to the life of the earth, in the
order of 109 years. The second group is the secondary nuclides, which have gained
existence through the decay of the primordial nuclides (they are daughters of the long-lived
parents).
1

The air that humans inhale contains some of the radioactive gases (e.g. radon, thoron).
The human body (muscles, bones and tissue) contains some naturally occurring
radioactive elements, which do not have any bad effects to the body systems as long as
their levels in the body do not exceed a certain amount (Department of minerals and
energy, 2005).
Table1 gives a list of examples of radioactivity as it occurs in natural and artificial
materials.
Table 1: Examples of radioactivity in natural and artificial materials (DWAF, 2002)
Example of material Activity Type of activity
1 kg of granite 1kBq NORM
1 kg of coffee 1kBq NORM
1 kg of coal ash 2kBq NORM
1 kg superphosphate fertil iser 5kBq NORM
1 adult human ?kBq NORM
1 household smoke detector 30 kBq Artificial
1 kg low level radioactive waste 1 MBq Artificial
Radioisotope source for medical 100 TBq Artificial
therapy (Typically Cobalt-60)
1.1.1 Radioactivity in Water
Naturally occurring radioactivity in drinking water and hot mineral water has been
considered by Saqan et al. (2001) and found to constitute a major source of radiation
exposure. The most observed gamma emitters are the 214Bi and the 214Pb. Spring water
analyzed in Jordan by the Physics Department of the Jordan University of Science and
Technology showed that 234Th, 226Ra , 214Pb, 214Bi , 228Ac, 228Th , 212Pb, 212Bi , 208TI , 235U and
4°K radionuclides were present in the spring (Saqan et al. , 2001 ).
2

1.1.2 Acid Mine Drainage
Wendel (1998) in his study highlighted that water plays a pivotal role in the transportation
or transfer of radionuclides through the environment.
Hierro et al. (2012) stated that acid mine drainage (AMO) is one of the major causes of
water pollution worldwide. The ore of the Witwatersrand Super group contains significant
amounts of sulphide minerals (e.g. the pyrite, FeS2, which is a significant constituent of
gold bearing reefs) (McCarthy, 2011 ). These sulphide minerals make the gold mine tailings
prone to the formation of acid mine drainage. Figure 1 gives a schematic diagram of the
generation of Acid mine drainage in the Witwatersrand goldfields tailings.
The exposure of minerals to atmospheric weathering results in oxidation taking place.
However, sulphides are stable and very insoluble under reducing conditions but their
oxidation as a result of the weathering process releases sulphuric acid which affects the
quality of streams and groundwater. Other oxidation products can include partially oxidized
oxonians, such as thiosulphate, hydrogen sulphide, iron sulphate in solution and heavy
metals associated with uranium mineralization (Fernandes et al., 1998). The above
mentioned process can be further explained using equation (1 ).
(1)
3

Cortaminated soi t>elow
Figure 1: Schematic diagram showing various aspects of the generation and
dispersal of acid mine drainage in and around tailings dumps in the Witwatersrand
goldfields. Insets show important features and processes in dumps (A) , feet of dumps (8) ,
paddocks (C) and streams (D) (Tutu et al. , 2008)
1.1.3 Toxic Elements All metals have the potential of being toxic. They can be regarded toxic once they exceed
the required limit in the human body. Figure 2 shows the relationship between essential
element at requ ired concentrations and the toxicity once the concentration is in excess
(Squibb, 2002) .
4

Drug Safety - Therapeutic Index
O> C ·-'0 C 8. 50 (h
~ 0
0
0
Therapeutic Effect
I I , ED50
!/ 0.1 1.0
Toxic Side Effect
10
(Drug) (mg/kg)
Slope can be steep
I T050
!/ 100 1000
Figure 2: Plot of human response with change in concentration of drug (Ketakin , 1997)
Squibb (2002) in his publication presents a list of elements that are regarded as toxic or
sometimes referred to as non-essential elements.
5

Table 2: List of Toxic Elements (Squibb, 2002)
Toxic Element symbol Toxic element name
As Arsenic
Ag Silver
Au Gold
Be Beryllium
Cd Cadmium
Cs Caesium
Li Lithium
Hg Mercury
Pb Lead
Sn Tin
Sr Strontium
The toxic elements have varying negative effects on the human body. For example, lead
causes liver and kidney damage, mental retardation as well as abnormalities in fertility and
pregnancy (Squibb, 2002).
1.1.4 Site Location
The Princess mine dump is one of the mine dumps of a previously active gold mine in the
Witwatersrand Mining Basin. The dump forms an L- shape with a park (Victory Park) inside
the shape. At the edge of the dump are houses. Figure 3 gives a better insight into the
place (the empty ground with no houses or vegetation in Figure 3 is the dump).
6

Figure 3: An aerial view of the Princess mine dump
Soil and water samples from the Princess mine dump were collected , prepared and then
analyzed so as to identify the radionuclides and toxic elements in the water which are
transferred from the dump.
1.2 Problem Statement l NWU· l LJBRARVJ
When mining companies shut down, the greatest issue becomes the waste generated from
the whole mining program (commonly referred to as mine tailings). The mine tailings get
blown by the winds and are washed by rains into water systems. Radon (Rn) , a gas
generated by tailings, can travel up to thousands of kilometers in a light breeze (Davies
&Mundalamo, 2010).
The slime dams and mine dumps of the Gauteng and the North West Provinces leak
uranium and its daughters (Durand , 2012).The effluents from the mines contain radium ,
polonium, thorium , uranium and isotopes of lead. Pollution of the country's soil and water
resources affect the food chain and consequently the health of the population and
surrounding ecosystems. These elements are not just toxic but are also radioactive and
therefore become a threat to the people staying near the dump. Exposure pathways to
humans can be through one of the following (Davies &Mundalamo, 2010): 7

• Ingestion of earth crops that have high concentrations of the radionuclides from the
soil ;
• Consumption of fish swimming in contaminated water;
• Consumption of meaUmilk from cows grazing in contaminated land or drinking the
contaminated water;
• Inhalation of dust or particulate matter from the dump;
• Direct contact with soil materials from the dump.
The following diagram (Figure 4 ), taken from the South African National Nuclear Regulator
(NNR) regulatory guide (RG-002), gives further insight into the exposure pathways.
I \ ' l ' \ \
\ \ \ ' /, 'J
I \ \
\ '
I,
\ ~,~ '----.....--- -~IP \\ t '\ / \ '{""'~ ,(r
Figure 4: Different exposure pathways to the general public (NNR regulatory guide
(RG-002))
8

CHAPTER 2: RESEARCH AIMS AND OBJECTIVES
2.1 Research Aims
During the gold mining process, several tons of rock are extracted from underground and
processed to obtain gold. Once the milling process and extraction of gold is done the mill
tailings are then placed on mine dumps in the environment. There are an estimated 7000
hectares of such dumpsites with large populations living close by (Lindsay et al. , 2004).
The aims of this project are to investigate the transfer of radionuclides and toxic elements
from soil around the Princess mine dump to water, and determine the potential radiological
and toxicological impact on humans.
2.2 Research Objectives
The research objectives are as follows :
• To determine the activity of selected radionudides in the soil samples using the
High Purity Germanium detector;
• To identify the heavy elements present in water and their concentrations using
inductively coupled plasma mass spectrometer and compare the concentrations
against the soil results obtained from the HPGe detector to determine the transfer
factors for the radionuclides;
• To identify selected radionuclides and measure their activity concentrations using
an alpha spectrometer;
• To compare the results of the concentrations of different radionuclides from the
dump obtained using the different equipment against water samples collected
around Mafikeng in an area where people reside where there is no uranium or gold
mine dump.
2.3 Justification
People come up with many different myths and perceptions concerning the threat to their
health due to being located near mine tailings. Mara Kardass-Nelson, a health journalist for
Mail and Guardians Centre published a story of a lady who claimed she witnessed a flood
acid mine drainage sweep her furniture away. For any action to be taken on the mine
dump, first there should be some data collected that will be analyzed so as to determine
9

the concentration levels of the radioactive elements in the soil and in the slime dams.
Determination of the radionuclides in the dump and their concentrations will assist in
assessing whether there is any potential radiological and toxicological impact on humans.
Fayazi (2005) did a water quality survey around the Princess mine dump with the aim of
determining the dump's negative effects on the water resources. The main focus of this
study was on the sulphate (SO4) concentration, hydrogen ion concentration (pH), Iron (Fe)
concentration and selected trace elements (Cd, Cr, Co, Cu, Pb, Mn, Ni, Zn, and Al). The
sulphate concentration in surface water analyzed was higher compared to that of ground
water investigated. The oxidation of pyrite which was found in the mine dump increased
the sulphate concentration. Fayazi did not go to the extent of measuring uranium and
thorium concentrations in the water and compare them to the concentrations in the soil so
as to determine the transfer factors . As far as we know such a study has not been
previously done at this Princess mine dump. This study is also of national importance in
that the data collected at this dump can be used to compare with or update or compliment
data collected in other areas so as to come up with a national database on radioactivity
levels at the different dumping sites.
10

CHAPTER 3: LITERATURE REVIEW
3.1 Background Information on Radioactivity
The International Atomic Energy Agency, in its IAEA safety glossary (IAEA, 2007), defines
radioactivity as the phenomenon whereby atoms undergo spontaneous random
disintegration, usually accompanied by the emission of radiation.
The discovery of radioactivity resulted from the discovery of X-rays by Wilhelm Conrad
Roentgen in 1895 by shining light rays onto photographic plates (World Nuclear
Association, 2013). In 1896 Becquerel decided to repeat the X-ray experiment carried out
by Roentgen. He prepared several photographic plates to ensure that there is repetition of
the results. He left the plates in the drawer yet the uranium crystal was still attached to the
plates. Since it was a cloudy day, there was no sunlight but when he checked the plates
the results obtained were the same as when there was sunlight in the X-ray experiment.
The only explanation Becquerel could come up with was that the rays produced were
produced internally by the crystal that contained uranium which was attached to the plates
(World Nuclear Association, 2013).
Marie S. Curie and her husband Pierre did some further research and analysis of the
observation done by Becquerel on the materials and their new property. They extracted
uranium from its ore and to their surprise the remaining ore after uranium extraction still
showed more activity than the pure uranium. They named this new material property and
behavior radioactivity. Their study led to the discovery of the elements polonium and
radium (CPEP, 2003).
Ionizing radiation is radiation that is composed of particles that individually carry enough
kinetic energy to liberate an electron from an atom or molecule thus ionizing it. Radiation
emitted by radioactive materials is also referred to as ionizing radiation, due to the manner
in which it interacts with matter. This ionizing radiation can be in the any of the three main
types (Martins, 2006):
• Alpha particles;
• Beta particles;
• Gamma rays.
11

3.2 Radionuclide Decay
Atoms undergo radioactive transformations because they are not stable, that is, the
protons and neutrons in the nucleus are not arranged in the lowest potential energy states
possible. So, when the nucleus undergoes a rearrangement it happens in such a way that
the excess energy is emitted and the nucleus gets transformed to an atom of a new
element. The number of disintegrations per unit time, which is referred to as the decay
rate, is proportional to the number of radioactive nuclei in the sample. This statement can
be expressed mathematically as ;
where;
dN = -AN dt '
(2)
- N is the number of radioactive nuclei in the sample
- "A, is called the decay constant, which is the probability per unit time that a
given radioactive nucleus will decay.
ln 2 0.693 - A = decay constant = - = -
T½ T½
- T1 12 is known as the half-life of the radionuclide, which is the time it takes for
a radionudide to decay to half its initial activity.
- Activity = decays ft . = - dN = AN 1me dt
For purposes of this mini-dissertation, three decay mechanisms will be discussed in detail;
alpha decay, beta decay (beta minus, beta plus and electron capture) and gamma
emission.
3.2.1 Alpha Decay
Alpha decay occurs when the parent nucleus emits an alpha particle. It occurs almost
exclusively to heavy nuclei(Z > 83). An alpha particle is actually a helium nucleus which is
made up of two protons and two neutrons (4He). Therefore, the resultant daughter product
(from an alpha decay) is four (4) mass units lighter and two (2) fewer units of electric
charge (CPEP, 2003). Since the atomic numbers of the parent and daughter nuclei change
(not the same), they are therefore different elements and as such will have different
chemical properties (Mehta , 2005). These particles can damage human cells if they are
12

exposed to them directly considering their high energies. Direct exposure to these alpha
particles can be achieved through ingestion. An alpha particle can be easily stopped by
even the top layer of a human skin. Equation (3) shows the release of an alpha particle.
(3)
where; - X is the parent nuclide
- Y is the daughter nuclide
- a is the alpha particle
- A is the mass number (number of proton+ neutrons)
- Z is the atomic number
3.2.2 Beta Decay l NWU I LJBRARY_
Beta decay can be either through the emission of a ~- particle, W particle or electron
capture. Therefore, a beta particle can either be an electron or a positron, which travels at
very high speeds as it gets emitted or ejected by the decaying radionuclide. The beta
particles have energies less than those of alpha particles. Their energies range from 5 keV
to 4000 keV and are smaller in size, compared to an alpha particle, since it is just an
electron or positron but have a large range when travelling through a material (Mehta,
2005). This property of beta particles enables them to penetrate the skin of a human being.
3.2.2.1 p- Emission
A beta minus emission occurs when the unstable isotope has an excess number of
neutrons to that of protons in the nucleus, so it then produces negatrons ( electron) to be in
a more stable state. In such a case, the excess neutron(s) is transformed into a proton
(which stays inside the nucleus) and the electron is emitted as the negatron (~-) and an
antineutrino. The antineutrino has no charge and mass (Mehta, 2005; Martins, 2006). This
process is summarized in equation ( 4 ).
(4)
where; - X is the parent nuclide
-Y is the daughter nuclide
13

- p - is the emitted electron
-v is the antineutrino
- A is the mass number and Z is the number of protons.
3.2.2.2 W Emission
A beta positive emission occurs when the unstable isotope has an excess number of
protons to that of neutrons in the nucleus, so it then produces a positron (positive electron)
to be in a more stable state. In such a case, the excess proton is transformed into a
neutron (which stays inside the nucleus) and the electron is emitted as the positron and a
neutrino (Mehta, 2005; Martins, 2006) as presented in equation (5).
p ➔ n + ~+ + V , (5)
where ; - pis proton
- n is the neutron produced
- ~ + is the positron emitted
- v is the neutrino
3.2.2.3 Electron Capture
Electron capture is another way in which a nucleus rich in protons gets to reduce the
number of protons so as to attain stability. During electron capture, an electron from the
innermost orbit (90% of the time it is from the K-shell) is absorbed and this results in one of
the protons being converted into a neutron. This process is accompanied by the emission
of an X-ray which is characteristic of the product nuclide as shown in equation (6) (Mehta,
2005; Martins, 2006)
(6)
3.2.3 Gamma Emission
A gamma ray is emitted by a nucleus which decays rapidly to ground state from an excited
state. This process (gamma emission) often occurs after either an alpha decay or beta
decay has taken place (CPEP, 2003). During a gamma emission the number of protons
and neutrons in the nucleus does not change thus the parent and daughter have the same
14

number of protons and same mass number. Gamma rays travel at the speed of light when
they are emitted from a decaying radionudide. They occur in the form of photons. Gamma
radiation is in actual fact electromagnetic rad iation (Sang, 1992). Gamma rays have
discreet energies, frequency and wavelength and these three are related through equation
(7);
E = hf= hcf:\, (7)
where; - E = energy
- h = Planck's constant
- f = frequency of gamma radiation
- c =speed of light
- >-. = wavelength
An example of a gamma emission by an excited atom of 22Na is given in Figure 5.
-y emission reduces energy of nucleus
2:2
⇒ y ray
Ne
Energy (keV)
1274
0
Figure 5: Example of a gamma emission by an excited atom of 22Na (Sang , 1992)
The gamma particles have no charge and no mass but they are the most penetrating of the
three (Sang , 1992).
15

The penetration ability of alpha, beta particles and gamma ray can be summarized by
Figure 6.
Paper Plastic
Alpha __ : ~
Beta -- 0 - --0
Beta -- o -
Gamma VVVVV\
Steel Lead
Figure 6: Penetration power of alpha and beta particles, and gamma ray (IAEA, 2008)
3.3 Decay Chains
Section 3.2 gives an introduction to radionuclide decay. Most NORMs decay through a
series of transformations. During these transformations , the radionuclide gives off or emits
some energy or particles and as a result it becomes other nuclides (Saqan et al. , 2001).
The nuclide that decays is referred to as the parent and the resultant new nuclide that the
parent decays to, is referred to as the daughter nuclide. These series of transformations
continue as long as the resultant nuclide is unstable until a stable nuclide is reached.
There are three major transformation series: Uranium series, Actinium series and Thorium
series and they are listed in appendix 1. These series form what is called the decay chain
of the NORM parent radionuclide.
3.4 Dose Measurement and Calculation
Ionizing radiation has varying effects on matter depending on (among other things) ; the
type of ionizing radiation , amount of energy being deposited and target matter.
Unfortunately, ionizing radiation cannot be detected directly through human senses.
Appropriate technology (detectors, radiation meters, gauges, etc.) is used for direct
16

measurement of the energy that the radiation concerned deposited in that particular part of
body or organ. Another alternative is to calculate the dose absorbed by the organ (Martins,
2006).
3.4.1 Absorbed Dose
Absorbed dose is defined in the IAEA Safety Standards Series No. GSR Part 3 (2011) as
the average amount of radiation energy imparted to or absorbed by an organ or body.
Absorbed dose helps relate the radiation energy absorbed to the extent of radiation
damage. The absorbed dose can be evaluated in one of two ways:
1. Through direct measurement
2. Through performing calculations
Absorbed dose, D, can be expressed mathematically through equation (8);
D
where;
dE dm'
- dE is the mean energy imparted by ionizing radiation to matter,
- dm is the mass of matter contained in infinitesimal volume.
The SI unit for absorbed dose is joule per kg and is referred to as the gray (Gy).
3.4.2 Equivalent Dose
(8)
The extent of radiation damage to tissue or organ depends on a number of factors which
include;
• The source of the radiation energy or the type of ionizing radiation ,
• The distance between the source and the organ receiving the dose,
• The organ absorbing the radiation energy.
Equivalent dose is a radiation protection quantity that takes into account (consideration) all
the above listed (in the bullets) factors together with the absorbed dose. Of note is that, for
the same absorbed dose, the effects are more likely and more severe in some tissues than
in other parts of the human body, and some radiation is more severely damaging than
other ionizing photons. The weighting factors are introduced as a way of taking into
consideration the varying effects of radiation on different tissues. The weighting factors
17

help to improve the relationship between the dose quantities applied in radiation protection
and the effects. The two weighting factors are the tissue weighting factor and the radiation
weighting factor (ICRP, 2007).
Thus, equivalent dose in an organ or tissue, Hr, is given in equation (9) as;
where;
(9)
- Dr,R is the average absorbed dose deposited in organ or tissue T by
ionizing radiation of type R
- WR is the radiation weighting factor for ionizing radiation type R
- LR -means that the sum is performed over all types R of radiation involved
The radiation weighting factors for the different radiation types are given in Table3.
Table 3: Radiation weighting factors, WR (ICRP, 2007)
Type of radiation and energy range WR
Photons 1
Electrons and muons 1
Protons 2
Alpha particles, fission fragments, heavy 20
nuclei
Incident neutrons For neutrons WRis given by the function WR
(En) which is shown in detail in equation 10
and Figure 7
18

[ {ln(En)f l 2.5 + 18.2 exp -
6 for En < 1 MeV
[ {ln(2En)}2]
WR (En) = 5.0 + 17.0 exp -6
fo r 1 MeV ~ En ~ SO MeV, (1 0)
[ {ln(0.04En}2]
2.5 + 3.25 exp -6
for En > SO MeV
Figure 7 shows the energy dependence of the radiation weighting factor for neutrons as it
has been given (wR(En)) in equation 10.
22
20
18
16
14
'"" -~ 12
] w,(Ei) "I
•6 - 10 i ~ C .g 8
1 ci:
6
4
2
' ~
0.01
l
\ \
I 1
' I
0.1
Ei Neutron energy (Me\/)
' \ ' "~
~ 'Ill~
~ ..__
10 100 1 •103
1-104
Figure 7: Plot of dependence of radiation weighting factor with energy for neutrons
(ICRP, 2007)
19

3.4.3 Effective Dose
Effective dose is the quantity that is used when more than one tissue is exposed . It is
applicable when one focuses on the risk of radiation-related cancer and when the dose
rates are low. It is the summation of all the equivalent doses with each of them multiplied
by the appropriate tissue weighting factor (Mehta, 2005).
Thus the effective dose, E, is defined mathematically in equation ( 11) as;
( 11)
where; - Hr is the equivalent dose in organ or tissue T
- wr is the tissue weighting factor
Using the definition of equivalent dose as given in earlier discussion above in equation (9)
to substitute for Hr in equation ( 11) gives;
l NWU· I LIBRARY_ (12)
The values of the tissue weighting factors wr, as prescribed in the Safety Standards series
No. GSR part 3 (IAEA, 2011 ), are listed in Table 4.
20

Table 4: Tissue weighting factors (IAEA, 2011)
Tissue WT LTwT Bone marrow
Breasts
Colon 0.12 0.60
Lung
Stomach
Gonads 0.08 0.08
Bladder
Esophagus
Liver 0.04 0.16
Thyroid
Bone surface
Brain
Salivary glands 0.01 0.04
Skin
Summed value for 14 remaining tissues 0.12
total 1.00
3.5 Effects of Varying Levels of Dose to the Body
The South African National Nuclear Regulator (NNR) has set out a procedure to follow
when assessing the safety of the public from exposure to radiation . The process is
summarized through the following flow chart.
21

Sampling and analysis
Identify exposure pa1hways
, Site Description
Process Description
Calculations and/or I modelling to determine
· Quantify nuclides --►· I nuclides that can be _____ ,_..,, on site ---
Source term
i Dose calculations
' dispersed to off-site locations
...--~►••r (Screening ◄◄---
Identify exposed persons (Critical group)
assessment}
Detailed safety assessment with
NNR approval . ..,..._...,__ Compare dose with assessment criteria
(250 µ Sv/a)
~ more realistic, site specific Input data
l Submit monitoring
programme
t t .... ________ Dose calculations
Figure 8: The public safety assessment process (NNR regulatory guide (RG-002))
Previously the South African Department of Water Affairs and Forestry (now South African
Department of Water Affairs) (DWAF, 2002) gave a description and the effects of different
dose levels to the body as presented in Table 5.
22

Table 5: Description and Effects of Different Doses and Dose Rates (DWAF, 2002)
Dose Description I Effects
0.3 to 0.6 mSv/a This is the typical range of dose rates from artificial
sources of radiation, mostly medical.
0.2 to 0.8 mSv/a This is the range of worldwide average annual
radiation dose from ingestion of foodstuff and water.
Variations about the mean values by factors 5 to 10
are not unusual for many components of exposure
from natural sources.
2.4 mSv/a (approximately) The normal average background radiation from
natural sources. Approximately half of this exposure
is from radon in air.
13 mSv/a This is the highest known average annual dose from
background radiation that occurs in the Kerala and
Madras states in India where a population of over
100 000 people is exposed to this level.
20 mSv/a This dose averaged over 5 years is the limit for
regulated practices and working activities such as
' ) NWU- the nuclear industry employees and mining and
lusRAR mineral processing workers, who are closely
monitored.
50 mSv/a This dose is conservatively the lowest dose rate
where there is any evidence of cancer being
caused. It is also the dose rate that arises from
natural background levels in several places. Above
this, the probability of cancer occurrence (rather
than the severity) increases with dose.
23

Dose
100mSv
1 000 mSv
Between 2 000 and 10 000 mSv
2::10 000 mSv
Description I Effects
This dose accumulated over some time, would
probably cause a fatal cancer many years later in 5
of every 100 persons exposed to it (i.e. if the normal
incidence of fatal cancer were 25%, this dose would
increase it to 30%).
This dose received as a short-term dose would
probably cause (temporary) illness such as nausea
and decreased white blood cell count, but not
death. Above this dose the severity of illness
increases with dose.
This dose over a short-term would cause severe
radiation sickness with increasing likelihood that this
would be fatal.
This dose in a short-term dose would cause
immediate illness and subsequent death within a few
weeks.
3.6 Theory on Calculation of 238U and 232Th from Daughter Nuclides
If the parent has a very long half-life compared to its daughters in a decay chain, the
activities of the natural radio isotopes can be measured and the concentration of the parent
can be calculated from that of its daughters. In such a case, secular equilibrium is
assumed.
3.6.1 Radioactive Equilibrium
Krane (1998) states that equilibrium in a decay series is said to be reached when the
parent nuclide and its daughter(s) begin to decay at the same rate. The condition for
equilibrium to be reached or achieved is that the half-life of the daughter nuclide should not
be longer than the half-life of the parent nuclide. If the daughter has a longer half-life than
24

the parent, then equilibrium will not be reached (Krane, 1998). Three types of decay
equilibrium are observed: secular equilibrium, transient equilibrium and no equilibrium.
3.6.1.1 No Equilibrium
If the daughter nuclide is longer lived than the parent nuclide, no equilibrium is reached. In
this case the parent decays until it is negligible thus leaving the daughter nuclide to decay
by its own half-life (L'Annunziata, 2012). This condition is expressed as;
If Aparent > "-daughter then no equilibrium is reached.
The condition can alternatively be presented as;
If t ½ (parent) < t ½(ctaughter) • then no equilibrium.
In A
'-
---~
~ .
' ""'- ··
' --10
v- I'-... T,. 8 hrs ......I ..
I " -' T .,, = 0 .8 hrs ' "I.. I f I
~ 0 s 10 IS
t in,e in h o u rs
Figure 9: Plot of activity with time showing the condition where no equilibrium is
reached (Krane, 1998)
3.6.1.2 Transient Equilibrium
The condition for transient equilibrium is that the parent should have a half-life greater than
that of its daughter and the ratio of Aparent!Actaughter should be within the range 10·4 and 1
(L'Annunziata, 2012).
25

Mathematically;
A.parent < \:iaughter And lQ-4 < Aparent < l Actaughter
In A I 100•
~ ~· ' ,- . Tvi- 8 hrs ;---.,...
--c__.:t_ T I /
100 I I I I
Tw =0.8 hrs
--
10
0 5
- - -- ,_ ----: :::---- -~
15
time In boui-s
Figure 10: Plot of activity with time to show the transient equilibrium condition
(Krane, 1998)
3.6.1.3 Secular Equilibrium
Secular equilibrium is a steady state condition whereby the parent nuclide and its daughter
have equal activities. The parent is long-lived while the daughter is short-lived. For secular
equilibrium to be assumed, the ratio of A.parent /\:iaughtershould be less or equal to 10·4. This
means that A.parent « Actaughter·
Therefore, to calculate the concentration of the parent, equation (13) is used (Saqan et al,
2001 ).
where;
(13)
- Np and Ap are the number of atoms in a given sample and the decay
constant of the parent, respectively.
- Nct and Act are the number of atoms in the same sample and the decay
constant of the daughter, respectively.
26

. .... ,, .
./ T 11~= oo 7 -/
100 I T m = 0 .8 hrs
10
0 5 10
time in hours
Figure 11: Plot of activity with time showing secular equilibrium being reached
(Krane, 1998)
Ngigi (2009) states that it is difficult to directly measure 238U concentration levels using its
gamma line at 49.5 keV. However, if it is in secular equilibrium with its daughters the
gamma lines of its daughters can be used. For example, the 63.3keV gamma line and the
92.6keV doublet gamma line of 234Th and the 234mpa gamma line at 766.4 keV can be used
to calculate the concentration of the parent 238U (Saidou et al, 2008).
3. 7 Measurement of Radioactivity
When radiation interacts with matter there are a number of effects that are observed or that
accompany that particular interaction (Knoll, 1999). These effects can include, among
others, emission of photons, charged particles and heat. The instruments used to measure
or detect the amount of radioactivity make use of this property of effects during interaction
with matter and radiation can be detected, intensity can also be measured and radiation
spectra can be obtained (Knoll , 1999). Different types of detectors can be characterized by
the nature of the interaction of rad iation with matter.
27

3.7.1 Classification of Detectors Used to Measure Radiation
A lot of studies have been done in identifying radionuclides either in dust, soil, water and/or
vegetation all over the world. Different studies use different equipment depending on
availability of equipment and aim of that particular study.
Different authors have come up with many different ways of categorizing detectors used to
measure radiation and they base them on many different characteristics. However, in our
discussion we shall use the classification of NUREG-1575 (NUREG-1575, 2009) who
came up with three classes for the many different kinds of detectors out there. The three
types are: Gas-Filled Detectors, Scintillation Detectors and Solid State Detectors.
3.7.1.15cintillation Detectors
These detectors are based upon the use of various phosphors (scintillators) which emit
light in proportion to the quantity and energy of the radiation they absorb. Different
scintillation materials are used to detect different types of radiation. These materials
include: Nal(TI), Csl(TI) crystals, plastics, or liquids. Thallium-activated sodium iodide (Nal
(Tl)) is the most widely used inorganic scintillator (Knoll, 1999).
3. 7 .1.2Gas-Fi I led Detectors
Gas filled detectors have become the most commonly used detectors around the world
and include gas- ionization chamber, gas-flow proportional, and Geiger-Muller (GM)
(NUREG-1575, 2009). These detectors have been made or designed in such a way that
they are able to detect alpha, beta, photon and neutron radiation.
3. 7.1.3Solid State Detectors
Solid state detectors are often semi conducting devices which measure the conduction of
electrons across an otherwise non conducting medium (Wiles, 2002). A crystal composed
of an electron-rich sector and an electron-deficient sector is used. The solid state detector
systems use silicon or germanium crystals together with semi-conductor technology. The
crystal material's insulating properties help to prevent thermal generation of noise. To
achieve these insulating properties, the semi-conductor detectors are cooled to extreme
temperatures (NUREG-1575, 2009). For example, the HPGe detector is cooled with liquid
nitrogen to -180 °C.
28

3.7.2 The High Purity Germanium Detector (HPGe)
The germanium semiconductor detectors were introduced in 1962 (Khandaker, 2011 ).
These detectors are the best choice for high energy resolution gamma-ray spectrometry
studies or measurements. Gamma ray spectrometry is based on the knowledge that each
gamma ray photon has a discrete energy, and this energy is characteristic of the source
isotope (IAEA, 2003). By measuring the energies of gamma ray P.hotons, we can
determine the source of the radiation. l LI: ~iv J A typical gamma spectrometry system consists of a Germanium (Ge) detector, liquid
nitrogen or mechanical cooling system, preamplifier, detector bias supply, linear amplifier,
analog-to-digital converter (ADC), multichannel storage of the spectrum, and data readout
devices (www.ortec-online.com). HPGe detectors are made by highly refining the element
germanium and growing it into a crystal. To increase the efficiency of the detector, it is
housed within a shield which helps reduce radiation from the background. To construct the
shield, a dense material which will be able to absorb a large portion of gamma ray
background is used. Lead is usually the ideal material used to construct the shield.
Ambient photons interact with the lead material to generate some X-rays. To counter the
X-ray effect generated, the lead shielding material is graded with a two part thin metal
shield such as tin and copper (www.ortec-online.com). Photons from the sample get
emitted and they interact with the germanium crystal to produce a pulse. The amplitude of
the pulse is proportional to the energy of the photon absorbed by the germanium.
Advantages of HPGe over Other Detectors for Gamma Ray Spectrometry
The HPGe has a very high resolving power compared to other detectors. For example, the
HPGe has 20-30 times better resolution than sodium iodide (Nal) detectors (IAEA, 2003).
Due to this very superior resolving power, HPGe provides sufficient information to
accurately and reliably identify radionudides from their passive gamma ray emissions
without any chemical change or destruction of the sample (Busto et al., 2002). HPGe
detectors are resistant to information (signal) degradation caused by changes in
background radiation, shielding, multiple radionudide interference, and temperature
variations. It is also much more effective than Nal detectors in stand-off radionuclide
identifications such as are encountered in vehicle or shipping container inspections.
29

3. 7 .3 The Inductively Coupled Plasma Mass Spectrometry (ICP-MS)
The ICP-MS is one of the most sensitive analytical techniques for elemental determination
(Bosnak&Pruszkowski, 2008). The Inductively Coupled Plasma (ICP) source converts the
atoms of the elements in the sample to ions. These ions are then separated and detected
by the mass spectrometer. The advantages of the ICP-MS over other analytical methods
are:
• it is able to provide us with isotopic ratios of a sample,
• detection limit for most of elements analyzed using ICP-MS is better, ·
compared to Atomic Absorption Spectroscopy, for example.
3.7.4 Alpha Spectrometry
Alpha spectrometry is used in many different fields. For example, it is used for the
investigation of groundwater, surface water and seawater processes through the
measurement of uranium and radium isotopes. The energy of an alpha particle is related to
the half-life of the parent nuclide; the highest alpha particle energies have the longest half
lives (Vajda et al. , 2012). A short half-life implies a high decay constant due to the inverse
relationship as earlier indicated in equation (2).
t i; = ~ . where t1; is the half life and A is the decay constant. 2 A 2
Examples of this relationship can be seen in the radionudide 212Po which has a decay
constant of 0.299 µs-1 and energy of 8784.37 keV and 213Po with decay constant of 4.2 µs-1
and energy of 8375.9 keV. This relationship between the alpha particle energy and its
half-life can be presented using an empirical equation which expresses a law that was
recognized by Geiger-Nuttal in 1991 (Vajda et al. , 2012). The equation is given in equation
(14) as;
logA = A+ Blog Ea , (14)
where ; - A is decay constant, as already mentioned
- Ea is the alpha particle energy
- A and Bare constants
30

The advantages of alpha spectrometry are that it is a very sensitive technique since it has
a very high counting efficiency yet at the same time has low intrinsic background. It also
has quite a good range of radionuclides that can be identified using it. Lastly, it allows for
different sample types to be analyzed . Its limitation is that the radionudides that one is
interested in need to be first separated from the matrix sample since alpha particles have a
short range (Vajda et al., 2012).
3.8 Literature Search (on radioactivity and radionuclides in water and soil)
Al-Amir et al. (2012) investigated tap water that had been collected from highly populated
areas in Amman and Aqaba in Jordan. The aim of the study was to assess potential public
impact of radiation by measuring gross alpha and beta activity as well as uranium and
radium radionuclides. Liquid scintillation counting was used to deduce the gross activities.
Ortega et al. (1996) studied natural radioactivity in drinking water in Catalonia, Spain. The
study focused on gross alpha and beta emitted by234U, 235U, 238U, 226Ra, 228Ra, 230Th,
232Th , 210Pb and 210Po activity. Average concentration of the radionuclides ranged from 10
to 1 00mBq/t Some of the water samples showed a high degree of disequil ibrium among
the members of the uranium series. The ZnS scintillation counter was used for the gross
alpha counting. Gross beta activity measured was mostly as a result of the presence of 4°K
in the water samples.
Rangel et al. (2002) studied the radioactivity in bottled water in Mexico. A liquid scintillation
detector was used to measure the gross alpha and beta activities. The bottled water
investigated was both purified water and mineral water. All the samples of purified water
had beta activity values lower than 1.0Bq/f which is the beta activity limit for potable
drinking water. Three water sample brands exceeded the alpha activity limit of< 0.1 mBq/t
Wallner et al. (2008) measured the activity concentrations of 228Ra, 226Ra, 21 0Pb, 210Po,
238U and 234U in Austrian mineral water using liquid scintillation counting . The measured
activities were then used to calculate the committed effective dose for adults and babies.
The calculations (results) were then compared to the limit of 0.1 mSv/a given in the EC
Drinking Water Directive. The highest committed effective dose for adults was found to be
0.02 mSv/a. For babies, the limit was exceeded by two mineral water brands while two
other brands had doses very close to the indicative value. 31

Duenas et al. ( 1997) have studied the levels of natural radioactivity in spring waters in
Spain. Bottled water from all over Spain was analyzed to determine the level of gross
alpha and gross beta activities. An alpha/beta counter of low background multiple detector
type with four gas-flow window counters about 5cm in diameter was used to do the gross
alpha and gross beta measurements.
Santawamaitre et al. (2011) investigated the levels of naturally occurring radioactivity in
surface soils along the Chao Phraya river basin in Thailand. A hyper pure germanium
(HPGe) detector was used for gamma ray spectroscopy measurements. This study was
aimed at investigating the activity concentrations of the radionudides in the 238U and 232Th
decay chains and that of 4°K. Results obtained from gamma measurements indicated that
238U activity concentration was in the range 55.3-65.2 Bq/kg, 232Th had activity range of
60.7-69.1Bq/kg and 4°K had activity range of 393-478Bq/kg. These reported activity
concentrations were found to be higher than the upper range of the world mean values
identified by UNSCEAR (2000).
Mohanty et al. (2004) did a study of natural radioactivity and radiation exposure at
Chhatrapur beach, India. The HPGe detector was used to measure the average activity
concentrations of the radioactive radionuclides 232Th, 238U and 4°K. The activity
concentrations for large samples measured for 232Th, 238U and 4°K were 2500±1850Bq/kg ,
230±140Bq/kg and 120±35 Bq/kg, respectively. This showed that the beach was a high
natural background radiation area .
Skipperud et al. (2013) did a study in the uranium mine in Taboshar and at Digmai tailings
dump. The study was aimed at determining the environmental impact of radionuclides and
trace elements in the mine and tailings dump. In addition to soil sample measurements,
sampling of water, fish and vegetation was done to come up with a convincing conclusion
of the environmental impact. Different samples were analyzed using a number of
instruments which include; Inductively Coupled Plasma Mass Spectrometry, Liquid
Scintillation Counting , HPGe Gamma Spectrometry, Alpha Spectrometry and Instrumental
Neutron Activation Analysis.
Naicker et al. (2003) studied soil, surface and ground water at the Natalspruit stream and
areas adjacent to it. Natalspruit is in the Witwatersrand region of South Africa which is
32

known for gold mining activities. The soil, taken within the mining district, was analyzed for
toxic elements using the X-Ray Fluorescence and the water samples were analyzed using
the Atomic Absorption Spectrophotometer. This study revealed that the area has high
concentration levels of heavy metals.
Agbalagba et al. (2013) used gamma spectroscopy to determine the concentrations of
naturally occurring radionuclides measured in hand dug wells, boreholes and river waters
collected from three oil mineral leases (OML) 30, 58 & 61 oil and gas fields onshore of the
Niger delta. The average activity concentrations of 226Ra, 228Ra and 4°K were found to be
8.9 ± 1.0Bq/f, 8.1 ± 0.9Bq/ f and 39.8 ± 3.3Bq/ f, respectively for hand dug wells, 4.4 ± 0.8Bq/ f,4 .6 ± 0.5Bq/ f and 28.5 ± 3.0Bq/ f for borehole water, and 8.2 ± 1.0Bq/ f, 6.7 ± 0.7Bq/ f and 32.1 ± 3.5Bq/ f for river water, respectively. These average activities were
above the WHO permissible levels for hand dug wells, borehole water and river water (1.0,
0.1 and 10 Bq/ f , respectively). The estimated committed effective dose due to intake of
the sampled water for all the age groups was calculated and found to be higher than the
maximum permissible limit set by the ICRPof 0.1 mSv/yr. However, the hazard indices
calculated were within the tolerable levels.
Kleinschmidt et al.(2011) conducted a survey of the radioactivity in groundwater in rural
and remote communities in Queensland, Australia. The survey was aimed at providing a
baseline of radiation exposure that may be impacted upon by exposure pathways
associated with the supply, treatment, use and wastewater treatment of the resource.238U,
226Ra, 222Rn, 228Ra, 224Ra and 4°K were measured and found to contain activity
concentration levels of up to 0.71 Bq/ f, 0.96 Bq/ f, 108 Bq/ f, 2.8 Bq/ f, 0.11 Bq/ f and 0.19
Bq/ f, respectively. In this survey it was recommended that further research needed to be
carried out so as to assess the potential radiation exposures other than that due to the
ingestion of water.
EI-Mageed et al.(2013) studied the natural radioactivity of ground and hot spring water in
some areas of Yemen.Ground water samples were taken from Assalamia-Alhomira and
Juban areas while hot spring water was sampled at Dempt area. In their study, analysis
was done so as to determine the concentration of 226Ra, 232Th and 4°K. Ground water
samples from Ju ban area had average activity concentrations of 2.95 Bq/f, 0. 72 Bq/f and
34.9 Bq/f for 226Ra, 232Th and 4°K, respectively. Ground water from Assalamia-Alhomira 33

had undetectable levels of 4°K, 4.04 Bq/f and 1.81 Bq/f for 226Ra and 232Th , respectively.
The conclusion made from the study was that the results obtained after calculations of
annual effective dose equivalent were higher than the WHO recommended limit for
drinking water.
In Croatia, Rozmaric et al. (2012) investigated bottled drinking water (spring and mineral)
for the availability and activity concentrations of radionuclides and also determined their
contribution to radiation dose. The radionuclides of interest in the study were 234U, 238U,
226Ra, 228Ra, 210Po and 210Pb. The activity concentrations were used to calculate the
average total annual effective ingestion doses for the different age groups (infants,
children , and adults). The results obtained were compared with the European Commission
recommendations and found to be below the reference dose level.
Natural radionuclides in drinking waters in Serbia have been investigated by Jankovic et al.
(2012). They measured the gross alpha and beta activities and 3H, 226Ra, 232Th and 4°K
activities in bottled mineral water that is produced locally in Serbia. Results showed that
the activity of 226Ra, 232Th and 4°K were below the minimum detectable activity. The 3H
concentration in the bottled water ranged from 0.023± 0.012 to 0.046±0.006 Bq/f. All the
alpha and beta emitting radionuclides had natural activities within the range recommended
by the World Health Organisation.
Clulow et al. (1998) conducted a study in Canada whereby they measured the activity
concentration of radionuclides in water, sediments and fish tissues. Sampling was done
from four lakes in watershed affected by uranium mining and milling operations at Elliot
Lake. Radionuclides of interest were 210Pb, 210Po, 230Th and 232Th. From the study, the
lakes Quirke, McCarthy, McCabe and Whiskey had higher concentrations of radionuclides
than Elliot.
Arogunjo et al. (2009) have investigated Uranium and Thorium levels in soils, mineral
sands, water and food samples in a tin mining area in Nigeria with elevated activity. High
purity germanium detectors (HPGe) were used in the determination of the concentrations
in soil and mineral sands. To determine uranium and thorium in liquids and foodstuffs
consumed locally in the mining area, the high resolution sector field inductively coupled
plasma mass spectroscopy (HR-SF-ICP-MS) was used. The activities of uranium and
34

thorium measured in the soils and mineral sands from Bisichi ranged from 8.7 kBq/kg to 51
kBq/kg for 238U and from 16.8 kBq/kg to 98 kBq/kg for 232Th, respectively. The results
obtained from the study revealed the pollution potential of the mining activities to the
surrounding areas. This is because the activity concentrations of uranium and thorium
were found to be higher when compared to that of areas in Nigeria which were used as
controls. These values were also higher than the values reported in literature for areas with
very high natural background levels.
Ryan et al. (2008) inspected the old Rockhole Mine area in Kakadu National Park to
determine if there was an amount of tailings from the former South Alligator uranium (U)
mill being uncovered by wet season rain and road works. Sediment, water and freshwater
mussels' samples were collected from the South Alligator River, near and at the
confluence of Rockhole Mine Creek, and next to the exposed tailings. Radionuclide
activities and isotopic ratios were determined by alpha and/or gamma spectrometry. For
238U, ICP-MS was used together with a conversion factor of 1 Bq of 238U = 80.962 µg of
natural Uranium.
Salbu et al. (2013) assessed the environmental impact of radionudides and trace elements
associated with the Kurday mining site in Kazakhstan. Sampling included, at site
fractionation of water, as well as sampling of water, fish, sediment, soils and vegetation.
The results obtained showed that the concentrations of uranium and associated trace
metals were enriched in the Pit Lake and in the artesian water. However, the
concentrations decreased downstream away from the mining area. From the results
obtained in the study it was concluded that measures such as restricted access to the Pit
Lake as well as dietary restrictions with respect to drinking water and intake of fish should
be taken to reduce the environmental exposure risk.
Lind et al. (2013) determined the environmental impact of radionuclide and metal
contamination at the former uranium site in KadjiSai, Kyrgyzstan. The study was carried
out over a period of two years (2007 and 2008). To assess the environmental impact of
these radionuclides and metals, gamma and radon dose rates were measured, and
samples were taken from vegetation , sediments and soils, water and fish. The results
obtained indicated that water from the lssyk-Kul Lake had generally low concentrations of
radionuclides and trace elements but the concentration of arsenic (As) was found to be 35

surprisingly very high. Within the KadjiSai area, the concentration of uranium in water was
found to be within the WHO recommended limits for drinking water. Studies carried out on
the fish, indicated that there was an uptake of uranium and arsenic by the fish. The overall
conclusion made from the investigation was that the results showed low radiological risk
and no detrimental health effects or impact to the public residing within the area.
Tripathi et al. (2008) did an assessment of environmental radioactivity at mining,
processing and tailings management facility at Jaduguja, India. These uranium mines at
Jaduguja supply fuel to nuclear power plants. For their study, grab water samples were
collected from nearby rivers while ground water was collected from wells and boreholes
near the tailings ponds and areas away from the tailings ponds. About 1 kg of soil samples
were also taken for analysis. Results obtained from this study indicated that in surface
water, the concentrations of natural uranium and 226Ra varied from 0.3 - 54.9 µg/f and 5 -
283 mBq/f, respectively. Ground water sources in the vicinity of the tailings ponds had
uranium and 226Ra concentration levels similar to the regional average of 3.6 µg/f and 23
mBq/f, respectively . Analysis of the ground water away from the tailings ponds revealed
that there was no transfer of radionuclides from the tailings ponds to the ground water.
The Beatrice Gold Belt in Zimbabwe started its operation in 1900 and was in operation
(mined for gold) until it was abandoned towards the year 2000. The belt has four mines;
Beatrice, Joyce, Argyle and Roma. The mines are all located under 5 km from the Mupfure
River, therefore run-off from the mines ad their dumps can easily reach the main river
system. Ravengai et al. (2005) investigated the water quality in the abandoned gold mining
belt of Beatrice. The surface water showed slight contamination with respect to Pb, Zn and
Ni. This contamination was attributed to the mine dumps. Conclusion made from the study
was that for now the low contamination could indicate that the acid mine drainag1 was
proceeding at a slow rate or that ii is still in its initial stages. I Nrf RY LIB _
Lindsay et al. (2004) proposed the use of a mobile gamma ray detector (Solid state
detector: Nal (Tl) to quantitatively assess the flux of radon from large mine dumps at the
gold mines in South Africa. This method was proposed as a solution to the problem
encountered when determining radon fluxes. Analysis of soil samples from mine dumps
using gamma ray spectrometry indicates that 30% of the formed radon may escape
resulting in the 238U decay series secular equilibrium being disturbed . 36

Ngigi (2009) did a study at the Princess mine dump. The aim of the study was to identify
an effective, appropriate and applicable technologies to treat the contaminated surface
water from the Princess dump. To come up with such technology there was need to first
investigate the water so as to assess the extent of water pollution attributed to the dump.
Sampling was done at selected areas around the mine dump and the chemical analysis
was performed on the data to ascertain if the quality concentration of the water from the
mine dump was within the Target Water Quality Range (TWQR) as determined by the
Department of Water Affairs (Ngigi, 2009). Results obtained indicated that pollution from
the mine dump was seriously affecting the water quality in the environment around the site.
Fayazi (2005) did a water quality survey around the Princess mine dump with the aim of
determining the dump's negative effects on the water resources. The main focus of this
study was on the sulphate (SQ4) concentration, hydrogen ion concentration (pH), Iron (Fe)
concentration and selected trace elements (Cd, Cr, Co, Cu, Pb, Mn, Ni, Zn, and Al). The
sulphate concentration in surface water analyzed was higher compared to that of ground
water investigated. The oxidation of pyrite which was found in the mine dump increased
the sulphate concentration.
Though a number of studies have been carried out around the world on radioactivity and
radionuclides in water and in soil, few studies have been reported in literature that have
been done in South Africa. Studies that have been done at the Princess mine dump in
Roodepoort (by Ngigi and Fayazi) have focused mainly on the quality of the water in that
area and solutions for the water pollution. Ngigi and Fayazi did not go to the extent of
measuring uranium and thorium concentrations in the water and compare them to the
concentrations in the soil so as to determine the transfer factors. Therefore, this project's
main aim was to identify and determine the transfer of radionuclides and toxic elements
from the Princess mine dump to water in the Roodepoort area, South Africa and determine
the potential radiological and toxicological impact on humans.
37

CHAPTER 4: METHODS OF INVESTIGATION
This section gives a detailed description of the sampling points that were selected, the
sample preparation procedures and how the data was acquired using different equipment
available at the labs.
4.1 Sampling
Figure 12: Map showing the sampling points around the dump marked with yellow
pins and red alphabets
4.1.1 Soil Sampling
Sampling points were marked using a GPS in and around the area and were denoted with
letters from A to Z as shown by the yellow pins in Figure 12. Soil samples from the ground
were taken at different depths. The soil samples that were taken from the top soil (15 cm)
were labeled with suffix 1; for example A 1 means top soil taken at GPS point A. Those
taken from the bottom, which is 100 cm below the top soil , were labeled with suffix 2.For
38

example; A2 means a sample taken 100 cm below at GPS point A. The soil samples were
packaged in sturdy plastic sample bags and labeled accordingly with a permanent marker.
4.1.2 Water Sampling
Water sampling was done twice; once during the dry season and also during the rainy
season . Water samples were collected right at the dump and along the stream (after the
drainage pipe) , before it joins other water sources. Figure 13 shows the water at the dump
and just before it goes into the drainage pipe that travels underground from the mine
dump. This choice of sampling was done so as to allow the researchers to consider the
dump as the only source of pollution. During the dry season , three sampling points were
chosen and marked A 1004, Z1004 and Z1005. During the wet season , six water sampling
points were chosen and marked as A, C, E, Z1 , Z2 and Zm as can be seen in Figure 12
with points A, Z1 and Z2 being the exact sampling points as A 1004, Z1004 and Z1005,
respectively. The GPS coordinates are given in appendix 6.
Figure 13: One of the water sampling points which is the entrance to the drainage pipe from the mine dump.
39

4.2 Sample Preparation
4.2.1 Gamma Spectroscopy
The collected soil samples were fine silt and thus did not need any grinding. About 250 g of
soil was then put in plastic bottles and sealed for over 20 days to ensure equilibrium
between 226Ra and its daughter nuclides was reached. The soil samples were weighed
using an analytical scale. The same procedure was repeated for some samples but with
the soil sealed in marinelli beakers for comparison.
4.2.2 Mass Spectroscopy
The soil samples were digested using Aqua regia method (Chen&Ma, 2001) where 1 gram
of soil sample was weighed into a microwave sample holders then 3ml of industrial nitric
acid followed by 9 ml of industrial hydrochloric acid was added. All the samples were then
put in a multiwave 3000, Anton paar microwave oven, manufactured by Perkin Elmer for
digestion. The samples were then emptied into 100 ml volumetric flasks and filled to the
mark using distilled water and left over night. The following day, the samples were filtered
and were ready for ICP-MS measurement.
The water samples were collected and filtered into sample bottles and 1.25 ml nitric acid
was added per liter of sample at pH2 to avoid the adsorption of radionuclides on the walls
of the sample bottle (Montana et al., 2013). The water bottles were then kept in a
refrigerator.
For digestion purposes a pipette was used to measure out 5 ml of water collected during
the rainy season into the sample holders then 1 ml of nitric acid followed by 3 ml of
hydrochloric acid was added. Digestion was done in the microwave and the process
repeated as for the soil samples.
4.2.3 Alpha Spectrometry
To obtain the first order estimate of the total activity, the water samples collected during
the dry season were screened for gross alpha/beta activity.
The following separation techniques were used to prepare the different radionuclides for
analysis using alpha spectrometer.
40

Uranium radionuclides: 238U, 234U and 235U
The solid phase extraction was used to first extract the radionuclides from the water. A
cation exchange resin was used for further extraction before analyzing with alpha
spectrometer. The water sample, 200 ml in volume, was acidified with HN03 and pre
concentrated to a volume of 10 ml. This pre-concentrated sample was loaded on a pre
conditioned Truspec resin. Dilute HN03 and dilute hydrochloric acid were used to rinse the
sample after loading it on the resin . The first eluent was obtained after the analytes had
been eluted with 15 ml of 0.1 M hydrochloric acid /0.01 M hydrofluoric acid. The eluent was
then loaded on a pre-conditioned cation exchange resin for purification. Before eluting with
15 ml of 2 M hydrochloric acid to make the second eluent, 10 ml of 0.1 M hydrochloric
acid/0.01 M hydrofluoric acid was used to rinse the eluent. A volume of 0.1 ml of
lanthanum oxide, 0.5 ml concentrated hydrofluoric acid and titanium chloride were added
to the second eluent for the formation of a co-precipitate of uranium and lanthanum fluoride
precipitate. A filter paper was then used to filter out the precipitate. The filtrate was then
dried and analyzed using an alpha spectrometer.
A 232U tracer was used to evaluate the extraction yield of this method.
Thorium radionuclides: 230Th, 227Th and 228Th
Like with the uranium radionuclides, the solid phase extraction was used to first extract the
thorium radionudides from the water. A cation exchange resin was used for further
extraction before analyzing with alpha spectrometer.
The water sample, 200 ml in volume, was acidified with HNQ3 and then pre-concentrated
to a volume of 10 ml. This pre-concentrated sample was loaded on a pre-conditioned
Truspec resin. Dilute HNQ3 and dilute hydrochloric acid were used to rinse the sample
after loading it on the resin . The first eluent was obtained after the analytes had been
eluted with 15 ml of 2 M hydrochloric acid . The eluent was then loaded on a pre
conditioned cation exchange resin for purification. Before eluting with 15 ml of 2 M H 2S04
to make the second eluent10 ml of 0.1 M hydrochloric acid /0.01 M hydrofluoric acid was
used to rinse the eluent. A volume of 0.1 ml of lanthanum oxide, 0.5 ml concentrated
hydrofluoric acid were added to the second eluent for the formation of a co-precipitate of
thorium and lanthanum fluoride precipitate. A filter paper was then used to filter out the
precipitate. The filtrate was then dried and analyzed using an alpha spectrometer.
41

A 229Th tracer was used to evaluate the extraction yield of this method.
Radium radionuclides: 226Ra, 223Ra and 224Ra
Barium solution was added into 500 ml of water sample to extract the radium
radionuclides. The extraction of the radium radionuclides was through co-precipitation with
Barium sulphate in an acidic solution. To enhance precipitation, 0.1 M
Ethylenediaminetetraacetic acid (EDTA) was added into the solution. The extract was
analyzed using an alpha spectrometer.
A 133Ba tracer was used to evaluate the extraction yield of this method.
Polonium radionuclide: 210Po
The water sample, 200 ml in volume, was acidified with dilute hydrochloric acid. To prevent
the co-precipitation of polonium with iron, ascorbic acid was added as a reducing agent. A
silver disk was dropped into the solution to enhance the polonium being deposited
spontaneously on to the surface of the silver disk. The solution was stirred for 4 hours to
enhance the deposition of polonium onto the silver disk. The disk was then removed and
dried before it was analyzed for polonium using an alpha spectrometer.
4.3 Sample Data Acquisition
To acquire data from the samples collected, three instruments were used; the High Purity
Germanium Detector {resolution (FWHM) at 122 keV (57Co) is 0.85 keV and at 1332.5 keV
(6°Co) is 1.86 keV and relative efficiency for energy 1.33 MeV relative to (Nal) Tl is 36%},
the Inductively Coupled Plasma Mass Spectrometer and the alpha spectrometer.
4.3.1 Soil Samples
For the measurement of the radioactivity in the soil samples, a Portable Detection Unit
based on HPGe Coaxial Detector (Baltic Scientific Instruments GCD-35190) was used to
measure the gammas emitted by the radionuclides present in the soil. [ NWU· , ..
1 4.3.2 Water Samples LIBRARY_ 4.3.2.1 Alpha Spectrometry
The dry season water samples were screened for gross alpha/beta activity using a gas
proportional counter. Selected radionuclides in the uranium and thorium series (discussed
under sample preparation) were analyzed for, using alpha spectrometry.
42

4.3.2.2 ICP-MS
The rainy season water samples were run using the NexlON 300Q (Perkin Elmer) ICP-MS.
Figure 14 is a picture taken at the lab at Animal Health at North-West University in
Mafikeng where the analysis was done.
Figure 14: NexlON 300Q ICP-MS (Perkin Elmer) used for the water analysis
4.4 Sample Data Analysis
The data obtained from gamma spectrometry was analyzed using software known as
IDENTIFY. This software identifies the peaks using their energies obtained and labels the
peak with the nuclide responsible for each peak and the corresponding activity. The
knowledge of secular equilibrium was used to calculate the activity of the long-lived
parents from their daughter radio isotopes since 238U and 232Th have relatively low gamma
ray intensities following their decay.226Ra , 214Pb and 214Bi activities and gamma-lines were
used to determine 238U activity concentration , while 228Ac, 212Pb, 212Bi and 208TI were used
to determine 232Th activity concentration.
Results obtained from the alpha spectrometer were tabulated and the radionuclide
activities were used to calculate the yearly dose to the publ ic due to ingestion of the water.
43

The printouts from the ICP-MS gave the concentrations of the elements in water in µg/f
and were then entered into a spreadsheet and used for calculation of yearly doses for
different age groups.
To calculate the transfer factors (TF) the following equation was used (Dobrin , 2006):
TF = radionuclide activity per unit mass in water (Bq/kg)
radionuclide activity per unit mass in soil (Bq/kg) '
44
(15)

CHAPTER 5: RESULTS AND DISCUSSION
The Department of Water Affairs has set out water quality guidelines and presented them
in different volume numbers for;
• Domestic water use
• Recreational water use
• Industrial water use
• Agricultural water use - irrigation
• Agricultural water use - livestock watering
• Agricultural water use - aqua culture
• Aquatic ecosystems
• Field guide
For purposes of this research discussion, not all the above will be checked with respect to
the water quality at our sampling site. Domestic water use, recreational water use,
agricultural-irrigation and agricultural-livestock watering will be the four water quality
criteria investigated.
5.1 Domestic Water Use
The Strahlengschutz-Komission (SSK) has set an annual dose limit of 0.500 mSv for tap
water in areas where the resources are affected by former uranium activities. The WHO,
on the other hand , has set the screening value at 0.100 mSv/a.
(www.dwaf.gov.za/iwqs/radioacUDWAFGuideline/section2.htm).
Table 6 presents the concentrations of uranium and thorium in water samples obtained
from the ICP-MS measurements.
45

Table 6: Uranium and Thorium concentrations in µg/e
A C E 21 22 2m
Th 1.69E+02 1.53E+02 1.81 E+01 1.02E+01 1.82E+01 1.13E+01
u 5.17E+03 1.55E+02 1.26E+03 8.68E+02 1.27E+03 6.85E+02
Table 7 presents the activity concentrations (in mBq/f) of uranium and thorium in the water
samples collected .
Table 7: Uranium and Thorium concentrations in mBq/e
A C E 21 22 2m
Th 6.96E+02 6.30E+02 7.47E+01 4.21E+01 7.50E+01 4.65E+01
u 6.39E+04 1.92E+03 1.56E+04 1.07E+04 1.57E+04 8.46E+03
The thorium and uranium concentrations at all the sampling points are presented in the
Figures 15a and 15b, respectively.
l.60E+02
~ l.40E+02 ......... CT co l.20E+02 E -c: l.00E+02 0
·.;; ~ 8.00E+0l ..... C: ~ 6.00E+0l C:
8 4.00E+0l
2.00E+0l
0.00E+00
Thorium concentrations at the different sampling points
A C E Zl 22
sampling points
Figure 15a: Plot of Thorium concentrations in mBq/e
46
■ Th
Zm

From the plot in Figure 15a it can be noted that sampling points A and C have considerably
high concentrations compared to the other points. This difference in activity concentration
can be explained by the fact that points E, Z1, Z2 and Zm are located close to each other
and are down the drainage about 1 km away from the mine dump when compared to
points A and C which are very close to the dump. The high concentration at A than at C yet
C is on the dump can be attributed to leaching . The radionuclides get washed from the top
of the dump down to the sides or bottom part of the dump. There is a possibility that either
thorium does not wash out easily with flowing water or it sticks on the walls of the drainage
pipe as the water flows along it before joining other sources. Thorium is known to have low
solubility in natural water. Even during radioactive decay of 234U, the thorium generated in
solution rapidly hydrolyses and adsorbs to nearest solid surface
(www.dwaf.gov.za/iwqs/radioacUDWAFGuideline/section2.htm)
Uranium concentrations at the different sampling points
6.00E+03 ~------------------- - --
5.00E+03
~ ...... c- 4.00E+03 c:o E -C:
.!:? 3.00E+03 +,I ra ... +,I
C: QJ g 2.00E+03 0 u
l.00E+03
0.00E+00
A C E Zl
sampling points
Figure 15b: Plot of Uranium concentrations in mBq/e
Z2 Zm
■ u
From Figure 15b one notices that the plot of uranium concentration at the different
sampling points follows the same trend as that of thorium discussed in Figure 5a except for
47

the point C which in the case of uranium is lower than all the other sampled points. The
uranium seems to be oxidized to the 6+ oxidation state. This is because in this oxidation
state uranium forms soluble uranyl complex ions which play a most important role in
uranium transportation.
(www.dwaf.gov.za/iwqs/radioact/DWAFGuideline/section2.htm)
The uranium and thorium concentrations in Table 7 were used together with the dose
conversion factors presented in appendix 2 and the South African consumption rates in
appendix 3 to calculate the annual dose that can be received by the public considering the
different age groups if they so happened to ingest water from the sampled points. The
effective dose was calculated using the guidelines given by the Department of Water
Affairs (DWAF, 2002) through the equation;
Annual effective dose (Sv /a) = (radioactivity concentration in water (Bq/L)) x
(consumption of water (L/a)) x (radiation dose conversion factor (Sv /Bq) t NWU. · I (15) LIBRARY
The detailed calculations of the dose are given in appendix 4 for all the sampling points
and are therefore summarized in Table 8.
Table 8: Uranium and Thorium yearly dose (mSv/a) for different age groups
sampling U and Th Yearly Dose for the different Groups (mSv/a)
points < 1a 1-2a 2-7a 7-12a 12-17a > 17a average life-
time (years)
A 10.20 4.29 3.33 3.27 5.53 4.52 5.19
C 1.32 0.26 0.20 0.1 9 0.29 0.27 0.42
E 2.33 1.03 0.80 0.78 1.33 1.08 1.23
21 1.58 0.70 0.54 0.53 0.91 0.74 0.83
22 2.35 1.03 0.80 0.79 1.34 1.09 1.23
2m 1.27 0.56 0.43 0.42 0.72 0.59 0.67
48

Figure 16 is a plot of the dose results given in Table 8 with the aim of giving a much clearer
picture of the difference in the dose rates for different groups as one compares the
different sampling points.
12.00
10.00
-~ ...... > 8.00
V)
E Q)
6.00 VI 0
"C > ;:: 4.00 ~ Q)
> 2.00
0.00
plot of yearly dose for different age groups at all sampling points
< la 1-2a 2-7a 7-12a 12-17a > 17a
Different age groups
-+-A -c ....... E
..++-Zl
~ 22
- Zm
Figure 16: A plot of the yearly dose for the different age groups compared at all
sampling points
From the plot in Figure 16 it can be seen that the yearly dose that can be received by
people due to consumption of the untreated water at all the sampl ing points varies
between O mSv/a to about 2 mSv/a for all age groups except at sampling point A.
Sampling point A shows quite high doses which exceed 10 mSv/a for infants< 1 a. These
high doses may be attributed to the fact that the water sampl ing point A is right at the
bottom of the dump yet the other sampling points are further away from the dump at
varying distances.
The alpha spectrometry analysis was performed in a SANAS ISO 17025 accredited testing
laboratory (T0111 ). The radionuclides and their concentrations measured are presented in
Table 9 below.
49

Table 9: Activity concentrations of nuclides in filtered samples (mBq/L)
Field A 1004 Z 1004 Z 1005
code
Lab code CARST-XOO1 CARST-XOO2 CARST-XOO3
Nuclide Value Unc. MDA Value Unc. MDA Value Unc. MDA
238LJ 17800 300 11 18100 300 9.7 15700 200 7.7
234LJ 16800 300 11 16700 200 9.7 14700 200 7.7
230Th 387 60 32 767 117 38 844 136 170
226Ra 43.9 6.1 2.3 39.7 4.5 1.4 46.0 5.0 1.5
21op0 8.28 2.52 2.1 23.9 4.6 7.0 17.3 4.4 9.7
235LJ 817 13 0.52 832 12 0.44 722 10 0.35
221Th 163 10 4.1 223 12 1.8 180 25 35
223Ra 147 12 3.1 143 9 1.8 142 10 2.0
232Th 24.0 4.3 8.9 59.8 6.3 1.8 51.3 13.0 21
22aTh 54.4 5.6 5.2 78.5 7.4 7.1 89.9 16.9 21
224Ra 8.86 3.96 4.8 10.7 3.4 2.9 19.3 4.7 3.1
Gross 15200 1300 1400 10100 800 760 12000 1000 850
alpha
Gross 12700 800 600 11900 700 650 11900 700 680
beta
The activity concentrations in Table 9 were used to calculate the dose rates according to
the guidelines in the National Nuclear Regulator licensing guide LG-1O32. For purposes of
calculation the following radioactive equilibria were assumed:
50

23BLJ up to 234mpa (= 23BLJ) 226Ra up to 214Bi (= 226Ra) 21opb and 210p0 (= 21op0)
235 LJ up to 231Th (= 235LJ) 231 Pa up to 227Th (=227Th) 223Ra and 211pb (= 223Ra)
22aRa up to 22aTh (= 22aTh) 224Ra up to 212si (= 224Ra)
The calculated dose rates are presented in Table 10.
Table 10: Dose rate calculations (mSv/a)
Sample ID Age Group
Field Lab code < 1a 1-2a 2-7a 7-12a 12-17a
code
A 1004 CARST-X001 5.1 1.7 1.3 1.2 2.1
21004 CARST-X002 6.3 1.9 1.4 1.4 2.3
21005 CARST-X003 5.7 1.7 1.3 1.2 2.1
> 17a
1.6
1.8
1.6
The ICP-MS results showing the concentrations of toxic elements are presented in Table
11.
Table 11: Concentrations of toxic elements in water (µg/e)
A C E 21 22 2m Reference
value
As 9.36E+01 2.86E+02 4.15E+02 9.79E+01 5.72E+02 9.50E+01 5.00E+02
Cd 4.94E+01 9.94 8.72 0 1.78 0 2.00E+01
Hg 2.78 2.5 2.54 4.28 li 3.48 3
Li 1.99E+02 6.05E+02 1.54E+02 1.14E+02 1.95E+02 8.90E+01 no value
Pb 5.01 E+01 5.67E+02 2.70E+02 6.50E+01 1.03E+02 6.49E+01 1.00E+02
Sn 1.18E+01 5.92 1.09E+01 1.18E+01 1.27E+01 5.64 5.00E+03
Al 4.80E+05 no value 1.63E+05 2.08E+05 2.84E+05 1.50E+05 5.00E+03
51

The concentrations that exceed the reference values given (Peterson, 1999) are:
• At sampling point A, only cadmium and aluminium exceed the limit,
• At point C, lead is the only element that exceeded the limit. However, it is worth
noting that for aluminium measurement no value was recorded by the ICP-MS,
• Aluminium and lead exceeded the limit in water sampled at point E,
• Water samples taken at Z1 and Zm both had exceeding limit concentrations of
mercury and aluminium,
• Z2 had more elements exceeding the limit than all the other sampled points, with
arsenic, mercury, lead and aluminium having concentrations above reference
values.
Figures 17a to 17f present the toxic element concentrations discussed in Table 11 at each
sampling point. Aluminium was excluded because it showed very high concentrations and
thus made it difficult for other element concentrations to show in one graph due to the
scale.
-E a. a. -C: 0 :;;
C'O .... ..... C: Q) (.) C: 0 (.)
point A 0. 25 -,----------------------
0.2 -+------------0. 15 -t------------
0.1 +------------0.05
0
toxic elements
Figure 17a: Plot of varying concentrations of selected toxic elements at sampling
point A
52

point C _ 0.7 .-------------------------
[ 0.6 +------------
E: 0.5 +------------
§ 0.4 +:i 0.3 n, !:; 0.2 C ~ 0.1
g 0 u
toxic elements
Figure 17b: Plot of varying concentrations of selected toxic elements at sampling
point C
-E a. a. -C 0 :;:; ~ ... C a, u C 0 u
point E 0.45 .-----------------------
0.4 0.35
0.3 0.25
0.2 0.15
0.1 0.05
0
toxic elements
Figure 17c: Plot of varying concentrations of selected toxic elements at sampling
point E.
53

-E a. 0. -C: 0 +' ro ... .... C: Q) u C: 0 u
point Zl 0.12 ~--------------------
0.1
0.08
0.06
0.04
0.02
0
toxic elements
Figure 17d: Plot of varying concentrations of selected toxic elements at sampling
point 21
-E 0. 0.
C: 0 +' ~ .... C: Q) u C: 0 u
point 22 0.7 ~ - --------------------
0.6 4---------------- -------0.5
0.4
0.3
0.2
0.1
0
toxic elements
Figure 17e: Plot of varying concentrations of selected toxic elements at sampling
point 22
54

point Zm 0.1 .----------------------E
a. a. -C 0 :;:; IU ... -C (1) u C 0 u
0.08
0.06
0.04
0.02
0
toxic elements
Figure 17f: Plot of varying concentrations of selected toxic elements at sampling
point Zm
There seems to be a slight difference in concentration between the sampling points. Of
note is point Z2 which shows a high concentration of all the toxic elements when
comparing it with the points closest to it (Z1 and Zm). Z2 is the water sampling point
furthest from the mine dump; therefore, these results suggest that the toxic elements are
being trans-located as the water flows.
5.2 Agricultural Water Use - Irrigation I NWU· I tlBRARY_
To decide whether the water from our study area can be used by the residents for irrigation
purposes, the concentrations of selected toxic elements were compared against the FAO
standards given for irrigation quality
(www.dwaf.gov.za/iwqs/radioacUDWAFGuideline/section2.htm}. The comparison is
presented in Table 12.
55

Table 12: Selected water quality criteria for irrigational water (mg/€)
Element FAQ A C E Z1 Z2 Zm
Aluminium 5.0 480.25 No value 163.32 208.22 284.48 150.11
Arsenic 0.1 0.09 0.29 0.42 0.10 0.57 0.09
Cadmium 0.01 0.05 0.01 0.009 0 0.001 0
Chromium 0.1 1.32 8.20 0.73 0.84 4.65 0.70
Copper 0.2 3.00 1.81 1.17 0.88 1.40 0.68
Manganese 0.2 39.47 37.53 7.58 6.40 11.00 4.82
Nickel 0.2 15.04 2.01 5.33 4.15 6.93 3.32
Zinc 2.0 21.10 4.87 21.02 6.61 12.17 5.38
From the comparison in Table 12, it can be seen that aluminium, chromium, copper,
manganese, nickel and zinc exceed the FAQ set limit at all the sampling points. Cadmium
is within the limits at all sampling points except for sampling point A. This implies that the
water from these sampled points does not meet the requirements or set guidelines and as
such cannot be used for irrigation purposes.
5.3 Agricultural Water Use - Livestock Watering
The Department of Water Affairs (DWAF, 1996) in volume 5 of the water quality guidelines
gives the limits that have been set for water to be considered fit to be consumed by
livestock. Table 13 gives a list of the elements that are considered in the water quality
guide and are compared against those that were measured from the different sampling
points to see how they compare.
56

Table 13: The comparison of limit set for water to be consumed by livestock against
concentrations at each sampling point
element DWA limit A C E Z1 Z2 Zm
(mg/I) (mg/I) (mg/I) (mg/I) (mg/I) (mg/I) (mg/I)
Al 0-5 NAE 480.25 Not 163.32 208.22 284.48 150.11
measured 5-10
neurotoxicity
As 0-1 NAE 0.093 0.29 0.42 0.097 0.57 0.095
1-1.5 ACE
B 0-5 NAE 0.19 1.79 0.29 0.20 0.70 2.19
5-50 ACE
Cd 0-0.01 NAE 0.049 0.009 0.008 0 0.002 0
0.01-0.02
ACE
Ca 0-1000 NAE 1920.63 4440.69 1250.35 986.40 1407.83 770.93
1000-2000
ACE
Cl 0-1500 NAE 151 .01 984.08 0 533.23 140.88 271 .73
Cr 0-1 NAE 1.31 8.20 0.73 0.84 4.65 0.70
1-2 ACE
Co 0-1 NAE 7.52 0.84 3.21 2.42 4.19 1.81
1-2 ACE
Cu 0-0.5 NAE 3.00 1.81 1.17 0.88 1.40 0.69
57

1-2 ACE
Fe 0-10 NAE 419.97 1901.84 979.91 634.71 1172.27 466.49
10-50 ACE
Pb 0-0.1 NAE 0.05 0.57 0.27 0.065 0.10 0.065
0.1-0.2 ACE
Mg 0-500 NAE 90.38 223.32 75.56 63.80 91.48 42.36
500-1000
ACE
Mn 0-10 NAE 39.47 37.53 7.58 6.40 11 .00 4.82
10-50 ACE
Hg 0-1 NAE 0.0027 0.0025 0.0025 0.0043 0.0031 0.0035
1-6 ACE
Mo 0-0.01 NAE 0.029 0.030 0.028 0.16 0.056 0.078
0.01-0.02
ACE
Ni 0-1 NAE 15.04 2.01 5.33 4.15 6.93 3.32
2-5 ACE
Se 0-50 NAE 0.077 0.063 0.033 0.034 0.034 0.032
50-75 ACE
Na 0-2000 NAE 100.04 77.60 71 .18 114.72 91 .17 95.37
2000-2500
ACE
58

V 0-1 NAE 0.020 3.36
1-2 ACE
Zn 0-20 NAE 21.10 4.87
20-40 ACE
NAE stands for No Adverse Effects
ACE stands for Adverse Chronic Effects
0.085 0.040 0.089 0.023
21.02 6.61 12.17 5.38
From the comparisons done on Table 13, it can be noted that As, B, Cl , Mg , Hg, Se and
Na are all below the DWA set limits at all the sampling points. V and Cd exceed the DWA
limit only at sampling points C and A, respectively. A majority of the elements under
consideration exceed the limits set by DWA. Therefore, the water is not fit to be consumed
by livestock.
Table 14 presents the thorium and uranium activity concentrations of samples A, B1 , B2,
H1, H2, G1 and G2 which are the soil sampling points at the dump but closest to the first
water sampling point A.
Table 14: Concentrations of uranium and thorium in soil samples close to the water
sampling points
Sample ID Uranium (Bq/kg) Error Thorium (Bq/kg) Error
A 1.88E+02 4.95E+01 2.93E+01 6.57E+00
B1 1.02E+02 3.21 E+01 1.59E+01 3.46E+00
B2 1.33E+02 3.62E+01 2.1 0E+01 4.69E+00
G1 8.21E+01 2.53E+01 1.46E+01 3.23E+00
G2 1.50E+02 4.1 0E+01 1.55E+01 3.41 E+00
H1 1.33E+02 3.66E+01 1.54E+01 3.39E+00
H2 1.17E+02 3.20E+01 1.47E+01 3.34E+00
average 1.29E+02 3.61E+01 1.81E+01 4.01E+00
59

Table 15: Comparison of concentration of Uranium and Thorium at two water points
with that in soil
Uranium (Bq/kg) Thorium (Bq/kg)
soil 1.29E+02 1.81 E+01
Rainy season water at Point A 6.39E+01 6.96E-01
Rainy season water at Point 22 1.57E+01 7.50E-02
Dry season water at Point A 1.78E+01 3.87E-01
Dry season water at Point 22 1.57E+01 8.44E-01
The results in Table 15 show that the concentration of uranium and thorium in the soil is
higher compared to the water whether it is the dry season or rainy season. The high
counting error in the soil results may be attributed to the 24 hours counting time. Point A is
located just next to the mine dump yet point 22 is located furthest from the mine down
stream. From the above values we can conclude that there is transfer of the radionuclides
from the soil to water. The same concentration for uranium in water at point 22 was
measured for both seasons which implies that the movement of uranium at point 22 is the
same throughout the year. This is further confirmed by the transfer factors of uranium and
thorium at water point A which were calculated and found to be 49.4% and 3.9%,
respectively in the rainy season. At water point 22 the transfer factors in rainy season were
found to be 12.1 % and 0.4% for uranium and thorium, respectively. These results show
that as we go further away from the mine dump there are less radionuclides being
transferred into the water. In the dry season the transfer factors were calculated and found
to be 13.8% and 2.1 % at point A for uranium and thorium, respectively. At point 22 the
transfer factors were found to be 12.1 % and 4.7% for uranium and thorium, respectively.
These transfer factors suggest that there is more transfer of radionuclides during the rainy
season than when it is dry. However, at point 22 it seems that during the dry season the
thorium gets more concentrated in the water than during the rainy season.
60

5.4 Comparison to Mafikeng Water
Tap water from around Mafikeng in an area where people reside and where there is no
uranium or gold mine dump was sampled and run using the ICP-MS so as to compare with
the results of the concentrations of different radionuclides from the Princess mine dump.
The Mafikeng area was named BRTC and the results for selected elements are listed in
Table 16.
Table 16: Selected elements concentration from water sampled at BRTC (µg/e)
Element Concentration (µg/e)
As 12.92
Cd 0.00
Hg 2.62
Li 6.54
Pb 85.60
Sn 17.74
Th 0.00
u 0.00
The water from BRTC had no uranium and thorium concentration detected by the ICP-MS.
Of note is that only Sn has a concentration higher in BRTC water than the water from all
the sampling points at Princess dump.
Fayazi (2005) in 2003 did a study around the Princess mine dump where they investigated
major cations and anions and selected trace elements. The results from the study are
compared with those obtained in this research in Table 17 (appendix 5 gives all the results
from Fayazi in tabular form). The sampling points being considered are point labeled DV-2
(Fayazi , 2005) and sampling point Z1 from this current study. According to GPS details
provided by Fayazi point DV-2 is located where Z1 in our study is thus the comparison can
be made of the same sampling point.
61

Table 17: A comparison of data with that collected by Fayazi (µg/e)
Ca Mg K Na Cd Cr Co
DV-2 4.60E+04 1.69E+05 7.00E+03 4.90E+04 <40E+00 7.50E+02 7.90E+03
21 9.86E+05 6.40E+04 1.18E+05 1.15E+05 0.00E+00 8.38E+02 2.40E+03
Mn Ni Zn Al Si V Sr
DV-2 1.50E+04 1.30E+04 1.20E+04 3.68E+05 5.10E+04 <1E+03 6.00E+02
21 6.40E+03 4.10E+03 6.60E+03 2.08E+05 6.00E+03 4.00E+01 7.28E+02
Cu Fe Pb Ba B Mo
DV-2 4.00E+03 1.48E+06 4.20E+02 3.00E+02 < 1000 < 300
21 8.83E+02 6.35E+05 6.50E+01 2.99E+02 2.03E+02 1.58E+02
The results displayed in Table 17 show that there is a slight difference in the
concentrations of the elements with most of the elements from Fayazi (2005) being at
higher concentrations. This can be attributed to the fact that there is over 10 year gap
between the two studies and as such the elements could have been translocated during
rains.
5.5 Limitations of the Study In the during of the study sampling was initially planned to be carried out four times but
eventually only done once in the dry season and also once in the rainy or wet season due
to the volatile nature of the residents at the sampling points.
5.6 Future Work This study only focused on mainly uranium and thorium transfer from the dump to the
water. However, it would be of great interest to study the behavior of all the radionuclides
that can be identified in soil and water and observe if secular equilibrium is not disturbed in
the soil and water.
62

CHAPTER 6: CONCLUSION
The aim of this study was to identify and determine the transfer of radionuclides and toxic
elements from the Princess mine dump to water in the Roodepoort area, South Africa , and
also determine the potential radiological and toxicological impact on humans.
Thorium and uranium were identified in the soil from the mine dump and also from the
water sampled at the dump and down the drainage before it joins other water sources.
This, therefore, confirmed that thorium and uranium are being transferred from the mine
dump to water in the area. The same concentration for uranium in water at point Z2 was
measured for both seasons (dry and rainy season) which implies that the movement of
uranium at point Z2 is the same throughout the year. The transfer of the radionuclides is
further confirmed by the transfer factors of uranium and thorium at water point A which
were calculated and found to be 49.4% and 3.9%, respectively in the rainy season. At
water point Z2 the transfer factors in rainy season were found to be 12.1 % and 0.4% for
uranium and thorium , respectively. These results show that as we go further away from the
mine dump there are less radionuclides being transferred into the water. In the dry season
the transfer factors were calculated and found to be 13.8% and 2.1 % at point A for uranium
and thorium, respectively. At point Z2 the transfer factors were found to be 12.1 % and
4. 7% for uranium and thorium, respectively. These transfer factors suggest that there is
more transfer of radionuclides during the rainy season than when it is dry.
Water samples were analyzed using an alpha spectrometer equipped with alpha
spectrometer Genie software and 238U, 234U, 230Th , 226Ra, 210Po, 235U, 227Th, 223Ra, 232Th,
228Th and 224Ra were the radionudides identified.
Doses due to ingestion of the untreated water were estimated in this study using the
literature given conversion factors and were found to be above the 0.100 mSv/a limit set by
WHO. Thus using these estimates it can be concluded that the dose that the public can
receive from drinking this untreated water from the sampled sites poses a potential
radiological health risk since it is above the recommended limit. The reference value of
0.25 mSv/a, which has been set as the dose limit by the NNR was exceeded by almost all
the water samples analyzed (both those sampled during dry and those sampled during
63

rainy season). Only the age groups 2-?a and 7-12a for water sampled at point C have
dose rates below this limit.
Focusing on the toxicity of the water, one may highlight that the toxic elements
concentrations from the sampling sites exceed the limit set by the FAO. Therefore, the
water that was investigated in this study is not good for agricultural use, for example
irrigation and livestock watering, unless it undergoes treatment before it is utilized.
The study achieved the aim of this research which was set out as objectives in section 2.2
as the activity of radionuclides in soil samples was determined using HPGe detector,
heavy elements present in water were identified using ICP-MS, alpha spectrometry was
used to identify selected radionudides and their activity concentrations and ,finally, the
water results from the mine dump water samples obtained from the different equipment
was compared with that of a residential place where there was no uranium or gold mine
dump.
64

REFERENCES
Agbalagba, E.O., Avwiri, G.O., & Ononugbo, C.P. (2013). Activity Concentration and
Radiological Impact Assessment of 226Ra, 228Ra and 4°K in Drinking Waters from (OML)
30, 58 and 61 Oil Fields and Host Communities in Niger Delta Region of Nigeria. Journal of
Environmental Radioactivity, 116, 197-200.
Al-Amir, S. M., AI-Hamarneh, I. F., Al-Abed, T., & Awadallah, M. (2012).Natural
Radioactivity in Tap Water and Associated Age-dependent Dose and Lifetime Risk
Assessment in Amman, Jordan. Applied Radiation and Isotopes, 70, 692-698.
Arogunjo, A.M., Ho·· llriegl, V., Giussani, A., Leopold, K., Gerstmann, U., Veronese I.,
&Oeh, U. (2009). Uranium and Thorium in Soils, Mineral Sands, Water and Food Samples
in a Tin Mining Area in Nigeria with Elevated Activity. Journal of Environmental
Radioactivity, 100, 232-240.
Blundy, J., & Wood, B. (2003). Mineral-Melt Partitioning of Uranium, Thorium and their
Daughters. Vol 52, 59-124.
Bosnak, C. P., & Pruszkowski, E. (2008). The Analysis of Drinking Waters by U.S. EPA
Method Using the NexlON 300D ICP-MS in Standard, Collision and Reaction Modes.
Busto, J., Gonin, Y., Hubert, F., Hubert, P., & Vuilleumier, J.M., (2002). Radioactivity
Measurements of a Large Number of Adhesives. Nuclear Instruments and Methods in
Physics Research, 492, 35-42.
Chapter 2, Reserves to Dore- The Gold Mining Industry [Retrieved on May 2013 from
www.goldinsouthafrica.com/chapter2.pdf ].
Chen, M. & Ma, L.M. (2001 ).Comparison of Three Aqua Regia Digestion Methods for
Twenty Florida Soils. Soil Science Society American Journal, 65, 491-499.
Clulow, F.V., Dave, N.K., Lim T.P., &Avadhanula, R. (1998). Radionuclides (lead-210,
Polonium-210, Thorium-230and232) and Thorium and Uranium in Water, Sediments, and
Fish from Lakes near the City of Elliot Lake, Ontario, Canada. Environmental Pollution, 99,
199-213.
65

Contemporary Physics Education Project (2003). Nuclear Science- A guide to the nuclear
science wall chart
Davies, T.C., & Mundalamo, H.R. (2010).Environmental Health Impacts of Dispersed
Mineralization in South Africa. Journal of African Earth Sciences, 58, 652-666.
Department of Minerals and Energy, Republic of South Africa. (April 2005).Understanding
radioactivity and radiation in everyday life [www.dme.gov.za].
Department of Water Affairs and Forestry (DWAF) (2002).Water quality guidelines.
[Retrieved on 20 April 2014 from
www.dwaf.gov.za/iwqs/radioact/DWAFGuideline/DWAFradioactGuideline.pdf]
Dobrin, R.I. , Dulama, C.N. , Toma, A.L. , (2006).Soil - Plant Experimental Radionuclide
Transfer Factors. Romania Journal of Physics, 51 , 73 - 76.
Duenas, C., Fernandez, M.C., Liger, E. , &Carretero, J. (1997). Natural Radioactivity Levels
in Bottled Water in Spain. Wat. Res. , Vol.31, No.8, 1919-1924.
Durand , J.F. (2012). The Impact of Gold Mining on the Witwatersrand on the Rivers and
Karst System of Gauteng and North West Province, South Africa. Journal of African Earth
Sciences, 68, 24-43.
DWAF. (1996). Volume 5 retrieved on 20 April 2014 from www.dwaf.gov.za/iwqs/wq
guide/pol saWQguideFRESH vol5 livestockwatering.pdf]
EI-Mageed, A. I. A., El-Kamel, A. E., Abbady, A. E., Harb S., & Saleh, I. I. (2013). Natural
Radioactivity of Ground and Hot Spring Water in Some Areas in Yemen.Desalination, 321,
28-31 .
Fayazi , M. (Feb 2005). Report on the water quality survey around the Princess Mine Dump
and its negative effects on the water resources (both surface water and ground water) .
Fernandes, H.M ., Franklin, M.R., & Veiga, L.H. (1998). Acid Rock Drainage and
Radiological Environmental Impacts; A Study Case of the Uranium Mining and Milling
Facilities at Poc,os de Caldas. Waste Management,18: 169-181.
66

Heirro, A. , Bolivar, J.P., Vaca, F., & Borrego, J. (2012). Behaviour of Natural Radionuclides
in Surficial Sediments from an Estuary Impacted by Acid Mine Discharge and Industrial
Effluents in South-West Spain. Journal of Environmental Radioactivity, 110, 13 - 23.
IAEA (July 2003). Guidelines for radioelement mapping using gamma ray spectrometry
data.
IAEA Safety Glossary (2007 edition). Terminology used in nuclear safety and radiation
protection.
IAEA (2008). Radiation, people and the environment. Austria: IAEA.
IAEA (2011 ). Radiation Protection and Safety of Radiation Sources: International Basic
Safety Standards No. GSR Part 3 (interim), Vienna.
ICRP publication 103 (2007). The 2007 recommendations of the International Commission
on Radiological Protection.
Institute for Water Quality Studies. Section 2: Chronic exposure situations and supporting
information for assumptions made in the proposed guideline. [Retrieved on 20 April 2014
from www.dwaf.gov .za/iwqs/radioact/DWAF Gu ideli ne/section2. htm]
Jankovic ' , M. M., Todorovic ' , D. J. , Todorovic; N. A. , & Nikolov, J. (2012). Natural
Radionuclides in Drinking Waters in Serbia.Applied Radiation and Isotopes, 70, 2703-
2710.
Ketakin , T. (1997). Pharmacologic analysis of drug-reception interaction (third edition)
Lippincott-Raven. I Ll~~"1vl Khandaker, M.U. (June 2011 ). High purity germanium detector in gamma-ray
spectrometry. /JFPS, vol.1 , No.2, 42-46.
Kleinschmidt, R. , Black J., & Akber, R. (2011). Mapping Radioactivity in Groundwater to
Identify Elevated Exposure in Remote and Rural Communities. Journal of Environmental
Radioactivity, 102, 235-243.
67

Knoll, G.F. (1999). Radiation detection and measurement(third edition) pages 792-793.
New York: Wiley.
Krane, K. S. (1998). Introductory nuclear physics (second edition). New York: John Wiley &
sons.
L'Annunziata M. F. (2012).Radiation physics and radionuclide decay (third edition) pages
1-162.
Lesikar, B. J. , Melton, R. H. , Hare, M. F., & Hopkins, J. (2009).Drinking water problems:
radionuclides. Texas A&M Agrilife Extension.
Lind , 0 . C. , Stegnar, P. , Tolongutov, B. , Rosseland , B.O. , Strnmman, G., Uralbekov,B. ,
Usubalieva, A., Solomatina , A. , Gwynn, J.P., Lespukh E. , & Salbu, B. (2013).
Environmental Impact Assessment of Radionuclide and Metal Contamination at the Former
U site at KadjiSai , Kyrgyzstan . Journal of Environmental Radioactivity, 123, 37-49.
Lindsay, R. , de Meijer, R.J. , Maleka, P.P., Newman, R.T., Motlhabane T.G.K., & de Villier,
D. (2004).Monitoring the Radon Flux from Gold Mine Dumps by Gamma-ray Mapping.
Nuclear Instruments and Methods in Physics Research, B 213, 775-778.
Martins, J.E. (2006). Physics for radiation protection. Weinheim: Wiley-VCH Verlag GmbH
& Co. KGaA.
Mbendi Information Systems.(2003). An Mbendi profile South Africa mining.
McCarthy, T.S. (2011). The Impact of Acid Mine Drainage in South Africa. South African
Journal of Sciences, 107, 1 - 7.
Mehta, K. (2005). Radiation: Basic principles. Journal of VascSurg, 42, 1237-1 238.
Mohanty, A.K. , Sengupta, D. , Das, S.K., Saha , S.K., & Van, K.V. (2004).Natural
Radioactivity and Radiation Exposure in the High Background Area at Chhatrapur Beach
Placer Deposit of Orissa, India.Journal of Environmental Radioactivity, 75, 15- 33.
68

Montana, M., Fons, J., Corbacho, J.A. , Camacho, A., Zapata-Garcia, D., Guillen, J. ,
Serrano, I. , Tent, J. , Baeza, A., Llaurado, M., &Valles, I. (2013).A Comparattive Study of
Gross Alpha Methods in Natural Water. Journal of Environmental Radioactivity, 118, 1-8.
Naicker, K., Cukrowska E., & McCarthy, T.S. (2003). Acid Mine Drainage Arising from Gold
Mining Activity in Johannesburg, South Africa and environs. Environmental Pollution, 122,
29-40.
National Nuclear Regulator.(n .d.). Safety assessment of radiation hazards to members of
the public from NORM activities [retrieved on 20 April 2014 from www.nnr.co .za/wp
contenUuploads/2014/01 /RG-002]
Ngigi, S. M. (2009). Establishing effective, appropriate and applicable technologies in
treating contaminated surface water as part of a rehabilitation strategy for the Princess
dump in Roodepoort, west of Johannesburg.
NUREG-1575 (January 2009). Multi-Agency Radiation Survey and Assessment of
Materials and Equipment Manual (MARSAME).
ORTEC, Guidelines for Low Level Gamma Spectrometry-Air Filters, Water and Soils
[Retrieved on August 2013 from www.ortec-online.com/ .. ./Guidelines-low-level-Gamma
Spectroscopy l
Ortega, X. , Valles, I. , & Serrano, I. (1996). Natural Radioactivity in Drinking Water in
Catalonia (Spain). Environment International, 22, 347-354.
Peterson, H.G. (1999). Water quality and micro-irrigation for horticulture.
Rangel , J.I.D. , del Rio , H. L., Garcia, F.M. , Torres, L.L.Q., Villalba, M.L., Sujo L.C. , &
Cabrera, M.E.M. (2002). Radioactivity in Bottled Waters Sold in Mexico. Applied Radiation
and Isotopes, 56, 931-936.
Ravengai, S., Love, D., Mabvira-Meck, M., Musiwa K., &Moyce, W. (2005).Water Quality in
an Abandoned Gold Mining Belt, Beatrice, Sanyati Valley, Zimbabwe.Physics and
Chemistry of the Earth, 30, 826-831.
69

Rozmaric, M., Rogic, M., Benedik L., & Strok, M. (2012). Natural Radionuclides in Bottled
Drinking Waters Produced in Croatia and their Contribution to Radiation Dose. Science of
the Total Environment, 437, 53-60.
Ryan, B., Bollho"fer A., & Martin, P. (2008).Radionuclides and Metals in Freshwater
Mussels of the Upper South Alligator River, Australia. Journal of Environmental
Radioactivity, 99, 509-526.
Saidou, Bochud, F., Laedermann, J., KwatoNjock, M.G., & Froidevaux, P. (2008). A
Comparison of Alpha and Gamma Spectrometry for Environmental Natural Radioactivity
Surveys. Applied Radiation and Isotopes, 66, 215-222.
Salbu, B., Burkitbaev, M., Str0mman, G., Shishkov, I., Kayukov, P., Uralbekov B., &
Rosseland, B.O. (2013). Environmental Impact Assessment of Radionuclides and Trace
Elements at the Kurday U Mining Site, Kazakhstan. Journal of EnvironmentalRadioactivity,
123, 14-27.
Sang , D. (1992). Nuclear physics. United Kingdom: Thomas Nelson & Sons ltd.
Santawamaitre, T. , Malain, D., AI-Sulaiti, H. A., Matthews, M., Bradley, D.A., & Regan,
P.H. (2011). Study of Natural Radioactivity in Riverbank Soils Along the Chao Phraya
River Basin in Thailand. Nuclear Instruments and Methods in Physics Research, 652, 920-
924.
Saqan, S.A. , Kullab, M.K., & Ismail, A.M. (2001). Radionuclides in Hot Mineral Spring
Waters in Jordan. Journal of Environmental Radioactivity, 52, 99-107.
Skipperud , L., Str0mman, G. , Yunusov, M., Stegnar, P. , Uralbekov, B. , Tilloboev, H.,
Zjazjev, G., Heier, L.S., Rosseland, B.O., & Salbu, B. (2013).Environmental Impact
Assessment of Radionuclide and Metal Contamination at the former U sites Taboshar and
Digmai, Tajikistan. Journal of Environmental Radioactivity, 123, 50-62.
Squibb, K. (2002) Applied Toxicology-NURS 678.
70

Tripathi, R.M., Sahoo, S.K. , Jha, V.N ., Khan A.H ., & Puranik, V.D. (2008).Assessment of
Environmental Radioactivity at Uranium Mining, Processing and Tailings Management
Facility at Jaduguda, India. Applied Radiation and Isotopes, 66, 1666- 1670.
Tutu , H. , McCarthy, T.S., & Cukrowska, E. (2008).the Chemical Characteristics of Acid
Mine Drainage with Particular Reference to Sources, Distribution and Remediation: The
Witwatersrand Basin, South Africa as a case study. Applied Geochemistry, 23, 3666-3684.
Vajda, N., Martin , P. , & Kim, C. (2012). Alpha spectrometry. Elsevier Inc.
Wallner, G., Wagner R., & Katzlberger, C. (2008).Natural Radionuclides in Austrian
Mineral Water and their Sequential Measurement by Fast Methods. Journal of
Environmental Radioactivity, 99, 1090-1094.
Wendel, G. (1998). Radioactivity in Mines and Mine Water Resources and Mechanisms.
The Journal of South African Institute of Mining and Metallurgy, 87 - 92.
Wiles, D. R. (2002). The Chemistry of nuclear fuel waste disposal, Canada: Polytechnic
International Press.
World Nuclear Association. (January 2013). Naturally Occurring Radioactive Materials
(NORM) .
71

APPENDICES
Appendix 1: Uranium, Thorium and Actinium series, respectively (Blundy & Wood, 2003).
238U decay series
Nuclide Half-life Major Gamma Radiation Energies MeV and Intensities
238LJ 4.5 x10⁹ a 0.04955 (22.46%) l a 0.1135 (0.013%)
234Th 24.1 d 0.0924 (16.2%) l ~
234mpa 1.18 min 0.0435 (1.42%) (99.86%) l ~ 1.001 (0.856%)
234LJ 2.38 x10⁵ a 0.0532 (28.7%) l a
230Th 7.52 x10⁴a 0.068 (0.38%) l a
226Ra 1602 a 0.1862 (5 .962%) l a
222Rn 3.825 d 0.511 (0.078%) l a
21a Po 3.05 m 0.837 (0.0011 %) l a
214pb 26.8 m 0.2952 (27.3%) I NWU I l ~ 0.3519 (46.96%) LIBRARY. 214Bi 19.7 m 0.609 (46.4%)
(99.98%) l ~ 1.1203 (15.14%)
214p0 164 µs 0.799 (0 .0105%) l a
21opb 22,3 a 0.047 (80.2%) l ~
210si 5.02 d 0.305 (0.000084%) l ~
21op0 138.3 d 0.803 {0.00124%}
72

t a
206 pb stable
235U decay series (Actinium series)
Nuclide Half-life Major Gamma Radiation Energies (MeV) and Intensities
235 LJ 7.13 x 10⁸ a 0.144 (13.5%)
ta 0.186 (63.4%)
231 Th 24.64 h 0.059 (75.1 %)
t 13 0.084 (23.4%)
231 Pa 3.43 X 10⁴ a 0.300 (4.25%)
ta 0.303 (2 .62%)
221Ac 21.8 a 0.0693 (0.0076%) (98.8%) t 13
221rh 18.17 d 0.236 (12.6%)
t a
223Ra 11.68 d 0.1542 (28.2%)
t a 0.2695 (25.5%)
219Rn 3.92 s 0.2712 (13.3%)
t a 0.4018 (7.12%)
21sp0 1.83 ms 0.4389 (0.06%)
ta
211pb 36.1 m 0.4048 (4.3%)
t 13 0.4272 (2.13%) 0.832 (3.6%)
211 si 2.16 m 0.351 (16.16%) (98.7%) t a
201r1 4.79 m 0.8978 (0.269%)
73

207pb stable
Minor branchings omitted
74

232Th decay series
Nuclide
232Th
t a
22aAc
t [3
22aTh
ta
224Ra
t a
220Rn
t a
212Bi ---+ (36%)
(64%) t [3
t a
Half-life
1.39x10¹⁰ a
5.75 a
6.13 h
1.913 a
3.64 d
55.6 s
0.14 s
10.64 h
60.5 m
304 ns
t a 3.1 m 2oaT1
Stable
75
Major Gamma Radiation Energies (MeV) and Intensities
0.064 (0.26%)
0.0264 (28%)
0.0578 (72.5%) 0.338 (11.7%) 0.911 (26.5%)
0.0844 (26.4%)
0.241 (5.26%)
0.550 (0.118%)
0.805 (0.0019%)
0.2386 (81.6%) 0.3001 (4.66%)
0.0399 (26.0%) 0.727 (6.74%)
No gamma
0.583 (86.7%) 2.6145 (100%)
NWU I
IBRARYl l

76

Appendix 2: Dose conversion factors, E(g), for ingestion by various age groups of the
public(DWAF, 2002)
< 1a 1 -2a 2-7a 7-12a 12 -17a > 17a
Radionuclide E (g) E (g) E (g) E (g) E (g) E (g)
23au 3.4E-07 1.2E-07 8.0E-08 6.SE-08 6.?E-08 4.5E-08
234Th 4.0E-08 2.5E-08 1.3E-08 7.4E-09 4.2E-09 3.4E-09
234U 3.?E-07 1.3E-07 8.SE-08 7.4E-08 7.4E-08 4.9E-08
230Th 4.1 E-06 4.1 E-07 3.1 E-07 2.4E-07 2.2E-07 2.1 E-07
226Ra 4.7E-06 9.6E-07 6.2E-07 8.0E-07 1.5E-06 2.SE-07
214pb 2.7E-09 1.0E-09 5.2E-10 3.1E-10 2.0E-10 1.4E-10
214Bi 1.4E-09 7.4E-10 3.6E-10 2.1E-10 1.4E-10 1.1E-10
21opb 8.4E-06 3.6E-06 2.2E-06 1.9E-06 1.9E-06 6.9E-07
210Bi 1.5E-08 9.7E-09 4.SE-09 2.9E-09 1.6E-09 1.3E-09
21op0 2.6E-05 8.SE-06 4.4E-06 2.6E-06 1.6E-06 1.2E-06
23su 3.5E-07 1.3E-07 8.5E-08 7.1 E-08 7.0E-08 4.7E-08
231Pa 1.3E-05 1.3E-06 1.1 E-06 9.2E-07 8.0E-07 7.1 E-07
221Ac 3.3E-05 3.1 E-06 2.2E-06 1.5E-06 1.2E-06 1.1 E-06
221Th 3.0E-07 7.0E-08 3.6E-08 2.3E-08 1.5E-08 8.SE-09
223Ra 5.3E-06 1.1 E-06 5.7E-07 4.5E-07 3.7E-07 1.0E-07
232Th 4.6E-06 4.5E-07 3.5E-07 2.9E-07 2.5E-07 2.3E-07
22sRa 3.0E-05 5.7E-06 3.4E-06 3.9E-06 5.3E-06 6.9E-07
77

22aTh 3.7E-06 3.7E-07 2.2E-07 1.5E-07 9.4E-08 7.2E-08
224Ra 2.7E-06 6.6E-07 3.5E-07 2.6E-07 2.0E-07 6.5E-08
Appendix 3: South African annual consumption rates (DWAF, 2002)
Foodstuff annual consumption (kg fresh weight)
< 1a 1-2a 2-7a 7-12a 12-17a > 17a
Freshwater fish 0.5 1 5 10 10 25
Meat 10 20 50 75 100 100
Poultry 7.5 15 35 60 75 75
Eggs 3 6 15 25 30 30
Cereals and grains 45 60 75 90 128 150
Root crops 51 68 85 102 145 170
Other vegetables , fruits, 39 52 65 78 111 130
nuts
Water (L) 200 260 300 350 600 730
Milk (L) 300 300 300 300 300 250
78

Appendix 4: Detailed annual effective dose calculations for each sampling point
POINT A Yearly Dose for the different Groups (Sv/a)
Nuclide < 1a 1-2a 2-7a 7-12a 12-17a > 17a
U-238 4.3E-3 2.0E-3 1.5E-3 1.5E-3 2.6E-3 2.1 E-3
U-235 32.2E-6 15.6E-6 11.?E-6 11.4E-6 19.3E-6 15.8E-6
U-234 4.?E-3 2.1E-3 1.7E-3 1.6E-3 2.8E-3 2.3E-3
Th-232 6.40E-04 6.26E-05 4.87E-05 4.04E-05 3.48E-05 3.20E-05
Th-228 5.15E-04 5.15E-05 3.06E-05 2.09E-05 1.31 E-05 1.00E-05
total 10.20E-3 4.29E-3 3.33E-3 3.27E-3 5.53E-3 4.52E-3
POINT C Yearly Dose for the different Groups (Sv/a)
Nuclide < 1a 1-2a 2-7a 7-12a 12-17a > 17a
U-238 129.6E-6 59.5E-6 45.?E-6 45.4E-6 76.6E-6 62 .6E-6
U-235 967.?E-9 467.3E-9 352.5E-9 343.5E-9 580.6E-9 474.3E-9
U-234 141.0E-6 64.4E-6 50.3E-6 49.4E-6 84.6E-6 68.2E-6
Th-232 579.60E-06 7.37E-05 6.62E-05 6.39E-05 9.45E-05 1.06E-04
Th-228 466.2E-06 6.06E-05 4.16E-05 3.31 E-05 3.55E-05 3.31 E-05
total 1.32E-3 258.7E-6 204.1E-6 192.1 E-6 291.9E-6 270.2E-6
79

POINTE Yearly Dose for the different Groups (Sv/a)
Nuclide < 1a 1-2a 2-7a 7-12a 12-17a > 17a
U-238 1.1 E-3 483.2E-6 371 .?E-6 368.6E-6 622.5E-6 508.?E-6
U-235 7.9E-6 3.8E-6 2.9E-6 2.8E-6 4.?E-6 3.9E-6
U-234 1.1 E-3 523.4E-6 408.BE-6 401 .1E-6 687.6E-6 553.9E-6
Th-232 68.72E-06 8.74E-06 7.84E-06 7.58E-06 11.21 E-06 12.54E-06
Th-228 55.28E-06 7.19E-06 '4.93E-06 3.92E-06 4.21 E-06 3.93E-06
total 2.33E-3 1.03E-3 796.1E-6 784.0E-6 1.33E-3 1.0BE-3
POINT 21 Yearly Dose for the different Groups (Sv/a)
Nuclide < 1a 1-2a 2-7a 7-12a 12-17a > 17a
U-238 722.3E-6 331.4E-6 254.9E-6 252.8E-6 427.0E-6 348.9E-6
U-235 5.4E-6 2.6E-6 2.0E-6 1.9E-6 3.2E-6 2.6E-6
U-234 786.0E-6 359.0E-6 280.4E-6 275.1E-6 471.6E-6 379.9E-6
Th-232 38.73E-06 4.93E-06 4.42E-06 4.27E-06 6.32E-06 7.0?E-06
Th-228 31 .15E-06 4.05E-06 2.78E-06 2.21 E-06 2.37E-06 2.21 E-06
total 1.58E-3 702.0E-6 544.SE-6 536.3E-6 910.SE-6 740.BE-6
80

POINT 22 Yearly Dose for the different Groups (Sv/a)
Nuclide < 1a 1-2a 2-7a 7-12a 12-17a > 17a
U-238 1.1 E-3 486.3E-6 374.0E-6 370.9E-6 626.5E-6 512 .0E-6
U-235 7.9E-6 3.8E-6 2.9E-6 2.8E-6 4.?E-6 3.9E-6
U-234 1.2E-3 526.8E-6 411.5E-6 403.?E-6 692.0E-6 557.5E-6
Th-232 69.00E-06 8.76E-06 7.88E-06 7.61E-06 11 .25E-06 12.59E-06
Th-228 55.50E-06 7.22E-06 4.95E-06 3.94E-06 4.23E-06 3.94E-06
total 2.35E-3 1.03E-3 801.2E-6 789.0E-6 1.34E-3 1.09E-3
POINT Zm Yearly Dose for the different Groups (Sv/a)
Nuclide < 1a 1-2a 2-7a 7-12a 12-17a > 17a
U-238 571.1E-6 262.0E-6 201.6E-6 199.9E-6 337.6E-6 275.9E-6
U-235 4.3E-6 2.1 E-6 1.6E-6 1.5E-6 2.6E-6 2.1 E-6
U-234 621.5E-6 283.9E-6 221 .?E-6 217.5E-6 372.9E-6 300.4E-6
Th-232 42.78E-06 5.44E-06 4.88E-06 4.72E-06 6.98E-06 7.81 E-06
Th-228 34.41 E-06 4.47E-06 3.0?E-06 2.44E-06 2.62E-07 2.44E-07
total 1.27E-3 557.9E-6 432.BE-6 426.1E-6 722.6E-6 588.6E-6
81

Appendix 5: Data collected by Fayazi in 2003 (Fayazi, 2005)
Con11ituent1 OV-1 OV-1 OY-2 OV-2 OY-3 OV-4 OV-S DV-6 OV-7 DV-8 OV-9 DV-10 OV-11 DV-Sl om 0\1-SJ DV-Oam Constihi!nts
I~~ !~~
EClmSlml 411 ~ll ~'5 &)) ll.."l 24 ;,o 61 ~-,J 11 m r19 s 171 j!tl 1121 11 EC(rnS!ml TOS 4((1} 4224 10:ias 13[00 ~la) !~ lid 511 2:iS m ~ms 10918 eA 1004 45!$ £24d2 !lo IDS
TAI. !As caco~ li liO <10 <10 <10 41 ~ <10 46 1~ <lO <10 <10 <10 <:O <10 41 TAUasCiCOl Cl Z4 1, ~ 16 w 11 s 13 23 14 100 4Z 1~ <3 <3 1 a Cl
f 01 01 -0.1 02 <0.1 02 0.4 Ol 0.4 02 <0.1 <O I 02 02 01 0.1 03 f
SOJ 2{00 m 5((0 l!25 n~ !fil :-0 1ic 2-19 lfil Q~'O Wil :is 400 2;4,} l2fl-0 ~ S04 Ci 421 376 ~ 72 &l ?3 ;,o 42 531 Z1 1~ fil 16 6.4 12 61 15 c. Mg 470 149 1, 1M i:tl ' 2 19 as 4 i;o 1\3 0.4 12 35 161 3,4 Mg J
K 14 16 1 5 1 6 6 8 25 5 0.5 6 2 02 05 02 3.4 K
Ni 111 H]5 ~ 4S e.13 :I) 16 31 45 Z1 5 3i 3 3 l 6 H Na NHl=H 14 14 I 0. 21 06 08 13 3 0) 4 ' <01 04 1 1.8 03 NH4=N I
TKN 14 10 10 7.i 14 25 18 5 l l t 9 <1 <1 15 74 <1 TKN
HOl=N <O I 03 <JI <O 1 <0.1 I 2 3 3 3 j <0.1 04 0.4 <0.1 01 NOl=N N02=H <01 01 <O 1 <0.1 <O I <0.1 0.1 Ol 1)2 02 0.1 <0 1 <0.1 <01 <01 <01 01 N02:N
OrthoP <O 1 <01 01 I~ H 02 4 <01 5 05 14 0.3 02 02 I~ a~ <01 OrthoP fotJIP <O I <10 11 31 15 <l 5 <1 <1 I B 1 <1 <1 2~ 85 <I T-OUIP
~ !Units! t2 ,. Ji 29 11 ~2 6.4 M 1 o.6 6-. )', ,. ' 5.3 ,~ .. , 24 24 1.1 pH {Units)
Cd <D,04 <OOl ..no; 0~7 <-O fil ~.04 ~o; <0(~ <004 ti) (); 0~ 0 le <ON <Ot~ <)j(); 0\6 <O ~ Cd Cr t.nm <CJ):3 015 1~ 18 <003 Of., 0.03 om <Oal S6 OS 1))00 032 116 H4 li.lro Cr
Co 023 114 l.9 14 6 ?2 Oil£ Ole 1 0.12 0] li7 11 <llN a& 3D2 17.51 <O lli Co Cu 0~ 003 4 6.1 25 000 051 O.~ Ord OJ 11.00 4.(Q <l)(i) 1£6 3M 12.47 ~OJ Cu
Ft ;o 'C5 1192 1 :iC } ;;; ~5 ~ ,, " Oi 0.71 JG5:- 11Ji Ofil L)i4 41i~ :;1J U2 ft
Pb 018 042 016 Ot. ODB <005 <O Cil 0 II 000 0.6 0~ OJ ~· 04Q He 02 Pb \In 1~! l35
,. !)
fUI 711 1,11 IUI IIH 110 HO IJII IUt1 0.13 01.1 316 927 <Otil Mn
Ni on 035 13 ,a Ol 4l 0118 011 081 OlS 011 ;~1 139 q)~ 123 5Ji ll.83 OC6 Ni
Zn 1.01 0'·' 12 1~3 Si5 l,l 1.ffi 21 0.1 111 tl3 11.3 003 1.16 82':l '.Q6 03 Zn
~ 01 <,l )';$ 442 I 48 04 Q7 e4 ll 09 rn 12 0.4 ~4 149 lWl 011 N Si 54 !UH 51 UIJ 116 21 43 l7 :1 3~ 1~ 41 "' Jill "' 0 , 1 llh Si
V <1 Ui!I <I ,10 <I lhf illt 1111 HH uu fu l Ull <1 <1 <\ <1 Uti V 8, 01 11111 -0 ,1 tot 06 ltU lilt UH JUO Uh UII u ,
<:1ll <0.1 01 0.5 HU BJ B <1 1101 <l tlU <1 <1 <1 <1 <1 <1 <I <I <1 <1 <I , 111 B
Mo <0,3 Hlll <u: JIii <03 ilU lili 111:1 UII Uh JIU HU (OJ <0.3 <03 <03 U H Mo
St 12 11111 -Of Hh <O I 4'.l.1 (II <Ill 1.6 <01 <Ill 0.5 <1 <I <1 0.9 llU Sr
As 11!11 UfU tlH Hill <1 <I <l <I <1 2l <I <I <1 (1 u HH 116
Oil&Giea. !5 <IO <10 <10 <10 <10 <10 <10 <10 fl <10 <10 ilh un Hd HU <IO Oil&Gm, Phai-Ols 00! 01 <O~ ~Ct(, <00? 005 ~[6 utu i llH 02S <vC~ <005 1111 llil llh 1111 <tl05 Pheools
Surl,ctmts <10 "'" <1-0 0,j <10 oOJ llfll JIili IJIH Hit mi ltlf tiU Iii.I illi IHI ilh Surtiet¥.!s Slll'dlngll OV-1 OV-1 OV-1 OV-2 OV-3 OV-4 DV~ ov~ DV,7 DV-8 OV,9 OV-10 OV-SI O'✓-S2 OV,Sl OV-S4 DV-Oam Sl!llCng ll
Dale :4!5~03 1lNov,O i s,P!.OJ 11~03 30Selll03 lOS!!K03 18 Nov.OJ 18Hov03 18 /lo'dl 18 Nov. 03 1!Nov.03 .. 25NOY.0 25Nov O' 25Nov,O; 15 ~0'10; 11Ded3 Dllt
82
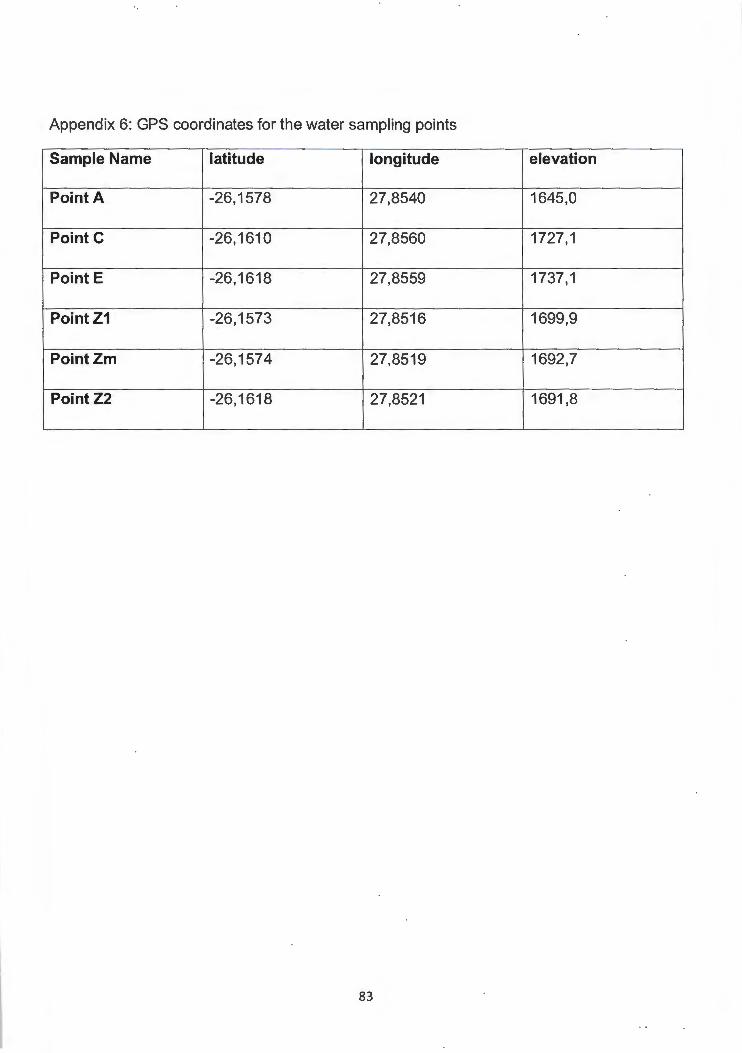
Appendix 6: GPS coordinates for the water sampling points
Sample Name latitude longitude elevation
Point A -26, 1578 27,8540 1645,0
Point C -26,1610 27,8560 1727, 1
Point E -26 ,1618 27,8559 1737,1
Point 21 -26, 1573 27,8516 1699,9
Point 2m -26 , 1574 27,8519 1692,7
Point 22 -26 ,1618 27,8521 1691 ,8
83