Transcriptome characterization and polymorphism detection ... · Transcriptome characterization and...
15
RESEARCH ARTICLE Open Access Transcriptome characterization and polymorphism detection between subspecies of big sagebrush (Artemisia tridentata) Prabin Bajgain 1 , Bryce A Richardson 2 , Jared C Price 3 , Richard C Cronn 4 and Joshua A Udall 1* Abstract Background: Big sagebrush (Artemisia tridentata) is one of the most widely distributed and ecologically important shrub species in western North America. This species serves as a critical habitat and food resource for many animals and invertebrates. Habitat loss due to a combination of disturbances followed by establishment of invasive plant species is a serious threat to big sagebrush ecosystem sustainability. Lack of genomic data has limited our understanding of the evolutionary history and ecological adaptation in this species. Here, we report on the sequencing of expressed sequence tags (ESTs) and detection of single nucleotide polymorphism (SNP) and simple sequence repeat (SSR) markers in subspecies of big sagebrush. Results: cDNA of A. tridentata sspp. tridentata and vaseyana were normalized and sequenced using the 454 GS FLX Titanium pyrosequencing technology. Assembly of the reads resulted in 20,357 contig consensus sequences in ssp. tridentata and 20,250 contigs in ssp. vaseyana. A BLASTx search against the non-redundant (NR) protein database using 29,541 consensus sequences obtained from a combined assembly resulted in 21,436 sequences with significant blast alignments (≤ 1e -15 ). A total of 20,952 SNPs and 119 polymorphic SSRs were detected between the two subspecies. SNPs were validated through various methods including sequence capture. Validation of SNPs in different individuals uncovered a high level of nucleotide variation in EST sequences. EST sequences of a third, tetraploid subspecies (ssp. wyomingensis) obtained by Illumina sequencing were mapped to the consensus sequences of the combined 454 EST assembly. Approximately one-third of the SNPs between sspp. tridentata and vaseyana identified in the combined assembly were also polymorphic within the two geographically distant ssp. wyomingensis samples. Conclusion: We have produced a large EST dataset for Artemisia tridentata, which contains a large sample of the big sagebrush leaf transcriptome. SNP mapping among the three subspecies suggest the origin of ssp. wyomingensis via mixed ancestry. A large number of SNP and SSR markers provide the foundation for future research to address questions in big sagebrush evolution, ecological genetics, and conservation using genomic approaches. Background Artemisia (Asteraceae) is a widely distributed plant genus that is predominantly found in temperate regions of the northern hemisphere. Some species within this genus are valued in medicine, cooking, and forage for livestock [1,2]. Big sagebrush (Artemisia tridentata) is recognized for its importance to ecosystem function. Big sagebrush is one of the most abundant, widespread, and ecologically important woody shrub species in the inter- mountain regions of western North America. This spe- cies contains three widespread subspecies ( A. t. ssp. tridentata, A. t. ssp. vaseyana, and A. t. ssp. wyomingen- sis) that occupy distinct habitats and two less common subspecies (A. t. ssp. spiciformis and A. t. ssp. xericensis) [3,4]. Prior to the Anglo-American settlement, big sage- brush was estimated to occupy up to 100 million ha of the western United States, while contemporary estimates have shown that the area has been reduced to * Correspondence: [email protected] 1 Plant and Wildlife Science Department, Brigham Young University, Provo, UT 84602, USA Full list of author information is available at the end of the article Bajgain et al. BMC Genomics 2011, 12:370 http://www.biomedcentral.com/1471-2164/12/370 © 2011 Bajgain et al; licensee BioMed Central Ltd. This is an Open Access article distributed under the terms of the Creative Commons Attribution License (http://creativecommons.org/licenses/by/2.0), which permits unrestricted use, distribution, and reproduction in any medium, provided the original work is properly cited.
Transcript of Transcriptome characterization and polymorphism detection ... · Transcriptome characterization and...
RESEARCH ARTICLE Open Access
Transcriptome characterization andpolymorphism detection between subspecies ofbig sagebrush (Artemisia tridentata)Prabin Bajgain1, Bryce A Richardson2, Jared C Price3, Richard C Cronn4 and Joshua A Udall1*
Abstract
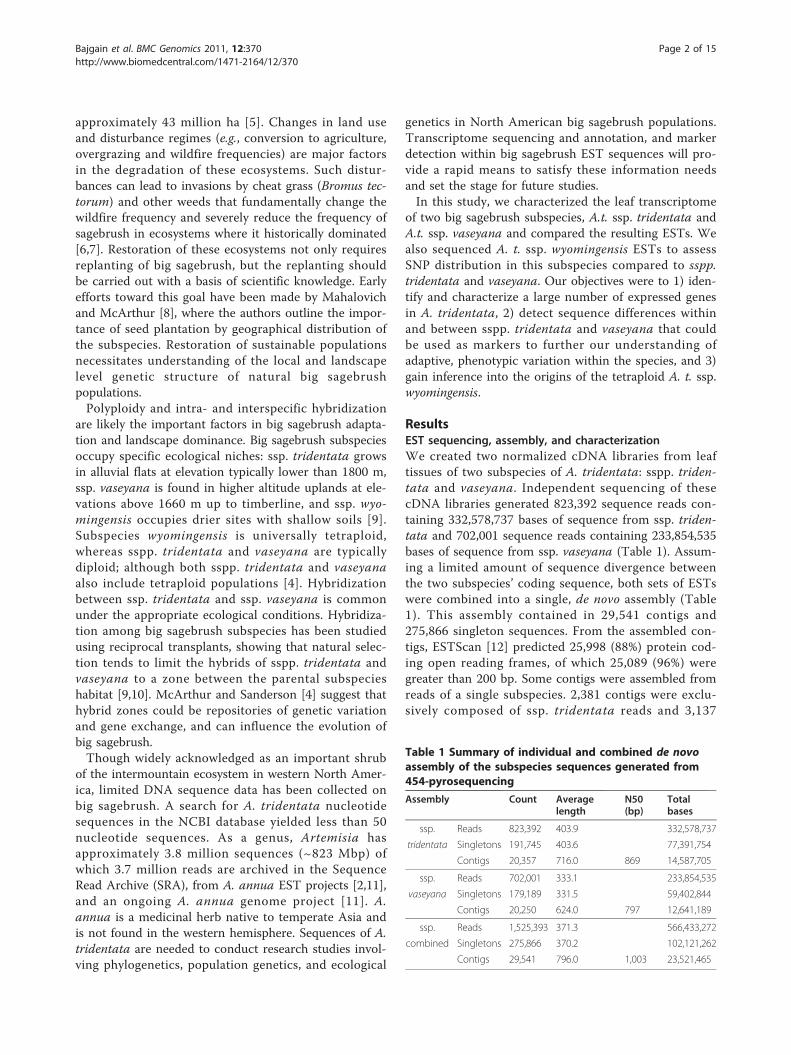
Background: Big sagebrush (Artemisia tridentata) is one of the most widely distributed and ecologically importantshrub species in western North America. This species serves as a critical habitat and food resource for manyanimals and invertebrates. Habitat loss due to a combination of disturbances followed by establishment of invasiveplant species is a serious threat to big sagebrush ecosystem sustainability. Lack of genomic data has limited ourunderstanding of the evolutionary history and ecological adaptation in this species. Here, we report on thesequencing of expressed sequence tags (ESTs) and detection of single nucleotide polymorphism (SNP) and simplesequence repeat (SSR) markers in subspecies of big sagebrush.
Results: cDNA of A. tridentata sspp. tridentata and vaseyana were normalized and sequenced using the 454 GS FLXTitanium pyrosequencing technology. Assembly of the reads resulted in 20,357 contig consensus sequences in ssp.tridentata and 20,250 contigs in ssp. vaseyana. A BLASTx search against the non-redundant (NR) protein databaseusing 29,541 consensus sequences obtained from a combined assembly resulted in 21,436 sequences withsignificant blast alignments (≤ 1e-15). A total of 20,952 SNPs and 119 polymorphic SSRs were detected between thetwo subspecies. SNPs were validated through various methods including sequence capture. Validation of SNPs indifferent individuals uncovered a high level of nucleotide variation in EST sequences. EST sequences of a third,tetraploid subspecies (ssp. wyomingensis) obtained by Illumina sequencing were mapped to the consensussequences of the combined 454 EST assembly. Approximately one-third of the SNPs between sspp. tridentata andvaseyana identified in the combined assembly were also polymorphic within the two geographically distant ssp.wyomingensis samples.
Conclusion: We have produced a large EST dataset for Artemisia tridentata, which contains a large sample of thebig sagebrush leaf transcriptome. SNP mapping among the three subspecies suggest the origin of ssp.wyomingensis via mixed ancestry. A large number of SNP and SSR markers provide the foundation for futureresearch to address questions in big sagebrush evolution, ecological genetics, and conservation using genomicapproaches.
BackgroundArtemisia (Asteraceae) is a widely distributed plantgenus that is predominantly found in temperate regionsof the northern hemisphere. Some species within thisgenus are valued in medicine, cooking, and forage forlivestock [1,2]. Big sagebrush (Artemisia tridentata) isrecognized for its importance to ecosystem function. Big
sagebrush is one of the most abundant, widespread, andecologically important woody shrub species in the inter-mountain regions of western North America. This spe-cies contains three widespread subspecies (A. t. ssp.tridentata, A. t. ssp. vaseyana, and A. t. ssp. wyomingen-sis) that occupy distinct habitats and two less commonsubspecies (A. t. ssp. spiciformis and A. t. ssp. xericensis)[3,4]. Prior to the Anglo-American settlement, big sage-brush was estimated to occupy up to 100 million ha ofthe western United States, while contemporary estimateshave shown that the area has been reduced to
* Correspondence: [email protected] and Wildlife Science Department, Brigham Young University, Provo,UT 84602, USAFull list of author information is available at the end of the article
Bajgain et al. BMC Genomics 2011, 12:370http://www.biomedcentral.com/1471-2164/12/370
© 2011 Bajgain et al; licensee BioMed Central Ltd. This is an Open Access article distributed under the terms of the Creative CommonsAttribution License (http://creativecommons.org/licenses/by/2.0), which permits unrestricted use, distribution, and reproduction inany medium, provided the original work is properly cited.
approximately 43 million ha [5]. Changes in land useand disturbance regimes (e.g., conversion to agriculture,overgrazing and wildfire frequencies) are major factorsin the degradation of these ecosystems. Such distur-bances can lead to invasions by cheat grass (Bromus tec-torum) and other weeds that fundamentally change thewildfire frequency and severely reduce the frequency ofsagebrush in ecosystems where it historically dominated[6,7]. Restoration of these ecosystems not only requiresreplanting of big sagebrush, but the replanting shouldbe carried out with a basis of scientific knowledge. Earlyefforts toward this goal have been made by Mahalovichand McArthur [8], where the authors outline the impor-tance of seed plantation by geographical distribution ofthe subspecies. Restoration of sustainable populationsnecessitates understanding of the local and landscapelevel genetic structure of natural big sagebrushpopulations.Polyploidy and intra- and interspecific hybridization
are likely the important factors in big sagebrush adapta-tion and landscape dominance. Big sagebrush subspeciesoccupy specific ecological niches: ssp. tridentata growsin alluvial flats at elevation typically lower than 1800 m,ssp. vaseyana is found in higher altitude uplands at ele-vations above 1660 m up to timberline, and ssp. wyo-mingensis occupies drier sites with shallow soils [9].Subspecies wyomingensis is universally tetraploid,whereas sspp. tridentata and vaseyana are typicallydiploid; although both sspp. tridentata and vaseyanaalso include tetraploid populations [4]. Hybridizationbetween ssp. tridentata and ssp. vaseyana is commonunder the appropriate ecological conditions. Hybridiza-tion among big sagebrush subspecies has been studiedusing reciprocal transplants, showing that natural selec-tion tends to limit the hybrids of sspp. tridentata andvaseyana to a zone between the parental subspecieshabitat [9,10]. McArthur and Sanderson [4] suggest thathybrid zones could be repositories of genetic variationand gene exchange, and can influence the evolution ofbig sagebrush.Though widely acknowledged as an important shrub
of the intermountain ecosystem in western North Amer-ica, limited DNA sequence data has been collected onbig sagebrush. A search for A. tridentata nucleotidesequences in the NCBI database yielded less than 50nucleotide sequences. As a genus, Artemisia hasapproximately 3.8 million sequences (~823 Mbp) ofwhich 3.7 million reads are archived in the SequenceRead Archive (SRA), from A. annua EST projects [2,11],and an ongoing A. annua genome project [11]. A.annua is a medicinal herb native to temperate Asia andis not found in the western hemisphere. Sequences of A.tridentata are needed to conduct research studies invol-ving phylogenetics, population genetics, and ecological
genetics in North American big sagebrush populations.Transcriptome sequencing and annotation, and markerdetection within big sagebrush EST sequences will pro-vide a rapid means to satisfy these information needsand set the stage for future studies.In this study, we characterized the leaf transcriptome
of two big sagebrush subspecies, A.t. ssp. tridentata andA.t. ssp. vaseyana and compared the resulting ESTs. Wealso sequenced A. t. ssp. wyomingensis ESTs to assessSNP distribution in this subspecies compared to sspp.tridentata and vaseyana. Our objectives were to 1) iden-tify and characterize a large number of expressed genesin A. tridentata, 2) detect sequence differences withinand between sspp. tridentata and vaseyana that couldbe used as markers to further our understanding ofadaptive, phenotypic variation within the species, and 3)gain inference into the origins of the tetraploid A. t. ssp.wyomingensis.
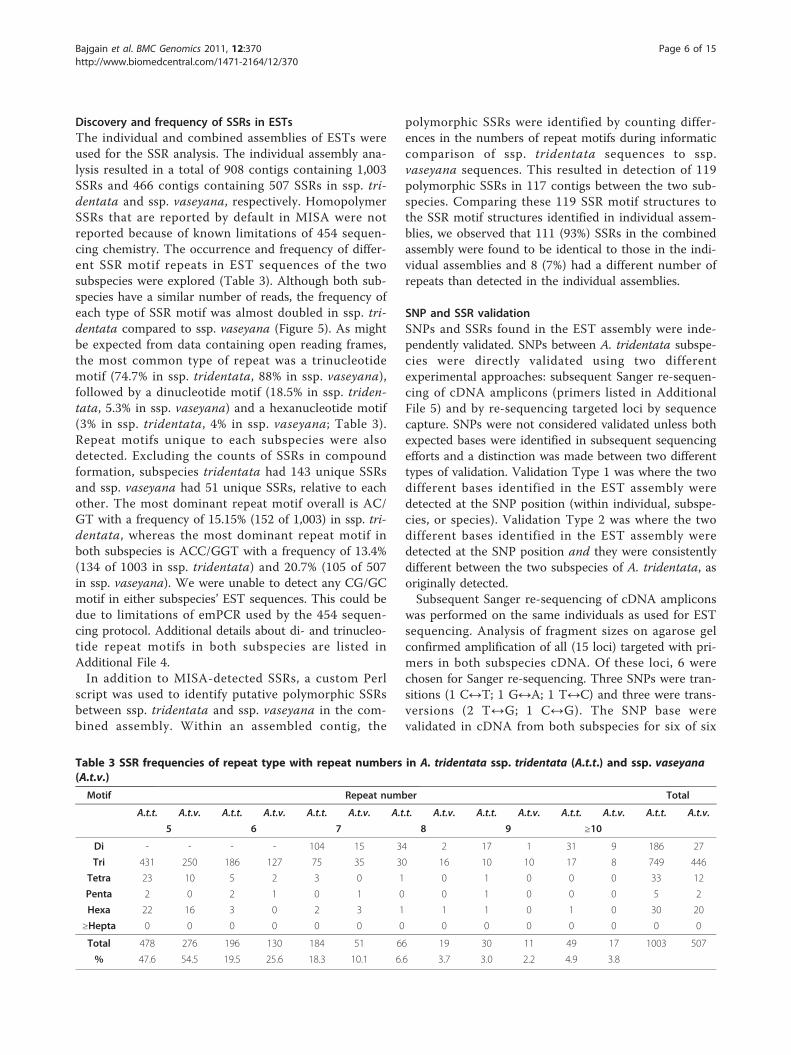
ResultsEST sequencing, assembly, and characterizationWe created two normalized cDNA libraries from leaftissues of two subspecies of A. tridentata: sspp. triden-tata and vaseyana. Independent sequencing of thesecDNA libraries generated 823,392 sequence reads con-taining 332,578,737 bases of sequence from ssp. triden-tata and 702,001 sequence reads containing 233,854,535bases of sequence from ssp. vaseyana (Table 1). Assum-ing a limited amount of sequence divergence betweenthe two subspecies’ coding sequence, both sets of ESTswere combined into a single, de novo assembly (Table1). This assembly contained in 29,541 contigs and275,866 singleton sequences. From the assembled con-tigs, ESTScan [12] predicted 25,998 (88%) protein cod-ing open reading frames, of which 25,089 (96%) weregreater than 200 bp. Some contigs were assembled fromreads of a single subspecies. 2,381 contigs were exclu-sively composed of ssp. tridentata reads and 3,137
Table 1 Summary of individual and combined de novoassembly of the subspecies sequences generated from454-pyrosequencing
Assembly Count Averagelength
N50(bp)
Totalbases
ssp. Reads 823,392 403.9 332,578,737
tridentata Singletons 191,745 403.6 77,391,754
Contigs 20,357 716.0 869 14,587,705
ssp. Reads 702,001 333.1 233,854,535
vaseyana Singletons 179,189 331.5 59,402,844
Contigs 20,250 624.0 797 12,641,189
ssp. Reads 1,525,393 371.3 566,433,272
combined Singletons 275,866 370.2 102,121,262
Contigs 29,541 796.0 1,003 23,521,465
Bajgain et al. BMC Genomics 2011, 12:370http://www.biomedcentral.com/1471-2164/12/370
Page 2 of 15

contigs were exclusively composed of only ssp. vaseyanareads (Figure 1). EST read number ranged from 2 readsto 3,161 reads in a contig, with a median of 23 ESTreads per contigs. Unless stated otherwise, the combinedassembly sequences were used for subsequent bioinfor-matic analyses. From the remaining, unassembled reads(singletons), ESTScan predicted 136,305 (49.4%) proteincoding open reading frames, of which 112,028 (82.2%)were greater than 200 bp.Protein homologies between big sagebrush ESTs and
the NR protein database were identified using BLASTx.Out of 29,541 assembled contig sequences, 21,436sequences (72.6%) had significant alignments (≤1e-15)and out of 275,866 singleton sequences, 70,836sequences (25.7%) had significant alignments (≤1e-15).Of the contigs with BLASTx hits, 9,696 (45.2%)sequences had their best blast alignment to Vitis viniferaand 215 (7.3%) and 80 (0.27%) to Helianthus annus andLactuca sativa respectively, both of which are in theAsteraceae. Only fifty-four (0.2%) contigs had their bestmatches to Artemisia annua, owing to the limited num-ber of Artemisia proteins (167) in the NR protein data-base. The NR BLAST results were utilized by Blast2GO[13] to annotate the EST sequences with GO terms.One or more GO IDs were assigned to 18,397 (62.3%)contigs with a maximum of 21 GO IDs assigned to asingle sequence. The distributions of contigs in three,non-mutually exclusive GO categories: biological process(BP), cellular component (CC), and molecular function(MF) were well represented by a diverse set of putativebiological functions (Figure 2). In BP category, the mostabundant GO term was metabolic process (29.9%), fol-lowed by cellular process (21.8%), and unknown biologi-cal process (8.4%). In CC category, unknown cellularcomponent was the most abundant (32.5%), followed bycell component (32.0%) and intracellular component(25.3%). Similarly in the MF category, binding was the
most abundant category (32.1%), followed by catalyticactivity (19.7%), and transferase activity (16.8%). Thethree groups (BP, CC and MF) are not mutually exclu-sive; therefore, some contigs were assigned gene ontolo-gies in more than one type of category.Comparison of the 29,541 contig sequences against
the Pfam-A domain database with an e-value cutoff at1e-5 resulted in 15,812 contigs (53.5%) matching at leastone protein domain model. The distribution of thedomains ranged from a maximum of 13 domainsassigned to the same contig to a minimum of onedomain per contig (Additional File 1). The three mostcommon domains were the Protein kinase domain (Pki-nase, Pfam ID: PF00069.18), followed by the Protein tyr-osine kinase domain (Pkinase_Tyr, Pfam ID:PF07714.10), and the RNA recognition motif domain(RRF_1, Pfam ID: PF00076.15).
Genes associated with secondary metabolites synthesis inA. tridentataBig sagebrush leaves are known to synthesize and storelarge quantities of terpenoids on the epidermal surfacesof glandular leaf trichomes [14]. Therefore, a search wasconducted among the annotated contigs to identifyputative genes that code for enzymes involved in terpe-noid synthesis via the Mevalonic acid (MVA) and 2-C-Methyl-D-Erythritol-4-Phosphate (MEP) biosyntheticpathways [2]. Most of the enzymes involved in thesepathways were detected in our annotated contigsequences, and are presented in the additional materials(Additional File 2). Coumarin derivatives are consideredas a tool for subspecies identification because big sage-brush subspecies differ in their amount of fluorescence[15,16]. We also searched the annotated contigs forenzymes involved in coumarin biosynthesis. Coumarinsin plants are derived via the phenylpropanoid pathwayfrom p-coumaroyl CoA [17,18]. At the top of the phe-nylpropanoid pathway, phenylalanine lyase acts on thesubstrate L-phenylalanine, and converts it to cinnamate(often, trans-cinnamate) which is then oxidized to p-coumarate by the enzyme cinnamate 4-hydroxylase. Theenzyme 4-hydroxycinnamoyl CoA ligase then ligates anS-CoA group to p-coumarate, forming p-coumaroylCoA. We were able to detect putative gene sequencesfor these three main enzymes involved in coumarinsynthesis in our annotated contig dataset. Individualtests of enzymatic substrates and products are needed toconfirm their roles in coumarin synthesis within bigsagebrush.
Discovery and frequency of SNPs in ESTsA large number of resident SNPs were discovered withinthe accessions examined in this study. A search forSNPs yielded 59,093 ssp. tridentata (1 SNP/246 bp)
0
200
400
600
800
1000
1200
2 4 6 8 10 12 14 16 18 20 22 24 30 50 70 90
Num
ber o
f con
tigs
EST read counts in contigs
combined
tridentata
vaseyana
Figure 1 Histogram of number of EST members in a contig.Different colors in the bars indicate contigs from the combinedassembly composed of ESTs from each subspecies and thosederived from ESTs from both subspecies. Contigs with more than100 EST members are not illustrated.
Bajgain et al. BMC Genomics 2011, 12:370http://www.biomedcentral.com/1471-2164/12/370
Page 3 of 15

A
B
C
Figure 2 Distribution of consensus sequences from combined assembly of Artemisia tridentata ssp. tridentata and ssp. vaseyana inthree main GO categories. A: Distribution of GO terms in biological process (BP) category; B: Distribution of GO terms in cellular component(CC) category; C: Distribution of GO terms in molecular function (MF) category. The annotated contigs were passed through GOSlimViewer toobtain a high level summary of functions. The number of contigs annotated to BP, CC and MF categories were 8,144, 10,488, and 14,000,respectively.
Bajgain et al. BMC Genomics 2011, 12:370http://www.biomedcentral.com/1471-2164/12/370
Page 4 of 15

SNPs with an average base coverage of 18 × and 61,028ssp. vaseyana SNPs (1 SNP/207 bp) with an averagebase coverage of 15×. These putative SNPs may repre-sent a high level of heterozygosity that exists in bigsagebrush through its large effective population size andits wind-pollinated reproductive strategy. Future segre-gation analysis would be needed to ascertain if theseputative SNPs are truly two alleles at a single locus oran artifact of the sequencing and/or assembly process.The individual assemblies contained many fewer SNPsthan detected in the combined assembly (135,310) priorto filtering those SNPs that were not discriminatorybetween sspp. tridentata and vaseyana (i.e. nearlyhomogeneous within a single DNA source, but differentbetween the two DNA sources within a contig).When only SNPs that were near homogenous (>90%)
within the two accessions were considered, a total of20,952 SNPs were detected between the sspp. tridentataand vaseyana when a threshold of 8 × coverage wasapplied (average of 20 × coverage, Figure 3). The SNPdensity in the EST sequences between subspecies was 1SNP/1123 bp. The analysis showed that 8,598 (29%) ofthe total consensus sequences contained at least oneSNP and SNPs per contig ranged from 4,037 contigswith a single SNP to a single contig with 39 SNPs (Fig-ure 4). We chose to exclude SNPs that were less that90% homogeneous within either accession 1) to providea reduced set SNPs that could discriminate between thetwo subspecies and 2) to allow for some degree ofsequencing error at the SNP position when there waslow sequence coverage. To estimate the effect of SNPheterogeneity within a DNA source, SNPs were alsoidentified with a threshold of homogeneity for SNPs of99%. This resulted in the detection of 18,173 SNPs indi-cating that 13% of the SNPs originally detected eitherssp. tridentata or ssp. vaseyana had more than one baseat that position albeit at a low frequency. These multiplebases could be the result of heterozygosity, differential
expression of alleles, assembly error, or sequencingerror. Some of the contigs with high number of SNPs(>13 SNPs) are likely artifacts of applying a single set ofassembly parameters to a set of heterogeneous genesand splice forms - each with their own evolutionary his-tory. Collectively, contigs with an abundance of SNPs(>13) are best avoided in future population genetic stu-dies, though individually each contig with a multitude ofSNPs might provide an interesting case study of gene orgene family evolution. Contigs with a high number ofSNPs have been highlighted in Additional File 3 alongwith metadata for each contig. Of 20,952 SNPs, 16,317SNPs were distributed in the putative coding sequenceand 4,365 SNPs were in the 5’or 3’ untranslated regions.Forty-two percent of the identified SNPs fit within the20 to 30% range for minor allele frequency, 30% withinthe 30 to 40% range and the remaining 28% within the40 to 50% range. As expected, the transition mutations(A/G or C/T) were the most abundant, outnumberingthe transversion mutations (A/T, C/A, G/C, G/T) by 3.4× margin (Table 2). All SNP information of the com-bined assembly and the sequences with SNPs have beendeposited in dbSNP in Genbank. The SNPs are sub-mitted under the handle UDALL_LAB (Genbank:ss252842630 to ss252863866; build B133). Full contigsequences are available upon request.
0
500
1000
1500
2000
2500
8 12 16 20 24 28 32 36 40 44 48 52 56 60
Num
ber o
f SN
Ps
SNP coverage depth
Figure 3 Distribution of the number of SNPs by read coveragedepth. The average depth of coverage for an SNP was 20×. Thenumbers of SNPs with read coverage depth of 61 × or higher arenot shown.
0
5000
10000
15000
20000
25000
0 2 4 6 8 10 12 14 16 18 20 22 24 26 28 31 36 38
Num
ber o
f Con
tigs
Number of SNPs
Figure 4 Distribution of contigs by number of SNPs in acombined assembly of A. t. ssp. tridentata and ssp. Vaseyana.The numbers of contigs with 25 or more SNPs have been groupedtogether.
Table 2 Frequency of SNPs between ssp. tridentata andssp. vaseyana by mutation types
SNP type Count % Count % Total
Transitions C/T 6456 30.81 62.24
A/G 6586 31.43
Transversions A/T 2352 11.23 37.7
C/G 1533 7.32
A/C 2043 9.75
G/T 1970 9.40
Total 20940 99.94 99.94
Bajgain et al. BMC Genomics 2011, 12:370http://www.biomedcentral.com/1471-2164/12/370
Page 5 of 15
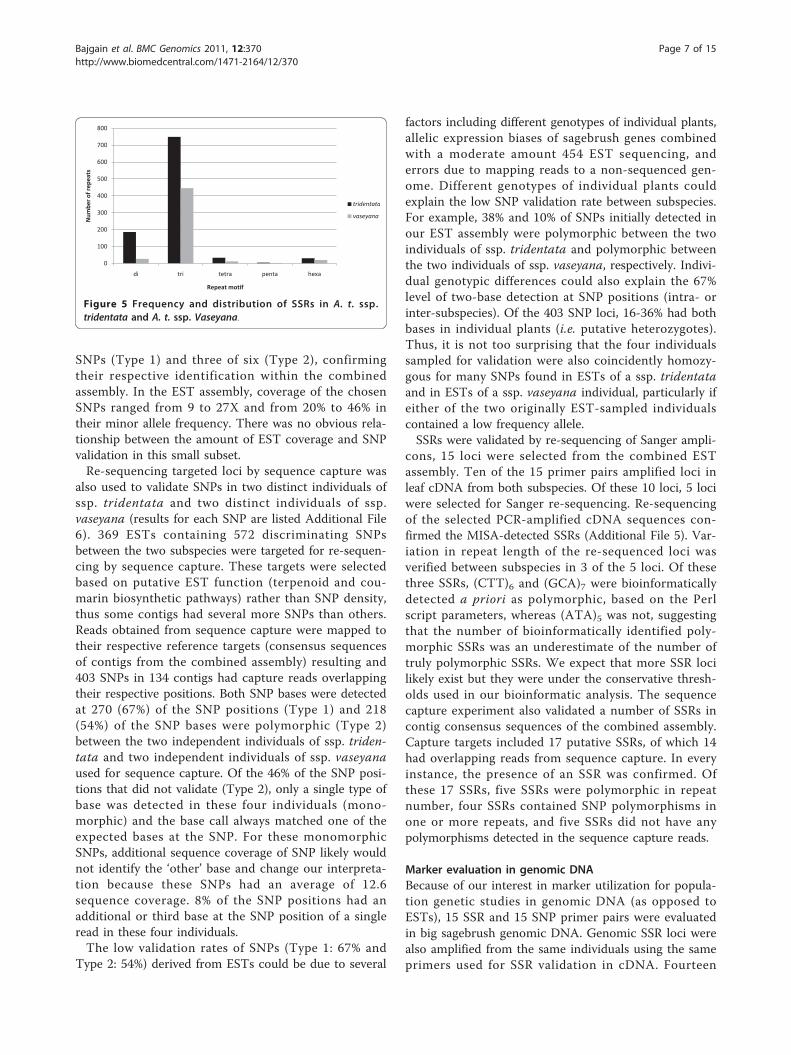
Discovery and frequency of SSRs in ESTsThe individual and combined assemblies of ESTs wereused for the SSR analysis. The individual assembly ana-lysis resulted in a total of 908 contigs containing 1,003SSRs and 466 contigs containing 507 SSRs in ssp. tri-dentata and ssp. vaseyana, respectively. HomopolymerSSRs that are reported by default in MISA were notreported because of known limitations of 454 sequen-cing chemistry. The occurrence and frequency of differ-ent SSR motif repeats in EST sequences of the twosubspecies were explored (Table 3). Although both sub-species have a similar number of reads, the frequency ofeach type of SSR motif was almost doubled in ssp. tri-dentata compared to ssp. vaseyana (Figure 5). As mightbe expected from data containing open reading frames,the most common type of repeat was a trinucleotidemotif (74.7% in ssp. tridentata, 88% in ssp. vaseyana),followed by a dinucleotide motif (18.5% in ssp. triden-tata, 5.3% in ssp. vaseyana) and a hexanucleotide motif(3% in ssp. tridentata, 4% in ssp. vaseyana; Table 3).Repeat motifs unique to each subspecies were alsodetected. Excluding the counts of SSRs in compoundformation, subspecies tridentata had 143 unique SSRsand ssp. vaseyana had 51 unique SSRs, relative to eachother. The most dominant repeat motif overall is AC/GT with a frequency of 15.15% (152 of 1,003) in ssp. tri-dentata, whereas the most dominant repeat motif inboth subspecies is ACC/GGT with a frequency of 13.4%(134 of 1003 in ssp. tridentata) and 20.7% (105 of 507in ssp. vaseyana). We were unable to detect any CG/GCmotif in either subspecies’ EST sequences. This could bedue to limitations of emPCR used by the 454 sequen-cing protocol. Additional details about di- and trinucleo-tide repeat motifs in both subspecies are listed inAdditional File 4.In addition to MISA-detected SSRs, a custom Perl
script was used to identify putative polymorphic SSRsbetween ssp. tridentata and ssp. vaseyana in the com-bined assembly. Within an assembled contig, the
polymorphic SSRs were identified by counting differ-ences in the numbers of repeat motifs during informaticcomparison of ssp. tridentata sequences to ssp.vaseyana sequences. This resulted in detection of 119polymorphic SSRs in 117 contigs between the two sub-species. Comparing these 119 SSR motif structures tothe SSR motif structures identified in individual assem-blies, we observed that 111 (93%) SSRs in the combinedassembly were found to be identical to those in the indi-vidual assemblies and 8 (7%) had a different number ofrepeats than detected in the individual assemblies.
SNP and SSR validationSNPs and SSRs found in the EST assembly were inde-pendently validated. SNPs between A. tridentata subspe-cies were directly validated using two differentexperimental approaches: subsequent Sanger re-sequen-cing of cDNA amplicons (primers listed in AdditionalFile 5) and by re-sequencing targeted loci by sequencecapture. SNPs were not considered validated unless bothexpected bases were identified in subsequent sequencingefforts and a distinction was made between two differenttypes of validation. Validation Type 1 was where the twodifferent bases identified in the EST assembly weredetected at the SNP position (within individual, subspe-cies, or species). Validation Type 2 was where the twodifferent bases identified in the EST assembly weredetected at the SNP position and they were consistentlydifferent between the two subspecies of A. tridentata, asoriginally detected.Subsequent Sanger re-sequencing of cDNA amplicons
was performed on the same individuals as used for ESTsequencing. Analysis of fragment sizes on agarose gelconfirmed amplification of all (15 loci) targeted with pri-mers in both subspecies cDNA. Of these loci, 6 werechosen for Sanger re-sequencing. Three SNPs were tran-sitions (1 C↔T; 1 G↔A; 1 T↔C) and three were trans-versions (2 T↔G; 1 C↔G). The SNP base werevalidated in cDNA from both subspecies for six of six
Table 3 SSR frequencies of repeat type with repeat numbers in A. tridentata ssp. tridentata (A.t.t.) and ssp. vaseyana(A.t.v.)
Motif Repeat number Total
A.t.t. A.t.v. A.t.t. A.t.v. A.t.t. A.t.v. A.t.t. A.t.v. A.t.t. A.t.v. A.t.t. A.t.v. A.t.t. A.t.v.
5 6 7 8 9 ≥10
Di - - - - 104 15 34 2 17 1 31 9 186 27
Tri 431 250 186 127 75 35 30 16 10 10 17 8 749 446
Tetra 23 10 5 2 3 0 1 0 1 0 0 0 33 12
Penta 2 0 2 1 0 1 0 0 1 0 0 0 5 2
Hexa 22 16 3 0 2 3 1 1 1 0 1 0 30 20
≥Hepta 0 0 0 0 0 0 0 0 0 0 0 0 0 0
Total 478 276 196 130 184 51 66 19 30 11 49 17 1003 507
% 47.6 54.5 19.5 25.6 18.3 10.1 6.6 3.7 3.0 2.2 4.9 3.8
Bajgain et al. BMC Genomics 2011, 12:370http://www.biomedcentral.com/1471-2164/12/370
Page 6 of 15
SNPs (Type 1) and three of six (Type 2), confirmingtheir respective identification within the combinedassembly. In the EST assembly, coverage of the chosenSNPs ranged from 9 to 27X and from 20% to 46% intheir minor allele frequency. There was no obvious rela-tionship between the amount of EST coverage and SNPvalidation in this small subset.Re-sequencing targeted loci by sequence capture was
also used to validate SNPs in two distinct individuals ofssp. tridentata and two distinct individuals of ssp.vaseyana (results for each SNP are listed Additional File6). 369 ESTs containing 572 discriminating SNPsbetween the two subspecies were targeted for re-sequen-cing by sequence capture. These targets were selectedbased on putative EST function (terpenoid and cou-marin biosynthetic pathways) rather than SNP density,thus some contigs had several more SNPs than others.Reads obtained from sequence capture were mapped totheir respective reference targets (consensus sequencesof contigs from the combined assembly) resulting and403 SNPs in 134 contigs had capture reads overlappingtheir respective positions. Both SNP bases were detectedat 270 (67%) of the SNP positions (Type 1) and 218(54%) of the SNP bases were polymorphic (Type 2)between the two independent individuals of ssp. triden-tata and two independent individuals of ssp. vaseyanaused for sequence capture. Of the 46% of the SNP posi-tions that did not validate (Type 2), only a single type ofbase was detected in these four individuals (mono-morphic) and the base call always matched one of theexpected bases at the SNP. For these monomorphicSNPs, additional sequence coverage of SNP likely wouldnot identify the ‘other’ base and change our interpreta-tion because these SNPs had an average of 12.6sequence coverage. 8% of the SNP positions had anadditional or third base at the SNP position of a singleread in these four individuals.The low validation rates of SNPs (Type 1: 67% and
Type 2: 54%) derived from ESTs could be due to several
factors including different genotypes of individual plants,allelic expression biases of sagebrush genes combinedwith a moderate amount 454 EST sequencing, anderrors due to mapping reads to a non-sequenced gen-ome. Different genotypes of individual plants couldexplain the low SNP validation rate between subspecies.For example, 38% and 10% of SNPs initially detected inour EST assembly were polymorphic between the twoindividuals of ssp. tridentata and polymorphic betweenthe two individuals of ssp. vaseyana, respectively. Indivi-dual genotypic differences could also explain the 67%level of two-base detection at SNP positions (intra- orinter-subspecies). Of the 403 SNP loci, 16-36% had bothbases in individual plants (i.e. putative heterozygotes).Thus, it is not too surprising that the four individualssampled for validation were also coincidently homozy-gous for many SNPs found in ESTs of a ssp. tridentataand in ESTs of a ssp. vaseyana individual, particularly ifeither of the two originally EST-sampled individualscontained a low frequency allele.SSRs were validated by re-sequencing of Sanger ampli-
cons, 15 loci were selected from the combined ESTassembly. Ten of the 15 primer pairs amplified loci inleaf cDNA from both subspecies. Of these 10 loci, 5 lociwere selected for Sanger re-sequencing. Re-sequencingof the selected PCR-amplified cDNA sequences con-firmed the MISA-detected SSRs (Additional File 5). Var-iation in repeat length of the re-sequenced loci wasverified between subspecies in 3 of the 5 loci. Of thesethree SSRs, (CTT)6 and (GCA)7 were bioinformaticallydetected a priori as polymorphic, based on the Perlscript parameters, whereas (ATA)5 was not, suggestingthat the number of bioinformatically identified poly-morphic SSRs was an underestimate of the number oftruly polymorphic SSRs. We expect that more SSR locilikely exist but they were under the conservative thresh-olds used in our bioinformatic analysis. The sequencecapture experiment also validated a number of SSRs incontig consensus sequences of the combined assembly.Capture targets included 17 putative SSRs, of which 14had overlapping reads from sequence capture. In everyinstance, the presence of an SSR was confirmed. Ofthese 17 SSRs, five SSRs were polymorphic in repeatnumber, four SSRs contained SNP polymorphisms inone or more repeats, and five SSRs did not have anypolymorphisms detected in the sequence capture reads.
Marker evaluation in genomic DNABecause of our interest in marker utilization for popula-tion genetic studies in genomic DNA (as opposed toESTs), 15 SSR and 15 SNP primer pairs were evaluatedin big sagebrush genomic DNA. Genomic SSR loci werealso amplified from the same individuals using the sameprimers used for SSR validation in cDNA. Fourteen
0
100
200
300
400
500
600
700
800
di tri tetra penta hexa
Num
ber o
f rep
eats
Repeat motif
tridentata
vaseyana
Figure 5 Frequency and distribution of SSRs in A. t. ssp.tridentata and A. t. ssp. Vaseyana.
Bajgain et al. BMC Genomics 2011, 12:370http://www.biomedcentral.com/1471-2164/12/370
Page 7 of 15
(93%) SSR loci out of 15 SSR loci amplified in bothsspp. tridentata and vaseyana and 11 (73%) SSR loci outof 15 SSR loci amplified in ssp. wyomingensis. These 11primers pairs produced fragments of expected sizes inall three subspecies. Re-sequencing of genomic DNAamplicons for SSR validation was not performed, but weexpect that the amplified genomic DNA fragments alsocontain the targeted SSRs.Of the 15 SNP primer pairs, 11 (73%) amplified tar-
geted loci in all three subspecies including the five lociused for cDNA SNP validation. The genomic fragmentsof these five loci were sequenced in two ssp. tridentataindividuals, three ssp. vaseyana individuals and two ssp.wyomingensis individuals. For two loci, we observed thatboth sspp. tridentata and vaseyana were homozygous ateach SNP allele (as expected from the combined assem-bly) while ssp. wyomingensis was dimorphic (i.e. con-tained both bases). In two different loci, ssp.wyomingensis sequences contained a single variantmatching either ssp. tridentata or ssp. vaseyana variant.The remaining SNP remained unconfirmed due to poorSanger sequencing results. Additional Sanger validationof individual SNP loci would have been an overly labor-ious process since other sequencing methods exist forvalidating larger numbers of SNPs (sequence captureand Illumina re-sequencing). Instead of individually gen-otyping SNP additional loci, genotypic assessment ofssp. wyomingensis at putative SNPs loci was determineden masse using Illumina sequencing (see below).
Detection of allelic SNP variants in ssp. wyomingensisApproximately 2.5 million and 10.5 million Illuminareads were obtained from the Montana and Utah ssp.wyomingensis samples, respectively. After trimming the5’ ends of the sequences to remove barcodes, thesequences were aligned to the combined EST assembly(obtained from 454 sequencing of normalized cDNAlibraries) as a sequence reference. In the Montana sam-ple, the Illumina reads overlapped 695 SNP positions ata depth of ≥ 20 × with 10% of the reads containing atleast one variant. At these SNP positions, both allelicvariants (matching the two diploid subspecies) were ver-ified at 251 SNPs. The ssp. tridentata base matched at138 additional SNP positions and the ssp. vaseyana basematched at 306 other SNP positions. In the Utah sam-ple, Illumina reads overlapped 1,039 SNP positions at adepth of ≥ 20 × with 10% of the reads containing atleast one variant. At these SNP positions, both allelicvariants (matching the two diploid subspecies) were ver-ified at 458 SNPs. The ssp. tridentata base matched 157additional SNP positions and the ssp. vaseyana basedmatched at 424 other SNPs positions. Verified SNPsfrom the Montana sample were distributed among 484contigs of the combined assembly, and verified SNPs
from the Utah sample were distributed among 767 con-tigs. This variability of SNP detection is not surprisingas the leaf tissue samples for Illumina cDNA sequencingwere collected in different environments under differentconditions and the cDNA fragments were not normal-ized (like the diploid cDNAs) or modified in any way toalter the association between gene expression levels andnumber of reads per gene.
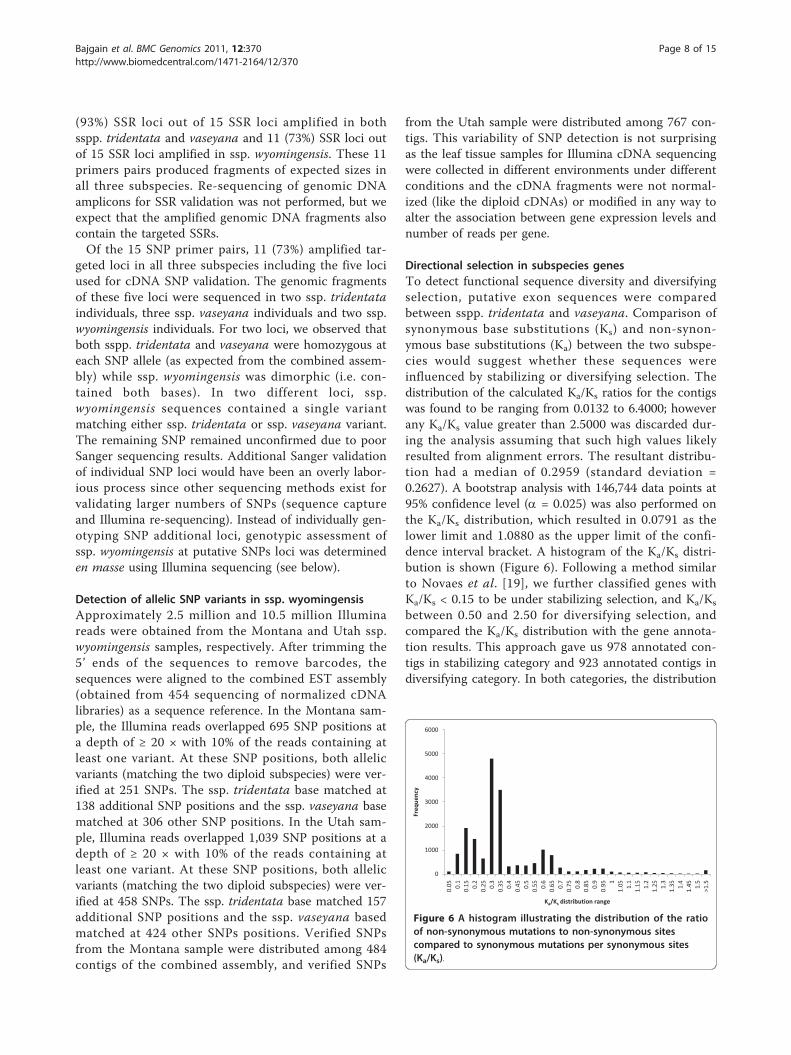
Directional selection in subspecies genesTo detect functional sequence diversity and diversifyingselection, putative exon sequences were comparedbetween sspp. tridentata and vaseyana. Comparison ofsynonymous base substitutions (Ks) and non-synon-ymous base substitutions (Ka) between the two subspe-cies would suggest whether these sequences wereinfluenced by stabilizing or diversifying selection. Thedistribution of the calculated Ka/Ks ratios for the contigswas found to be ranging from 0.0132 to 6.4000; howeverany Ka/Ks value greater than 2.5000 was discarded dur-ing the analysis assuming that such high values likelyresulted from alignment errors. The resultant distribu-tion had a median of 0.2959 (standard deviation =0.2627). A bootstrap analysis with 146,744 data points at95% confidence level (a = 0.025) was also performed onthe Ka/Ks distribution, which resulted in 0.0791 as thelower limit and 1.0880 as the upper limit of the confi-dence interval bracket. A histogram of the Ka/Ks distri-bution is shown (Figure 6). Following a method similarto Novaes et al. [19], we further classified genes withKa/Ks < 0.15 to be under stabilizing selection, and Ka/Ks
between 0.50 and 2.50 for diversifying selection, andcompared the Ka/Ks distribution with the gene annota-tion results. This approach gave us 978 annotated con-tigs in stabilizing category and 923 annotated contigs indiversifying category. In both categories, the distribution
0
1000
2000
3000
4000
5000
6000
0.05 0.
10.
15 0.2
0.25 0.
30.
35 0.4
0.45 0.
50.
55 0.6
0.65 0.
70.
75 0.8
0.85 0.
90.
95 11.
05 1.1
1.15 1.
21.
25 1.3
1.35 1.
41.
45 1.5
>1.5
Freq
uenc
y
Ka/Ks distribution range
Figure 6 A histogram illustrating the distribution of the ratioof non-synonymous mutations to non-synonymous sitescompared to synonymous mutations per synonymous sites(Ka/Ks).
Bajgain et al. BMC Genomics 2011, 12:370http://www.biomedcentral.com/1471-2164/12/370
Page 8 of 15
of GO IDs by contigs was the highest for the GO class‘molecular function’ with 103 unique GO IDs distributedamong 508 (51.9%) contigs in stabilizing category and103 GO IDs distributed among 448 (48.5%) contigs indiversifying category.
DiscussionPrevious reports of ESTs from non-model, yet ecologi-cally and economically important organisms have beensuccessfully sequenced and annotated using next genera-tion sequencing [19-21]. Here, we have used 454 next-generation sequencing to generate the first transcrip-tome sequence data for big sagebrush, a key ecologicalspecies of the western North America. Similar to reportsof other efforts, the assembled ESTs of big sagebrushwere further analyzed to generate a functional character-ization of the transcriptome and discover putative mole-cular markers (SSRs and SNPs). A surprisingly highlevel of nucleotide diversity was also found within indi-vidual assemblies of ESTs from big sagebrushaccessions.To generate a functional characterization of the big
sagebrush transcriptome, we compared the contigs andsingletons obtained from the combined assembly to pep-tides within the non-redundant protein database usingBLASTx. The low number of matches (54 contigs) toArtemisia annua sequences is probably due to fewernumber of A. annua sequences available in the NR data-base compared to species such as Vitis vinifera. Weexpect that the numbers of hits will substantiallyincrease with the eventual publication and annotation ofan A. annua and other Artemisia and Asteraceae gen-ome sequences. A majority (69.8%) of the assembledsequences did not align with any peptide in the NRdatabase, possibly indicating the presence of substantialnumber of novel genes in A. tridentata transcriptomeand related taxa. Genes of unknown function are notunexpected, as the discovery of novel genes has beendemonstrated in other EST sequencing projects withinnon-agricultural plant families [2,22].Many of the contigs and singleton ESTs identified in
this study are expected to have ecological and adaptiverelevance. Previous studies relating sagebrush biochem-istry to mule deer feeding preference suggest strong cor-relation between the composition and concentration ofsecondary metabolites, especially terpenoids, and muledeer preference of sagebrush [23,24]. We were able toidentify many, but not all, of the genes coding enzymesinvolved in MVA, MEP, and phenylpropenoid pathways.The failure to detect all genes from these pathwayscould be explained by a lack of transcriptome coverageand/or by a lack of pathway documentation of thesespecific genes [25]. The detection of major enzymesinvolved in phenylpropanoid pathway in big sagebrush
and variation within these pathways may aid in elucidat-ing herbivore preferences and trade-offs betweendefense responses.
Polymorphisms in A. tridentata ESTsA large number of SNP and SSR markers were discov-ered and different subsets of SNPs were validated usingSanger amplicon sequencing of cDNA and genomicDNA, Illumina cDNA sequencing of ssp. wyomingensis,and sequence capture. We verified (Type 1) six of sixtested SNPs using amplicon Sanger sequencing of indi-vidually selected PCR fragments. Additional verification(Sanger sequencing of next-generation sequencingresults) was deemed unnecessary due to past experiencein Arabidopsis [26], Amaranth [27,28], and cotton(Udall, personal communication) using this same con-servative bioinformatic pipeline. These other studies ver-ified 100% of 5 × more SNPs using Sanger re-sequencing of amplicons and demonstrated that theysegregated in mapping populations such that geneticmaps were reliably constructed. Similar to these otherstudies, a small number of genotypes (2) were used forSNP discovery in sagebrush ESTs. It was possible thatthe two individuals selected for EST sequencing couldalso represent minor alleles at a number of SNPs. Thus,the SSRs and SNPs that we report here represent DNAdifferences between individuals and differences betweensubspecies.In our efforts to describe SNPs in big sagebrush, we
have also quantified the number of SNPs that were dueto subspecies differences and those that were due toindividual differences. The high numbers of SNPsbetween individuals, apparent in the individual assem-blies (of two individuals), in the validation using ssp.wyomingensis, and in the sequence capture assemblies(of four individuals) suggested significant amounts ofnucleotide diversity between individual genomes of Arte-misia. This evidence was supported by three findings. 1)When discriminating SNPs between ssp. tridentata andssp. vaseyana were re-identified at a higher stringencythan 90% (at 99%), 13% of the SNPs were not detectedbecause of a single parameter requiring a degree ofhomogeneity among residues originating from a singleDNA source. This suggests that both individuals usedfor EST sequencing contained a high number of hetero-zygous loci. 2) Using Illumina sequencing, only 36% and44% of the SNP positions had both alleles detected inthe ssp. wyomingesis samples respectively, where nearlyall of the SNP positions were at least represented byone or the other allele. This indicated that both allelesof a significant number of the SNPs exist in a third A.tridentata subspecies, but a true polyploid hybrid ofthese the two diploid subspecies would contain bothalleles of all SNPs. Thus, the ssp. wyomingensis samples
Bajgain et al. BMC Genomics 2011, 12:370http://www.biomedcentral.com/1471-2164/12/370
Page 9 of 15

used here were likely derived from different diploids andthose individuals had significantly different genotypesthan those used for EST sequencing. 3) Using sequencecapture, only 54% of the 403 SNP positions were vali-dated as discriminatory between ssp. tridentata and ssp.vaseyana, but 67% of the SNP positions had both basesdetected. Thus, 13% of the sequence capture validatedSNP positions also appeared to be heterogeneous (twonucleotides) within the collected individuals used forsequence capture. Indeed, a significant number of SNPswere found between individual plants within A. triden-tata subspecies. Much of this nucleotide diversity atinitially identified SNP loci could be at heterozygousloci, though we are careful not to describe it as suchuntil allelism between nucleotide residues is fully estab-lished through segregation analysis. Recall that theseEST sequences contain both coding and non-codingsequence (particularly the 3’ UTR as the poly-A tail wasused for priming the cDNA synthesis). A high level ofnucleotide diversity in these coding and non-codingsequences is certainly plausible considering the verylarge effective population size of big sagebrush andwind-pollination strategy [29].Given the high level of heterozygosity due to the out-
crossing nature of big sagebrush populations [29], weexpect that a large number of inter-subspecific SNPsand intra-subspecific SNPs could be used in conductingsubspecies level association genetics studies. To date, lit-tle or no sequence of big sagebrush has been made pub-licly available, thus the SNPs reported here represent astarting point for such future population genetic studiesof big sagebrush. While they may form the basis offuture molecular studies, caution is needed becauseinformative SNP comparisons will depend on the speci-fic individuals selected for genetic analysis. Alternatively,our study suggests that a sequenced based approach topopulation genetics such as a population-wide genomereduction strategy [28] or amplicon analysis should beconsidered because of the expense required for assaydevelopment and their potential use in few, specific A.tridentata individuals. Such an approach would avoidextrapolation of our putative SNPs specific to these indi-viduals to a larger population of individuals (e.g. subspe-cies’ specific SNPs that were likely due to geneticvariation between individuals) by generating accession-specific data for each newly sequenced accession. Imple-mentation of such study among spatially distributed bigsagebrush populations would 1) enlighten our under-standing of natural selection on genes and gene com-plexes controlling adaptive traits, and the evolution ofthese trait-linked loci and 2) provide relatedness metricsbetween natural populations of these subspecies andtheir hybrid zones. Though we briefly touched on thesequestions by using independent genotypes for SNP
validation, these questions are out of the scope of thisparticular study that aims to primarily characterize ESTsequences of big sagebrush and provide insight regard-ing the origins of ssp. wyomingensis.Regarding the discovered SSRs, we were surprised to
find that all SSR repeat motif types detected were muchmore abundant in ssp. tridentata compared to ssp.vaseyana. The reduced levels of SSR in ssp. vaseyanaESTs compared to ssp. tridentata could be due to differ-ential gene expression since different loci were sampledwith our non-replicated experimental design. Whileleaves from both plants were harvested at the same timein common garden, phenological differences betweenthe subspecies might have caused differences in expres-sion levels and thus, changes in the number and typesof detected SSRs. While gene expression could explainsome of the differences, many such EST-SSRs have beenfound to be reliable molecular markers in other species[22,30-33] and they represent hypothetical (i.e. testable)genetic divergences between the subspecies.
Ka/Ks and gene evolution in big sagebrushThe ratio of synonymous and non-synonymous muta-tions between sspp. tridentata and vaseyana suggestpossible selection pressure resulting in the maintenanceof subspecies divergence, as similar trends have beenobserved in various organisms [34-37]. Since naturalselection shapes phenotypes and genotypes in favor ofadapted traits, the Ka/Ks ratio of less than 1 for a largenumber of contigs could be a result of either stabilizingor diversifying selection within both subspecies, depend-ing upon the magnitude of the ratio. Or if divergencetimes are very recent, it could also be the hallmark ofpurifying selection on the adapted common ancestor ofthese two subspecies. For example, Contig_29840 (Ka/Ks
= 0.106) was annotated for ‘aquaporin’ protein. Consid-ering that big sagebrush grows in variety of soils andarid plains, valleys and foothills of mountains, theimportance of aquaporin proteins in water balance iscritical and the genes coding for aquaporin proteinscould have been under stabilizing selection. A formalinvestigation of molecular evolution within these species(with a proper outgroup) would place selection pressurerelative to species divergence.
Exploring the inter-subspecies hybridization hypothesisHybridization can be of great importance to the ecologi-cal adaptation and subsequent evolution of offspringbecause of the novel genetic recombination and spatialselection [38-40]. Generally, allopolyploid formation isconsidered to have arisen through hybridization betweenunreduced gametes [41-43]. Several studies have beenconducted on hybrid populations formed from A. t. ssp.tridentata and A. t. ssp. vaseyana to investigate
Bajgain et al. BMC Genomics 2011, 12:370http://www.biomedcentral.com/1471-2164/12/370
Page 10 of 15
hybridization events. Generally, these hybrid populationsare formed in a narrow zone between the two ecotypes[29,44-47]. In this study, we did not select a tetraploidssp. wyomingensis along with diploid representatives ofits two neighboring ssp. tridentata and ssp. vaseyanapopulations. Instead, selected ssp. tridentata and ssp.vaseyana accessions were chosen for EST sequencingbased on penetrance of specific, subspecies morphologi-cal markers (i.e. trueness to type). Thus, variation atSNP loci for the diploid-tetraploid comparison is a mix-ture of individual variation, variation within inter-matingpopulations, and variation between subspecies in thisstudy. Based on the number of Illumina reads that actu-ally did map to discriminating SNPs between sspp. tri-dentata and vaseyana, the tetraploid ssp. wyomingensissamples appeared to contain both alleles for a largenumber of loci (251/695 Montana; 458/1,039 Utah). Thepresence of both alleles at approximately one-third ofthe loci suggests that ssp. wyomingensis either originatedas an allotetraploid from a hybridization event of 2 ngametes between sspp. tridentata and vaseyena orformed as a autopolyploid from both diploid subspecieswith subsequent hybridization. Since allopolyploids havebeen reported between diploids and tetraploids of ssp.tridentata and ssp. vaseyena [9,29,46,48], a similar sce-nario is plausible for the origin of ssp. wyomingensis. Afocused genetic study within and between putativehybrid zones of big sagebrush is needed to further eluci-date the origins and reproducibility of hybridization pro-cesses involved in ssp. wyomingensis formation. Iftetraploid recurrence is a common feature of ssp. wyo-mingensis, perhaps only populations of ssp. tridentataand ssp. vaseyana need active management duringenvironmental conversation of wildlands because a tet-raploid hybrid between the two locally adapted acces-sions could be expected to form and repopulategeographic zones between the diploid subspecies.
ConclusionsThis study is the first of its kind to perform transcrip-tome sequencing of big sagebrush subspecies, generatinglarge selections of genetic resources (EST sequences,SNP markers and microsatellites) for this ecologicallyimportant group of range and forest plants. The ESTsequences were annotated to identify putative genefunctions, and select genes involved in putative terpe-noid and coumarin synthesis were bioinformaticallyidentified. The distribution of SNPs among A. tridentatasubspecies and the estimation of depth and divergenceof mutations provide insights about the magnitude ofneutral divergence and natural selection between thesesubspecies, and a foundation of sequence references forfuture population genomic and functional genetic stu-dies. The cost-effective, rapid and reliable way of
obtaining nuclear sequences through transcriptomesequencing also provided insights on gene divergenceand marker development in big sagebrush. Future stu-dies integrating common garden, provenance and reci-procal transplantation of defined genetic stocks with thisgenomic information will immeasurably add to ourunderstanding patterns of genes and their roles in adap-tive traits among big sagebrush populations.
MethodsPlant materials and RNA extractionYoung leaves from two subspecies of big sagebrush, A.tridentata ssp. tridentata and A. tridenata ssp.vaseyana, were harvested from plants growing in USDAShrub Lab greenhouse in Provo, UT for 454-pyrose-quencing (Additional File 5). The plants were grownfrom seeds collected in their natural habitat near ParkValley, UT. The leaves were flash frozen in liquid N2
and stored in -80°C until further use. RNA extractionwas performed using approximately 0.1 g of frozen leaftissue, following a modified hot borate procedure [49].The extracted RNA was analyzed for quality and quanti-fied using Agilent 2100 Bioanalyzer (Agilent Technolo-gies, Foster City, CA) before using for cDNA synthesis.
cDNA library preparation for 454-pyrosequencingcDNA was created using 1 μg of total RNA using theSMART cDNA synthesis kit (Clontech Laboratories, Inc.,Mountain View, CA), but the cDNA synthesis primer forfirst strand synthesis was replaced by a modified oligo-dTprimer (5’-AAGCAGTGGTATCAACGCAGAGTCG-CAGTCGGTACTTTTTTCTTTTTTV-3’) [50]. The poly-Tstretch in the primer is broken by inserting a Cytosine tominimize the potential sequencing problems due to the pre-sence of a long ploy-A homopolymer stretch. The cDNAlibrary was normalized using the Trimmer Kit (Evrogen,Moscow, Russia) to limit redundant sequencing of highlyexpressed genes. We did not directly test normalizationvalues since so few transcripts were known for big sagebrushprior to this report. The normalization control included withthe Trimmer Kit was reduced in copy number as expected.Because this control was normalized as expected, weassumed that a similar normalization of highly expressedgenes also occurred in our two sagebrush samples. Adaptorsligation and single strand selection were done as describedin the GS FLX Titanium General Library Preparation Kit(Roche, Branford, CT) with modifications. One half-platewas sequenced for each subspecies at the Brigham YoungUniversity DNA sequencing center, Provo, UT.
Illumina sequencing of A. t. ssp. wyomingensis and SNPmappingLeaves were harvested from two young A. t. ssp. wyo-mingensis plants growing in USDA Shrub Lab
Bajgain et al. BMC Genomics 2011, 12:370http://www.biomedcentral.com/1471-2164/12/370
Page 11 of 15
greenhouse in Provo, UT. The plants were grown fromseeds collected in their natural habitat in two differentstates - Montana and Utah. Geographic information onsampled individuals is provided in Additional file 5. Tet-raploid confirmation was conducted on a Partec PAIIflow cytometer. Leaves from each plant along with aknown A. tridentata ssp. tridentata diploid standardwere finely chopped in a buffer and then nuclei werestained with DAPI solution (CyStain UV Precise P, Par-tec). Total RNA was harvested and quantified in thesame manner as mentioned above. The RNA was pro-cessed for sequencing following directions in the Illu-mina mRNA Sequencing Sample Prep Guide (part#1004898 rev. D., Illumina, Inc., San Diego, CA), withthe addition of custom barcoded adapters designed forthe paired-end sequencing process [51]. The quality ofthe libraries was validated using the Agilent 2100 Bioa-nalyzer. The prepared libraries of the ssp. wyomingensisindividuals were multiplexed in approximately equalconcentrations and sequenced in two separate runs (onesingle end 80 bp run, and a second paired end 80 bprun) on the Illumina Genome Analyzer at the OregonState University Center for Gene Research and Biocom-puting, Corvallis, OR. Pooled libraries were loaded ontoone lane of an Illumina Genome Analyzer II at 5 pMconcentration. Cluster generation and sequencing usedIllumina version 3.0 reagents, and image acquisition andbase calling used the Illumina pipeline version 1.5.These Illumina sequences were used only to verify inssp. wyomingensis the SNP loci detected on the com-bined assembly of sspp. tridentata and vaseyanaobtained from 454 sequences.Bowtie [52] was used to sort and align the Illumina
reads to the ‘reference’ combined assembly, with nogaps and allowing a single base mismatch. The mis-match alignment results were compared to the SNPsobtained from the combined assembly of two subspe-cies, and the output was parsed so that the SNPs werecovered by 1 or more ssp. wyomingensis reads. For con-fident SNP calling, we required only the SNPs coveredby coverage of 20 × or more be counted; and 10% of allthe reads overlapping a SNP were required to be of aparticular variant in order to avoid SNP detection thatcould have resulted from sequencing errors.
EST sequence de novo assembly and annotationA combined de novo assembly of the sequences fromboth subspecies was performed using CLC GenomicsWorkbench Version 3.7.1 (CLC bio, Cambridge, MA).The sequence ends were trimmed to remove the bar-codes added during library preparation, and anysequence shorter than 50 bp was not included in build-ing the assembly. The mismatch cost for the nucleotideswas set at 2 while both the insertion cost and deletion
cost for nucleotides in the reads were set at 3. Thelength fraction and the similarity of the sequences wereset at 0.5 and 0.9, respectively. Any conflicts among theindividual bases in the reads were resolved by voting forthe base with maximum number of repetitions. A mini-mum read length of 200 bp was set for an assembledsequence to be counted as a contig. Identical parameterswere also used to create individual assemblies from bothsubspecies. Homologies of the contigs and singletonswere identified by comparing against the NCBI NR pro-tein database using BLASTx with cut-off e-value of 1e-15. The blast results were imported into Blast2GO Ver-sion 2.4.2 for mapping the consensus sequences intoGO terms. To summarize the distribution of thesequences into GO terms of three main categories - bio-logical processes, cellular components and molecularfunctions, GO annotations were formatted for input intothe GOSlim program [53]. The consensus sequencesfrom combined assembly of both subspecies were alsosearched against the Pfam-A database using theHMMER software Version 3.0 [54]. Protein sequencesgenerated by ESTScan Version 2-2.1, using the Arabi-dopsis thaliana gene sequences as the reference matrix,were used for this purpose.
Polymorphism detectionSNPs were identified between the subspecies using thePerl script used by Maughan et al. [28]. For the nucleo-tides to be counted as a SNP, the following parameterswere required: 1) the coverage depth of the read at theSNP was ≥ 8; 2) the minimum frequency of the minorallele was 20%; and 3) within each possible nucleotide atthat SNP position, ≥ 90% of its bases at the SNP posi-tion are from a single subspecies (i.e. ’heterozygosity’ at10%). For example, a G↔A SNP would be included inthe list of SNPs at coverage of 100×, if, out of 100aligned sequences, 80 sequences came from one subspe-cies with at least 72 sequences calling for a G, and 20sequences came from another subspecies with at least18 sequences calling for an A at the SNP position. Pri-mers for SNP validation were designed using Primer3[55].Perl script MISA (MIcroSAtellite identification tool,
[56]) was also used to identify SSRs in the assembledconsensus sequences. Motif repeats between di anddeca-units were searched for in the assembly of eachsubspecies. For repetitive nucleotide stretches to becounted as an SSR unit, di-nucleotide repeats had to bepresent in frequency of 7 units, tri-nucleotide to octa-nucleotide repeats in frequency of 5 units and nona-and deca-nucleotide in frequency of 4 repeats. Theinterruption distance among any type of compound SSRunits was set at 100 bp. Using the same parametersused by MISA to detect SSRs in each subspecies dataset,
Bajgain et al. BMC Genomics 2011, 12:370http://www.biomedcentral.com/1471-2164/12/370
Page 12 of 15
the program SSR locator [57] was used to detect SSRsand design primers in the combined assembly ofsequences of both subspecies. An additional, customPerl script was written to bioinformatically distinguishpolymorphic SSR loci between the two subspecies (’true’SSRs). An SSR would be counted as a polymorphic SSRif an indel of the whole repeat motif and/or few bases inthe motif was detected in the consensus sequences ofeach subspecies.
Polymorphism ValidationSanger re-sequencing of both subspecies cDNA vali-dated consensus sequences containing SNPs and theSSRs. Fifteen putative SNP loci and SSR loci were ran-domly selected for PCR amplification. We selected 11SNPs with transition mutation and 4 with transversionmutations for PCR amplification followed by SNP vali-dation by re-sequencing. For validation purpose, weselected equal number of transitions and transversions(3 each, 6 total). The SSR primers were designed toamplify 4 di-, 5 tri-, and 4 tetra-, 1 penta- and 1 hexa-nucleotide SSRs of varying lengths. Two tetraploid ssp.tridentata individuals, two diploid and one tetraploidssp. vaseyana individuals and two tetraploid ssp. wyo-mingensis individuals from geographically divergentsources were used for SNP and SSR marker evaluationin genomic DNA. Geographic information on these indi-viduals is provided in Additional File 5. The followingsettings were followed for PCR amplification of bothSNP and SSR loci: 2 mM MgCl2, 1 × PCR buffer, 0.2mM dNTPs, 0.6 μM of each primer, 1 U Taq polymer-ase and dH2O to a final reaction volume of 10 μl ran inthe following thermal profile: 94°C 3 min, 35 × (94°C 30s, Tm depending upon the primers used 45 s, 72°C 1min) and final extension of 72°C 10 min. PCR reactionsof both SNP loci and SSR loci were cleaned using Qia-quick PCR Purification kit (Qiagen, Valencia, CA), andthen mixed with appropriate primers prior to sequen-cing. Fragments were sequenced with an ABI 3730xlDNA analyzer at the University of Wisconsin Biotech-nology Center, Madison, WI. The primers used for SNPand SSR validation are listed in Additional File 5.SNPs and SSRs were validated by sequencing 369
genes containing 572 SNPs in sspp. tridentata andvaseyana using sequence capture. DNA extractions weremade of NVT-2 and UTT-2 (ssp. tridentata collectedfrom 39°29’22’’ 117°85’17’’ and 38°30’60’’ 109°38’76’’,respectively) and UTV-1 and UTV-3 (ssp. vaseyana col-lected from 39°34’13’’ 111°52’21’’ and 38°34’13’’ 109°21’73’’, respectively) RNA baits (120-mer) of the targetgenes were synthesized after the contigs obtained fromthe combined assembly. The DNA libraries for baithybridization were prepared using GS FLX TitaniumRapid Library Preparation Kit (Roche, Branford, CT,
USA). The baits were then hybridized to the library andthe capture sequences were prepared for 454-sequencingfollowing the MYselect protocol (MYcroarray, AnnArbor, MI, USA). The captured DNA libraries werepooled and sequenced at the Brigham Young Universitysequencing center, Provo, UT. Using 0.95 sequencesimilarity, the capture reads were mapped to the refer-ence contigs in order to place individual reads at pre-viously called SNPs and SSRs using GenomicsWorkbench 4 (CLCBio, Aarhus, Denmark). Custom Perlscripts were used to assess SSR and SNP coverage andvalidate the presence of SNP bases in distinct DNAsamples of sspp. tridentata and vaseyana.
Analysis of synonymous and non-synonymous mutationsTo find the changes in amino acid sequences due to sin-gle nucleotide mutations, we aligned sspp. tridentataand vaseyana contigs that had their coding frame pre-dicted using ESTScan. The proportion of non-synon-ymous to synonymous mutations (Ka/Ks) was calculatedfor each contig, following the Jukes-Cantor correctedmodel of substitution using Bioperl modules [58]. Wehowever modified the Jukes-Cantor equation by addingone unit to both non-synonymous and synonymous sub-stitutions in order to obtain a valid Ka/Ks estimation ininstances where either type of substitution was absent.Without this modification, we would have obtained Ka/Ks value equal to zero for genes with no observed non-synonymous substitutions, regardless of their Ks values.Similarly, genes without any synonymous substitutionswould have undefined Ka/Ks.
Additional material
Additional file 1: Distribution of protein domain vs number ofcontigs. The number of contigs on Y-axis represents total number ofcontigs that had a match against a protein domain. Only the top 25most common domains (of 3065 domains found) are illustrated in thefigure.
Additional file 2: The distribution and sequences of putativesagebrush homologs of enzymes involved in terpenoid andcoumarin synthesis pathways. The data consists of contigs of eachsubspecies annotated as terpenoid and coumarin pathway enzymes, aswell as the contigs that resulted from combined assembly. Thenucleotide sequences of the putative genes (contigs from the combinedassembly) have also been included in the file.
Additional file 3: A list of contigs containing discriminatory SNPsbetween ssp. tridentata and ssp. vaseyana including contig name,SNP position, base for each subspecie, read count per base,flagged contigs with >13 SNPs, and SNPs that were found to beheterogeneous when the parameter of homogeneity was raised to99%.
Additional file 4: Additional details of SSRs including frequencies ofdi- and tri-nucleotide repeats.
Additional file 5: Details of SNP and SSR primers used forpolymorphism validation and the list of big sagebrush individualsused during the project.
Bajgain et al. BMC Genomics 2011, 12:370http://www.biomedcentral.com/1471-2164/12/370
Page 13 of 15
Additional file 6: Results for SNP validation during sequencecapture.
AcknowledgementsThe funding for this work was provided by USDA Forest Service WesternForest Transcriptome Survey, National Fire Plan (research joint venture 09-JV-11221632-200) and the Great Basin Native Plant Selection and IncreaseProject (GBNPSIP). We sincerely thank Nancy Shaw for her help with ssp.wyomingensis seed collection; Stewart Sanderson for ploidy analyses; EdwardWilcox for his assistance with 454-pyrosequencing; Scott Yourstone andBrian Knaus for bioinformatic support; and Felix Jimenez for his assistancewith polymorphism validation. We also express our thanks to E. DurantMcArthur and Leigh Johnson for reviewing the manuscript and providinghelpful suggestions.
Author details1Plant and Wildlife Science Department, Brigham Young University, Provo,UT 84602, USA. 2Rocky Mountain Research Station, USDA Forest Service,Provo, UT 84606, USA. 3Computer Science Department, Brigham YoungUniversity, Provo, UT 84602, USA. 4Pacific Northwest Research Station, USDAForest Service, Corvallis, OR 97331, USA.
Authors’ contributionsPB prepared the cDNA libraries, assembled the EST sequences, carried outthe GO annotation, developed the SNP and SSR markers, and drafted themanuscript. BAR helped with the collection of plant materials from the fieldfor 454 and Illumina sequencing and edited the manuscript. JCP sorted theIllumina sequences, and mapped the ssp. wyomingensis reads to 454 contigsto identify SNPs. RCC prepared the ssp. wyomingensis transcriptome forIllumina sequencing and supervised the sequencing. JU conceived thisstudy, provided bioinformatic training, and drafted the final manuscript. Allauthors read and approved the final manuscript.
Received: 17 December 2010 Accepted: 18 July 2011Published: 18 July 2011
References1. Pareto G: Artemisie. Ricerca ed applicazione. Quaderni Agricoli Suppl 1985.2. Wang W, Wang Y, Zhang Q, Qi Y, Guo D: Global characterization of
Artemisia annua glandular trichome transcriptome using 454pyrosequencing. BMC Genomics 2009, 10(1):465.
3. McArthur ED, Stevens R: Composite shrubs. Restoring western ranges andwildlands: 2004 Fort Collins, CO, USA: USDA Forest Service, Rocky MountainResearch Station; 2004, 493-437.
4. McArthur ED, Sanderson SC: Cytogeography and chromosome evolutionof subgenus Tridentatae of Artemisia (Asteraceae). American Journal ofBotany 1999, 86:1754-1775.
5. West NE: Synecology and disturbance regimes of sagebrush steppeecosystems. Proceedings of the sagebrush steppe ecosystems symposium:2000 Boise, ID, USA: USDI Bureau of Land Management; 2000, 15-26.
6. Pyke DA: Invasive exotic plants in sagebrush ecosystems of theintermountain west. Proceedings: sagebrush steppe ecosystems symposium:2000 Boise, ID, USA: USDI Bureau of Land Management; 2000, 43-54.
7. Rowland MM, Wisdom MJ, Suring LH, Meinke CW: Greater sage-grouse asan umbrella species for sagebrush-associated vertebrates. BiologicalConservation 2006, 129:323-335.
8. Mahalovich MF, McArthur ED: Sagebrush (Artemisia spp.) seed and planttransfer guidelines. Native Plant Journal 2004, 5:141-147.
9. Wang H, McArthur ED, Sanderson SC, Graham JH, Freeman DC: Narrowhybrid zone between two subspecies of big sagebrush (Artemisiatridentata: Asteraceae). IV. Reciprocal transplant experiments. Evolution1997, 4:155-205.
10. Miglia KJ, McArthur ED, Moore W, Wang H, Graham JH, Freeman DC: Nine-year reciprocal transplant experiment in the gardens of the basin andmountain big sagebrush (Artemisia tridentata: Asteraceae) hybrid zoneof Salt Creek Canyon: the importance of multiple-year tracking of fitness. Biological Journal of the Linnean Society 2004, 86:213-225.
11. Atta T, Robelen G: Cytogentic relationship within cultivated Brassicaanalyzed in amphihaploids from the three diploid ancestors. Can J GenetCytol 28:323-329.
12. Iseli C, Jongeneel CV, Bucher P: ESTScan: a program for detecting,evaluating, and reconstructing potential coding regions in ESTsequences. Proceedings International Conference on Intelligent Systems forMolecular Biology 1999, 138-148.
13. Götz S, García-Gómez JM, Terol J, Williams TD, Nagaraj SH, Nueda MJ,Robles M, Talón M, Dopazo J, Conesa A: High-throughput functionalannotation and data mining with the Blast2GO suite. Nucleic AcidsResearch 2008, 36(10):3420-3435.
14. Kelsey RG: Foliage biomass and crude terpenoid productivity of bigsagebrush (Artemisia tridenta). Proceedings: Symposium on the Biology ofArtemisia and Chrysothamnus: 1986 Ogden, UT: USDA Forest Service; 1986,375-388.
15. Stevens R, McArthur ED: A simple field technique for identification ofsome sagebrush taxa. Journal of Range Management 1974(27):325-326.
16. Shumar ML, Anderson JE, Reynolds TD: Identification of subspecies of bigsagebrush by ultraviolet spectrophotometry. Journal of RangeManagement 1982, 35(1):60-62.
17. Kai K, Shimizu Bi, Mizutani M, Watanabe K, Sakata K: Accumulation ofcoumarins in Arabidopsis thaliana. Phytochemistry 2006, 67(4):379-386.
18. Fritig B, Hirth L, Ourisson G: Biosynthesis of the coumarins: Scopoletinformation in tobacco tissue cultures. Phytochemistry 1970, 9(9):1963-1975.
19. Novaes E, Drost D, Farmerie W, Pappas G, Grattapaglia D, Sederoff R,Kirst M: High-throughput gene and SNP discovery in Eucalyptus grandis,an uncharacterized genome. BMC Genomics 2008, 9(1):312.
20. Parchman T, Geist K, Grahnen J, Benkman C, Buerkle CA: Transcriptomesequencing in an ecologically important tree species: assembly,annotation, and marker discovery. BMC Genomics 2010, 11(1):180.
21. Vera JC, Wheat CW, Fescemyer HW, Frilander MJ, Crawford DL, Hanski I,Marden JH: Rapid transcriptome characterization for a nonmodelorganism using 454 pyrosequencing. Molecular Ecology 2008,17(7):1636-1647.
22. Zeng S, Xiao G, Guo J, Fei Z, Xu Y, Roe B, Wang Y: Development of a ESTdataset and characterization of EST-SSRs in a traditional Chinesemedicinal plant, Epimedium sagittatum (Sieb. Et Zucc.) Maxim. BMCGenomics 2010, 11(1):94.
23. Bray RO, Wambolt CL, Kelsey RG: Influence of sagebrush terpenoids onmule deer preference. Journal of Chemical Ecology 1991, 17(11):2053-2062.
24. Personius TL, Wambolt CL, Stephens JR, Kelsey RG: Crude terpenoidinfluence on mule deer preference for sagebrush. Journal of RangeManagement 1987, 40(1):84-88.
25. Bourgaud F, Hehn A, Larbat R, Doerper S, Gontier E, Kellner S, Matern U:Biosynthesis of coumarins in plants: a major pathway still to beunravelled for cytochrome P450 enzymes. Phytochemistry Reviews 2006,5(2):293-308.
26. Maughan PJ, Yourstone SM, Byers RL, Smith SM, Udall JA: Single-Nucleotide Polymorphism Genotyping in Mapping Populations viaGenomic Reduction and Next-Generation Sequencing: Proof of Concept.Plant Gen 2010, 3(3):166-178.
27. Maughan P, Smith S, Fairbanks D, Jellen E: Development, Characterization,and Linkage Mapping of Single Nucleotide Polymorphisms in the GrainAmaranths (Amaranthus sp.). Plant Gen 2011, 4(1):92-101.
28. Maughan PJ, Yourstone SM, Jellen EN, Udall JA: SNP discovery viagenomic reduction, barcoding, and 454-pyrosequencing in amaranth.The Plant Genome 2009, 2:260-270.
29. McArthur ED, Welch BL, Sanderson SC: Natural and artificial hybridizationbetween big sagebrush (Artemsia tridentata) subspecies. Journal ofHeredity 1988, 79:268-276.
30. Han Z, Wang C, Song X, Guo W, Gou J, Li C, Chen X, Zhang T:Characteristics, development and mapping of Gossypium hirsutumderived EST-SSRs in allotetraploid cotton. Theor Appl Genet 2006,112:430-439.
31. Zhang Y, Lin Z, Li W, Tu L, Nie Y, Zhang X: Studies of new EST-SSRsderived from Gossypium barbadense. Chin Sci Bull 2007, 52:2522-2531.
32. Yu Y, Wang Z, Feng C, Zhang Y, Lin Z, Zhang X: Genetic evaluation ofEST-SSRs derived from Gossypium herbaceum. Acta Agronomoca Sinica2008, 34:2085-2091.
33. Yu Y, Yuan D, Liang S, Li X, Wang X, Lin Z, Zhang X: Genome structure ofcotton revealed by a genome-wide SSR genetic map constructed from a
Bajgain et al. BMC Genomics 2011, 12:370http://www.biomedcentral.com/1471-2164/12/370
Page 14 of 15
BC1 population between gossypium hirsutum and G. barbadense. BMCGenomics 2011, 12(1):15.
34. Arunyawat U, Stephan W, Stadler T: Using multilocus sequence data toassess population structure, natural selection, and linkage disequilibriumin wild tomatoes. Molecular Biology and Evolution 2007, 24(10):2310-2322.
35. Bamshad M, Wooding SP: Signatures of natural selection in the humangenome. Nature Reviews Genetics 2003, 4(2):99-111.
36. Ford MJ: Applications of selective neutrality tests to molecular ecology.Molecular Ecology 2002, 11(8):1245-1262.
37. Tian D, Araki H, Stahl E, Bergelson J, Kreitman M: Signature of balancingselection in Arabidopsis. Proceedings of the National Academy of Sciences ofthe United States of America 2002, 99(17):11525-11530.
38. Arnold ML: Natural hybridization and evolution. Oxford: Oxford UniversityPress; 1997.
39. Durrett R, Buttel L, Harrison R: Spatial models for hybrid zones. Heredity2004, 84:9-19.
40. Rieseberg LH: Hybrid origins of plant species. Ecology and Systematics1997, 28:359-389.
41. McArthur ED: Breeding systems in shrubs. San Diego, CA: Academic Press,Inc; 1989.
42. Otto SP, Whitton J: Polyploid incidence and evolution. Annual Review ofGenetics 2000, 34(1):401-437.
43. Husband BC, Schemske DW: Cytotype distribution at a diploid-tetraploidcontact zone in Chamerion (Epilobium) angustifolium (Onagraceae). Am JBot 1998, 85(12):1688-1694.
44. Freeman DC, Turner WA, McArthur ED, Graham JH: Characterization of anarrow hybrid zone between two subspecies of big sagebrush(Artemisia tridentata: Asteraceae). American Journal of Botany 1991,78:805-815.
45. Graham JH, Freeman DC, McArthur ED: Narrow hybrid zone between twosubspecies of big sagebrush (Artemsia tridentata: Asteraceae). II.Selection gradients and hybrid fitness. American Journal of Botany 1995,82:709-716.
46. McArthur ED, Mudge J, Buren RV, Anderson WR, Sanderson SC, Babbel DG:Randomly amplified polymorphic DNA analysis (RAPD) of Artemisiasubgenus Tridentatae species and hybrids. Great Basin Naturalist 1998,58:12-27.
47. McArthur ED, Blauer AC, Plummer AP, Stevens R: Characteristics andhybridization of important intermountain shrubs. III. Sunflower family.Res Pap 1979, INT-220:82.
48. Weber DJ, Gang DR, Halls SC, Smith BN, McArthur ED: Inheritance ofhydrocarbons in subspecific big sagebrush (Artemisia tridentata) hybrids.Biochemical Systematics and Ecology 1994, 22(7):689-697.
49. Wan CY, Wilkins TA: A modified hot borate method significantlyenhances the yield of high-quality RNA from Cotton (Gossypiumhirsutum L.). Analytical Biochemistry 1994, 223(1):7-12.
50. Meyer E, Aglyamova G, Wang S, Buchanan-Carter J, Abrego D, Colbourne J,Willis B, Matz M: Sequencing and de novo analysis of a coral larvaltranscriptome using 454 GSFlx. BMC Genomics 2009, 10(1):219.
51. Cronn R, Liston A, Parks M, Gernandt DS, Shen R, Mockler T: Multiplexsequencing of plant chloroplast genomes using Solexa sequencing-by-synthesis technology. Nucleic Acids Research 2008, 36(19):e122.
52. Langmead B, Trapnell C, Pop M, Salzberg S: Ultrafast and memory-efficientalignment of short DNA sequences to the human genome. GenomeBiology 2009, 10(3):R25.
53. McCarthy F, Wang N, Magee GB, Nanduri B, Lawrence M, Camon E,Barrell D, Hill D, Dolan M, Williams WP, et al: AgBase: a functionalgenomics resource for agriculture. BMC Genomics 2006, 7(1):229.
54. Eddy SR: Profile hidden Markov models. Bioinformatics 1998, 14(9):755-763.55. Rozen S, Skaletsky H: Primer3 on the WWW for general users and for
biologist programmers. 1999, 132:365-386.56. Thiel T, Michalek W, Varshney RK, Graner A: Exploiting EST databases for
the development and characterization of gene-derived SSR-markers inbarley (Hordeum vulgare L.). Theoretical and Applied Genetics 2003,106:411-422.
57. da Maia LC, Palmieri DA, de Souza VQ, Kopp MM, de Carvalho FI, Costa deOliveira A: SSR Locator: Tool for simple sequence repeat discoveryintegrated with primer design and PCR simulation. International Journalof Plant Genomics 2008, 2008.
58. BioPerl. [http://www.bioperl.org].
doi:10.1186/1471-2164-12-370Cite this article as: Bajgain et al.: Transcriptome characterization andpolymorphism detection between subspecies of big sagebrush(Artemisia tridentata). BMC Genomics 2011 12:370.
Submit your next manuscript to BioMed Centraland take full advantage of:
• Convenient online submission
• Thorough peer review
• No space constraints or color figure charges
• Immediate publication on acceptance
• Inclusion in PubMed, CAS, Scopus and Google Scholar
• Research which is freely available for redistribution
Submit your manuscript at www.biomedcentral.com/submit
Bajgain et al. BMC Genomics 2011, 12:370http://www.biomedcentral.com/1471-2164/12/370
Page 15 of 15