Tram Passenger Surveyd3cez36w5wymxj.cloudfront.net/wp-content/uploads/2018/03/... · 2018-03-20 ·...
14
Tram Passenger Survey Key findings Autumn 2017
Transcript of Tram Passenger Surveyd3cez36w5wymxj.cloudfront.net/wp-content/uploads/2018/03/... · 2018-03-20 ·...
Tram Passenger SurveyKey findings
Autumn 2017

3
ForewordInsight from the Tram Passenger Survey continues to be used to make a real and positive difference to the service that passengers experience.
As part of our 2017 programme of tram passenger satisfaction research, we surveyed
passengers in five network areas. Overall we captured the views of 5596 passengers on the tram journey they had just made.
In my foreword to the 2016 Tram Passenger Survey (TPS) key findings summary report I said that 2017 “should see a relatively stable and consistent service for passengers across the majority of the surveyed networks…”. As you will note in this report, the latest TPS results largely back up my forecast!
Overall tram passenger satisfaction across the five networks covered by the 2017 survey remains high at 91 per cent. While this is slightly down on the 2016 result of 93 per cent it reflects the fact that Edinburgh Tram decided not to participate in the 2017 survey. Its stellar result of 99 per cent overall passenger satisfaction in 2016 no doubt had an effect on the overall figure.
At individual network level we see Blackpool Transport top the table with overall passenger satisfaction at 97 per cent. A stunning result! Likewise strong improvements in Sheffield see its Supertram operation hit 95 per cent overall passenger satisfaction. This is the highest endorsement by passengers in Sheffield since we started TPS in 2013, and suggests that network stability (after periods of engineering work) and the introduction of new trams are pleasing local passengers.
Consistent and high levels of tram passenger
satisfaction are again seen in Manchester, Birmingham and Nottingham.
The key factor that drives the passenger’s view of either a satisfactory, or that much-valued great journey, is the comfort and environment of the tram. We believe this to reflect what passengers experience in terms of comfort when sitting or standing on their journey. What we’ve seen since we started the survey in 2013 is the consequence of more busy and crowded services as networks successfully attract more passengers. This is a challenge to the industry as users will understandably expect that operations keep up with consumer demand and expectations.
My team will be meeting the five networks covered by this survey to ensure there is a comprehensive understanding of what the results are saying. We will help translate the valuable experiences of passengers, captured by our work, into actionable improvements.
We are grateful for the continued co-operation and additional funding from the five operations covered in this survey: Blackpool Transport, Nottingham Trams, South Yorkshire Passenger Transport Executive, Transport for Greater Manchester and Transport for West Midlands. This has helped boost the size of the survey, providing an even more robust picture of tram passengers’ experiences.
Jeff HalliwellChair, Transport Focus
4
Tram Passenger Survey Key findings
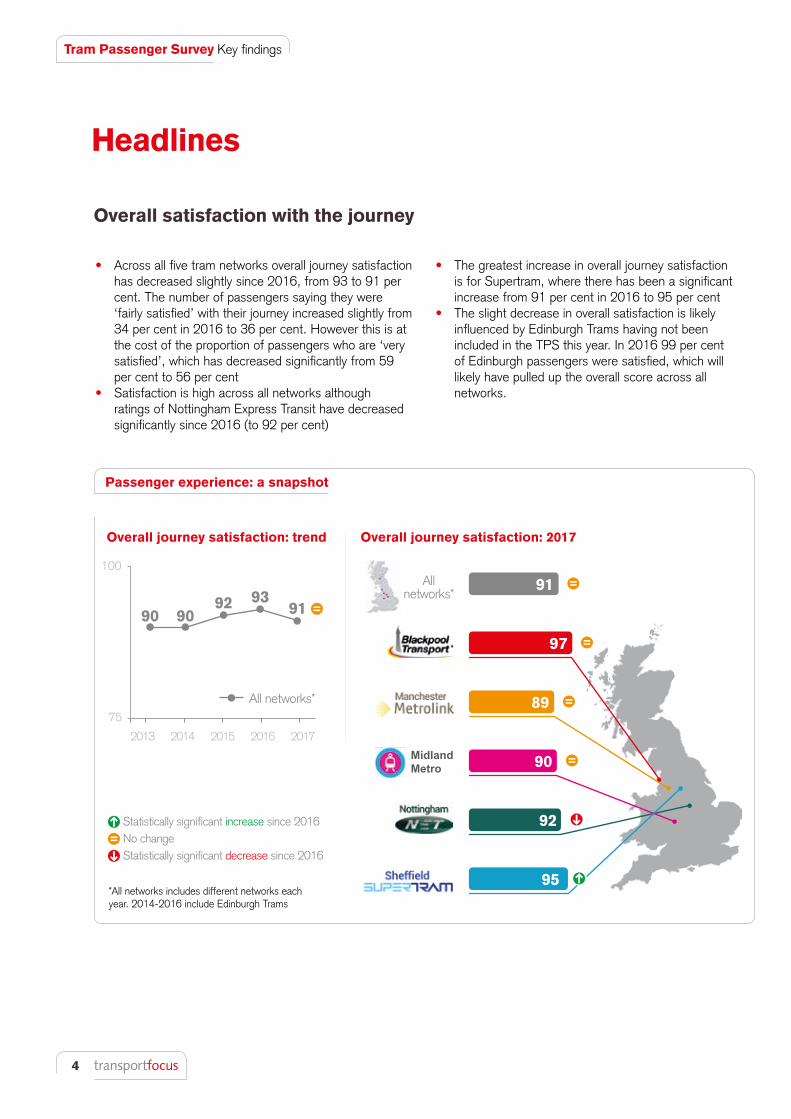
Headlines
Overall satisfaction with the journey
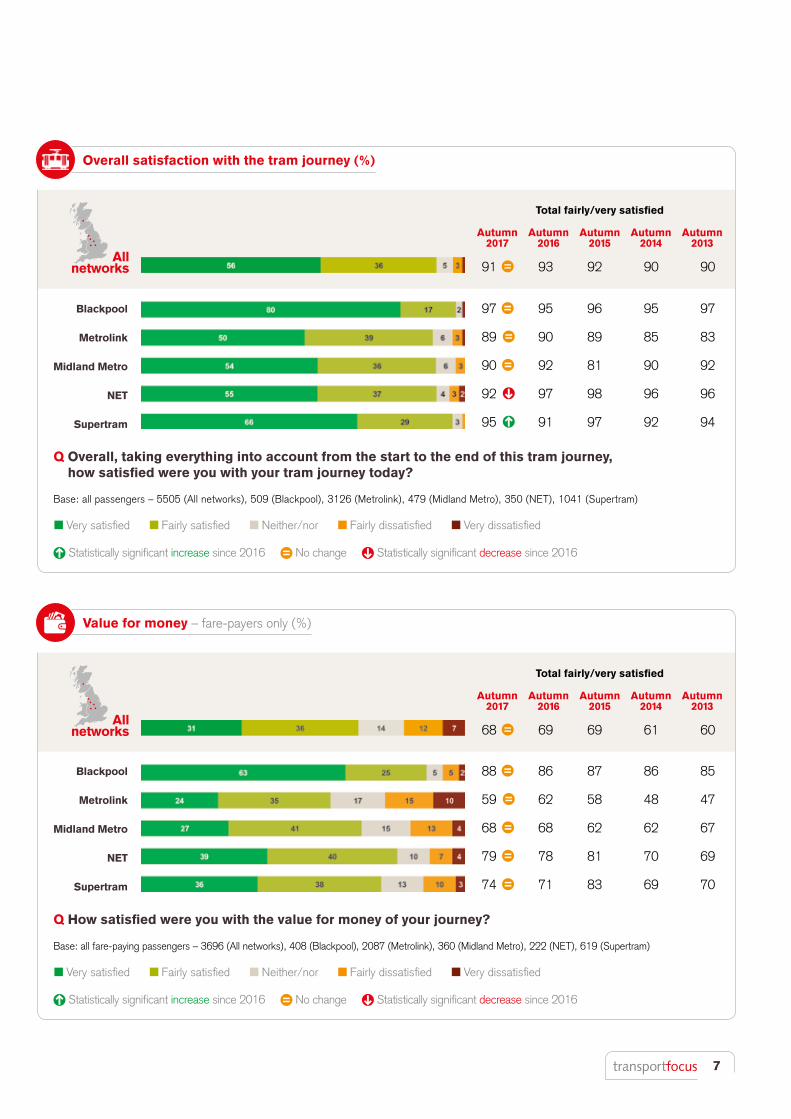
• Across all five tram networks overall journey satisfaction has decreased slightly since 2016, from 93 to 91 per cent. The number of passengers saying they were ‘fairly satisfied’ with their journey increased slightly from 34 per cent in 2016 to 36 per cent. However this is at the cost of the proportion of passengers who are ‘very satisfied’, which has decreased significantly from 59 per cent to 56 per cent
• Satisfaction is high across all networks although ratings of Nottingham Express Transit have decreased significantly since 2016 (to 92 per cent)
All networks*
*All networks includes different networks each year. 2014-2016 include Edinburgh Trams
Q Statistically significant increase since 2016 W No changeE Statistically significant decrease since 2016
Passenger experience: a snapshot
Overall journey satisfaction: trend Overall journey satisfaction: 2017
• The greatest increase in overall journey satisfaction is for Supertram, where there has been a significant increase from 91 per cent in 2016 to 95 per cent
• The slight decrease in overall satisfaction is likely influenced by Edinburgh Trams having not been included in the TPS this year. In 2016 99 per cent of Edinburgh passengers were satisfied, which will likely have pulled up the overall score across all networks.
97
89
90
92
95
91
W
W
W
E
W
Q
90 9092 93
91 W
100
75
2013 2014 2015 2016 2017
All networks*

5
Info
rmat
ion
thro
ugho
ut jo
urne
y7%
Access to the tram stop6%
Cle
anlin
ess
and
cond
ition
of
the
tram
8%
Timeliness12%
Smoothness/speed of the tram9%
On tram environment and comfort28%
Boarding the tram5%
Tram
sto
p co
nditi
on8%
Value for money11%
6%
The top factors linked to overall journey satisfaction*
The top factors linked to overall journey satisfaction and how they performed in 2017
What makes a satisfactory or great journey?
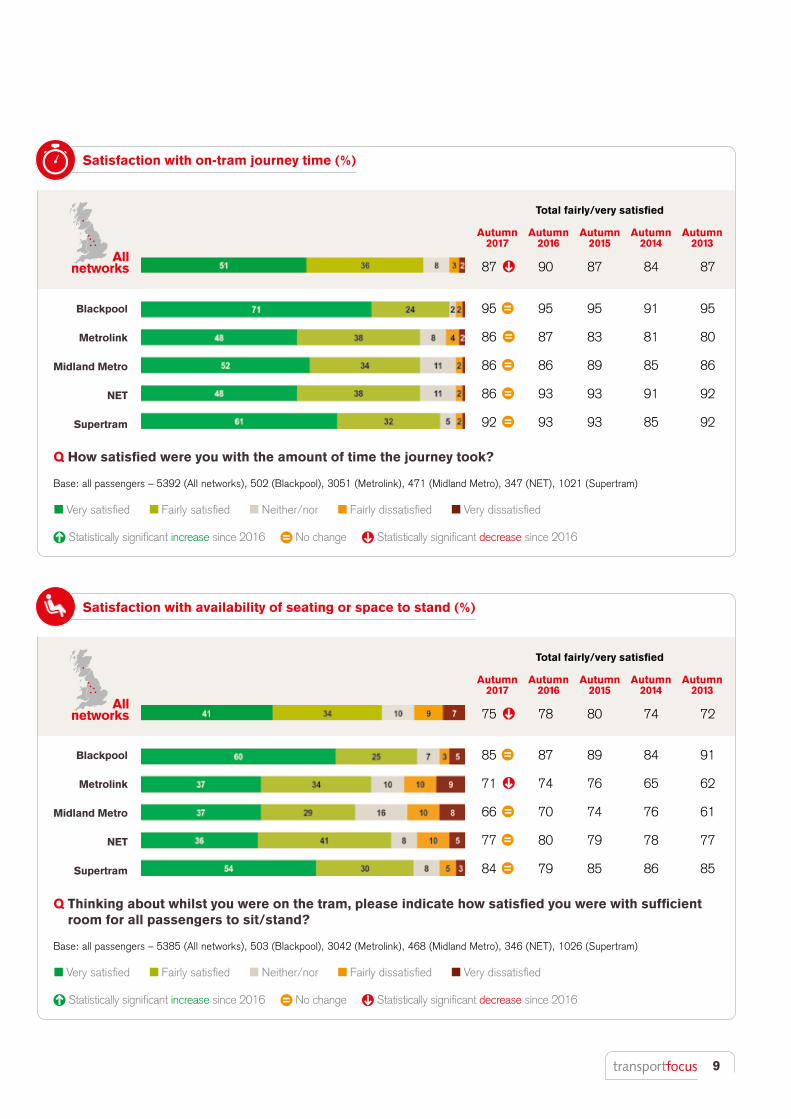
• The key factor which makes tram journeys both satisfactory and great is the onboard environment and comfort of the tram. Attributes relating to this have remained relatively consistent compared to 2016, although satisfaction with the availability of seating or space to stand decreased significantly from 78 per cent in 2016 to 75 per cent. The amount of personal space on board is the lowest rated on board aspect, with 72 per cent of passengers satisfied
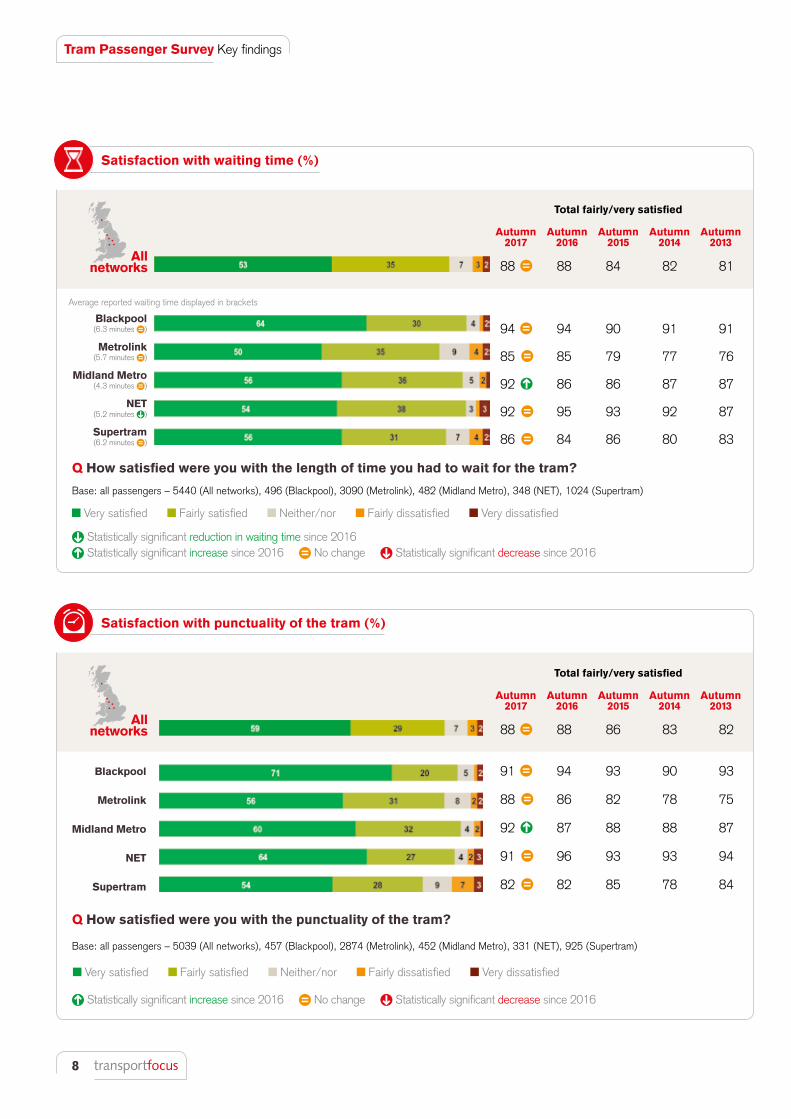
• The next most important factor is timeliness. This is more important to making journeys ‘satisfactory’ than ‘great’. Satisfaction with punctuality and the length of time waiting for the tram have remained unchanged since 2016, with 88 per cent of passengers satisfied with both aspects.
*See page 13 for an explanation of how these themes were calculated
What makes a satisfactory journey?
What makes a great journey?
Q Statistically significant increase since 2016W No changeE Statistically significant decrease since 2016
What makes a satisfactory or great journey?
On tram environment and comfort
Timeliness
88% W Length of time waiting for the tram
88% W Punctuality
75% E Availability of seating or space to stand
75% W Comfort of the seats
72% W Amount of personal space
81% W Provision of grab rails
82% W Temperature
Timeliness23%
Sm
ooth
ness
/spe
ed
of th
e tr
am10
%
On tram environment and comfort30%
Boarding the tram15%
2%
2
Tram stop condition5%
Value for money8%
3%
1
Personal safety throughout journey Information throughout journey Cleanliness and condition of the tram Access to the tram stop
Personal safety throughout journey
6
Tram Passenger Survey Key findings
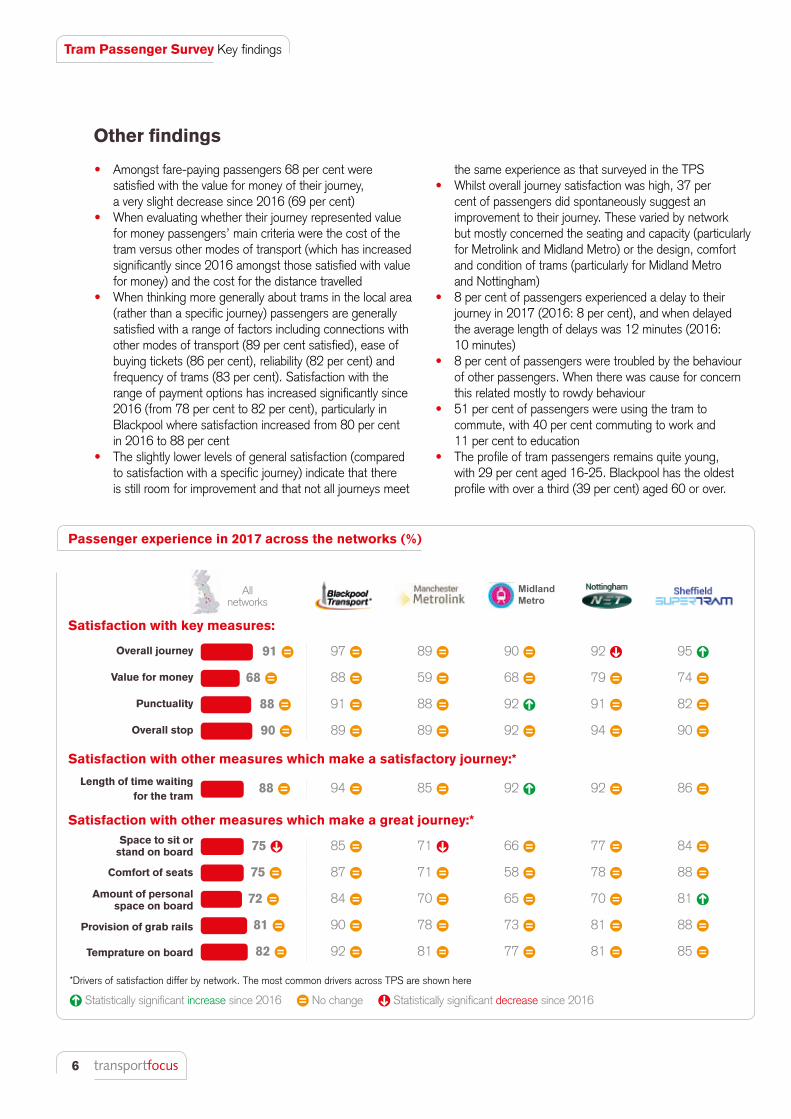
• Amongst fare-paying passengers 68 per cent were satisfied with the value for money of their journey, a very slight decrease since 2016 (69 per cent)
• When evaluating whether their journey represented value for money passengers’ main criteria were the cost of the tram versus other modes of transport (which has increased significantly since 2016 amongst those satisfied with value for money) and the cost for the distance travelled
• When thinking more generally about trams in the local area (rather than a specific journey) passengers are generally satisfied with a range of factors including connections with other modes of transport (89 per cent satisfied), ease of buying tickets (86 per cent), reliability (82 per cent) and frequency of trams (83 per cent). Satisfaction with the range of payment options has increased significantly since 2016 (from 78 per cent to 82 per cent), particularly in Blackpool where satisfaction increased from 80 per cent in 2016 to 88 per cent
• The slightly lower levels of general satisfaction (compared to satisfaction with a specific journey) indicate that there is still room for improvement and that not all journeys meet
the same experience as that surveyed in the TPS• Whilst overall journey satisfaction was high, 37 per
cent of passengers did spontaneously suggest an improvement to their journey. These varied by network but mostly concerned the seating and capacity (particularly for Metrolink and Midland Metro) or the design, comfort and condition of trams (particularly for Midland Metro and Nottingham)
• 8 per cent of passengers experienced a delay to their journey in 2017 (2016: 8 per cent), and when delayed the average length of delays was 12 minutes (2016: 10 minutes)
• 8 per cent of passengers were troubled by the behaviour of other passengers. When there was cause for concern this related mostly to rowdy behaviour
• 51 per cent of passengers were using the tram to commute, with 40 per cent commuting to work and 11 per cent to education
• The profile of tram passengers remains quite young, with 29 per cent aged 16-25. Blackpool has the oldest profile with over a third (39 per cent) aged 60 or over.
*Drivers of satisfaction differ by network. The most common drivers across TPS are shown here
All networks
Satisfaction with key measures:
Satisfaction with other measures which make a satisfactory journey:*
Satisfaction with other measures which make a great journey:*
Length of time waiting for the tram
88 W 94 W 85 W 92 Q 92 W 86 W
Space to sit or stand on board
Comfort of seats
Amount of personal space on board
Provision of grab rails
Temprature on board
75 E 85 W 71 E 66 W 77 W 84 W
75 W 87 W 71 W 58 W 78 W 88 W
72 W 84 W 70 W 65 W 70 W 81 Q
81 W 90 W 78 W 73 W 81 W 88 W
82 W 92 W 81 W 77 W 81 W 85 W
Overall journey
Value for money
Punctuality
Overall stop
91 W 97 W 89 W 90 W 92 E 95 Q
68 W 88 W 59 W 68 W 79 W 74 W
88 W 91 W 88 W 92 Q 91 W 82 W
90 W 89 W 89 W 92 W 94 W 90 W
Q Statistically significant increase since 2016 W No change E Statistically significant decrease since 2016
Other findings
Passenger experience in 2017 across the networks (%)
7
Q Overall, taking everything into account from the start to the end of this tram journey, how satisfied were you with your tram journey today?
Q How satisfied were you with the value for money of your journey?
Very satisfied Fairly satisfied Neither/nor Fairly dissatisfied Very dissatisfied
Very satisfied Fairly satisfied Neither/nor Fairly dissatisfied Very dissatisfied
Base: all passengers – 5505 (All networks), 509 (Blackpool), 3126 (Metrolink), 479 (Midland Metro), 350 (NET), 1041 (Supertram)
Base: all fare-paying passengers – 3696 (All networks), 408 (Blackpool), 2087 (Metrolink), 360 (Midland Metro), 222 (NET), 619 (Supertram)
Q Statistically significant increase since 2016 W No change E Statistically significant decrease since 2016
Q Statistically significant increase since 2016 W No change E Statistically significant decrease since 2016
Overall satisfaction with the tram journey (%)
Value for money – fare-payers only (%)
All networks
Total fairly/very satisfied
91 W 93 92 90 90
97 W 95 96 95 97
89 W 90 89 85 83
90 W 92 81 90 92
92 E 97 98 96 96
95 Q 91 97 92 94
Autumn2017
Autumn2016
Autumn2015
Autumn2014
Autumn2013
All networks
Total fairly/very satisfied
68 W 69 69 61 60
88 W 86 87 86 85
59 W 62 58 48 47
68 W 68 62 62 67
79 W 78 81 70 69
74 W 71 83 69 70
Autumn2017
Autumn2016
Autumn2015
Autumn2014
Autumn2013
Blackpool
Metrolink
Midland Metro
NET
Supertram
Blackpool
Metrolink
Midland Metro
NET
Supertram
8
Tram Passenger Survey Key findings
Blackpool (6.3 minutes W)
Metrolink (5.7 minutes W)
Midland Metro (4.3 minutes W)
NET (5.2 minutes E)
Supertram (6.2 minutes W)
Q How satisfied were you with the length of time you had to wait for the tram?
Q How satisfied were you with the punctuality of the tram?
Very satisfied Fairly satisfied Neither/nor Fairly dissatisfied Very dissatisfied
Very satisfied Fairly satisfied Neither/nor Fairly dissatisfied Very dissatisfied
Base: all passengers – 5440 (All networks), 496 (Blackpool), 3090 (Metrolink), 482 (Midland Metro), 348 (NET), 1024 (Supertram)
Base: all passengers – 5039 (All networks), 457 (Blackpool), 2874 (Metrolink), 452 (Midland Metro), 331 (NET), 925 (Supertram)
Q Statistically significant increase since 2016 W No change E Statistically significant decrease since 2016
Satisfaction with waiting time (%)
Satisfaction with punctuality of the tram (%)
Q Statistically significant increase since 2016 W No change E Statistically significant decrease since 2016E Statistically significant reduction in waiting time since 2016
Average reported waiting time displayed in brackets
All networks
Total fairly/very satisfied
88 W 88 84 82 81
94 W 94 90 91 91
85 W 85 79 77 76
92 Q 86 86 87 87
92 W 95 93 92 87
86 W 84 86 80 83
Autumn2017
Autumn2016
Autumn2015
Autumn2014
Autumn2013
All networks
Total fairly/very satisfied
88 W 88 86 83 82
91 W 94 93 90 93
88 W 86 82 78 75
92 Q 87 88 88 87
91 W 96 93 93 94
82 W 82 85 78 84
Autumn2017
Autumn2016
Autumn2015
Autumn2014
Autumn2013
Blackpool
Metrolink
Midland Metro
NET
Supertram
9
Q How satisfied were you with the amount of time the journey took?
Very satisfied Fairly satisfied Neither/nor Fairly dissatisfied Very dissatisfied
Base: all passengers – 5392 (All networks), 502 (Blackpool), 3051 (Metrolink), 471 (Midland Metro), 347 (NET), 1021 (Supertram)
Q Statistically significant increase since 2016 W No change E Statistically significant decrease since 2016
Q Thinking about whilst you were on the tram, please indicate how satisfied you were with sufficient room for all passengers to sit/stand?
Very satisfied Fairly satisfied Neither/nor Fairly dissatisfied Very dissatisfied
Base: all passengers – 5385 (All networks), 503 (Blackpool), 3042 (Metrolink), 468 (Midland Metro), 346 (NET), 1026 (Supertram)
Q Statistically significant increase since 2016 W No change E Statistically significant decrease since 2016
Satisfaction with on-tram journey time (%)
Satisfaction with availability of seating or space to stand (%)
All networks
Total fairly/very satisfied
87 E 90 87 84 87
95 W 95 95 91 95
86 W 87 83 81 80
86 W 86 89 85 86
86 W 93 93 91 92
92 W 93 93 85 92
Autumn2017
Autumn2016
Autumn2015
Autumn2014
Autumn2013
All networks
Total fairly/very satisfied
75 E 78 80 74 72
85 W 87 89 84 91
71 E 74 76 65 62
66 W 70 74 76 61
77 W 80 79 78 77
84 W 79 85 86 85
Autumn2017
Autumn2016
Autumn2015
Autumn2014
Autumn2013
Blackpool
Metrolink
Midland Metro
NET
Supertram
Blackpool
Metrolink
Midland Metro
NET
Supertram
10
Tram Passenger Survey Key findings
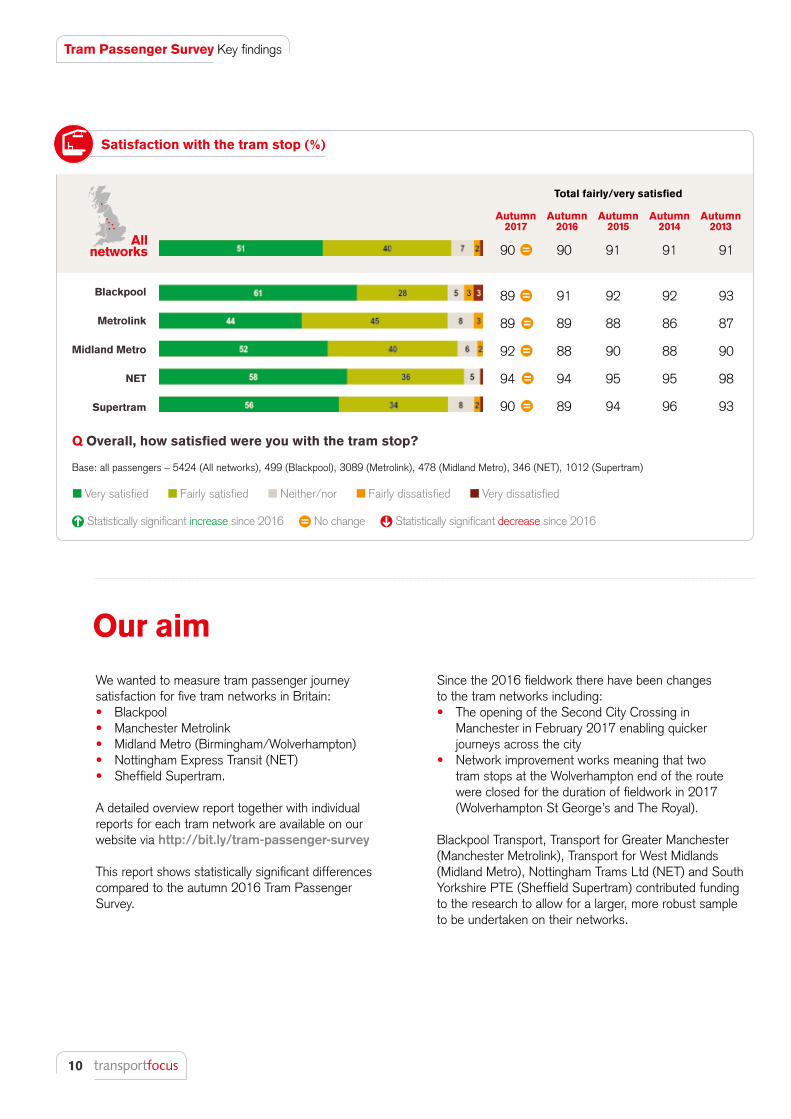
We wanted to measure tram passenger journey satisfaction for five tram networks in Britain:• Blackpool • Manchester Metrolink • Midland Metro (Birmingham/Wolverhampton) • Nottingham Express Transit (NET) • Sheffield Supertram.
A detailed overview report together with individual reports for each tram network are available on our website via http://bit.ly/tram-passenger-survey
This report shows statistically significant differences compared to the autumn 2016 Tram Passenger Survey.
Our aim
Since the 2016 fieldwork there have been changes to the tram networks including: • The opening of the Second City Crossing in
Manchester in February 2017 enabling quicker journeys across the city
• Network improvement works meaning that two tram stops at the Wolverhampton end of the route were closed for the duration of fieldwork in 2017 (Wolverhampton St George’s and The Royal).
Blackpool Transport, Transport for Greater Manchester (Manchester Metrolink), Transport for West Midlands (Midland Metro), Nottingham Trams Ltd (NET) and South Yorkshire PTE (Sheffield Supertram) contributed funding to the research to allow for a larger, more robust sample to be undertaken on their networks.
Q Overall, how satisfied were you with the tram stop?
Very satisfied Fairly satisfied Neither/nor Fairly dissatisfied Very dissatisfied
Base: all passengers – 5424 (All networks), 499 (Blackpool), 3089 (Metrolink), 478 (Midland Metro), 346 (NET), 1012 (Supertram)
Q Statistically significant increase since 2016 W No change E Statistically significant decrease since 2016
Satisfaction with the tram stop (%)
All networks
Total fairly/very satisfied
90 W 90 91 91 91
89 W 91 92 92 93
89 W 89 88 86 87
92 W 88 90 88 90
94 W 94 95 95 98
90 W 89 94 96 93
Autumn2017
Autumn2016
Autumn2015
Autumn2014
Autumn2013
Blackpool
Metrolink
Midland Metro
NET
Supertram
11
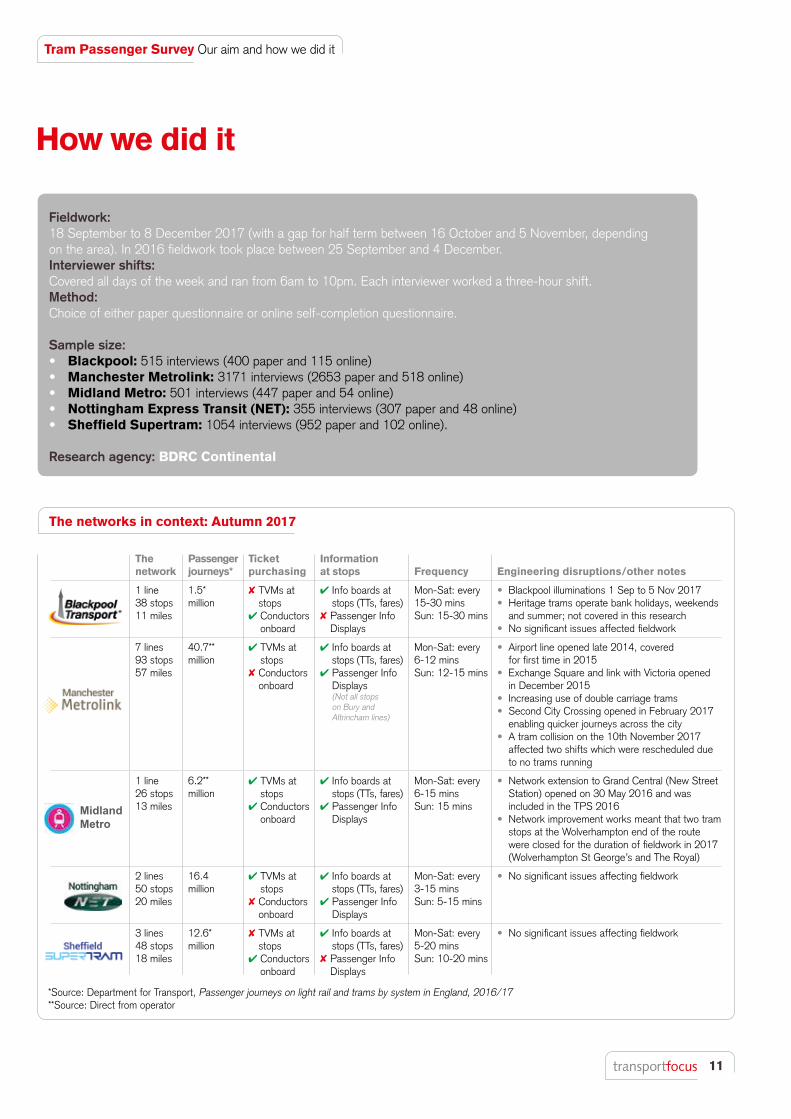
Fieldwork: 18 September to 8 December 2017 (with a gap for half term between 16 October and 5 November, depending on the area). In 2016 fieldwork took place between 25 September and 4 December.Interviewer shifts: Covered all days of the week and ran from 6am to 10pm. Each interviewer worked a three-hour shift.Method: Choice of either paper questionnaire or online self-completion questionnaire.
Sample size:• Blackpool: 515 interviews (400 paper and 115 online)• Manchester Metrolink: 3171 interviews (2653 paper and 518 online)• Midland Metro: 501 interviews (447 paper and 54 online)• Nottingham Express Transit (NET): 355 interviews (307 paper and 48 online)• Sheffield Supertram: 1054 interviews (952 paper and 102 online).
Research agency: BDRC Continental
How we did it
Tram Passenger Survey Our aim and how we did it
The networks in context: Autumn 2017
The network
Passenger journeys*
Ticket purchasing
Information at stops Frequency Engineering disruptions/other notes
1 line38 stops11 miles
1.5* million
8 TVMs at stops
4 Conductors onboard
4 Info boards at stops (TTs, fares)
8 Passenger Info Displays
Mon-Sat: every 15-30 minsSun: 15-30 mins
• Blackpool illuminations 1 Sep to 5 Nov 2017• Heritage trams operate bank holidays, weekends
and summer; not covered in this research• No significant issues affected fieldwork
7 lines93 stops57 miles
40.7**million
4 TVMs at stops
8 Conductors onboard
4 Info boards at stops (TTs, fares)
4 Passenger Info Displays (Not all stops on Bury and Altrincham lines)
Mon-Sat: every 6-12 minsSun: 12-15 mins
• Airport line opened late 2014, covered for first time in 2015
• Exchange Square and link with Victoria opened in December 2015
• Increasing use of double carriage trams• Second City Crossing opened in February 2017
enabling quicker journeys across the city• A tram collision on the 10th November 2017
affected two shifts which were rescheduled due to no trams running
1 line26 stops13 miles
6.2**million
4 TVMs at stops
4 Conductors onboard
4 Info boards at stops (TTs, fares)
4 Passenger Info Displays
Mon-Sat: every 6-15 minsSun: 15 mins
• Network extension to Grand Central (New Street Station) opened on 30 May 2016 and was included in the TPS 2016
• Network improvement works meant that two tram stops at the Wolverhampton end of the route were closed for the duration of fieldwork in 2017 (Wolverhampton St George’s and The Royal)
2 lines50 stops20 miles
16.4million
4 TVMs at stops
8 Conductors onboard
4 Info boards at stops (TTs, fares)
4 Passenger Info Displays
Mon-Sat: every 3-15 minsSun: 5-15 mins
• No significant issues affecting fieldwork
3 lines48 stops18 miles
12.6*million
8 TVMs at stops
4 Conductors onboard
4 Info boards at stops (TTs, fares)
8 Passenger Info Displays
Mon-Sat: every 5-20 minsSun: 10-20 mins
• No significant issues affecting fieldwork
*Source: Department for Transport, Passenger journeys on light rail and trams by system in England, 2016/17**Source: Direct from operator

12
Tram Passenger Survey Our aim and how we did it
Theme (factor) Questions
1 On tram environment and comfort
• Sufficient room for all the passengers to sit/stand
• The comfort of the seats• The amount of personal space you had
around you• Provision of grab rails to hold on to when
standing/moving about the tram• The temperature inside the tram
2 Tram stop condition
• Its general condition/standard of maintenance
• Its freedom from graffiti/vandalism• Its freedom from litter
3 Boarding the tram
• The ease of getting on to and off of the tram• The length of time it took to board the tram
4 Timeliness • The length of time you had to wait for the tram
• The punctuality of the tram
5 Access to the tram stop
• Its distance from your journey start e.g. home, shops
• The convenience/accessibility of its location
6 Personal safety throughout journey
• Behaviour of fellow passengers waiting at the stop
• Your personal safety whilst at the tram stop• Your personal security whilst on the tram
7 Cleanliness and condition of the tram
• The cleanliness and condition of the outside of the tram
• The cleanliness and condition of the inside of the tram
8 Smoothness/speed of the tram
• The amount of time the journey took• Smoothness/freedom from jolting during
the journey
9 Information throughout journey
• The information provided at the tram stop• Route/destination information on the outside
of the tram• The information provided inside the tram
10 Value for money
• How satisfied were you with the value for money of your tram journey?
Methodology – themes that are affecting overall passenger satisfaction chartsThe approach to identifying themes that affect overall passenger satisfaction is split into two stages. At the first stage, we took all 25 individual satisfaction measures from the survey (apart from the overall journey satisfaction) and formed them into themes using a statistical technique known as factor analysis, which groups together those satisfaction measures that are responded to similarly within the data. For instance, where high or low scores are given for measure ‘x’, there tends to be a similar rating for measures ‘y’ and ‘z’, so the ‘factor’ or theme becomes ‘A’. Through this process we identified ten themes, which are shown below, alongside measures that formed each theme:
Methodology – data analysis Base definitionsAll charts are based on those who gave an answer to an individual question. Those who either left the question blank or said ‘don’t know’ have been excluded from the base. For this reason the base sizes for those charts based on ‘All passengers’ vary slightly between the different charts in this report.
Autumn 2016 comparisonThis report shows results from Autumn 2016 at the ‘All networks’ level only. Full 2016 comparisons for each network can be found in the individual network reports.
Significant changes are shown at the 95 per cent confidence level. Q/W/E symbols are used throughout this report to indicate positive or negative significant changes.
WeightingThis was based on passenger count information collected by the interviewer during each interviewer shift. The weighting matrix used the following weighting cells:• Tram network: for Manchester Metrolink, Nottingham
Express Transit and Sheffield Supertram this was by line• Age: 16-25, 26-59, 60+• Gender: male, female• Time/day travelled: weekday peak, weekday off peak
and weekend.
A rim weight by volume of passengers using each network was also applied. This was sourced from Department for Transport data for Blackpool, Midland Metro and Sheffield Supertram. Data for Metrolink and Nottingham was sourced from the network, to provide the most up- to-date figures for each of their lines.
The full details of the weighting matrix can be found in the TPS Autumn 2017 technical report.
13
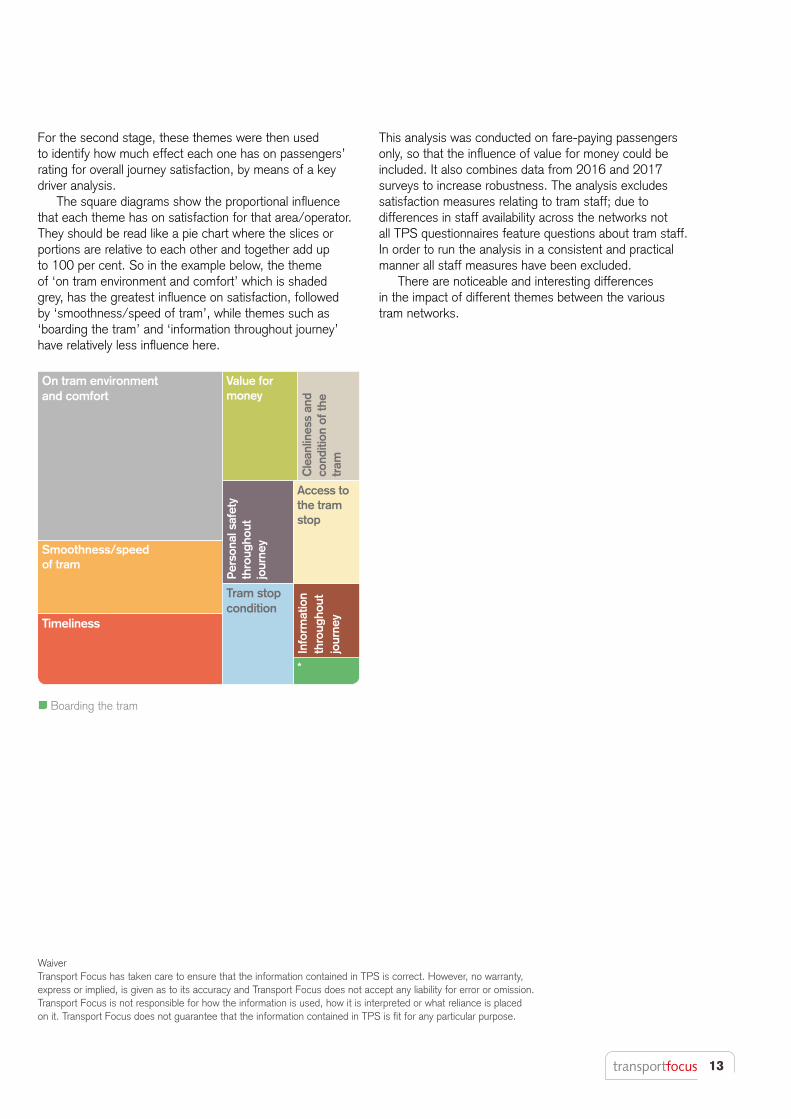
This analysis was conducted on fare-paying passengers only, so that the influence of value for money could be included. It also combines data from 2016 and 2017 surveys to increase robustness. The analysis excludes satisfaction measures relating to tram staff; due to differences in staff availability across the networks not all TPS questionnaires feature questions about tram staff. In order to run the analysis in a consistent and practical manner all staff measures have been excluded.
There are noticeable and interesting differences in the impact of different themes between the various tram networks.
For the second stage, these themes were then used to identify how much effect each one has on passengers’ rating for overall journey satisfaction, by means of a key driver analysis.
The square diagrams show the proportional influence that each theme has on satisfaction for that area/operator. They should be read like a pie chart where the slices or portions are relative to each other and together add up to 100 per cent. So in the example below, the theme of ‘on tram environment and comfort’ which is shaded grey, has the greatest influence on satisfaction, followed by ‘smoothness/speed of tram’, while themes such as ‘boarding the tram’ and ‘information throughout journey’ have relatively less influence here.
WaiverTransport Focus has taken care to ensure that the information contained in TPS is correct. However, no warranty, express or implied, is given as to its accuracy and Transport Focus does not accept any liability for error or omission. Transport Focus is not responsible for how the information is used, how it is interpreted or what reliance is placed on it. Transport Focus does not guarantee that the information contained in TPS is fit for any particular purpose.
Smoothness/speed of tram
Timeliness
*
Per
sona
l saf
ety
thro
ugho
ut
jour
ney
Info
rmat
ion
thro
ugho
ut
jour
ney
Cle
anlin
ess
and
cond
ition
of t
he
tram
Value for money
Access to the tram stop
Tram stop condition
On tram environment and comfort
Boarding the tram
Published in March 2018 © 2018 Transport FocusDesign by heritamacdonald.com
Transport Focus is the independent consumer organisation representing the interests of:
• all users of England’s motorways and major ‘A’ roads (the Strategic Road Network)
• rail passengers in Great Britain• bus, coach and tram users across England
outside London.
We work to make a difference for all transport users
Contact Transport Focus
Any enquiries about this research
should be addressed to:
Rosie Giles
Insight Advisor
Transport Focus
0300 123 0842
www.transportfocus.org.uk
Fleetbank House
2-6 Salisbury Square
London
EC4Y 8JX
Transport Focus is the operating
name of the Passengers’ Council