Trajectories of viable and non-viable service systems5).pdfTrajectories of viable and non-viable...
27
Trajectories of viable and non-viable service systems Naples Forum on Service 2013 Ralph D. Badinelli Virginia Tech April 2013
Transcript of Trajectories of viable and non-viable service systems5).pdfTrajectories of viable and non-viable...

Trajectories of viable and non-viable service systems
Naples Forum on Service 2013
Ralph D. Badinelli Virginia Tech
April 2013
Abstract
Purpose
The purpose of this paper is fourfold: 1) to present a robust mathematical model of the decisions
of agents who engage in resource-integrating processes within a service system, 2) to describe
the experience of agents who engage in a service in terms of trajectories through a
hypernetwork of resource integrators, 3) to provide precise representations of the VSA concepts
of complicatedness, complexity, abductive/inductive/deductive reasoning, equifinality and
viability 4) to derive expressions for the probabilities of possible final states of a service as
functions of service-system parameters.
Design/Methodology/approach
Most of the paper is in the form of mathematical derivations and proofs with some examples and
simulations for empirical support. The foundation for this modeling is the author’s previous
research in the modeling of agent decision making in service systems in terms of fuzzy control
(Badinelli, 2012; Badinelli et al, 2012). This model is expanded with the introduction of a
random component to represent the role of resources that are unknown to the agent at the time
of commitment to a service engagement and allows the representations of abductive, inductive
and deductive phases of the service. Through a sequence of engagements in service
processes, the service recipient pursues a trajectory through a hypernetwork of service
providers that, in a finite number of steps arrives at a final state, which can be either a
satisfactory or unsatisfactory provision of the desired service. Hence, we can demonstrate that
the service system is viable or non-viable in a manner that is consistent with the view of service
system described by Barile & Polese (2010a, 2010b).
Findings
As a service recipient pursues a service through sequential engagements, the recipient’s
understanding of the complexity and complicatedness of the service process determines the
viability of this agent’s decision making.
Research limitations/implications
The research advances the modeling of service systems at the operational level. The
sequential, stochastic, fuzzy-control decision model is designed with a minimum of restrictive
assumptions. The model will serve as a foundation for more detailed development and
application to real cases.
Practical implications
The research guides the design of service systems with the epistemology of the service
recipient in mind.
Originality/value
Original contributions are the model of an agent’s decision making in service engagements and
the placement of concepts of the viable systems approach on a precise mathematical
foundation.
Key words
Viable systems approach, hypernetwork, fuzzy decision models, complexity
Paper type – Research paper
1
1. Introduction
The purpose of this paper is fourfold: 1) to present a robust mathematical model of the decisions
of agents who engage in resource-integrating processes within a service system, 2) to describe
the experience of agents who engage in a service in terms of trajectories through a
hypernetwork of resource integrators, 3) to provide precise representations of the VSA concepts
of complicatedness, complexity, abductive/inductive/deductive reasoning, equifinality and
viability 4) to derive expressions for the probabilities of possible final states of a service as
functions of service-system parameters.
As service science is an infant discipline, the state of modeling for the support of design and
management of service systems is quite rudimentary. However, the need for this support is
unquestionably strong due to the fact that service is now recognized as the core of economic
activity (Ostrom 2010, Ehret & Wirtz 2010, Vargo & Akaka 2009) In particular, knowledge-
intensive business service (KIBS) and knowledge-based intelligent service (KBIS) are forms of
service that are enjoying the most rapid growth and have the potential to become the most
prevalent instances of service systems (Lance & Amy, 2002). The digitization of products and
services is presenting an ever-widening array of user-driven contextual innovation of service
(Hsu 2011, Carroll et al 2010)
The motivation for this research stems from the need for mathematical models of service
system performance as a function of agent decision making. Previous research has determined
that service systems can generally be modeled as hyper-networks of agents (human and non-
human), resources, resource access rights, resource-integration engagements among agents
and agent decision making that determines resource commitments to these engagements
(Badinelli 2012, Hsu 2011). In short, value is derived in the context of a constellation of
resources and an ecosystem of agents that control access to the resources (Ng & Smith 2012).
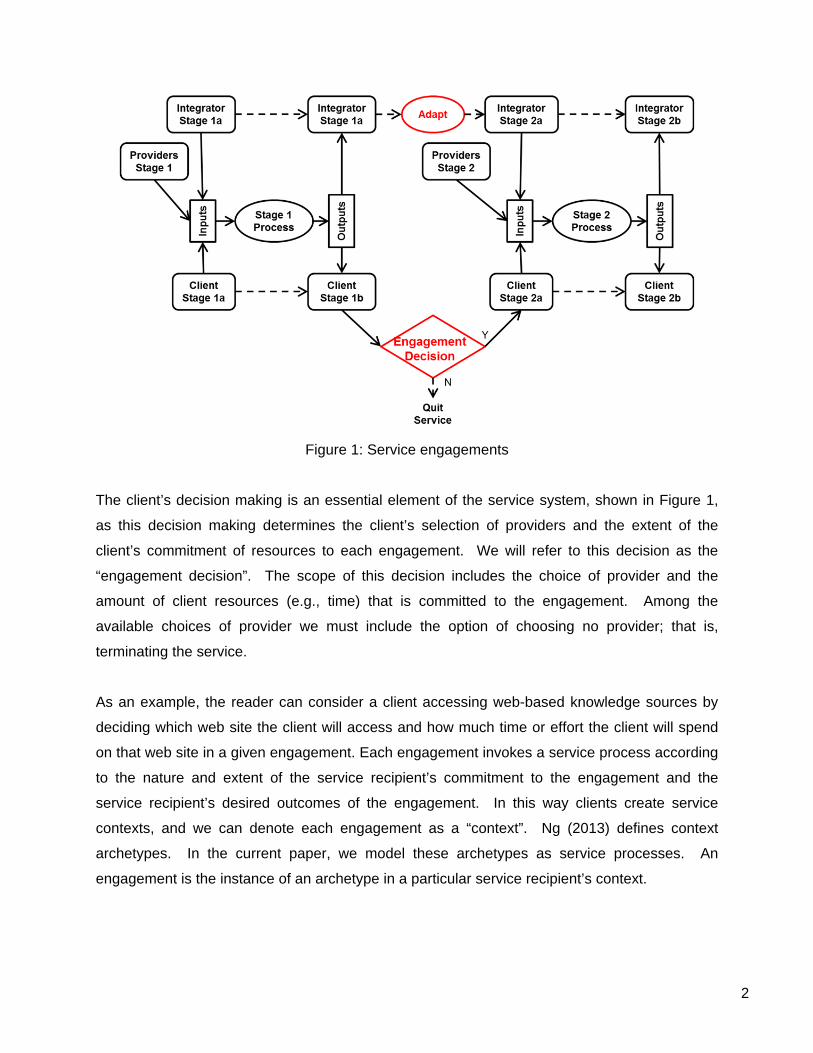
Figure 1 shows a network diagram of such a system. Value is co-created through resource-
integrating engagements between the service recipient, hereinafter called the client, and other
resource-providing agents, hereinafter called providers. Resource integrators are agents that
facilitate the engagement of providers and clients. The reader is referred to Badinelli (2012) for
background on this representation of service systems.
2
Figure 1: Service engagements
The client’s decision making is an essential element of the service system, shown in Figure 1,
as this decision making determines the client’s selection of providers and the extent of the
client’s commitment of resources to each engagement. We will refer to this decision as the
“engagement decision”. The scope of this decision includes the choice of provider and the
amount of client resources (e.g., time) that is committed to the engagement. Among the
available choices of provider we must include the option of choosing no provider; that is,
terminating the service.
As an example, the reader can consider a client accessing web-based knowledge sources by
deciding which web site the client will access and how much time or effort the client will spend
on that web site in a given engagement. Each engagement invokes a service process according
to the nature and extent of the service recipient’s commitment to the engagement and the
service recipient’s desired outcomes of the engagement. In this way clients create service
contexts, and we can denote each engagement as a “context”. Ng (2013) defines context
archetypes. In the current paper, we model these archetypes as service processes. An
engagement is the instance of an archetype in a particular service recipient’s context.
3
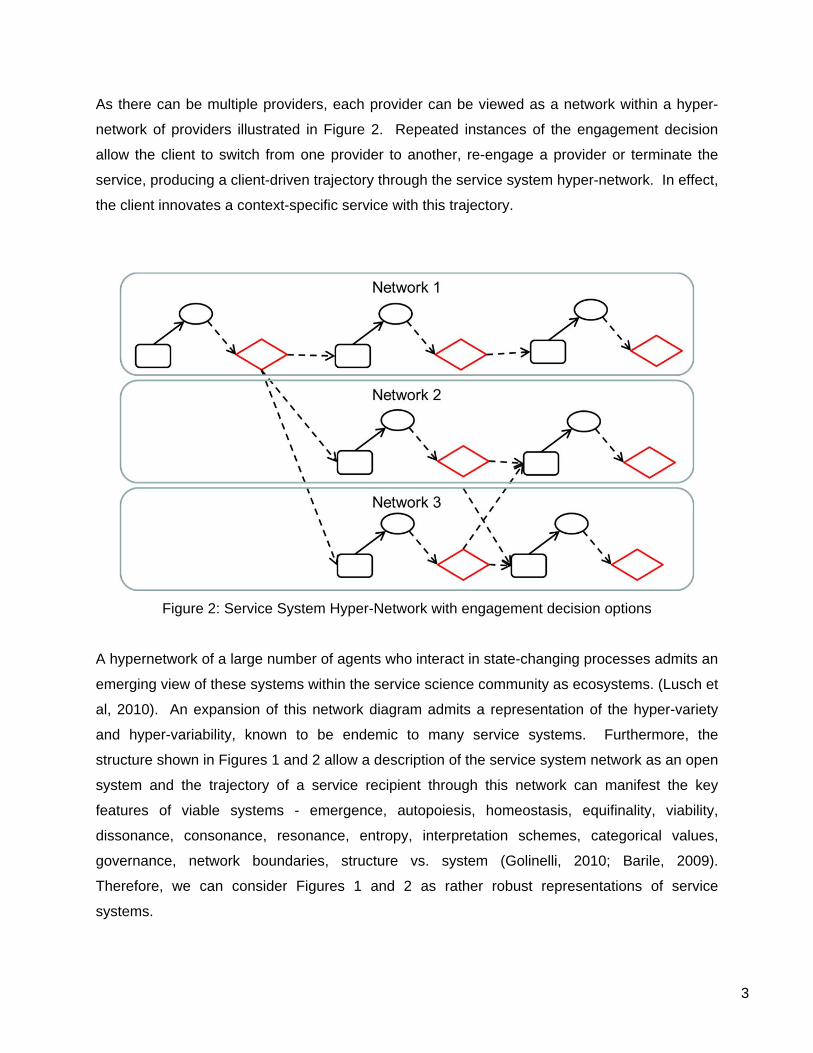
As there can be multiple providers, each provider can be viewed as a network within a hyper-
network of providers illustrated in Figure 2. Repeated instances of the engagement decision
allow the client to switch from one provider to another, re-engage a provider or terminate the
service, producing a client-driven trajectory through the service system hyper-network. In effect,
the client innovates a context-specific service with this trajectory.
Figure 2: Service System Hyper-Network with engagement decision options
A hypernetwork of a large number of agents who interact in state-changing processes admits an
emerging view of these systems within the service science community as ecosystems. (Lusch et
al, 2010). An expansion of this network diagram admits a representation of the hyper-variety
and hyper-variability, known to be endemic to many service systems. Furthermore, the
structure shown in Figures 1 and 2 allow a description of the service system network as an open
system and the trajectory of a service recipient through this network can manifest the key
features of viable systems - emergence, autopoiesis, homeostasis, equifinality, viability,
dissonance, consonance, resonance, entropy, interpretation schemes, categorical values,
governance, network boundaries, structure vs. system (Golinelli, 2010; Barile, 2009).
Therefore, we can consider Figures 1 and 2 as rather robust representations of service
systems.
4
In this paper we present a model of a simple KBIS and illustrate how viable trajectories and non-
viable trajectories can occur as a result of engagement decisions and contexts within the
service system network. For placing the model in a real context the reader is reminded to
visualize a client perusing web sites of different providers in order to find information that helps
the client solve a problem. Value for the client is co-created if one or more of these
engagements of providers is relevant to the client’s problem. An example is a person’s search
of various medical web sites in order to diagnose a condition and pursue effective treatments.
The lineage of models of service processes in terms of input resources and value-generating
output resources begins with Data Envelopment Analysis (DEA). See Charnes et al. (1994),
Fare and Grosskopf (2000) and Golany et. al.(2006). These models are useful for a high-level
view of service and an aggregate measurement of resources. However, modern service
science seeks to understand and optimize the design of service systems at an operational level
as modern technology now enables the personalization of a vast array of service (Hsu, 2009).
At this operational, personalized level, we must understand the role of agent decision making
within the service system.
Service systems manifest the complexity of the client’s decisions (Ng et al, 2012). Any decision
involves the decision maker’s estimates of key parameters that affect the outcomes of the
courses of action that are available to the decision maker. Outcomes are measured in terms of
key performance indicators (KPI) that lead to overall value. A decision that involves large
numbers of alternatives, parameters and KPIs is labeled complicated. Complicated decisions
have been modeled for more than fifty years and are known to succumb to deductive analytical
solutions through mathematical decision models and support from information/communications
technology (ICT). However, prior to constructing a decision model, either explicitly or implicitly
in the decision maker’s mind, the decision maker must be able to define the alternatives,
parameters and KPIs. In the early stages of solving a problem, these definitions do not exist,
and the decision maker has yet to develop a basic understanding of the structure of the
problem. In this early phase of decision making, the decision is labeled complex. Abductive
reasoning, as opposed to deductive reasoning is the process of complex decisions. See Barile
(2009).
The general thrust of this research is to use models of complex agent decision making to
explain important phenomena of service-system trajectories such as equifinality, autopoeisis,
5
equilibria, stability, reachability, viability, etc. The current paper represents a naïve first initiative
in this research. We study only the trajectory of a client as a holon of the service system.
The rest of this paper is organized as follows: Section 2 presents a model of the engagement
decision as a fuzzy model, Section 3 explains how a sequence of engagements and
engagement decisions produces a trajectory through the service system hyper-network and
connects these trajectories to VSA concepts, Section 4 describes simulation studies of these
trajectories and the insights into service design that they reveal and Section 5 discusses the
conclusions to be drawn from this research and directions for future research.
2. Fuzzy, stochastic adaptive decisions
Imprecision can affect the specifications of all components of a decision model: the definitions of
decision variables, parameters and performance measures as well as specifications of the
relations that map decision variables and parameters to performance measures. Badinelli
(2012) posited a general fuzzy model of the decision that faces the client at each engagement.
This model incorporates a representation of the client’s imprecision in specifying all of the
elements of the decision and the relationship between actions and outcomes in the form of
membership functions.
Although the entire fuzzy model for the client’s decision includes these components, for the
purpose of the trajectory analysis of the current paper, we use the composite effect of the
membership functions of all of these components into a summary measure of the imprecision of
the value-generating capability of the resource that is offered by a provider in a service
engagement. The focus on the overall imprecision of this resource is sufficient to model the
client’s decision to engage or not engage each provider.
The outcomes of each engagement of the client’s trajectory through the hyper-network shown in
Figure 2 provide the client with feedback regarding the success of the engagement in
generating value. This feedback is the primary input to the decision of whether to re-engage the
provider, seek another provider or terminate the service. This decision is the mechanism of
adaptation by the client. The client makes the engagement decision through the application of
an explicit or implicit model of the decision. If the decision is made without precise
understanding of the structure of the decision, then this model can be constructed only as a
fuzzy model. See Tsoulakis and Uhrig (1997), Ross et al (2002).

6
Adaptive decision making takes place at several different levels, which are outlined below. The
form of using feedback and the scope of updates to the decision model distinguish the following
levels of adaptation.
Level 0 -- Non-adaptive decisions: No feedback from experience is used. This level of
adaptation is also known as open-loop control.
Level 1 -- Activity adaptive decisions: Feedback is used to update the history of activity
(e.g., volumes of transactions).
Level 2 -- Outcome adaptive decisions: Feedback consists of updates to status of the
decision environment and performance to date.
Level 3 -- Forecast adaptive decisions: Feedback is used to update status and the
projections of future values of decision parameters.
Level 4 -- Estimation adaptive decisions: Feedback is used to update estimates of well-
defined model parameters.
Level 5 -- Specification adaptive decisions: Feedback is used to update the structure of
the decision model by reducing vagueness in the definitions of variables, parameters,
performance measures and relations.
Level 6 -- Criteria adaptive decisions: Feedback is used to update the utility function that
defines optimality and relative preference of solutions.
A decision maker adapting sequential decisions through levels 1 – 4 applies deductive logic to
use feedback for revising the decision model. Levels 3 and 4 are applicable to a decision maker
whose understanding of the decision is precise and complete, but not yet accurate. Experience
provides more data for the estimation of well-defined parameters and a stochastic model of the
decision is appropriate. These levels of adaptation are possible when precision is fixed,
decision model elements are all well-defined and complicatedness of the decision is fixed.
Our interest in this paper is in Levels 5 and 6 of adaptation as these forms of adaptation
correspond to the abductive and inductive phase of service innovation (Barile, 2009). Levels 5
and 6 of the adaptation hierarchy apply to a decision maker whose understanding of the
decision model is imprecise, not just inaccurate. Fuzzy decision models are at work during the
abductive phase of service evolution. On the path toward a precise model specification, the
abductive decision maker updates the specification of model elements. Eventually, these
7
specifications may complete precise, at which point the deductive phase of the service can
begin.
As a side point we mention the notion of entropy that has been associated with adaptation in the
VSA literature (Badinelli, 2012; Barile, 2009). Representing abductive adaptation in terms of
imprecision in understanding of the service process as opposed to uncertainty in estimating
parameters prohibits the use of the concept of entropy in describing the indeterminacy in the
decision maker’s model. Entropy is a characteristic of a probability distribution. In the case of a
well-defined variable, the value of which is unknown, the uncertainty in this variable’s value can
be represented by a probability distribution and a summary measure of the “spread” or degree
of randomness of this distribution is given by the formula for entropy. However, in abductive
adaptation, the decision maker is coping with imprecision, not uncertainty. Uncertainty is
measured through a probability distribution and imprecision is measured through a membership
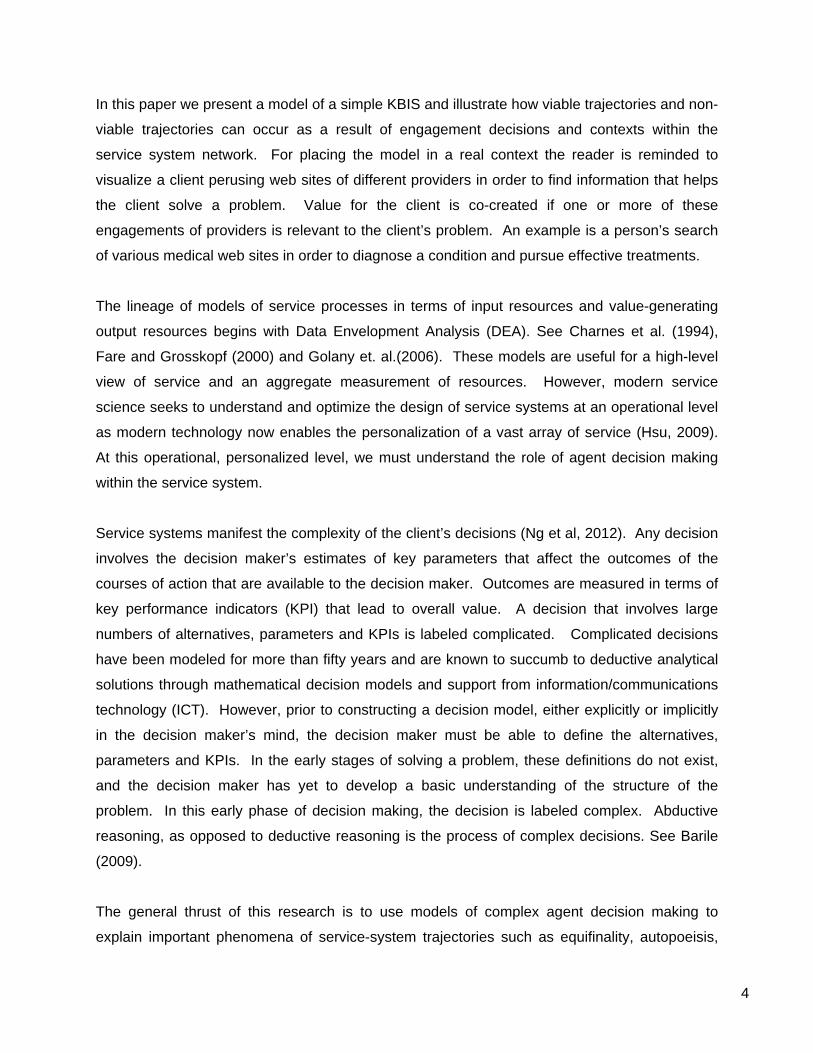
function. Nevertheless, an analogue of entropy can be constructed from the shape of the
membership function. For the membership function shown in Figure 3, for example, the degree
of imprecision can be measured in terms of the width of the threshold interval.
Figure 3: Membership function (MF) of resource value
Figure 3 illustrates the membership function for the value of a provider’s resource. The
horizontal axis represents the amount of the resource to which the client commits (e.g., the
number of web pages that the client will read). The vertical axis represents the value of this
commitment to the client’s desired outcomes of the service. Because the client’s understanding
0.000
0.200
0.400
0.600
0.800
1.000
0 0.1 0.2 0.3 0.4 0.5 0.6 0.7 0.8 0.9 1
Value
Resource Commitment
LowerUpperthreshold

8
of this value is somewhat vague, the claim that the resource commitment is definitely valuable
can be made only if the amount of resource commitment exceeds the upper threshold shown in
Figure 3. If the resource commitment is less than the lower threshold, then the client is certain
that the commitment did not yield any value. Between these two threshold, the client is vague
about the creation of value because the client’s definition of value and its dependency on
resources is imprecise. The membership function between the lower and upper threshold
reflects the degree of vagueness in the client’s definition of this value.
We can now extend the decision model of the previous section to an adaptive model by
considering a sequence of stages of decisions as shown in Figure 2. The engagement decision
is both stochastic and fuzzy. Before deciding on the level of commitment to a provider, the
client must estimate whether or not the providing agent has the resources that will be relevant to
the client’s service context. This property of relevance is well defined as a binary property
which can be considered a representation of dissonance (resource is not relevant) or
consonance (resource is relevant). Representing the relevance as a binary variable requires a
Bernoulli distribution to describe the uncertainty in this property. This element of the client’s
decision is represented by a stochastic model.
Define,
t stage of service
atk client commitment to the knowledge resource from provider a in stage t
tB remaining client budget for effort at the end of stage t
︶k︵ atat membership function of the value of resource from agent a in stage t
t stage of end the at relevant not considered is are resources sa' providerif ,0 t stage ofendtheatrelevantconsideredare resources sa' agent if ,1
r it
att1t kBB (1)
The client’s re-engagement decision seeks to reduce dissonance and increase consonance.
Under the formulation provided herein, this learning process is modeled by the updating of the
relevance probabilities. If an engagement with the provider results in a gain (loss) in value, the
client increases (decreases) the probability of relevance for an ensuing engagement with that
provider. Ideally, the client performs these updates via the classic Bayesian formulation.
9
︶rr︵p at1at probability of relevance of provider a at the end of stage 1t , given the
relevance at the end of stage t
︶r︵pr,rprrp
at
at1atat1at
(2)
3. Trajectories of fuzzy, adaptive control
We can see the guidance of a client through a service system like that illustrated in Figure 2 as
a sequential decision process, spawning a trajectory of states that may or may not lead to the
client’s satisfaction with the value that is gained.
Each service engagement is preceded by a decision by the client to engage one of the resource
providers that are available. The client chooses the provider that has the highest perceived
potential to generate value to the client. After each engagement, the client re-evaluates the
value-generating potential of all providers and chooses one of three alternative course of action:
1) re-engage the provider of the most recent engagement, 2) switch to another provider or 3)
terminate the service. The termination of the service prior to achieving the client’s objectives for
value indicates a non-viable service system.
We see the need for a refinement in the definition of viability. The reader who is familiar with
VSA may find this definition somewhat puzzling as VSA defines viability in terms of survival.
However, an examination of the survival standard for viability reveals some ambiguity about the
word survival and contradictions in the application of this standard. A simple example will
suffice to explain this point. Consider a large, long-standing corporation or institution, such as
the company IBM. We can say that IBM has survived for 100 years as a corporation. But what
exactly has survived? The resources of the company in terms of its inventories and fixed assets
have all been replaced several times. The personnel of the company have been turned over
numerous times. The leadership of the company has changed. The ownership of the company
has been passed from one investor to another, thousands of times. The governance of the
company has changed dramatically through numerous updates in corporate policy. The mission
of the company has shifted from product manufacture to consulting and support services. For
any institution or corporation we can identify survival in terms of several components as follows.
survival of resources
10
survival of logical structure
survival of physical structure
survival of knowledge
survival of processes
survival of relations
survival of logical agents
survival of physical agents
survival of intent (mission/vision/goals)
None of these forms of survival suffice to explain the survival of systems such as corporations
and institutions or even biological systems. The question that is raised by such studies of
survival is, what is destroyed and what survives in a system that deserves to be called viable?
A robust answer cannot base survival on any subset of the components listed above because
exceptions can easily be found.
The consideration of these counter-examples leads to a definition of viability for service systems
as continuity in value creation. Evolution of an open system over a period of time is the
essence of viability. This evolution reflects a continuity of states over time. Although the states
may be quite different in terms of resources, agents, intent, governance, etc., the fact that each
state came about through a transition from a previous state is a singular, common characteristic
of a system that has survived. Therefore, continuity, per se, must be viewed as a real feature of
a system that exists apart from the elements that make up the system at any time and a viable
system is one that can continue to make transitions that generate value or avoid destruction of
value.
The simulation experiments presented in the next section evaluate the viability of a service for a
client, which may be a person, a job title or a role in an institution. The client exists in an
ecosystem of agents that can provide resources for the service that the client desires. The
service may be achieved through a sequence of engagements of the client with different
providers. Viability of the service is represented in this model by a continuity of engagements
that leads to the generation of value for the client. This sequence of engagements can be
called a trajectory through the service system. Trajectories that end with the client terminating
further engagements without any generation of value we define as non-viable trajectories and
the service system for this case we define as a non-viable system.
11
The trajectory of a service depends on many features of the service system. Clearly, the
complex decision making of the client in a service system of multiple resource providers can
take many different forms. Consequently, there can be many different patterns of trajectories.
The viability of a trajectory depends on the configuration and parameters of the service system
such as,
the methods for updating a client’s understanding of the service,
the number of agents required by each service engagement,
the number of agents competing for each service engagement,
the number of resources involved in the service engagements (complicatedness),
the degree of cooperation among agents,
the degree of initial imprecision in the client’s model of the service (complexity).
Computer simulation is a modeling tool that is ideally suited to experiments on complicated and
complex hypothetical systems. The next Section describes a computer simulation of a simple
case of a service system.
4. Simulations
In this Section we present the results of simulation experiments of the service system that is
described above. Given the human nature of client interactions with service systems and the
paucity of knowledge about details of agent decision making, we can perform simulations only
with plausible suppositions about client behavior as opposed to validated behavior models.
These experiments reveal interesting possibilities for tracking client behavior and for designing
service engagements in ways that can increase the viability of a service system. The set of
experiments presented herein is exploratory and by no means exhaustive or representative of a
cross-section of contexts. The purpose of these simulation experiments is to expose certain
potential trajectories of clients in a KIBS/KBIS and to show some interesting outcomes for
performance that are possible.
All of the experiments are designed from a base case for the service system which has the
following features.
There are five service providers (e.g., five web sites) that are potentially valuable to the
client.
The client engages one of these providers in each stage of the client’s trajectory.

12
The client has a fuzzy understanding of the value of the provider’s resource that is
measured by a half-trapezoid membership function. See Figure 3.
At each stage the client selects the provider for which the expected fuzzy value of the
provider’s resource is highest.
The client subjectively estimates the probability that a provider’s resources will be
relevant.
Note that we distinguish relevance from value. Relevance is not a fuzzy measure. That
is, a provider’s information resource either addresses the problem that the client wishes
to solve or not. Hence, the relevance of a provider’s resource is assigned a probability
and the value of a relevant resource is assigned a membership function.
The profile for the expenditure of the client’s budget for effort over a sequence of engagements
is varied. We can envision two types of clients. One type of client enters the service system
with an aggressive approach that expends the greatest amount of effort on the first engagement
and then reduces the level of effort with each ensuing engagement as either caution sets in
from unsuccessful engagements or satisfaction grows with successful engagements. Another
type of client enters the service system with some restraint and increases the level of effort with
each ensuing engagement as experience about the service is gained. We parameterize these
two approaches with a factor called the client effort gain rate.
The effort gain rate is a multiplier of the client effort. In proceeding from one engagement to the
next, we multiply the previous client effort by this factor. For each simulated case, the client’s
effort in the first engagement is set so that the entire effort budget is expended in ten
engagements. If this factor is greater than (less than) one, then we model an aggressive
(circumspect) client. The degree of these client characteristics is measured by the distance
between the gain rate and one.
Define,
etg effort gain rate at the end of stage t
tk client effort for stage t
tet1t kgk

13
10
1t0t Bk effort budget 10
et
et09
0t
tet
01 g1
g1Bg
Bk
(4)
Realistically, the client’s joint probability in (2) is heuristically and subjectively determined by the
client. Consequently, we simulate a variety of updating schemes. In each stage, the client
updates the probability of relevance of the provider that was just engaged based on the
performance of that engagement. Through a multiplicative factor that is greater than 1 (less
than 1) we simulate the updating of the relevance probability for the case of the previous
engagement increasing (not increasing) value. We can envision different kinds of clients in
terms of their willingness to change this probability. Impatient clients are likely to increase
(decrease) this probability dramatically after experiencing an improvement (no improvement) in
value after an engagement with the provider. More cautious clients would attenuate the
updating process.
Define,
atv value gained from provider a in stage t
︶v︵g atat relevance gain factor for updating the relevance probability of provider a at the end
of stage t .
︶0r︵0v,1
︶1r︵0v,1
︶v︵gatat
atatatat
The representation of (2) in the simulation model is then,
︶1r︵p︶v︵gr1rp atatatat1at (3)
The viability benchmark is an interesting parameter of each simulation. If there are n
providers, each with an initial probability of relevance of 0ap , then the probability that at least
one of these providers will be relevant is
n
1a0a0 p1p . We define this probability as the
viability benchmark because it provides a benchmark for performance. If the client simply
allocated an effort of 1 to each provider in a round-robin fashion, then 0p is the probability of
generating some amount of value. In analyzing the simulation experiments, this benchmark is
compared to the average probability that the client’s policy for engaging providers and updating
relevance probabilities creates value.

14
Each replication of the simulation model generates a monte carlo scenario of the relevance
outcomes for each engagement. The replication runs from one engagement to the next until the
client’s effort budget is exhausted. Each simulation consists of 1,000 replications and common
random number streams are used across simulations in order to control variation across trials.
The simulation model produces two outputs as performance measures of the client’s decision-
making policy: viability percent and average value gain. The viability percent is the percent of
simulation scenarios that resulted in the generation of value. Non-viable scenarios yield no gain
in value. The average value gain measures the average gain in value over all replications.
Other parameters of the simulation specify the volume of resource (e.g., number of web pages)
that is available from each provider. The scaling of these resources is such that a relevant
resource that is used by the client in an amount that is greater than or equal to the upper
threshold of the membership function will yield a maximum value gain of 1.
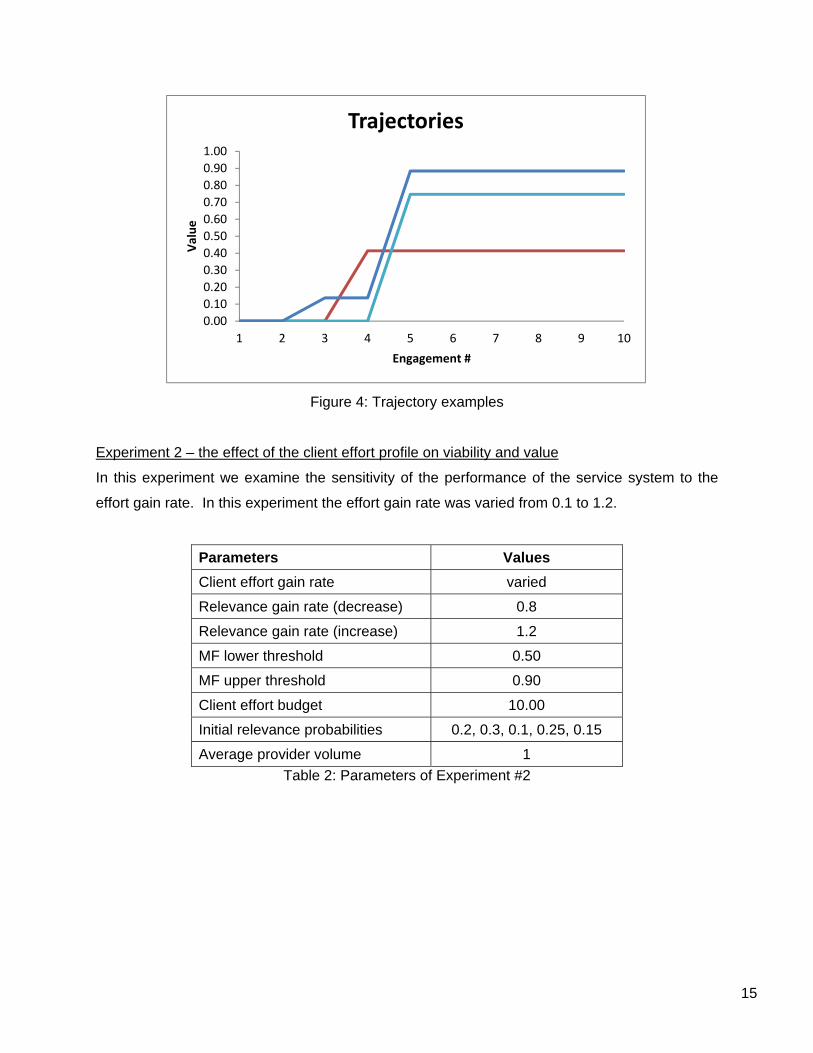
Experiment 1 - Trajectories
The data for the experiment are shown in Table 1. Figure 4 shows a few trajectories for this
case. In this experiment 61% of the scenarios yielded no gain in value. Figure 4 shows how
the client’s final attainment of value varies considerably depending on the scenario of outcomes
for provider relevance. The client’s policies for selecting a provider and for committing effort to
each engagement determine the trajectory for each scenario. If different trajectories achieve
the same value through different sequences of engagements, the system exhibits the
phenomenon of equifinality.
Parameters Values
Client effort gain rate 1.2
Relevance gain rate (decrease) 0
Relevance gain rate (increase) 2
MF lower threshold 0.50
MF upper threshold 0.90
Client effort budget 10.00
Initial relevance probabilities 0.2, 0.3, 0.1, 0.25, 0.15
Viability benchmark 0.68
Average provider volume 1
Table 1: Experiment #1 parameters
15
Figure 4: Trajectory examples
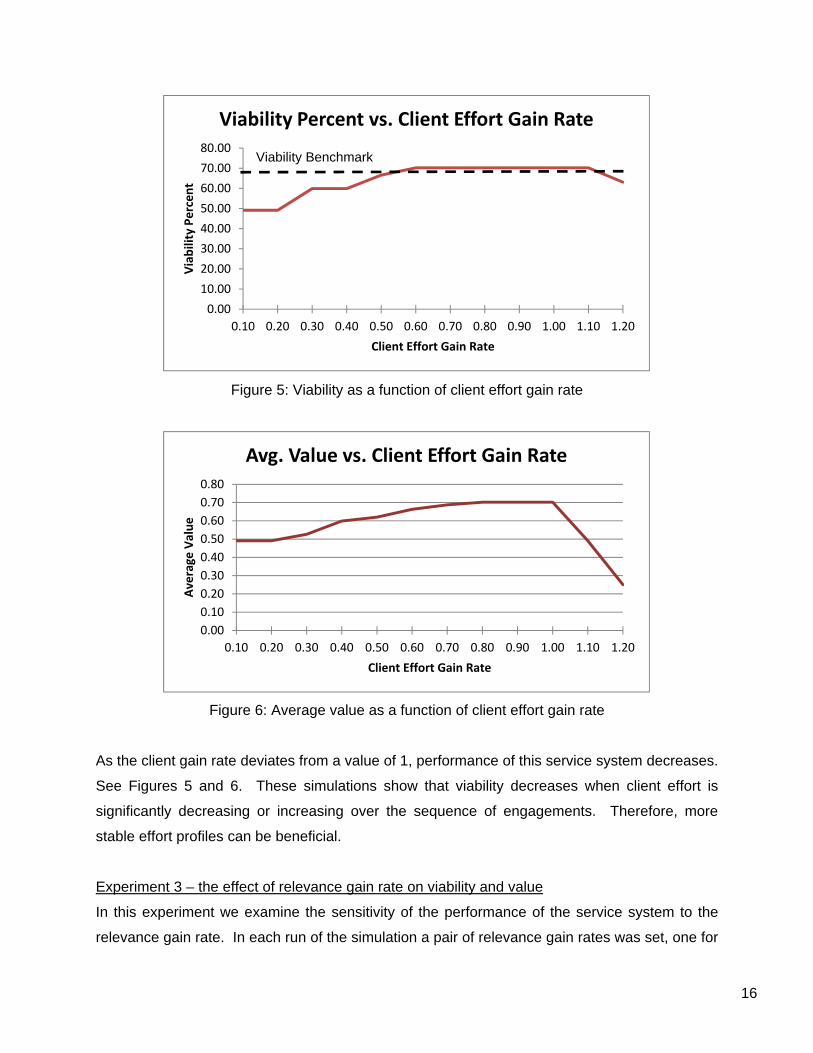
Experiment 2 – the effect of the client effort profile on viability and value
In this experiment we examine the sensitivity of the performance of the service system to the
effort gain rate. In this experiment the effort gain rate was varied from 0.1 to 1.2.
Parameters Values
Client effort gain rate varied
Relevance gain rate (decrease) 0.8
Relevance gain rate (increase) 1.2
MF lower threshold 0.50
MF upper threshold 0.90
Client effort budget 10.00
Initial relevance probabilities 0.2, 0.3, 0.1, 0.25, 0.15
Average provider volume 1
Table 2: Parameters of Experiment #2
0.00
0.10
0.20
0.30
0.40
0.50
0.60
0.70
0.80
0.90
1.00
1 2 3 4 5 6 7 8 9 10
Value
Engagement #
Trajectories
16
Figure 5: Viability as a function of client effort gain rate
Figure 6: Average value as a function of client effort gain rate
As the client gain rate deviates from a value of 1, performance of this service system decreases.
See Figures 5 and 6. These simulations show that viability decreases when client effort is
significantly decreasing or increasing over the sequence of engagements. Therefore, more
stable effort profiles can be beneficial.
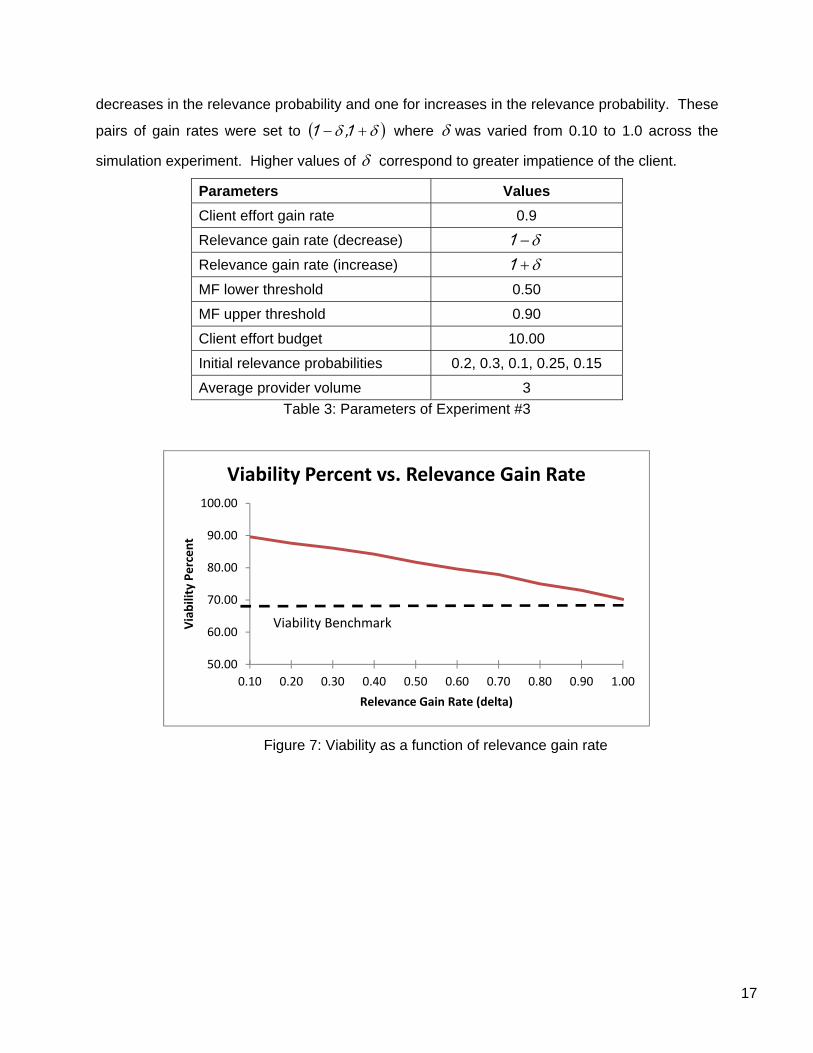
Experiment 3 – the effect of relevance gain rate on viability and value
In this experiment we examine the sensitivity of the performance of the service system to the
relevance gain rate. In each run of the simulation a pair of relevance gain rates was set, one for
0.00
10.00
20.00
30.00
40.00
50.00
60.00
70.00
80.00
0.10 0.20 0.30 0.40 0.50 0.60 0.70 0.80 0.90 1.00 1.10 1.20
Viability Percent
Client Effort Gain Rate
Viability Percent vs. Client Effort Gain Rate
Viability Benchmark
0.00
0.10
0.20
0.30
0.40
0.50
0.60
0.70
0.80
0.10 0.20 0.30 0.40 0.50 0.60 0.70 0.80 0.90 1.00 1.10 1.20
Average
Value
Client Effort Gain Rate
Avg. Value vs. Client Effort Gain Rate
17
decreases in the relevance probability and one for increases in the relevance probability. These
pairs of gain rates were set to 1,1 where was varied from 0.10 to 1.0 across the
simulation experiment. Higher values of correspond to greater impatience of the client.
Parameters Values
Client effort gain rate 0.9
Relevance gain rate (decrease) 1
Relevance gain rate (increase) 1
MF lower threshold 0.50
MF upper threshold 0.90
Client effort budget 10.00
Initial relevance probabilities 0.2, 0.3, 0.1, 0.25, 0.15
Average provider volume 3
Table 3: Parameters of Experiment #3
Figure 7: Viability as a function of relevance gain rate
50.00
60.00
70.00
80.00
90.00
100.00
0.10 0.20 0.30 0.40 0.50 0.60 0.70 0.80 0.90 1.00
Viability Percent
Relevance Gain Rate (delta)
Viability Percent vs. Relevance Gain Rate
Viability Benchmark

18
Figure 8: Average value as a function of relevance gain rate
These simulations show that viability and value achievement decreases with the amplitude of
revisions to the probability of provider relevance. See Figures 7 and 8. Evidently, dramatic
updating of the relevance probability can lead to wasteful experimentation and diminishes the
probability of remaining loyal to a relevant provider. Furthermore, in this example, attenuating
the relevance updating improves viability above the benchmark.
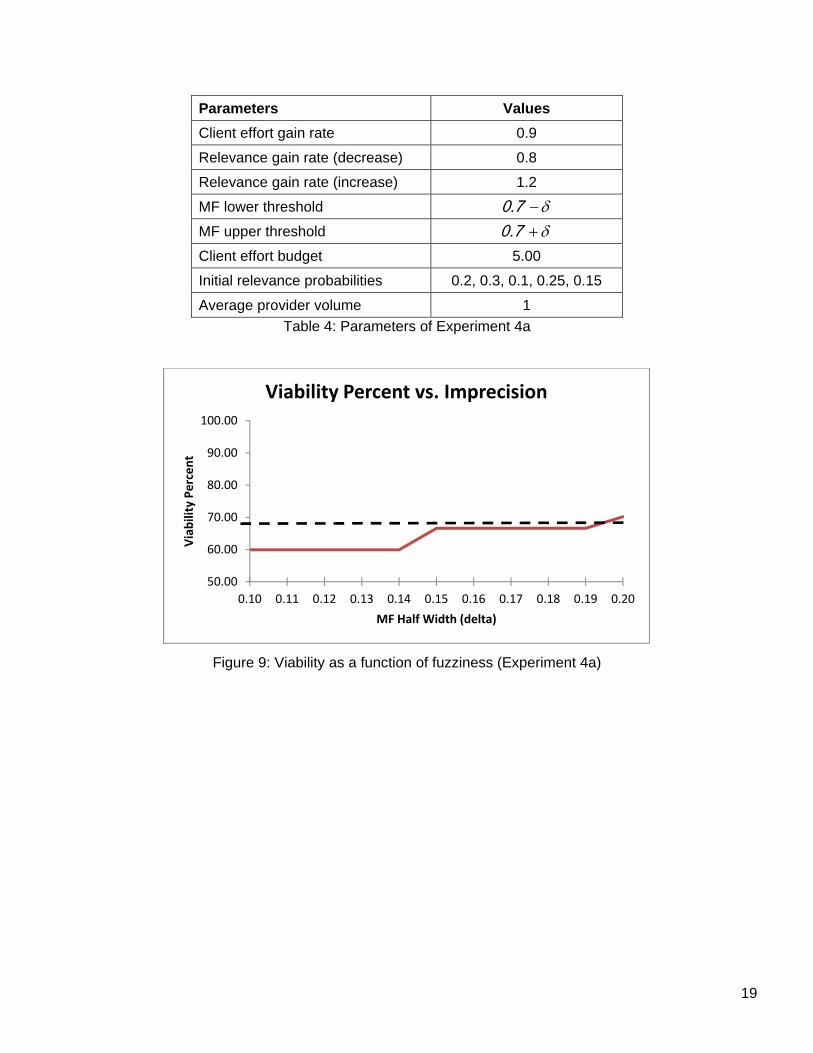
Experiment 4 – the effect of imprecision on viability and value
In this experiment we investigate the effect of a client’s fuzziness on the performance of the
service system. Fuzziness can be measured by the width of the half trapezoid of the resource-
value membership function illustrated in Figure 3. In the experiment, this parameter was varied
so that the median of the membership function is fixed at 0.70 and the half-width of the interval
from the lower threshold to the upper threshold varies from 0.1 to 0.3. The results of this
experiment, shown in Figures 9-12 are that viability increases with fuzziness when the client
effort budget is low, because a lower threshold of the membership function admits a gain in
perceived value for smaller values of the client effort. If the client effort is insufficient to achieve
this threshold, then no value can be attained.
0.50
0.60
0.70
0.80
0.90
1.00
0.10 0.20 0.30 0.40 0.50 0.60 0.70 0.80 0.90 1.00
Average
Value
Relevance Gain Rate (delta)
Avg. Value vs. Relevance Gain Rate
19
Parameters Values
Client effort gain rate 0.9
Relevance gain rate (decrease) 0.8
Relevance gain rate (increase) 1.2
MF lower threshold 7.0
MF upper threshold 7.0
Client effort budget 5.00
Initial relevance probabilities 0.2, 0.3, 0.1, 0.25, 0.15
Average provider volume 1
Table 4: Parameters of Experiment 4a
Figure 9: Viability as a function of fuzziness (Experiment 4a)
50.00
60.00
70.00
80.00
90.00
100.00
0.10 0.11 0.12 0.13 0.14 0.15 0.16 0.17 0.18 0.19 0.20
Viability Percent
MF Half Width (delta)
Viability Percent vs. Imprecision
20
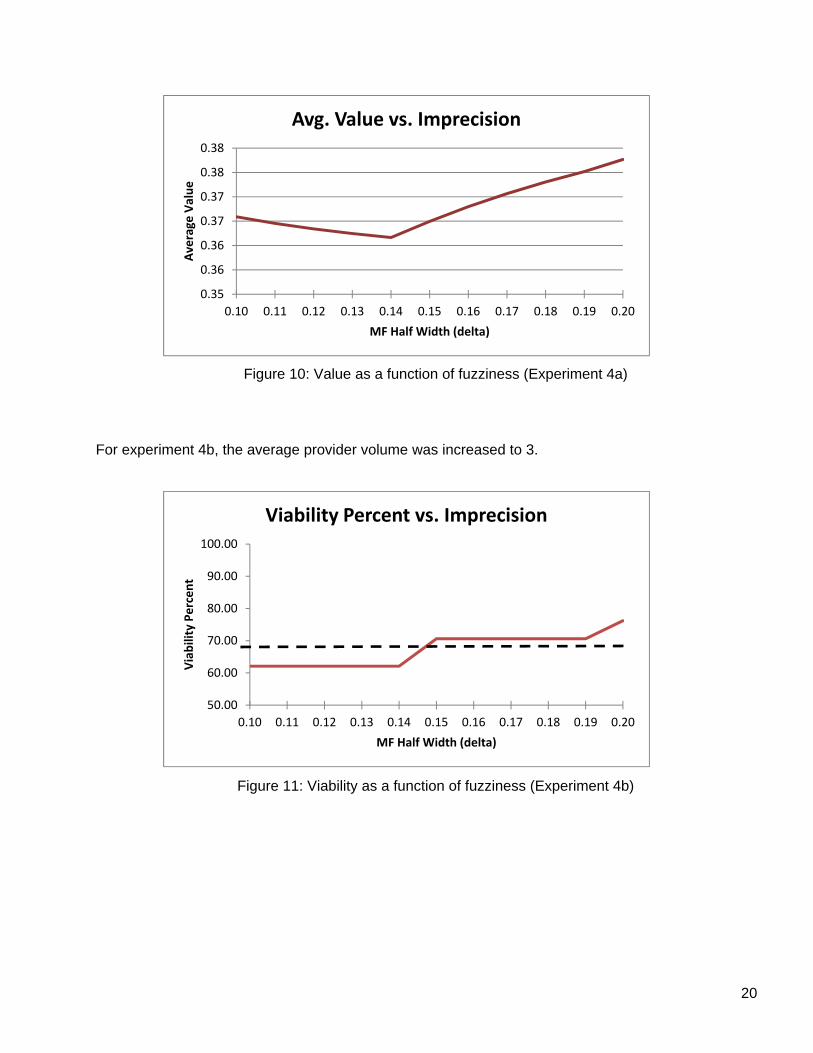
Figure 10: Value as a function of fuzziness (Experiment 4a)
For experiment 4b, the average provider volume was increased to 3.
Figure 11: Viability as a function of fuzziness (Experiment 4b)
0.35
0.36
0.36
0.37
0.37
0.38
0.38
0.10 0.11 0.12 0.13 0.14 0.15 0.16 0.17 0.18 0.19 0.20
Average
Value
MF Half Width (delta)
Avg. Value vs. Imprecision
50.00
60.00
70.00
80.00
90.00
100.00
0.10 0.11 0.12 0.13 0.14 0.15 0.16 0.17 0.18 0.19 0.20
Viability Percent
MF Half Width (delta)
Viability Percent vs. Imprecision
21
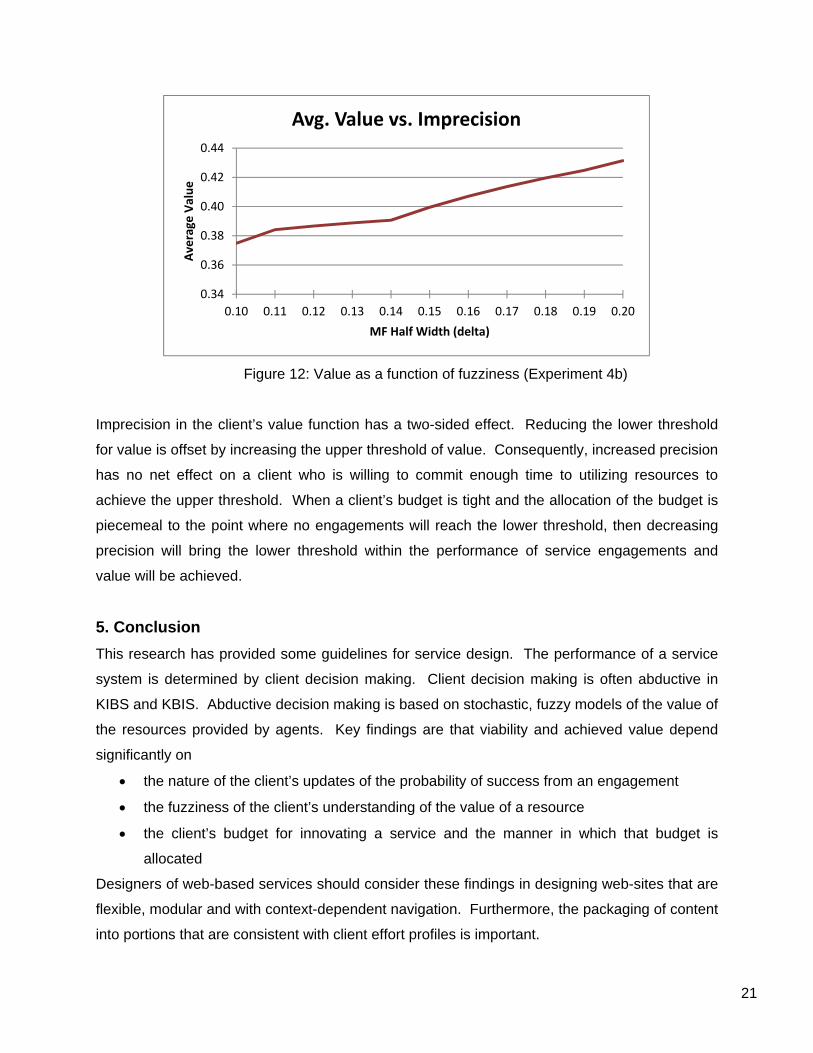
Figure 12: Value as a function of fuzziness (Experiment 4b)
Imprecision in the client’s value function has a two-sided effect. Reducing the lower threshold
for value is offset by increasing the upper threshold of value. Consequently, increased precision
has no net effect on a client who is willing to commit enough time to utilizing resources to
achieve the upper threshold. When a client’s budget is tight and the allocation of the budget is
piecemeal to the point where no engagements will reach the lower threshold, then decreasing
precision will bring the lower threshold within the performance of service engagements and
value will be achieved.
5. Conclusion
This research has provided some guidelines for service design. The performance of a service
system is determined by client decision making. Client decision making is often abductive in
KIBS and KBIS. Abductive decision making is based on stochastic, fuzzy models of the value of
the resources provided by agents. Key findings are that viability and achieved value depend
significantly on
the nature of the client’s updates of the probability of success from an engagement
the fuzziness of the client’s understanding of the value of a resource
the client’s budget for innovating a service and the manner in which that budget is
allocated
Designers of web-based services should consider these findings in designing web-sites that are
flexible, modular and with context-dependent navigation. Furthermore, the packaging of content
into portions that are consistent with client effort profiles is important.
0.34
0.36
0.38
0.40
0.42
0.44
0.10 0.11 0.12 0.13 0.14 0.15 0.16 0.17 0.18 0.19 0.20
Average
Value
MF Half Width (delta)
Avg. Value vs. Imprecision

22
Future research will extend the decision model on which this research is based. A
comprehensive set of simulation experiments is needed in order to examine the entire range of
system configurations. More complex and complicated decisions need to be modeled in order
to approach realistic service environments. Multi-dimensional outcomes and value need to be
incorporated in the decision model.
The study described herein treated resource providers as static entities, but future research will
model all agents in the service system as evolving subsystems. Adaptive interaction by the
agents that provide resources should be incorporated in the context of the client’s decisions as
such adaptation is possible in many service systems. Similarly, collaboration among provider
agents is a reality of service systems that is believed to enhance the probability of success and
should be incorporated in future versions of the model. Ultimately, models of many-to-many
marketing systems may be possible.

References
Badinelli, R., Barile, S., Ng., I., Polese, F., Saviano, M., Di Nauta, P (2012). “Viable Service
Systems and Decision Making in Service Management”, Journal of Service Management
, Vol. 23 Iss: 4, pp.498 - 526.
Badinelli, R. (2012). “Fuzzy modeling of service system engagements”, Service Science, 4(2)
135-146.
Badinelli, R. (2010). “A Stochastic Model of Resource Allocation for Service Systems”. Service
Science, 2(1/2) 68-83.
Barile, S. (2009). Management Sistemico Vitale. Torino, G. Giappichelli.
Barile, S. and Polese, F. (2010a), “Linking Viable Systems Approach and Many-to-Many
Network Approach to Service-Dominant Logic and Service Science”, International
Journal of Quality and Service Sciences, 2 (1), pp. 23-42.
Barile, S. and Polese, F. (2010b), “Smart Service Systems and Viable Service Systems”,
Service Science, Vol. 2 No.1, pp. 21-40.
Carroll, N., E. Whelan, I. Richardson (2010). “Applying social network analysis to discover
service innovation within agile service networks”, Service Science, 2(4), 225-244.
Charnes, A., Cooper, W., Lewin, A., Seiford, L. (1994). Data envelopment analysis – theory,
methodology and applications, Kluwer.
Ehret, M., J. Wirtz (2010). “Division of labor between firms: Business services, non-ownership
value and the rise of the service economy”, Service Science, 2(3), 136-145.
Fare, R., Grosskopf, S. (2000). “Network DEA”, Socio-economic Planning Sciences 34, 35-49.
Golany, B., Hackman, S., Passy, U. (2006). “An efficiency measurement framework for
multistage production systems”, Annals of Operations Research, 145, 51-68.
Golinelli, G. M. (2010). Viable Systems Approach (VSA) Governing Business Dynamics. Milan,
Wolters Kluwer Italia Srl.
Hsu, C. (2011). “Hyper-networking of customers, providers, and resources drives new service
business designs: e-commerce and beyond”, Service Science, 3(4), 325-337.
Hsu, C. (2009). Service Science, design for scaling and transformation. Singapore, World
Scientific.
Lance, A. B., L. O. Amy, et al. (2002). "Client co-production in knowledge-intensive business
services." California Management Review 44(4): 100.
Lusch, R F., S. Vargo, M. Tanniru (2010). “Service, value networks and learning”, Journal of the
Academy of Marketing Science, 38, 19 – 31.
Ng, I CL (2013). Value & Worth: Creating New Markets in the Digital Economy, Innovorsa
Press.
Ng I, Badinelli R, Dinauta P, Halliday S, Lobler H, Polese F(2012). 'S-D Logic: Research
Directions and Opportunities: The perspective of Systems, Complexity and Engineering'
Marketing Theory (1470-5931).
Ng, I., L. Smith (2012). “An integrative framework of value”, Review of Marketing Research vol
9, 207-243..
Ostrom, A. L.(2010). “Moving forward and making a difference: Research priorities for the
science of service”.Journal of Service Research. 2010.
Ross, T.J., J.M. Booker, W. J. Parkinson (2002). Fuzzy logic and probability applications, ASA
SIAM.
Tsoulakis, L. H., R. E. Uhrig (1997). Fuzzy and neural approaches in engineering, Wiley.
Vargo, S. L. and M. A. Akaka (2009). "Service-Dominant Logic as a foundation for service
science: Clarifications." Service Science 1(1): 32-41.