Trait Emotional Intelligence
54
Trait Emotional Intelligence -TEIQue, p. 1 Journal of Personality Assessment (in press). Accepted September 11, 2006; text = 77832 = 11.8 pp; 9 Tables = 4.5; TOTAL = 17 pages; pv = 89.2-#3 Running head: TRAIT EMOTIONAL INTELLIGENCE - TEIQue Psychometric Properties of the Trait Emotional Intelligence Questionnaire (TEIQue, Petrides & Furnham, 2003): Factor Structure, Reliability, Construct, and Incremental Validity in a French-Speaking Population. Moïra Mikolajczak Université catholique de Louvain, Belgium Belgian National Fund for Scientific Research Olivier Luminet Université catholique de Louvain, Belgium Belgian National Fund for Scientific Research Cecile Leroy Université catholique de Louvain, Belgium Emmanuel Roy Université catholique de Louvain, Belgium Correspondence concerning this article should be addressed to: Moïra Mikolajczak, University of Louvain, Department of Psychology, Research Unit for Emotion Cognition and Health. Place Cardinal Mercier 10, B-1348 Louvain-la-Neuve, Belgium. e-mail to [email protected]
Transcript of Trait Emotional Intelligence

Trait Emotional Intelligence -TEIQue, p. 1
Journal of Personality Assessment (in press). Accepted September 11, 2006; text = 77832 =
11.8 pp; 9 Tables = 4.5; TOTAL = 17 pages; pv = 89.2-#3
Running head: TRAIT EMOTIONAL INTELLIGENCE - TEIQue
Psychometric Properties of the Trait Emotional Intelligence Questionnaire (TEIQue, Petrides
& Furnham, 2003): Factor Structure, Reliability, Construct, and Incremental Validity in a
French-Speaking Population.
Moïra Mikolajczak
Université catholique de Louvain, Belgium
Belgian National Fund for Scientific Research
Olivier Luminet
Université catholique de Louvain, Belgium
Belgian National Fund for Scientific Research
Cecile Leroy
Université catholique de Louvain, Belgium
Emmanuel Roy
Université catholique de Louvain, Belgium
Correspondence concerning this article should be addressed to: Moïra Mikolajczak,
University of Louvain, Department of Psychology, Research Unit for Emotion Cognition and
Health. Place Cardinal Mercier 10, B-1348 Louvain-la-Neuve, Belgium.
e-mail to [email protected]

Trait Emotional Intelligence -TEIQue, p. 2
Abstract
The present research investigated the psychometrical properties of the Trait Emotional
Intelligence Questionnaire (TEIQue, Petrides & Furnham, 2003) in a French-speaking
population. In summary, we found that (1) TEIQue scores were globally normally distributed
and reliable; (2) the UK four-factor structure (well-being, self-control, emotionality,
sociability) replicated in our data; (3) TEIQue scores were dependent on gender but relatively
independent of age; (4) there was preliminary evidence of convergent/discriminant validity,
with TEIQue scores being independent of non-verbal reasoning (Raven's Matrices) but
positively related to some personality dimensions (optimism, agreeableness, openness,
conscientiousness), as well as inversely related to others (alexithymia, neuroticism); (5) there
was also preliminary evidence of criterion validity, with TEIQue scores predicting depression,
anxiety and social support as well as future state affectivity, and emotional reactivity in
neutral and stressful situations (6) TEIQue scores were susceptible to socially desirable
responding, however (7) TEIQue scores had incremental validity to predict emotional
reactivity over and above social desirability, alexithymia, and the five-factor model of
personality. Such results constitute encouraging preliminary findings in favour of the use of
the TEIQue.

Trait Emotional Intelligence -TEIQue, p. 3
Few psychological constructs have grabbed more scientific and popular attention than
the construct of emotional intelligence [EI]. Briefly, it aims to provide a scientific framework
for the idea that individuals differ in the extent to which they attend to, process, and utilize
affect-laden information of an intra-personal (e.g., managing one’s own emotions) or
interpersonal (e.g., managing others' emotions) nature (Petrides & Furnham, 2003). Research
on the EI construct has grown immensely over the past decade and two conceptions of
emotional intelligence currently co-exist: ability EI and trait EI. Both conceptions are based
on the long-standing idea that cognitive abilities are not the unique predictor of successful
adaptation and that emotional competencies or dispositions need to be considered. However,
the two perspectives differ markedly with respect to their conceptualisation of such emotional
competencies/dispositions and their measurement. The ability perspective conceives EI as a
form of intelligence, best assessed via performance tests (Salovey & Mayer, 1990). In
contrast, the trait perspective envisages it as a set of emotion-related dispositions, best
assessed through self-reports (Petrides & Furnham, 2000). Whereas performance-based
measures capture maximal performance, self-report measures capture typical performance
(Cronbach, 1949).
This paper focuses on the latter perspective and presents the psychometrical properties
of the French translation of the Trait Emotional Intelligence Questionnaire (TEIQue). The
TEIQue provides an operationalization for Petrides (2001)'s model which conceptualizes EI in
terms of personality. Basically, this model, whose initial sampling domain had been identified
through a content analysis of early EI and related models, aims at organizing in a single
framework all affect-related aspects of personality. The construct seems to encompass
variance of two kinds: one portion that is scattered across the higher-order dimensions of
established personality taxonomies (e.g., Big Five, Giant Three) and one portion of variance
that lies outside these dimensions. Two recent studies (Petrides, 2004; Petrides, Pita and

Trait Emotional Intelligence -TEIQue, p. 4
Kokkinaki, revision under review) appear to support this conceptualization. Joint factor
analyses (i.e., TEIQue/Big Five, TEIQue/Giant Three) conducted separately on British,
Spanish, New-Zealand, and Greek samples consistently showed that trait EI formed a unique
and composite construct that lies at lower levels of personality hierarchies. Namely, it could
be isolated in both personality factor spaces (i.e., Big Five, Giant Three), it was partially
determined by a cluster of traits across the existing personality taxonomies, and the trait EI
factor was oblique rather than orthogonal to the Big Five and Giant Three. The benefit of
gathering all affect-related personality traits under the same umbrella is twofold.
Theoretically, it offers an advantage in terms of explanatory power. As pointed out by
Petrides et al. (revision under review), "there are many constructs whose variance can be
accounted for by some combination of the Giant three or the Big Five. Attempting to recast
these constructs as blends of higher-order traits, however, fails to capture their essence and is
not conductive to the development of personality theory (Funder, 2001)". For instance,
variance that can be straightforwardly explained by the trait EI framework, such as the
propensity to decode other's emotions (high scores process facial expressions quicker than
low scores and are able to decode emotions at a lower threshold of intensity; Austin, 2004,
2005; van Kan, Mikolajczak, & Luminet, unpublished data), requires a complex function of
Big-Five factors to be predicted (e.g., low E, high N, low O and low A). Moreover, such
combinations make things far less easily intelligible as their interpretation often involves to
merge effects from four or five personality dimensions. Practically, it offers an advantage in
terms of predictive/incremental validity in that trait EI predicts a number of affect-related
outcomes over and above the established personality taxonomies (e.g., perseverance in
musical training as well as performance of ballet students: Petrides, Niven & Mouskounti, in
press; deviant behaviours at school: Petrides, Frederickson, & Furnham, 2004; sensitivity to

Trait Emotional Intelligence -TEIQue, p. 5
stress induction: Mikolajczak, Petrides, Luminet, & Coumans, under review; coaching
aptitudes of top-managers: van der Zee & Wabeke, 2004).
Currently, the applications of the trait EI measures concern mostly the clinical/health,
educational and organizational domains. Regarding health, evidence is accumulating that trait
EI is associated, for instance, with better mental/physical resistance to stress (e.g., Salovey,
Stroud, Woolery, & Epel, 2002, using the Trait Meta-Mood Scale). With respect to education,
research suggests that trait EI is particularly relevant to both disadvantaged and gifted
students. Regarding low IQ pupils, those with higher trait EI scores perform better at school
and exhibit lesser deviant behaviours (unauthorized absences, exclusions due to antisocial
behaviours) than their lower trait EI peers (Petrides et al. 2004). Regarding gifted pupils,
those with higher trait EI use more functional strategies to cope with their "difference"
compared to their lower trait EI counterparts (Chan, 2003). Finally, much has been said about
the purported role of EI in organisational settings but few empirical studies have actually been
carried out. However, research still suggests that trait EI is involved in job performance (see
Van Rooy & Viswesvaran, 2004 for a meta-analysis), though not in the proportions that have
been asserted in some popular publications. The variance of the correlations nevertheless
suggests the presence of moderators. It is likely that trait EI is especially relevant to the
professions having an affective component, such as service workers who have to perform
emotional labour (e.g., Mikolajczak, Menil & Luminet, under review) and managers (e.g.,
Slaski & Cartwright, 2002). In all three domains, trait EI enables a better understanding and
prediction of a number of phenomena. It is, however, open to question whether it is possible
to improve trait EI and, should it be the case, whether its correlates would be thereby also
modified.
The operationalization of the construct through a self-reported measure is consistent
with (1) the subjective nature of emotional experience and (2) the conception of EI as a set of

Trait Emotional Intelligence -TEIQue, p. 6
dispositions, that is, preferences and typical - rather than maximal - performance. The TEIQue
consists of 153 items rated on a 7-point scale, and encompasses 15 subscales organized under
4 factors: well-being, self-control, emotionality and sociability. A detailed description of the
factors and subscales is provided in appendix A. The psychometric development of the
instrument is described in Petrides (2001) and a full technical manual is currently in
preparation. The studies presented in this paper were conducted using a French translation of
the TEIQue. In line with the ICT guidelines for test adaptation (Hambleton, 2001), items were
translated into French and then back-translated into English. Both translators were fully
bilingual, having French as a mother tongue but having lived several years in England and
being currently employed in American organizations. Items with problematic back-
translations were thoroughly discussed and appropriately amended. Most discrepancies were
minor, involving the choice between two synonyms. Eighteen months later, our translation
was reviewed by a French colleague from France. She proposed to rephrase 8 items in order
to remove Belgian-French expressions. These modifications were implemented as they did
not change the meaning or readability of the items for Belgians.
Overview
First and foremost, we will look at the distributional properties, the internal
consistency and factor structure of the TEIQue. Next, we will examine the relationship
between the TEIQue and demographic variables. Afterwards, we will focus on the TEIQue
discriminant and convergent validity vis-à-vis non-verbal reasoning (i.e., an indicator of
cognitive ability), alexithymia, optimism, and the five-factor model of personality. The
liability of TEIQue responses to social desirability will also be examined. Subsequently, we
will assess the criterion validity of the TEIQue regarding psychological distress, social
support, state affectivity, and emotional responses to stressful situations. Finally, the

Trait Emotional Intelligence -TEIQue, p. 7
incremental validity of the TEIQue over and above social desirability, alexithymia and the big
five factors of personality will be investigated.
Method
Participants and Procedure
The present data come from eight different samples. The data collection took place
from September 2003 until May 2005. Altogether, 740 participants (mean age: 25.5, SD:
11.31) completed the TEIQue along with one or several other measures (during the same or
separate sessions). There was 512 females, 217 males, and 11 unreported. 484 were students
recruited on the campus (rewarded by lottery tickets or course credit) and 256 were lay people
(snowball sample). Among the latter, 1 had no degree at all, 7 had a secondary school degree,
23 a college degree, 84 a bachelor degree, and 141 a master degree (or Ph.D.). The students
completed the questionnaire on a paper and pencil form, whereas the lay people completed it
online. Responses were anonymous because participants identified themselves with codes. As
the results presented below involve either one or several samples (depending on the
relationships under investigation) only the total sample size, mean age, and gender repartition
will be given for each of the variables investigated (see Table 2).
One part of the paper (i.e., examination of emotional reactivity under neutral and
stressful conditions) involved an experimental design that we describe hereafter. All
participants were tested individually by a male experimenter. Upon arrival at the laboratory,
they were invited to complete the TEIQue and subsequently underwent a short relaxation
procedure (1 min; based on Schultz, 1965). Subsequently, participants were randomly
allocated either to a stress condition or to a neutral condition. The stress condition was based
on a failure experience (Krohne, Pieper, Knoll, & Breimer, 2002) which had been approved
by the Faculty Ethical Committee before the launch of the study. Participants were told they
would be tested on a recently developed test designed to predict occupational success. They

Trait Emotional Intelligence -TEIQue, p. 8
were informed that, as university students, they were expected to have a 75% success rate.
They were subsequently presented with the 12 most difficult items from the Raven Advanced
Progressive Matrices (Raven, 1976). The neutral condition involved reading a magazine
article on the measurement of intelligence. Immediately after the mood induction (i.e., neutral
versus stress), participants completed the Emotional Reactivity Index (see below).
Measures
The means, standard deviations and internal consistencies of the measures are presented in
Table 1 (TEIQue's subscales and factors) and Table 2 (all other measures).
Trait EI was appraised through the TEIQue described in the introduction.
Professional sector was measured via a single "multiple choice" item. Participants were
invited to indicate which of the following twelve occupational categories they belonged to:
social/healthcare, communication/medias, commerce, public service/administration, finance,
transportation/tourism, telecommunications, agriculture/environment, justice, art, research and
development, or currently unemployed.
Optimism, which is defined as a generalized tendency to believe that one will
generally experience good instead of bad outcomes in life, was appraised through the Life
Orientation Test –Revised (LOT-R; Scheier & Carver, 1985; French translation: Régner,
2002). It contains 6 items and 4 fillers, rated along a 5-point scale.
Alexithymia was assessed using the Toronto Alexithymia Scale (TAS-20; Bagby,
Parker, & Taylor, 1994; French adaptation: Loas et al., 1996). This questionnaire consists of
20 items (rated on a 5-point scale) targeting the core dimensions of the construct: difficulty in
identifying feelings, difficulty in describing feelings and externally oriented thinking.
Non verbal reasoning was evaluated by means of the well-known Raven’s Advanced
Progressive Matrices Test (Raven, 1976), which is one of the most robust predictors of the
general cognitive ability score (supra-ordinate factor “g”; Spearman, 1927). This test consists

Trait Emotional Intelligence -TEIQue, p. 9
of 36 problem-series and is independent from language and formal schooling. Each problem
consists of 9 figures (arranged as a square) with a missing piece. Below the problem are eight
alternative pieces to complete the figure, only one of which is correct. Each set involves a
different principle for obtaining the missing piece and problems are roughly arranged in
increasing order of difficulty. The Advanced form of the test (originally designed for people
having a university degree) spreads the scores of the top 20 percent of the population and was
used here to increase the variance of the scores.
The five-factor model of personality was appraised through the "Description in Five
Dimensions" system (D5D, Rolland & Mogenet, 2001) which is a widely used French
personality inventory based on the Five Factor Model (FFM; Costa & McCrae, 1992). This
questionnaire assesses the big five dimensions of emotional stability, introversion, openness,
conscientiousness, and agreeableness through 55 adjectives (e.g., nervous, reserved,
cultivated, compassionate, tidy) rated along a 6-point scale (-3 = does not describe me at all,
+3 = describes me perfectly).
Social desirability, which refers to a tendency to present oneself in an overly positive
manner, was evaluated using the Marlowe-Crowne Social Desirability Scale (1960; french
translation: Blais & Lachance, 1992). It consists of 30 items rated on a dichotomous scale
(true / false). Examples of items are “I am always courteous, even to people who are
disagreeable”, “When I don’t know something, I don’t mind at all admitting it”.
Trait anxiety was measured through the Trait Anxiety Inventory (STAI-T; Spielberger,
Gorsuch, Lushene, Vagg, & Jacobs, 1983; French adaptation by Bruchon-Schweitzer &
Paulahan, 1990). This questionnaire consists in 20 items rated along 4-point scales.
Depression was evaluated via the Beck Depression Inventory (BDI; Beck, Ward,
Mendelson, Mock, & Erbaugh, 1961; French adaptation by Collet & Cottraux, 1986). The
short version, which was used in the present study, encompasses 13 items consisting in four

Trait Emotional Intelligence -TEIQue, p. 10
statements each. Respondents are instructed to circle the one statement in each group that best
describes how they felt the last week.
Positive and negative state affectivity were assessed through the Positive and Negative
Affect Schedule (PANAS; Watson, Clark, & Tellegen, 1988; French translation: Gaudreau,
2000). The PANAS is currently the most widely used measure of affectivity. It consists of 20
adjectives rated along 5-point scales, of which 10 measure positive affectivity (PA; e.g.,
inspired) and 10 measure negative affectivity (NA; e.g., guilty). It should be noted that the
focus here was on state (current) rather than trait (general) affectivity.
Perceived social support was evaluated via the short form of the Social Support
Questionnaire (SSQ; Sarason, Levine, Basham, & Sarason, 1983; French translation: Rascle
et al., 1997). Respondents are first asked to list up to 9 potential support providers for each of
12 hypothetical situations (e.g., “On who can you really count to console you when you are
very upset?”). Then, they rate their overall satisfaction with support for each situation (rather
than for each provider). The SSQ provides 2 scores: perceived quantity of social support and
perceived quality of social support.
Emotional reactivity was estimated by means of the “Emotional Reactivity Index”
(ERI; created for the purpose of the present study. The full questionnaire may be requested to
the first author). The ERI is based on Frijda (1986)’s theory of emotions. According to this
author, an emotion is a three-component system. Any emotional episode begins by an
evaluation of the situation as either relevant or irrelevant regarding a number of goals, each of
them being evaluated in terms of importance for the self (self-integrity and self-
accomplishment). The more relevant the situation is with regards to one’s goals, the more
intense the emotion will be. Then, the emotional episode leads to action readiness: actions in
progress are interrupted and the individual prepares himself to respond to the situation (e.g.,
fight or flight in negative situations, to sing, to jump for joy in positive situations). Although

Trait Emotional Intelligence -TEIQue, p. 11
social constraints do not always allow to concretely realize these actions, individuals still
experience them as action tendencies (i.e., desire to flee or to jump). Finally, emotional
episodes are accompanied by a number of behavioural or expressive manifestations (e.g.,
tensed face, shaking hands) and bodily changes (e.g., sweat, palpitations, …). The Emotional
Reactivity Index measures the three facets of emotional experience: emotional intensity,
bodily sensations and action tendencies. Emotional intensity was measured through 4 items
adapted from Sonnemans and Frijda (1994). These items respectively referred to the
emotion’s duration, emotional intensity at the peak, emotional intensity out of the peak, and
global intensity of the emotional experience. The emotion’s duration item was rated along a 5-
point scale from “1 to 5 minutes” to “20 to 25 minutes”; the other items were rated along a 5-
point scale from “very weak” to “very strong”. Bodily sensations were assessed via the
Wallbot & Scherer’s Bodily Sensations Checkilst (1986). This questionnaire consist of 13
bodily sensations (e.g., to have a lump in one’s throat, difficulty to breathe, palpitations) rated
along a 7-point scale (“not at all” to “the strongest you can imagine”). Finally, action
tendencies were evaluated using Frijda, Kuipers & ter Schure’s questionnaire (1989).
Respondents were required to rate the intensity to which they wished to accomplish 11 actions
(e.g., to swear, to disappear, to cry) on a 7-point scale.
Although the questionnaire was originally intended to be three-factorial, principal
axis-factoring revealed that it was unifactorial (all items loaded on the same factor).
Reliability analyses as well as correlations among the facets (rs > than .75, ps < .001) fully
supported this view: though facets’ reliabilities were acceptable (α EI = .79, α BS = .91, α AT =
.78), internal consistency for the global scale was higher (α = .90), thereby supporting the
validity of the construct as a whole. A total score of emotional reactivity was thus computed
by summing the individual scores obtained to each of the three indicators. As findings were
essentially the same across facets, results are presented for the global ERI score only.
Trait Emotional Intelligence -TEIQue, p. 12
Results
Distributional Properties
Minima, maxima, means, standard deviations, skewness and kurtosis of the 15
subscales, 4 factors and global trait EI score are given in Table 1, for males and females
respectively. Kolmogorov-Smirnov test revealed that normality was achieved for the global
score [KS(740) = respectively 0.036 and 0.033, ps ≥ 0.05 for males and females], self-control
[KS(740) = respectively 0.056 and 0.034, ps ≥ 0.05], emotionality [KS(740) = respectively
0.032 and 0.030, ps ≥ 0.05] and sociability [KS(740) = respectively 0.036 and 0.033, ps ≥
0.05]. Only the factor well-being was significantly negatively skewed [KS(740) = respectively
0.091 and 0.062, ps ≥ 0.05]. It is noteworthy that the non-normal distribution of the factor
well-being constitutes an element of construct validity rather than a weakness. Indeed,
research has shown that people are characteristically rather happy than neutral. Only in the
very poor countries does the number of unhappy citizens equal the number of happy ones (for
a review of the overwhelming dominance of happiness, see Veenhoven, 1984).
Internal Consistency
Cronbach’s alphas of the TEIQue subscales and factors are given in Table 1. Among
the 15 subscales, 10 have acceptable to excellent reliability (varying between .71 and .91)
among both males and females. Two subscales, namely self-motivation and empathy, have
acceptable reliability among males but lower reliability among females. Finally, three
subscales have Cronbach alpha’s below .70 for both males and females: impulsiveness,
relationship skills and adaptability. Internal consistencies at the factor level are excellent, for
both males and females, and so is the case for the global score.
Factor Structure of the TEIQue in the Belgian Data Set
The 15 TEIQue scales were subjected to a principal axis factor analysis. The Scree
plot and Kaiser eigenvalue extraction criteria suggested the presence of between two and five
Trait Emotional Intelligence -TEIQue, p. 13
factors (the first six eigenvalues were respectively: 5.261, 1.735, 1.378, 1.217, 1.025, 0.812).
We applied Parallel Analysis1 (PA) to our data set, a method which is currently considered the
most reliable procedure to determine the correct number of factors (see Zwick & Velicer,
1986 for a comparison of factor retention decision methods, and Hayton, Allen and
Scarpellowick, 2004 for methodological issues in PA). The eigenvalues and standard
deviations generated from completely random data (and necessary to perform PA) were
obtained through the "Marley Watkins Monte Carlo PCA for Parallel Analysis" program
(Watkins, 2002a) using the following parameters: 15 variables, 740 participants, 1000
replications. We then compared our observed eigenvalues to the 95th percentile of the
eigenvalues generated from these random data, in order to reject factors that are most
certainly artificial (at p ≤ .05). Results supported our theoretical expectations in that 4 factors
were retained. We thus rotated a four-factor solution via the PROMAX algorithm (kappa = 4).
The factor pattern matrix and factor intercorrelations are presented in Tables 3-5. Despite
some cross-loadings, the four factors were substantively identical to the original British
structure (Petrides, 2001, at the origin of the scoring key) and were thus labelled accordingly:
“well-being,” “sociability,” “self-control,” and “emotionality”. This solution accounted for
63.95% of the total variance and the strength of the intercorrelations was fully in line with the
conceptualization as a multifactorial construct (Table 4).
Comparison of the Factor Structure in the Belgian and English Data Sets
The Belgian and British factor structures were then compared at three levels: (1)
congruence between Belgian factors scores independently derived from Belgian and British
factor scores coefficients, (2) congruence ― in the Belgian data set ― between Belgian and
British factor pattern matrices and (3) congruence between factors scores derived theoretically
(i.e., from the British scoring key) and factors scores derived from Belgian factor scores
coefficients. The first two comparisons were made possible thanks to the contribution of the

Trait Emotional Intelligence -TEIQue, p. 14
author of the TEIQue (Dr. K. V. Petrides) who granted us access to the complete UK data set.
His sample consisted of 1139 participants (mean age: 31.59, SD: 11.36) of which 49% were
male and 51% female.
We first generated and correlated, in our own data set, the factor scores derived from
the Belgian factor score coefficients with the factor scores derived from the English factor
score coefficients (the latter being independently obtained on the British data set). The
Pearson correlations between the factors were .997 for well-being, .995 for sociability, .987
for self-control and .984 for emotionality (the whole matrix of correlations between these two
sets of factors is presented in table 4). Next, we computed coefficients of congruence2
between Belgian and English factor Pattern Matrices (using Marley Watkins' Coefficient of
Congruence Program, 2002b). Results indicated that congruence coefficients were .98 for
well-being, .99 for sociability, .96 for self-control and .97 for emotionality. Then, as it is still
possible that the factor structure in Belgian and English data sets are highly similar, though
different from the theoretical factor structure (on which the scoring key is based), we also
decided to correlate the factor scores obtained according to the UK scoring key (see
Appendix) with the factor scores based on the factor score coefficients derived from the factor
analysis of the Belgian data set. Such analysis was imperative as there were small
discrepancies between our factor structure (see Table 3) and the British theoretical structure
(see Appendix). Thus Self-motivation — which theoretically does not load on any factor —
loaded on the factor Well-being; self-esteem (factor well-being) cross-loaded on the factor
sociability; adaptability — which theoretically does not load on any factor — loaded on the
factor “self-control”; and impulsivity (low) cross-loaded on the factor emotionality. The
foregoing correlations permit to evaluate the implications of these changes as well as the
suitability of the UK factor scoring key (see Appendix) for the data at hand. The Pearson
correlations were .97 for well-being, .97 for sociability, .95 for self-control, and .94 for

Trait Emotional Intelligence -TEIQue, p. 15
emotionality (see Table 5). These values suggest a high level of compatibility between the UK
scoring key and Belgian factor solutions and demonstrate that, at least in this case, there is
little to be gained by a purely data-driven scoring of the TEIQue-LF factors (i.e., scoring as a
function of the factor structure emerging from this particular data set).
Relationship with demographic variables
Trait EI and age. Both linear and curvilinear associations were tested, as a curvilinear
relationship between age and the scores on the Bar-On EQi (with a peak around forty) has
sometimes been observed (e.g., Bar-On, 1997). Because there was no evidence of a
curvilinear relationship in our data, linear correlation coefficients are reported. Trait EI as a
whole is weakly correlated with age (r = .19, p ≤ .005). At the factor level, correlations with
age are quasi null regarding well-being (r = .07, p ≤ .10) or sociability (r = .06, p ≤ .05) and
weak regarding emotionality (r = .13, p ≤ .05). The only factor meaningfully correlated to age
was self-control (r = .27, p ≤ .005).
Trait EI and gender. With the exception of the factor well-being, findings revealed
significant gender differences (see Table 1). Females scored significantly higher on
emotionality whereas men scored significantly higher on self-control and sociability. As a
result, men were found to score higher on global trait EI than women.
Trait EI and occupational sector. Only the lay people (not the students) were asked to
report their occupation. The number of individuals belonging to each sector is reported in
Table 2. As some sectors were not chosen by enough individuals to permit valuable analyses,
only the sectors selected by more than 20 individuals were retained and compared (i.e.,
social/healthcare, communication/medias, commerce, public service, finance, research and
development, and unemployed people). Results are in Table 6.
Individuals belonging to social/healthcare as well as finance-related occupations had
the highest mean global trait EI score whereas, as expected, unemployed individuals had the

Trait Emotional Intelligence -TEIQue, p. 16
lowest mean scores. The former differed significantly from the latter. Individuals in other
occupations had mean trait EI scores situated between these extremes, but did not statistically
differ from either social/healthcare and finance occupations or unemployed.
As far as the factors are concerned, financiers exhibited the highest well-being scores
while unemployed people exhibited the lowest scores. The former differed marginally from
the latter. Other occupations' means were in between and did not differ statistically from
either financiers or unemployed.
Regarding the factor self-control, individuals in social/healthcare as well as in finance-
related occupations had the highest scores whereas individuals in commerce-related
occupations and those who were unemployed had the lowest scores. The mean in
social/healthcare occupations differed marginally from the mean in unemployed people and in
commercial occupations. Other occupations' means were between the highest and lowest
groups and did not differ statistically from any of them.
Concerning emotionality, individuals in social/healthcare as well as in commercial
occupations exhibited the highest scores whereas those in public service and financial
occupations exhibited the lowest scores. The mean in social/health occupations (but not in
commercial ones) differed significantly from the mean in financial occupations and
marginally from the mean in public service. Other occupations' means were in between and
did not differ statistically from either social/health, commercial or financial occupations.
With respect to sociability, commercial occupations had, as expected, the highest
scores while unemployed people had the lowest scores; the mean in these occupations were
found to differ significantly from each other. It is noteworthy that the mean scores in
commercial occupations were significantly higher than the mean scores in all other
occupations (which did not differ significantly from each other).
Discriminant validity3 with Cognitive Ability (IQ)

Trait Emotional Intelligence -TEIQue, p. 17
Neither global trait EI nor any of its factors was related to non-verbal reasoning (Table
7).
Convergent Validity4
Means, standard deviations and reliability coefficients (Cronbach’s alpha) of variables
under examination are reported in Table 2.
Trait EI and optimism. Trait EI was highly associated with optimism (see Table 7).
However, as expected, this association seemed mostly attributable to the factor well-being
which conceptually overlaps with the construct of optimism.
Trait EI and alexithymia. As shown in Table 7, Alexithymia and trait EI were found
significantly associated. At the factor level, the trait EI factor that is the most highly
associated with alexithymia is emotionality. Such overlap was expected as the trait EI factor
emotionality conceptually overlaps with the Alexithymia construct.
Trait EI and the five-factor model of personality (FFM). In line with the theoretical
conceptualization of EI as a personality trait, several correlations were observed between trait
EI and the FFM (Table 7). Trait EI was positively associated with emotional stability,
openness, agreeableness and conscientiousness. At the factor level, TEIQue and FFM factors
which were theoretically expected to correlate with one another did correlate (e.g., self-
control and emotional stability, sociability and introversion) whereas factors which were not
expected to correlate did not correlate (e.g., self-control and openness).
Susceptibility to socially desirable responding
Overall, trait EI is moderately associated with social desirability scores but the various
factors do not contribute equally to this relationship (see Table 7). Additionally, it is of note
that gender differences need to be considered regarding the factors emotionality and
sociability. Indeed, separate analyses checking for gender differences revealed that
Trait Emotional Intelligence -TEIQue, p. 18
emotionality was related to social desirability among women but not among men, whereas
sociability was related to social desirability among men but not among women.
Criterion validity5
Trait EI and psychopathology. As expected, trait EI was negatively correlated with
indicators of anxiety and depression (see Table 7).
Trait EI and social support. As shown in Table 7, trait EI was more associated with
perceived quality of social support than with perceived quantity of social support. Whereas all
trait EI factors were associated with the perceived quality of social support, only well-being
and emotionality were associated with perceived quantity of social support.
Trait EI and Positive and Negative State Affectivity. Trait EI and positive and negative
state affectivity were assessed several weeks from one another using data from experimental
studies on stress resistance in which participants completed the PANAS before and after a
mood induction procedure, in order to check the manipulation effectiveness. In the present
study, we only use the "before manipulation" data (measured upon arrival at the laboratory)
and examine whether the TEIQue, measured several weeks later, is able to predict state
affectivity. These data have never been presented as such. In the other studies involving those
data (Mikolajczak et al., under reviewb), a "before-after manipulation" difference score had
been computed and subsequently used to test the success of our manipulation. The correlation
between state PA and state NA was only -.17 (p ≤ .01), thereby supporting the current view of
PA and NA as distinct dimensions (for a review, see Cropanzano, Weiss, Hale, & Reb, 2003),
and this explains why results might be different according to the dimension considered.
As shown in Table 7, trait EI is a significant predictor of both positive and negative
state affectivity, though it is more related to NA than to PA. The factors which best predicted
state-NA were [trait] well-being and self-control, and the factor which best predicted state-PA
was [trait] well-being.

Trait Emotional Intelligence -TEIQue, p. 19
Trait EI and Emotional Reactivity. Trait EI and emotional reactivity were assessed
several weeks apart. Emotional reactivity was assessed during the individual session of an
experimental study (i.e., mood induction: stress or neutral) whereas trait EI was assessed
during a collective session several weeks later. Although these data are part of a larger
research program of which some portion has been presented (Mikolajczak et al., under
reviewb, study 2 and 3) or will be presented (Mikolajczak, Roy, de Timary, & Luminet, in
preparation), analyses involving emotional reactivity have never been presented.
Correlations (i.e., effect sizes) between trait EI and emotional reactivity are reported
separately for the two conditions in Table 7. Multiple regression analyses (reported in Table
8) revealed (1) a main effect of condition indicating that emotional reactivity was higher in
stressful than in neutral condition; (2) a main effect of trait EI indicating that higher trait EI
scores reported less emotional reactivity than lower scores in both conditions; and (3) an
interaction effect between trait EI and condition indicating that the effect of trait EI was even
more pronounced in the stressful condition (i.e., higher scores reporting lower reactivity). All
trait EI factors had a main effect on emotional reactivity (though it is only marginal in the
case of emotionality). However, in accordance with theoretical expectations, self-control was
the factor which had the strongest main effect; it was also the only factor having a moderating
effect (i.e., having a stronger effect in stressful condition than in neutral condition).
Incremental Validity
One study provided the necessary data to test the incremental validity of trait EI to
predict emotional reactivity over and above social desirability, the three factors of alexithymia
and the five-factor model of personality. According to Judd (statistical course based on Judd
& McClelland, 1989), only the constructs that have previously been shown to be valid
predictors of the dependent variable (DV) should be included in the multiple regression
(principle of economy). Therefore, the first step consisted of performing independent

Trait Emotional Intelligence -TEIQue, p. 20
regressions in order to identify the various predictors of our DV. In order to be as strict as
possible in subsequent incremental analyses, any variable whose relation with the DV was
significant or marginally significant was considered as a predictor. These preliminary
analyses revealed that emotional reactivity was predicted by condition (neutral/stress), global
trait EI, its factors of well-being and self-control, social desirability, and two dimensions of
personality (i.e., agreeability and emotional stability). No interaction effect reached
significance, which is not surprising as this sample is smaller than the aggregated sample used
to test predictive validity, and that interactions are notoriously difficult to detect on small
samples (e.g., Cohen, Cohen, West, & Aiken, 2003).
In a second step, we tested the incremental validity of EI over social desirability,
agreeableness and emotional stability using a partially stepwise procedure (Hunsely & Meyer,
2003). Condition was entered as the first block, social desirability, agreeableness and
emotional stability were entered in a stepwise fashion as the second block, and well-being and
self-control were entered in a stepwise fashion as the third block.
As depicted in Table 9, trait EI significantly predicted the level of emotional reactivity
over and above the effects of condition, social desirability, agreeableness and emotional
stability. Among the predictors, the stepwise procedure only retained emotional stability as a
significant predictor in the second block and self-control in the third block. It is noteworthy
that complementary analyses entering all the predictors (condition, social desirability,
agreeableness, emotional stability, self-control and well-being) together in the equation
showed that only condition (β = -.532, p ≤ .001) and self-control (β = -.413, p ≤ .005)
remained significant when the influence of all others was controlled (that is, self-control has
incremental validity over and above the FFM but the opposite is not true).
Discussion

Trait Emotional Intelligence -TEIQue, p. 21
The number of findings involved in the present paper prevents us from discussing all
of them in detail. As most of the results speak for themselves, we have chosen to devote this
section to three findings which deserve a more extended discussion: the gender differences on
TEIQue scores, the issue of social desirability, and the impact of trait EI on emotional
reactivity.
Gender Differences on Trait EI Scores
Significant gender differences were found in the results, with women scoring higher
on emotionality, and men scoring higher on self-control, sociability, and the global score.
Such results are consistent with those obtained with the English version of the TEIQue
(Petrides & Furnham, 2000). They also echo those of Feingold (1994), who meta-analysed
gender differences in personality and found that women were more agreeable (more sensitive
etc.) and men more emotionally stable. Theoretically, the fact that women scored higher on
emotionality is coherent with Western norms according to which expressing emotions is
generally viewed as “unmanly (Brody, 2000, p. 26). Empirically, it is in line with findings
obtained using the EQ-I (Slaski, 2001) and with data showing that men score slightly higher
on alexithymia than women (Parker, Taylor, & Bagby, 2003). In the same vein, the fact that
men scored higher than women on self-control is on the one hand consistent which the
divergent socialization of emotion as a function of gender (e.g., “Boys don’t cry”) and on the
other hand in line with findings obtained using the EQ-I (i.e., men > women on stress
management; Bar-On, Brown, Kirkcaldy, & Thome, 2000). On the other hand, the finding
that men scored higher than women on sociability could seem odd at first sight, especially as
women are commonly thought to have higher social skills than men (Pease & Pease, 2001);
however, a closer look at the subscales that compose the “sociability” factor revealed that this
factor does not refer to dimensions such as empathy or ability to initiate/maintain close
relationships (which abilities are part of the emotionality factor) but rather to dimensions such

Trait Emotional Intelligence -TEIQue, p. 22
as the ability to assert oneself, or to influence other’s emotions and decisions, which are more
easily attributed to males (Kray & Thompson, 2005). Finally, although consistent with
findings using the original version of the TEIQue, the fact that men scored higher than women
on the global trait EI score is at odds with findings obtained using other trait EI measures such
as the Bar-On EQ-I (no gender diff.: Slaski, 2001) or the Schutte EIS (no gender diff.: Chan,
2003; women > men: Ciarrochi, Chan, & Bajgar, 2001, and Schutte, Malouff, Hall, Haggerty,
Cooper, Golden et al., 1998). Future studies are thus sorely needed to determine to what
extent these differences in self-perceptions (1) are attributable to biases in the
test/questionnaire construction, (2) objectify real differences between men and women, (3) are
due to women being less confident in their capabilities than men, or (4) are attributable to
women being more demanding vis-à-vis themselves than men in the emotional domain. In the
meanwhile, such gender differences have to be taken into account in the establishment of
norms and in the interpretation of scores, especially when women and men have to be
compared (e.g., organizational or educational settings).
Susceptibility to socially desirable responding
Our findings suggest that, like most self-reports, responses to the TEIQue are not
independent of social desirability. The various factors are, however, not equally subject to
desirable responding. The weight of the factors as well as the magnitude of the correlations
echoes previous findings obtained using the EQ-I (Bar-on et al., 2000; Hemmati, Mills, &
Kroner, 2004) and the Tett, Fox, and Wang’s trait EI measure (2005). It is noteworthy,
however, that the association between social desirability and TEIQue scores does not seem to
pose serious threats to the validity of the findings obtained using the latter, as predictions
remain fully significant after controlling for social desirability in both the present (this paper)
and others' (e.g., Coumans, 2005) studies.

Trait Emotional Intelligence -TEIQue, p. 23
The association between trait EI and social desirability appears mainly attributable to
factors well-being and self-control. With respect to well-being, its relationship with social
desirability may be underlain by two reasons. Firstly, it is possible that social desirability
influenced self-reported well-being, with individuals higher in social desirability reporting
higher levels of well-being. However, there was no apparent reason to present oneself as
happier than one really was, especially as (1) the study was totally anonymous, and (2)
participants were psychology students, that is, individuals who should have a priori no
prejudice vis-à-vis the experience of psychological distress. Therefore, the hypothesis
according to which well-being may influence responses to social desirability measures should
also be considered. Indeed, several studies have shown that positive mood biases judgement
positively (e.g., Isen, Shalker, Clark, & Karp, 1978) and promotes a heuristic processing of
information (e.g., Chaiken, 1980). Thus, people scoring high in well-being may, on the one
hand perceive themselves more positively than they actually are and, on the other hand,
process information in a heuristic way (not going into much details) with the result that they
will probably fail to consider a number of isolated events when responding to the desirability
items. Considering for instance the item about “I can remember playing sick to get out of
something”, the afore-mentioned bias associated with positive mood may lead people high in
well-being reporting that they have never played sick. In fact, they did probably play sick
once or twice but and as they usually do not do it and as their judgement is based on a
heuristic examination of the episodic information, they may conclude that they never did.
Regarding the factor self-control (SC), its relationship with social desirability is more
surprising, especially as additional hierarchical regression analyses revealed that this
relationship was neither mediated by conscientiousness, nor by self-esteem, nor by anxiety
nor by a fear of a negative evaluation. Studies that shed light on this association are thus
sorely needed. In the meanwhile, it is of note that, notwithstanding this partial overlap

Trait Emotional Intelligence -TEIQue, p. 24
between SC and social desirability, SC was found to remain entirely predictive of all
indicators of resistance to stress (the dependent variable under consideration in our studies)
when controlling for social desirability (e.g., Mikolajczak et al., under reviewb). In addition,
previous studies also showed that self-control is underlain by clearly identifiable
neuroendocrine (i.e., salivary cortisol secretion; Mikolajczak et al., in preparation) and
cognitive processes (including unconscious ones such as early attentional processes;
Mikolajczak, Luminet, Roy, & Vestrynge, under revision) which would not have been the
case if self-control scores were only the product of social desirability (especially as the
association between self-control and these cognitive processes remained totally significant
when social desirability is partialled out).
Trait EI and Emotional Reactivity
Although measured several weeks apart, Trait EI constitutes a significant predictor of
lesser emotional reactivity (and this effect holds when the effect of social desirability and the
FFM is partialled out). This finding is congruent with other analyses performed on the same
data set, showing that trait EI moderates mood deterioration subsequent to mood induction
(higher trait EI scores are associated with smaller difference between affectivity at time 1 and
2; see Mikolajczak et al., under reviewb, studies 2 and 3 as well as Mikolajczak et al., in
preparation).
At first sight, the result that trait EI is associated with less emotional reactivity
contrasts with conclusions of Engelberg & Sjöberg (2004) according to which EI would
“draw on a disposition to experience more intense affect in response to emotional stimuli”.
However, their study was cross-sectional and required participants to forecast their emotional
intensity in a number of fictitious situations (in brief, they correlated trait EI with the AIM =
Affect Intensity Measure by Larsen, Diener, & Emmons, 1986) whereas ours is quasi-
experimental, meaning that people were put in real-life situations. Our findings appear also at

Trait Emotional Intelligence -TEIQue, p. 25
odds with a study by Petrides & Furnham (2003) showing that high trait EI participants
exhibited greater sensitivity to mood induction than their low trait EI counterparts. However,
it is noteworthy that Petrides & Furnham were not interested in resistance to stress but in
sensitivity to emotion-laden stimuli. Accordingly, they manipulated mood through disturbing
and cheerful video segments. As Petrides & Furnham’s mood induction procedure clearly
targets another reality than the present one, their findings are not necessarily incompatible
with ours. It is theoretically conceivable that higher trait EI scores might be more resistant to
stress than lower scores and, at the same time, be more responsive to emotion-eliciting movies
(which do not represent a threat to one’s integrity). In favour of this view, it is of note that the
present findings are in accordance with findings of an experimental study by Schutte,
Malouff, Simunek, McKenley, & Hollander (2002) showing that higher trait EI individuals
loose less PA and self-esteem after a negative mood-induction through the Velten method
(sentences meant to provoke a drop in self-esteem) than do lower trait EI individuals. Our
findings are also in line with other experimental studies showing that high trait EI individuals
present lesser mood deterioration and lesser cortisol secretion after an experimentally induced
stress than their lower counterparts (e.g., Mikolajczak et al., under reviewb, study 1;
Mikolajczak et al., in preparation).
The finding that the factor self-control was the best predictor of emotional reactivity is
in accordance with theoretical expectations (this factor specifically targets the ability to
manage one’s emotions, stress included). The effect size of its association with emotional
reactivity in neutral condition (r = -.30) and in stressful conditions (r = -.48) is meaningful and
warrants mention, especially as the design is prospective. It is also noteworthy that self-
control had incremental validity to predict emotional reactivity over and above the other trait
EI factors, social desirability and the five factors of personality. The increment in prediction is
not only statistically significant but it is substantial (semipartial r = .32) according to Hunsley

Trait Emotional Intelligence -TEIQue, p. 26
& Meyer's proposed norms for social sciences (2003), which is all the more interesting as the
dependent variables were measured several weeks apart from trait EI.
General Discussion
The present set of studies represents the most systematic published psychometric
investigation of a test/questionnaire within the EI research field. It also constitutes the first
rigorous investigation of the psychometric properties of the TEIQue since its introduction by
Petrides & Furnham in 2003. Neither the psychometric properties of the original British
TEIQue nor those of any other translations have ever been published. Thus, beyond their
interest for French-speaking researchers and practitioners, the present findings may be of
interest to any researcher/practitioner using the TEIQue: they provide both a point of
comparison, as well as a first indication of what psychometric properties of other versions
may look like (though cultural differences are possible).
Results lend preliminary support to the validity of the TEIQue. First and foremost,
internal consistencies were generally good. Although they should be improved for five
subscales (i.e., impulsiveness, empathy, relationship skills, adaptability and self-motivation),
they were satisfactory as far as the ten others were concerned. Most importantly, internal
consistencies of all factors and global scores were excellent.
Then, the British’s four factor structure was globally replicated, confirming previous
findings according to which the factor structure is relatively stable across languages (Petrides,
personal communication, August 2005). Congruence coefficients between Belgian and
English factor structures were excellent according to the norms provided by MacCallum,
Widaman, Zhang, & Hong (1999) and reflected “a practical identity of the factors” across
countries (values greater than .95; Jensen, 1998, p. 99). It shows that a very similar structure
of affect-related personality traits can be found in French and English (as well as in Spanish,
New-Zealand, and Greek; see intro). Although there may be cultural differences between

Trait Emotional Intelligence -TEIQue, p. 27
these countries with respect to the way a trait is expressed, such cultural differences do not
seem to affect the structure of traits in the individual. It thus appears that the TEIQue captures
quite well the structure of affect-related traits. This finding is of particular importance as it is
the first EI test/questionnaire to show stability across studies and languages.
Regarding demographic data, TEIQue scores were found independent of age but
influenced by gender, suggesting that separated norms for men and women would be useful.
Although a proper multitrait-multimethod matrix could not be constructed for this
investigation, the TEIQue displayed preliminary evidence of convergent and discriminant
validity. Firstly, the various TEIQue factors correlated in meaningful and theoretically
congruent ways with alexithymia, optimism, and the big five factors of personality. It is
noteworthy that trait EI can, howwever, not be reduced to these constructs since (1) it has
demonstrated incremental validity over them in the prediction of a number of variables (e.g.,
Mikolajczak, Luminet, & Menil, 2006; Mikolajczak et al., under revisiona; Mikolajczak et al.,
under revisionb) and (2) it predicts variables that they do not predict (id.).
Conversely, TEIQue scores were unrelated to non-verbal reasoning, which is
consistent with theoretical considerations according to which trait EI is a personality trait
instead of a form of intelligence (Petrides & Furhnam, 2001, 2003). These results echo
previous findings according to which trait EI is related to personality but not to indicators of
IQ, while the opposite has been found with ability EI (e.g., for a meta-analytic review of
personality and ability correlates of EI, see Van Rooy, Viswesvaran, Pluta, 2005). Once again,
such results stress the necessity of changing trait EI's label in order that it does not contain the
notion of "intelligence" anymore.
Although the foregoing findings are necessary conditions for a construct to be said
valid, they are not sufficient. Ultimately, it is the construct’s ability to predict outcomes of
interest that will determine its utility. It is vital here to understand that "to predict" does not

Trait Emotional Intelligence -TEIQue, p. 28
equal "to cause". Saying that an instrument A is a good predictor of a variable B means that
when you know the score of an individual on A, you have a good idea of what his/her
score/behaviour on B may be. This does not mean that A caused B (e.g., height and weight are
related but they are both the product of a third variable).
The prediction of "objective" life outcomes such as professional success or medical
status was beyond the scope of the present study. All criteria examined in the present study
were self-reported and pertained to subjective emotional adjustment. These are, however, not
trivial criteria, especially as emotional welfare is a major goal in life for most people.
Furthermore, examining such criteria was essential to ensure construct validity (i.e., if trait EI
is a valid construct, it has to predict a higher emotional adjustment). In this respect, the
TEIQue predicted a substantial and meaningful part of variance of depression and anxiety,
perceived quality and quantity of social support, future positive and negative state affectivity,
and emotional reactivity in stressful conditions. These findings, far from isolated, are
consistent with previous studies conducted with the French version of the TEIQue: TEIQue
scores were found to predict students’ resistance to examination’stress (Mikolajczak et al.,
2006), mood deterioration and neuroendocrine reactivity following a laboratory stressor
(Mikolajczak et al., under reviewb; Mikolajczak et al., in preparation), as well as the level of
burnout and somatic complaints among nursing and call center employees (Mikolajczak et al.,
under reviewa; van Kan, 2004). In conjunction with the findings accumulated using the
original (English) version of the TEIQue regarding the prediction of both "subjective" and
"objective" criteria (see introduction), the capacity for French TEIQue scores to predict
resistance to stress in both applied and experimental settings constitutes evidence in favour of
its validity and practical utility.
Although such evidence of predictive validity is a necessary condition for a test to be
claimed useful, it is, however and once again, not sufficient. To be deemed useful, the
Trait Emotional Intelligence -TEIQue, p. 29
TEIQue should also demonstrate that (1) findings are not attributable to social desirability,
and (2) that other tests/questionnaires cannot do the job, at least not as efficiently. This
condition is of particular importance here, since TEIQue scores were precisely found to be
associated with social desirability. By showing that the TEIQue predicts emotional reactivity
over and above social desirability, alexithymia, and the five-factor model of personality, the
present paper adds to the growing body of literature showing that the TEIQue does indeed
predict variance over and above the Giant Three, the Big Five, and other cognate constructs
(for examples in French, see Mikolajczak et al., in press, under reviewa, under reviewb; for
examples in other languages, see Furnham & Petrides, 2003; Petrides & Furnham, 2003;
Petrides et al., 2004; Petrides et al., in press; Petrides, et al., revision under review).
The foregoing represents modest but promising findings in favour of the validity and
usefulness of the TEIQue. However, several limitations have to be acknowledged. Firstly,
most of these studies involve students, thus raising concerns about the generalizability of the
findings to other population’ strata. It also restricts range, especially regarding "age", for
which results have to be interpreted with caution. Secondly, all study variables were measured
through self-reports, which potentially introduced a “shared method covariance” bias. In this
respect, it cannot be excluded that the absence of relationship between trait EI and non-verbal
reasoning (indicator of IQ) was simply the product of divergent measurement methods (self-
report versus performance), just like the quasi null relationship between ability and trait EI
(which are uncorrelated although their sampling domains are closely related). Thirdly, the
results of the investigation of mean trait EI differences across occupational sectors should be
interpreted with caution as only a limited sample of occupations was included in the analysis
(i.e., those which were under-represented in our sample were excluded). Furthermore, albeit
their appealing character, it should be mentioned that the cross-sectional methodology
adopted does not allow to draw conclusions in terms of causality. However, it is striking that

Trait Emotional Intelligence -TEIQue, p. 30
most mean differences were in line with expectations. It is especially noteworthy that
unemployed people had the lowest EI scores, which is in accordance with the current idea that
EI is a necessary (although not sufficient) condition for professional success. Finally, in
addition to addressing these issues, future studies would certainly benefit from considering
other types of criterions, such as behavioural (e.g., pro-social behaviours, performance) or
medical ones (e.g., health status, cortisol secretion).
Trait Emotional Intelligence -TEIQue, p. 31
References
Austin, E. J. (2004). An investigation of the relationship between trait emotional intelligence
and emotional task performance. Personality and Individual Differences, 36, 1855-64.
Austin, E. J. (2005). Emotional intelligence and emotional information processing.
Personality and Individual Differences, 39, 403-414.
Bagby, R. M., Parker, J. D. A., & Taylor, G. J. (1994). The 20-Item Toronto-Alexithymia-
Scale .1. Item Selection and Cross-Validation of the Factor Structure. Journal of
Psychosomatic Research, 38(1), 23-32.
Bar-On, R. (1997). EQ-I Bar-On Emotional Quotient Inventory: Technical Manual. Toronto:
MHS (Multi-Health Systems).
Bar-On, R., Brown, J. M., Kirkcaldy, B. D., & Thome, E. P. (2000). Emotional expression
and implications for occupational stress; an application of the Emotional Quotient
Inventory (EQ-i). Personality and Individual Differences, 28, 1107-1118.
Beck, A. T., Ward, C. H., Mendelson, M., Mock, J., & Erbaugh, J. (1961). An inventory for
measuring depression. Archives of General Psychiatry, 4, 561-571.
Blais, M. R., & Lachance, L. (1992). Validation de la version française de la
mesure de désirabilité sociale de Marlowe-Crowne [French validation of the Marlowe-
Crowne social desirability measure]. Unpublished manuscript. Université du Québec à
Montréal, Canada.
Brody, L. R. (2000). The socialization of gender differences in emotional expresssion:
Display rules, infant temperament, and differentiation. In A. H. Fischer (Ed.), Gender
and Emotion: Social Psychological perspectives. (pp. 24-47). New York: Cambridge
University Press.
Bruchon-Schweitzer, M., & Paulahan, I. (1990). Manuel de l'inventaire d'Anxiété trait-état
(forme Y). Laboratoire de psychologie de la santé: Université de Bordeaux II, France.

Trait Emotional Intelligence -TEIQue, p. 32
Chaiken, S. (1980). Heuristic versus systematic information processing and the use of source
versus message cues in persuasion. Journal of Personality and Social Psychology, 39,
752-766.
Chan, D. W. (2003). Dimensionsof emotionql intelligence and their relationships with social
coping among gifted adolescents in Hong Kong. Journal of Youth and adolescence,
32, 409-418.
Ciarrochi, J., Chan, A. Y. C., & Bajgar, J. (2001). Measuring emotional intelligence in
adolescents. Personality and Individual Differences, 31, 1105-1119.
Cohen, J., Cohen, P., West, S. G., & Aiken, L. S. (2003). Applied Multiple
Regression/Correlation Analysis for the Behavioral Sciences. Mahwah, NJ: Lawrence
Erlbaum.
Collet, L., & Cottraux, J. (1986). Inventaire abrégé de la dépression de Beck (13 items). Etude
de la validité concurrente avec les échelles de Hamilton et de ralentissement de
Wildlöcher. L'Encéphale, 12, 77-79.
Costa, P. T., & McCrae, R. R. (1992). Revised NEO Personality Inventory (NEO-PI-R) and
NEO Five-Factor Inventory (NEO-FFI) professional manual. Odessa, FL:
Psychological Assessment Resources.
Coumans, N. (2005). L'influence de l'intelligence émotionnelle sur les processus mnésiques
impliqués dans la régulation émotionnelle: analyse du décours temporel [Influence of
emotional intelligence on the memory processes involved in emotional regulation: A
temporal analysis]. Unpublished master thesis, Université catholique de Louvain,
Louvain-la-Neuve, Belgium.
Cronbach, L. J. (1949). Essentials of psychology testing. New York: Harper & Row.
Cropanzano, R., Weiss, H. M., Hale, J. M. S., & Reb, J. (2003). The structure of affect:

Trait Emotional Intelligence -TEIQue, p. 33
reconsidering the ralationship betwen negative and positive affectivity. Journal of
Management, 29, 831-857.
Crowne, D. P., & Marlowe, D. (1960). A new scale of social desirability independent of
psychopathology. Journal of Consulting Psychology, 24, 349-354.
Engelberg, E., & Sjöberg, L. (2004). Emotional intelligence, affect intensity, and social
adjustment. Personality and Individual Differences, 37, 533-542.
Feingold, A. (1994). Gender differences in personality: A meta-analysis. Psychological
Bulletin, 116, 429-456.
Frijda, N. H. (1986). The emotions. Cambridge: Cambridge University Press.
Frijda, N.H., Kuipers, P., & Ter Schure, L. (1989). Relations among emotion, appraisal and
emotional action readiness. Journal of Personality and Social Psychology, 57, 212-
228.
Funder, D. C. (2001). The personality puzzle (2nd ed.). New York: Norton.
Gaudreau, P. (2000, Juillet). Vers une version française du PANAS : analyses en composantes
principales avant, pendant et après une compétition sportive. Communication
présentée au Congrès International de la Société Française de Psychologie du Sport,
Paris.
Hambleton, R. K. (2001). The next generation of the ITC Test Translation and Adaptation
Guidelines. European Journal of Psychological Assessment, 17, 164-172.
Hayton, J. C., Allen, D. G., & Scarpello, V. (2004). Factor retention decisions in exploratory
factor analysis: A tutorial on Parallel Analysis. Organizational Research Methods, 7,
191-205.
Hemmati, T., Mills, J. F., & Kroner, D. G. (2004). The validity of the Bar-On emotional
intelligence quotient in an offender population. Personality and Individual
Differences. 37, 695-706.

Trait Emotional Intelligence -TEIQue, p. 34
Hunsley, J., & Meyer, G. J. (2003). The incremental validity of psychological testing and
assessment: Conceptual, methodological, and statistical issues. Psychological
Assessment, 15, 445-455.
Isen, A. M., Shalker, T. E., Clark, M., & Karp, L. (1978). Affect, accessibility of material in
memory, and behavior: a cognitive loop? Journal of Personality and Social
Psychology, 36, 1-12.
Jensen, A. R. (1998). The g factor: The science of mental ability. Westport, CT: Praeger.
Judd, C. M., & McClelland, G. H. (1989). Data analysis: A model comparison approach. San
Diego, CA: Harcourt, Brace, Jovanovich.
Kray, L. J., & Thompson, L. (2005). Gender stereotypes and negotiation performance: A
review of theory and research. In B. Staw & R. Kramer (Eds.), Research in
Organizational Behavior Series (pp. 103-182).
Krohne, H. W., Pieper, M., Knoll, N., & Breimer, N. (2002). The cognitive regulation of
emotions: The role of success versus failure experience and coping dispositions.
Cognition & Emotion, 16, 217-243.
Larsen, R. J., Diener, E., & Emmons, R. A. (1986). Affect intensity and reactions to daily life
events. Journal of Personality and Social Psychology, 51, 803-814.
Loas, G., Otmani, O., Verrier, A., Fremaux, D., & Marchand, M. P. (1996). Factor analysis of
the French version of the 20-item Toronto alexithymia scale (TAS-20).
Psychopathology, 29(2), 139-144.
MacCallum, R. C., Widaman, K. F., Zhang, S., & Hong, S. (1999). Sample size in factor
analysis. Psychological Methods, 4, 84-99.
Mikolajczak, M., Luminet, O., & Menil, C. (2006). Predicting Resistance to Stress:
Incremental Validity of Trait Emotional Intelligence over Alexithymia and Optimism.
Psicothema, 18(Special Issue on Emotional Intelligence), 79-88.

Trait Emotional Intelligence -TEIQue, p. 35
Mikolajczak, M., Menil, C., & Luminet, O. (under revisiona). Explaining the protective effect
of trait emotional intelligence regarding occupational stress: exploration of
challenge/threat appraisals and emotional labour processes.
Mikolajczak, M., Petrides, K. V., Luminet, O., & Coumans, N. (under revisionb). An
experimental investigation of the moderating effect of trait emotional intelligence on
laboratory-induced stress.
Mikolajczak, M., Luminet, O., Roy, E., & Verstrynge, V. (under revisionc). An Exploratory
Study of the Cognitive Processes that Underlie the Trait Emotional Intelligence
Construct. Investigation of Memory and Attention in the Context of Emotional
Regulation.
Mikolajczak, M., Roy, E., de Timary, P., & Luminet, O. (in preparation). Impact of trait
emotional intelligence on subjective and neuro-endocrine responses to a laboratory
stressor.
Parker, J. D. A., Taylor, G. J., & Bagby, R. M. (2003). The 20-item Toronto Alexithymia
Scale III. Reliability and factorial structure in a community population. Journal of
Psychosomatic Research, 55, 269-275.
Pease, A., & Pease, B. (2001). Why men don't listen and women can't read maps. London:
Orion Books.
Petrides, K. V. (2001). A psychometric investigation into the construct of emotional
intelligence. Unpublished Doctoral Dissertation, University College London, UK.
Petrides, K. V. (2004). Empirical findings from the Trait Emotional Intelligence Programme.
Paper presented at the First European CERE Conference on Emotions, Amsterdam,
The Netherlands.

Trait Emotional Intelligence -TEIQue, p. 36
Petrides, K. V., Frederickson, N., & Furnham, A. (2004). The role of trait emotional
intelligence in academic performance and deviant behavior at school. Personality and
Individual Differences, 36, 277-293.
Petrides, K. V., & Furnham, A. (2000). Gender differences in measured and self-estimated
trait emotional intelligence. Sex Roles, 42(5-6), 449-461.
Petrides, K. V., & Furnham, A. (2001). Trait emotional intelligence: Psychometric
investigation with reference to established trait taxonomies. European Journal of
Personality, 15, 425-448.
Petrides, K. V., & Furnham, A. (2003). Trait emotional intelligence: Behavioural validation in
two studies of emotion recognition and reactivity to mood induction. European
Journal of Personality, 17, 39-57.
Petrides, K. V., Niven, L., & Mouskounti, T. (in press). The trait emotional intelligence of
ballet dancers and musicians. Psicothema ( special issue on emotional intelligence).
Petrides, K. V., Pita, R., & Kokkinaki, F. (revision under review). The location of trait
emotional intelligence in personality factor space.
Rascle, N., Aguerre C., Bruchon-Schweitzer M., Nuissier J., Cousson F., Gilliard J., Quintard
B. (1997). Soutien social et santé : Adaptation française du questionnaire de soutien
social de Sarason, le S.S.Q? [Social support and health: French adaptation of the
Sarason Social Support Questionnaire (SSQ)]. Les Cahiers Internationaux de
Psychologie Sociale, 33, 35-51.
Raven, J. C. (1976). Advanced Progressive Matrices Set II. England: Oxford Psychologist
Press.
Régner, I. (2002). A French translation of the LOT-R. Available at http://www.univ-tlse2.
fr/cerpp/annuaire/vautier/.
Rolland, J.-P., & Mogenet, J.-L. (2001). Manuel du système D5D. (2nd ed.). Paris: ECPA.

Trait Emotional Intelligence -TEIQue, p. 37
Salovey, P., & Mayer, J. D. (1990). Emotional Intelligence. Imagination, Cognition and
Personality, 9, 185-201.
Salovey, P., Stroud, L. R., Woolery, A., & Epel, E. S. (2002). Perceived emotional
intelligence, stress reactivity, and symptom reports: Further explorations using the trait
meta-mood scale. Psychology & Health, 17, 611-627.
Sarason, I. G., Levine, H. M., Basham, R. B., & Sarason, B. R. (1983). Assessing social
support: the Social Support Questionnaire. Journal of Personality and Social
Psychology, 44, 127-139.
Scheier, M. F., & Carver, C. S. (1985). Optimism, coping, and health: Assessment and
implications of generalized outcome expectancies. Health Psychology, 4, 219-247.
Schultz, J. H. (1965). Le training autogène [The autogenic training] (3rd ed.). Paris: P.U.F. Schutte, N. S., Malouff, J. M., Hall, L. E., Haggerty, D. J., Cooper, J. T., Golden, C. J., et al.
(1998). Development and validation of a measure of emotional intelligence.
Personality and Individual Differences, 25, 167-177.
Schutte, N. S., Malouff, J. M., Simunek, M., McKenley, J., & Hollander, S. (2002).
Characteristic emotional intelligence and emotional well-being. Cognition & Emotion,
16, 769-785.
Slaski, M. (2001). An investigation into emotional intelligence, managerial stress and
performance in a UK supermaket chain. Unpublished Doctoral Dissertation,
Manchester School of Management, Manchester, United Kingdom.
Slaski, M., & Cartwright, S. (2002). Health, performance and emotional intelligence: an
exploratory study of retail managers. Stress and Health, 18(2), 63-68.
Sonnemans, J., & Frijda, N. H. (1994). The Structure of Subjective Emotional Intensity.
Cognition and Emotion, 8, 329-350.
Spearman, C. (1927). The abilities of man: Their nature and measurement. New York:

Trait Emotional Intelligence -TEIQue, p. 38
Macmillan.
Spielberger, C. D., Gorsuch, R. L., Lushene, R., Vagg, P. R., & Jacobs, G. A. (1983). Manual
for the State-Trait Anxiety Inventory. Palo Alto, CA: Consulting Psychologists Press.
Tett, R. P., Fox, K. E., & Wang, A. (2005). Development and validation of a self-report
measure of emotional intelligence as a multidimensional trait domain. Personality and
Social Psychology Bulletin, 31, 859-888.
Van Der Zee, K., & Wabeke, R. (2004). Is trait-Emotional Intelligence simply or more than
just a trait? European Journal of Personality, 18, 243-263.
van Kan, L. (2004). Intelligence Emotionnelle et régulation de ses émotions: comment mieux
gérer le stress en milieu professionnel? [Emotional intelligence and emotional
regulation: how can we better manage occupational stress?]. Unpublished Master
thesis, Free University of Brussels, Brussels, Belgium.
Van Rooy, D. L., & Viswesvaran, C. (2004). Emotional intelligence: A meta-analytic
investigation of predictive validity and nomological net. Journal of Vocational
Behavior, 65, 71-95.
Van Rooy, D.L., Viswesvaran, C., Pluta, P. (2005). An Evaluation of Construct Validity:
What Is This Thing Called Emotional Intelligence? Human Performance, 18, 445-462.
Veenhoven, R. (1984). Databook of happiness. Boston: Reidel Dordrecht.
Wallbot, H. G., & Scherer, K. R. (1986). Cues and chanels in emotion recognition. Journal of
Personality and Social Psychology, 51, 690-699.
Watkins, M. W. (2002a). Monte Carlo PCA for Parallel Analysis [Computer software].
Downloadable at http://www.personal.psu.edu/mww10/Watkins3.html.
Watkins, M. W. (2002b). RC: Coefficient of Congruence [Computer software]. Downloadable
at http://www.personal.psu.edu/mww10/Watkins3.html.
Watson, D., Clark, L. A., & Tellegen, A. (1988). Development and Validation of Brief

Trait Emotional Intelligence -TEIQue, p. 39
Measures of Positive and Negative Affect - the Panas Scales. Journal of Personality and
Social Psychology, 54, 1063-1070.
Zwick, W. R., & velicer, W. F. (1986). Comparison of five rules for determining the number
of components to retain. Psychological Bulletin, 99, 432-442.

Trait Emotional Intelligence -TEIQue, p. 40
Appendix
Factorial and Subscale Structure of the TEIQue (Petrides & Furnham, 2003b). Factors & facets High scorers perceive themselves as… Well-being Self-esteem …successful and self-confident.
Trait happiness …cheerful and satisfied with their lives.
Trait optimism …confident and likely to “look on the bright side” of life.
Self-control Emotion regulation …capable of controlling their emotions.
Stress management …capable of withstanding pressure and regulating stress.
Impulsiveness (low) …reflective and less likely to give in to their urges.
Emotionality Emotion perception (self and others) …clear about their own and other people’s
feelings. Emotion expression …capable of communicating their feelings to
others. Relationship skills …capable of having fulfilling personal
relationships.
Empathy …capable of taking someone else’s perspective.
Sociability Social competence …accomplished networkers with excellent
social skills.
Emotion management (others) …capable of influencing other people’s feelings.
Assertiveness …forthright, frank, and willing to stand up for their rights.
The following subscales do not belong to any particular factor and are directly included in the total score Adaptability …flexible and willing to adapt to new
conditions. Self-motivation …driven and unlikely to give up in the face
of adversity.

Trait Emotional Intelligence -TEIQue, p. 41
Author Note
Preparation of this paper was facilitated by a FSR grant from the Research Special
Funds of the University of Louvain as well as a travel grant to London from the Belgian
French-speaking Government accorded to the first author, and grants 1.5.146.02, 1.5.123.04
and 1.5.175.06 from the Belgian National Fund for scientific Research accorded to the second
author.
Cécile Leroy is now at the ORBEM [Office Régional Bruxellois de l’Emploi], Brussels,
Belgium.
We would like to warmly thank Dr. K. V. Petrides for granting us access to the UK
data for the TEIQue v. 1.50.
Correspondence concerning this article should be addressed to Moïra Mikolajczak,
University of Louvain, Department of Psychology, Research Unit for Emotion, Cognition,
and Health, 10, Place Cardinal Mercier, B-1348 Louvain-la-Neuve, Belgium, or on e-mail to

Trait Emotional Intelligence -TEIQue, p. 42
Footnotes
1. The rationale underlying PA is that non-trivial components from real data with a
valid underlying structure should have larger eigenvalues than parallel components derived
from random data having the same sample size and number of variables (Hayton et al., 2004).
The Marley Watkins program generates completely random data sets having the same sample
size and containing the same number of variables than the real data set (up to 1000
replications possible). Then it generates the correlations matrices for these data sets and
provides their average eigenvalues. The researcher can then compare the eigenvalues
generated from these random data sets to the real data set in order to ensure that the former
are significantly lower than the latter.
2. The congruence coefficient (rc) is an index of factor similarity. It is typically used to
determine the factorial invariance of solutions across samples or studies.
3. Discriminant validity refers to the degree to which scores on a test do not correlate
with (are “independent of” or “orthogonal to”) variables they are not supposed to correlate
with, given the nature of the construct.
4. Convergent validity refers to the degree to which scores on a test correlate with
those on a test that is believed to measure a closely related construct (i.e., the two tests should
end up ranking people in pretty much the same way).
5. Criterion validity refers to the ability of a test to predict some criterion it should
theoretically be able to predict. Criterion-related validity can either be concurrent or
predictive. Concurrent validity refers to the correlation between the predictor and criterion
scores obtained at approximately the same time. Predictive validity refers to the degree to
which scores on a test predict future behaviour on a criterion variable.

Trait Emotional Intelligence -TEIQue, p. 43
Table 1. Male and Female Univariate Statistics of TEIQue Subscales, Factors and Global Score (N = 740: 217 males 512 females, 11 unknown). Num-
ber of items
Minimum Maximum Mean and SDs Skewnessa
Kurtoses b
Cronbach’s alpha
Males Females Males Females Males Females Effect-size (r)
Males Females Males Females Males Females
Self-esteem 11 2.73 1.73 6.55 6.73 4.86 (0.74)
4.54 (0.87)***c
-0.19 -0.217 -0.279 -0.023 0.171 .79 .71
Emotion expression 10 1.00 1.00 6.90 7.00 4.02 (1.27)
4.30 (1.23) **
0.11 0.104 -0.241 -0.525 -0.537 .86 .89
Self-motivation 10 2.20 2.10 6.90 6.90 4.70 (0.83)
4.67 (0.80)
-0.02 -0.082 -0.175 0.041 0.137 .66 .74
Emotion regulation 12 1.50 1.08 6.67 6.42 4.40 (0.87)
3.80 (0.89) ***
-0.32 -0.147 0.094 0.141 0.011 .77 .79
Happiness 8 1.25 1.00 7.00 7.00 5.47 (1.16)
5.55 (1.15)
0.03 -1.205 -1.260 1.268 1.726 .91 .91
Empathy 9 2.44 2.22 6.89 6.89 4.78 (0.89)
4.91 (0.76)†
0.08 -0.111 -0.203 0.035 0.101 .59 .73
Social competence 11 2.36 2.36 6.73 6.55 4.85 (0.81)
4.74 (0.80)†
-0.07 -0.212 -0.214 0.043 -0.468 .75 .75
Impulsiveness (low) 9 2.00 1.89 6.44 7.00 4.50 (0.86)
4.45 (0.89)
-0.03 -0.147 -0.111 -0.319 -0.105 .66 .64
Emotion perception 10 2.30 1.80 7.00 7.00 4.68 (0.95)
4.67 (0.87)
-0.01 -0.073 -0.027 -0.480 -0.176 .74 .80
Stress management 10 1.60 1.40 7.00 6.60 4.52 (1.02)
3.90 (1.02) ***
-0.29 -0.302 0.121 -0.114 -0.299 .77 .81
Emotion management 9 2.44 1.67 6.89 6.56 4.83 (0.86)
4.52 (0.87) ***
-0.18 -0.334 -0.266 -0.121 -0.040 .72 .75
Optimism 8 1.63 1.13 7.00 7.00 4.86 (1.03)
4.80 (1.10)
-0.03 -0.433 -0.525 0.038 0.096 .83 .81
Relationship skills 9 3.22 2.56 7.00 7.00 5.46 (0.72)
5.64 (0.78) **
0.12 -0.537 -0.730 0.378 0.535 .68 .59
Adaptability 9 2.22 1.44 6.78 6.78 4.55 (0.81)
4.26 (0.85) ***
-0.17 -0.116 -0.125 0.278 0.528 .69 .67

Trait Emotional Intelligence -TEIQue, p. 44
Assertiveness 9 2.22 1.00 6.44 7.00 4.70 (0.92)
4.41 (0.97) ***
-0.15 -0.265 -0.221 -0.577 -0.217 .75 .74
Well-being 27 2.08 1.62 6.63 6.78 5.06 (0.85)
4.96 (0.89)
-0.06 -0.892 -0.759 0.845 0.744 .91 .91
Self-control 31 2.36 2.26 6.41 6.32 4.47 (0.75)
4.05 (0.73) ***
-0.27 -0.161 0.195 -0.067 0.068 .85 .87
Emotionality 38 2.91 2.79 6.59 6.49 4.74 (0.73)
4.88 (0.64) **
0.10 0.173 -0.054 -0.213 -0.245 .86 .90
Sociability 29 2.86 2.47 6.48 6.34 4.80 (0.72)
4.56 (0.72) ***
-0.16 -0.212 -0.316 -0.063 -0.020 .86 .87
Global trait EI 3.05 3.06 6.12 6.20 4.75 (0.56)
4.61 (0.53) **
-0.13 -0.007 -0.180 -0.051 -0.041 .94 .95
Note. a = standard error of skewness estimations is 0.17 for males and 0.11 for females. b = standard error of kurtosis estimations is 0.33 for males
and 0.22 for females. c Asterisks correspond to p-values for gender differences t-tests. ***p < 0.001; **p < 0.01 ; *p < 0.05; †p < 0.1.

Trait Emotional Intelligence -TEIQue, p. 45
Table 2. Means, Standard deviations, and Internal Consistencies for the Scales Examined. N Number
of items
Cronbach’s alphas
Means and SDs (Frequencies for sex and occupation)
Occupational sector 251 1 (choice between 12 sectors)
— Social/health (58), Communication/medias (25), Commerce (21), Public utility/administration (56), Finance (20), Transportation/tourism (2), Telecommunications (6), Agriculture/environment (2), Justice (4), Art (4), Research and Development (29), unemployed (19)
Sex 740 1 — 512 females; 217 males; 11 unreported Age 740 1 — 25.5 (11.31) Convergent/discriminant validity
Optimism 91 6 .82 19.84 (4.81) Alexithymia 457 20 .79 47.25 (10.17)
Difficulty in identifying feelings
403 7 .78 16.81 (5.45)
Difficulty in describing feelings
403 5 .76 13.96 (4.65)
Externally oriented thinking
403 8 .43 16.28 (3.95)
Emotional stability 80 11 .84 38.62 (8.24) Introversion 80 11 .79 39.65 (8.89) Openness 80 11 .74 45.61 (6.27) Agreeableness 80 11 .71 48.24 (5.58) Conscientiousness 80 11 .77 44.92 (9.73) Cognitive ability (IQ) Timed: 30 min.
109 36 — a 24.20 (4.37)
Social desirability 131 33 .67 15.51 (4.46) Criterion validity Anxiety 82 20 .92 42.77 (10.33) Depression 82 13 .85 4.63 (4.60) Perceived quantity of social 93 6 .87 33.30 (10.80)

Trait Emotional Intelligence -TEIQue, p. 46
support Family members Friends
93 93
6 6
.93 .87
13.23 (10.81) 16.53 (8.36)
Perceived quality of social support
93 6 .88 30.91 (3.93)
Positive affectivity 306 10 .84 2.87 (0.60) Negative affectivity 306 10 .82 1.42 (0.47) Emotional reactivity 187 30 .90 51.16 (13.61) b,
72.39 (21.35) c Note. a As Raven’s matrices are of increasing difficulty, calculating internal consistencies does not make sense. b measured in the neutral
condition, b measured in the stressful condition.

Trait Emotional Intelligence -TEIQue, p. 47
Table 3.
Factor Pattern Matrix for the TEIQue Subscales (Promax Principal Axis Factoring Four-Factor Solution) (N = 740)
Well-being Sociability Self-control Emotionality
Subscales Happiness .99 -.07 -.15 -.01 Optimism .86 .04 .07 -.12 Self-Motivation .38 .07 .14 .24 Emotion management (others) -.18 .79 -.06 -.02 Assertiveness .18 .69 .06 -.08 Social competence .02 .60 .07 .26 Self-esteem .33 .40 .11 .03 Emotion control -.19 .00 .92 .02 Stress management .14 .02 .76 -.10 Adaptability .12 .15 .35 .04 Emotion Perception -.13 .17 .00 .74 Emotion expression .05 .21 -.23 .58 Relationship skills .32 -.28 .00 .52 Empathy -.11 .02 .08 .50 Impulsiveness (low) .03 -.24 .35 .41 Note. Factor Pattern Matrix: Coefficients that should theoretically define each factor are in boldface.

Trait Emotional Intelligence -TEIQue, p. 48
Table 4.
Factor Correlation Matrix between Belgian factor scores and English factor scores (N = 740)
Well-beinga Sociabilitya Self-controla Emotionalitya
Well-beingb .997 [.982] .544 .650 .519
Sociabilityb .995 [.991] .495 .626
Self-controlb .987 [.964] .350
Emotionalityb .984 [.969]
Note. a = Factor scores derived from the Belgian factor score coefficients, b = factor scores derived from the English factor score coefficients,
Coefficients in brackets [ ] refer to congruence coefficients between factor structure (pattern matrix) in Belgian and English data set (computed
with Marley W. Watkins coefficient of congruence program, 2002).
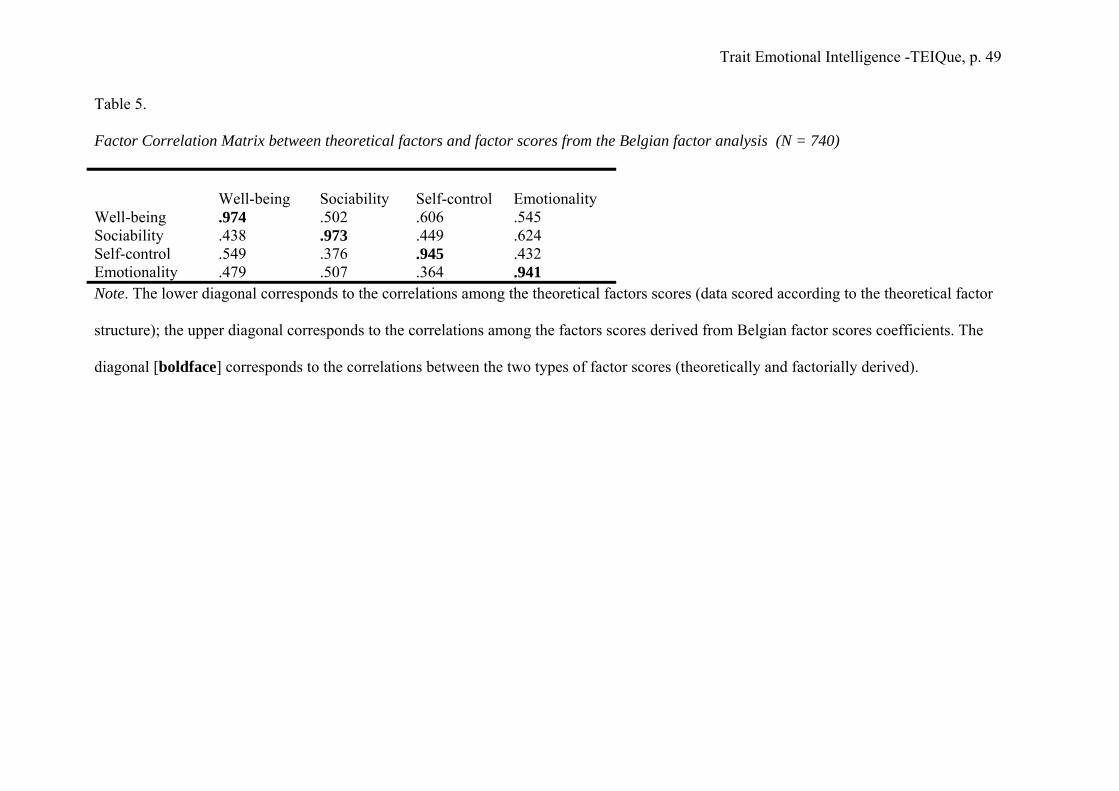
Trait Emotional Intelligence -TEIQue, p. 49
Table 5.
Factor Correlation Matrix between theoretical factors and factor scores from the Belgian factor analysis (N = 740)
Well-being Sociability Self-control Emotionality
Well-being .974 .438 .549 .479
Sociability .502 .973 .376 .507
Self-control .606 .449 .945 .364
Emotionality .545 .624 .432 .941
Note. The lower diagonal corresponds to the correlations among the theoretical factors scores (data scored according to the theoretical factor
structure); the upper diagonal corresponds to the correlations among the factors scores derived from Belgian factor scores coefficients. The
diagonal [boldface] corresponds to the correlations between the two types of factor scores (theoretically and factorially derived).

Trait Emotional Intelligence -TEIQue, p. 50
Table 6.
Comparison of mean trait EI scores as a function of the professional sector.
Trait EI factor Occupation(s) having the highest mean scores (+ Means; SD's)
Occupation(s) having the lowest mean scores (+ Means; SD's)
Differences reaching statistical significance
Global trait EI - Social/health care (4.86; 0.63) - Finance (4.88; 0.37)
- Unemployed (4.52; 0.60) social/healthcare versus unemployed: t(75) = 2.06, p ≤ .05, reffect size =.26 financiers versus unemployed : t(37) = 2.26, p ≤ .05, reffect size = .34
Well-being - Financiers (5.36; 0.65) - Unemployed (4.78; 1.10) financiers versus unemployed: t(37) = 2.00, p ≤ .055, reffect size = .31
Self-control - Social/health care (4.51; 0.82) - Finance (4.49; 0.81)
- Commerce (4.10; 0.83) - Unemployed (4.06; 1.00)
Social/healthcare versus unemployed: t(75) = 1.97, p ≤ .055, reffect size = .25 Social/healthcare versus commerce: t(77) = 1.96, p ≤ .055, reffect size = .24
Emotionality - Social/healthcare (5.13; 0.66) - Commerce (5.13; 0.63)
- Public service (4.87; 0.73) - Finance (4.83; 0.50)
Social/healthcare versus finance: t(43.76) = 2.074, p ≤ .05, reffect size = .23 Social/healthcare versus public service: t(112) = 1.95, p ≤ .055, reffect size = .18
Sociability - Commerce (5.11; 0.74) - Unemployed (4.40; 0.74) Commerce versus unemployed: t(38) = 2.97, p ≤ .005, reffect size = .43

Trait Emotional Intelligence -TEIQue, p. 51
Table 7.
Convergent, Discriminant and Criterion Validity of the TEIQue
N Mean age (SD)
Balance females/ males (in %) Total trait EI Well-being Self-control Emotionality Sociability
Convergent/discriminant validity
Optimism 91 18.36 (1.52) 85 /15 .68*** .81*** .48*** .36*** .36*** Alexithymia 457 19.53 (2.04) 77 /23 -.60*** -.36*** -.32*** -.66*** -.39***
F1: DIF 403 19.26 (1.90) 80 /20 -.55*** -.41*** -.44*** -.43*** -.33*** F2: DDF 403 19.26 (1.90) 80 /20 -.49*** -.29*** -.15** -.67*** -.34*** F3: EOT 403 19.26 (1.90) 80 /202 -.22*** -.07 -.02 -.30*** -.25***
Emotional stability 80 18.57 (1.00) 77 /23 .42*** .35*** .66*** .01 .15 Introversion 80 18.57 (1.00) 77 /23 -.17 -.24* .27* -.16 -.38*** Openness 80 18.57 (1.00) 77 /23 .41*** .34** .01 .31** .43*** Agreeability 80 18.57 (1.00) 77 /23 .47*** .48*** .33** .26* .15 Conscientiousness 80 18.57 (1.00) 77 /23 .41*** .19† .31** .40*** .28* Cognitive ability 109 19.73 (2.20) 87 /13 .04 .05 .13 .04 .00 Social desirability 131 19.43 (1.98) 68 /32 .44*** .32*** .46*** .23** .12 Criterion validity Anxiety 82 18.68 (1.03) 78 /22 -.74*** -.72*** -.59*** -.30** -.45*** Depression 82 18.68 (1.03) 78 /22 -.55*** -.67*** -.31** -.28* -.24* PQuantSS 93 18.36 (1.52) 85 /15 .23* .34*** .01 .25* .09 PQualSS 93 18.36 (1.52) 85 /15 .39*** .40*** .17† .38*** .22* State positive affectivity 306 20.01 (1.90) 67 /33 .25*** .30*** .12* .10† .15** State negative affectivity 306 20.01 (1.90) 67 /33 -.37*** -.33*** -.37*** -.23*** -.12* Emotional reactivity (N) 91 19.42 (1.96) 48/52 -.26* -.25* -.30** -.11 -.09 Emotional reactivity (S) 96 20.11 (2.17) 40/60 -.41*** -.33*** -.48*** -.15 -.24*

Trait Emotional Intelligence -TEIQue, p. 52
Note: DIF = Difficulty in identifying feelings, DDF = Difficulty in describing feelings, EOT = Externally oriented thinking, FNE = Fear of
Negative Evaluation, PQuantSS = Perceived quantity of social support, PQualSS = Perceived quality of social support, (S) = measured in stressful
conditions. ***p< 0.001; **p < 0.01 ; *p < 0.05; †p < 0.1

Trait Emotional Intelligence -TEIQue, p. 53
Table 8.
Hierarchical Regression Analyses Predicting Emotional Reactivity by Condition, Trait EI and their Interaction (N = 185).
EI Factor considered
Criterion variable
Hierar-chical order
Predictor variable
R F change
Semi-partial correlationsa
Trait EI ERI 1 Condition .525 69.87*** -.56 2 Trait EI .601 24.78*** -.29 3 Condition x trait
EI .614 4.41* .12
Well-being ERI 1 Condition .525 69.87*** -.55 2 Well-being .581 17.35*** -.25 3 Condition x well-
being .589 2.57 .10
Self-control ERI 1 Condition .525 69.87*** -.55 2 Self-control .621 32.84*** -.32 3 Condition x self-
control .633 4.64* .12
Emotionality ERI 1 Condition .525 69.87*** -.53 2 Emotionality .538 3.63† -.13 3 Condition x
emotionality .541 0.88 .06
Sociability ERI 1 Condition .525 69.87*** -.54 2 Sociability .552 7.70** -.15 3 Condition x
sociability .558 1.91 .09
Note. ERI = Emotional Reactivity Index. a These correlations are the semi-partial correlations, controlling at each step for the effects of the two others. *** p ≤ 0.001; ** p ≤ 0.005; * p ≤ 0.05; † p ≤ 0.10.

Trait Emotional Intelligence -TEIQue, p. 54
Table 9.
Hierarchical Regression Analyses testing the Incremental Validity of Trait EI over Social Desirability, Agreeableness and Emotional
Stability, to Predict Emotional Reactivity (N = 60).
Criterion variable
Forced hierar-chical order
Predictor variable
R F change
Semipartial ra
Emotional reactivity 1 Condition (neutral vs stress) .519 22.084*** -.520 2 Emotional stability .614 10.156** -.053 3 Self-control .709 11.530*** -.322
Note. Procedure: Condition was entered as a first block, social desirability, agreeableness and emotional stability were entered in a stepwise
fashion as a second block, well-being and self-control were entered in a stepwise fashion as a third block.. a these are the semipartial rs when all
variables are considered together (step 3) ***p ≤ 0.001; **p ≤ 0.01; *p ≤ 0.05; †p < 0.1.