Trait-based approaches to linking vegetation and...
26
Trait-based approaches to linking vegetation and food 1 webs in early-seral forests of the Pacific Northwest 2 3 John L Campbell (Corresponding Author) 4 Department of Forest Ecosystems and Society 5 College of Forestry 6 Oregon State University 7 Corvallis, Oregon, USA 8 Email: [email protected] 9 Phone: 1-541-737-8426 10 11 12 Daniel C Donato 13 Washington State Department of Natural Resources 14 PO Box 47014 15 Olympia, Washington, USA 16 17 18 Original Manuscript for submitted for publication in Forest Ecology and Management 19 (Special Issue on Post-disturbance Forests), August 29, 2013 20 21 Revised here in response to FEM editor and reviewer comments, November 6, 2013 22 23 Accepted for publication December, 2013 24 25 Pre-proof version 26 27
Transcript of Trait-based approaches to linking vegetation and...

Trait-based approaches to linking vegetation and food 1
webs in early-seral forests of the Pacific Northwest 2
3
John L Campbell (Corresponding Author) 4
Department of Forest Ecosystems and Society 5
College of Forestry 6
Oregon State University 7
Corvallis, Oregon, USA 8
Email: [email protected] 9
Phone: 1-541-737-8426 10
11
12
Daniel C Donato 13
Washington State Department of Natural Resources 14
PO Box 47014 15
Olympia, Washington, USA 16
17
18
Original Manuscript for submitted for publication in Forest Ecology and Management 19
(Special Issue on Post-disturbance Forests), August 29, 2013 20
21
Revised here in response to FEM editor and reviewer comments, November 6, 2013 22
23
Accepted for publication December, 2013 24
25
Pre-proof version 26
27
Abstract 28
29
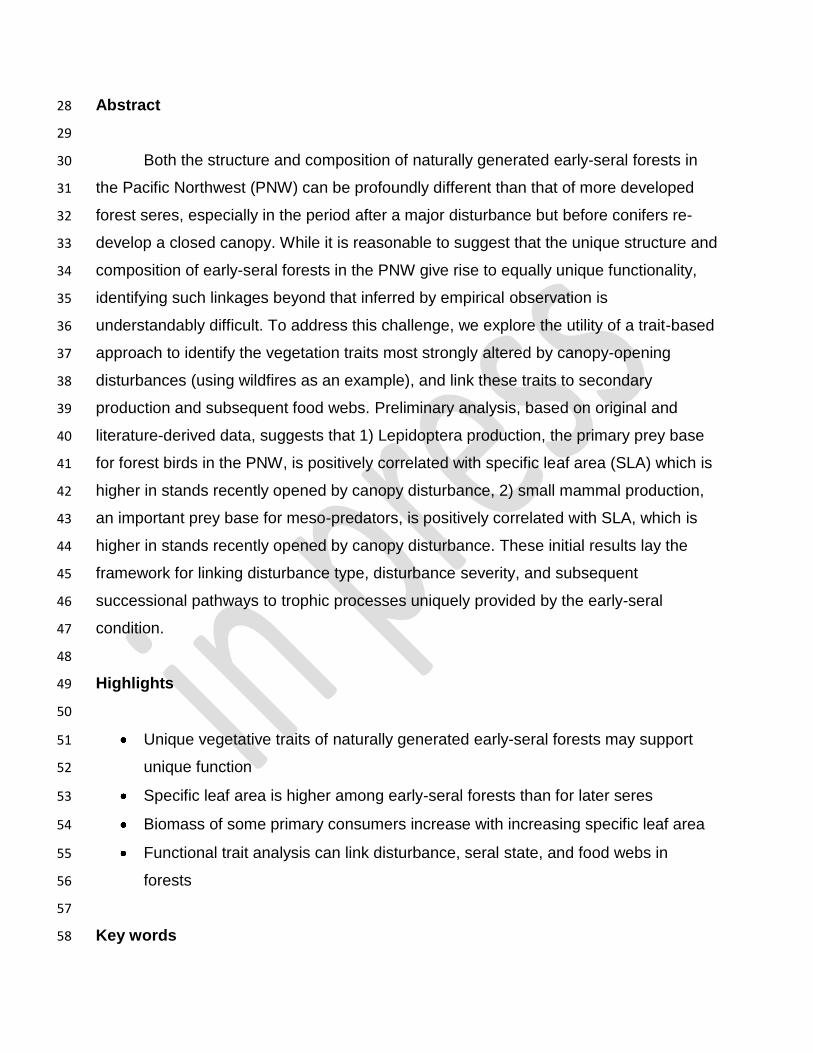
Both the structure and composition of naturally generated early-seral forests in 30
the Pacific Northwest (PNW) can be profoundly different than that of more developed 31
forest seres, especially in the period after a major disturbance but before conifers re-32
develop a closed canopy. While it is reasonable to suggest that the unique structure and 33
composition of early-seral forests in the PNW give rise to equally unique functionality, 34
identifying such linkages beyond that inferred by empirical observation is 35
understandably difficult. To address this challenge, we explore the utility of a trait-based 36
approach to identify the vegetation traits most strongly altered by canopy-opening 37
disturbances (using wildfires as an example), and link these traits to secondary 38
production and subsequent food webs. Preliminary analysis, based on original and 39
literature-derived data, suggests that 1) Lepidoptera production, the primary prey base 40
for forest birds in the PNW, is positively correlated with specific leaf area (SLA) which is 41
higher in stands recently opened by canopy disturbance, 2) small mammal production, 42
an important prey base for meso-predators, is positively correlated with SLA, which is 43
higher in stands recently opened by canopy disturbance. These initial results lay the 44
framework for linking disturbance type, disturbance severity, and subsequent 45
successional pathways to trophic processes uniquely provided by the early-seral 46
condition. 47
48
Highlights 49
50
Unique vegetative traits of naturally generated early-seral forests may support 51
unique function 52
Specific leaf area is higher among early-seral forests than for later seres 53
Biomass of some primary consumers increase with increasing specific leaf area 54
Functional trait analysis can link disturbance, seral state, and food webs in 55
forests 56
57
Key words 58

Pacific Northwest, early-seral, trait analysis, herbivory, trophic transfer, food webs, post-59
disturbance succession 60

1. Introduction 61
62
Both the structure and composition of naturally generated early-seral forests in 63
the Pacific Northwest (PNW) can be profoundly different than that of more developed 64
forest seres, especially in the period following a stand-replacing disturbance but before 65
conifers re-develop a closed canopy (see review by Swanson et al, 2011; Donato et al., 66
2012). Societal demands to accelerate forest succession following logging and natural 67
disturbances in the last 70 years has rendered the early-seral condition structurally 68
simplified and short-lived throughout much of the PNW (Hansen et al., 1991; Noss et 69
al., 2006; Ohmann et al., 2007; Spies et al, 2007). Concerns that large portions of the 70
PNW have become dominated by young, even-aged stands of Douglas-fir 71
(Pseudotsuga menziesii) have prompted a variety of alternative silvicultural activities 72
aimed at creating the structural heterogeneity believed to be important to the 73
functionality of both old-growth and naturally-regenerating early-seral forests 74
(Puettmann and Berger, 2006). However, as is the case with most restoration activities, 75
it is difficult to determine to what degree such structural modifications will impart the 76
desired functionalities, such as hydrological cycling, nutrient dynamics, and provision of 77
wildlife habitat. 78
79
One solution to linking desired ecosystem-scale function to manageable forest structure 80
is trait-based analysis (see Garnier et al., 2004; Garnier and Navas, 2012).Trait-based 81
analysis is based on the axiom that the physical character and relative abundance of 82
plant species influence ecosystem processes (Grime, 1998). Existing studies that 83
compare forest function such as nutrient cycling, primary production, or wildlife use 84
across discrete condition classes have provided direct empirical connections between 85
management activities and functional outcomes, but a full understanding of how and 86
why desirable ecosystem functions arise and are maintained could benefit hugely from 87
trait-based approaches that more explicitly consider underlying physical drivers. Such 88
approaches move beyond qualitative or discrete condition classes by scaling 89
quantitative traits of individual plants (e.g., leaf nutrient content) to entire ecosystems by 90
the relative abundance of those plants, then evaluating other aspects of ecosystem 91

function along these continuous gradients. However, despite the growing popularity of 92
trait-based approaches, they have rarely been applied to forest systems, and their utility 93
in guiding forest management remains largely untested. 94
95
In this proof-of-concept paper, we explore the utility of a trait-based approach to identify 96
the key vegetation traits strongly altered by canopy opening disturbances, and attempt 97
to link these traits to secondary production and subsequent food webs. Our specific 98
objectives are to: 99
100
1. Identify a series of quantifiable plant attributes (traits) that may best distinguish 101
the functionality of early (pre-canopy closure) seres from later closed-canopy, 102
conifer-dominated seres in the PNW. 103
2. Evaluate changes in key plant traits during early succession in the PNW. 104
3. Explore the relationship between forest-wide leaf traits in the PNW and the 105
arthropod and small mammal biomass they support. 106
107
2. Background 108
109
2.1. Food webs in early-seral forest: the knowledge gap 110
111
One of the most important yet elusive forest functions is the ability to support 112
robust food webs and associated biodiversity. Wildlife diversity is regularly mentioned 113
as one of the objectives of forest restoration, and robust food webs are often suggested 114
as a major hallmark of early-seral forests (Swanson et al., 2011). Unfortunately, our 115
understanding of forest food webs lags far behind that of aquatic systems. Most of what 116
we know about wildlife in forests is based on animals’ empirical affinity to certain 117
habitats rather than their underlying trophic support systems. 118
119
It has been postulated that the growth and allocation patterns of plants occupying 120
recently disturbed forests afford greater trophic transfer to herbivores than do plants that 121
compose mature forests (Hansen, 1994; Hagar, 2007). Cross-biome comparisons by 122

Cebrian (1999), ranging from aquatic ecosystems to grasslands to woody ecosystems, 123
suggest that communities composed of tall-statured, long-lived plants pass a smaller 124
fraction of their net primary production on to herbivores than do communities made up 125
of short-statured, short-lived plants. Similar observations were made by McNaughton et 126
al. (1989), who showed herbivory and secondary production to be positively related to 127
net primary production (NPP) across biomes in a log-log manner, but with forests 128
deviating from this pattern with less herbivory per unit NPP. The most attractive 129
explanation for this pattern involves the ratio of metabolic to structural compounds. As 130
eloquently articulated by Shurin et al. (2005), the tissues required to support and layer 131
photosynthetic organs are simply less edible than a plant’s metabolic tissues. 132
Consequently, terrestrial ecosystems afford less trophic transfer than aquatic systems, 133
and forests afford the least trophic transfer among terrestrial ecosystems. 134
135
Do these cross-biome patterns in trophic transfer apply also to forest successional 136
states, which may differ dramatically in relative allocation to structural and metabolic 137
tissue? Possibly, but the evidence to support this notion is scant. To begin with, energy 138
transfer to herbivores in forests is typically so low (about one-half percent; McNaughton 139
et al., 1989) that it often evades adequate quantification. Secondly, most all forest 140
research performed on the early-seral condition has focused on its trajectory toward 141
maturity and not the intrinsic nature of the early sere. In short, there are sound 142
theoretical reasons to believe that early-seral forests promote unique and possibly 143
larger food webs than do more advanced stages of forest development; especially in the 144
PNW where environmental conditions favor succession toward a closed canopy of long-145
lived conifers. However, without a robust framework linking measurable plant functional 146
traits to realized herbivore production, correlations between forest seral states and their 147
animal associates will remain empirical at best and anecdotal at worst. 148
149
2.2. Understanding forest function through plant functional traits 150
151
Logically, the identity and relative abundance of plant species influence 152
ecosystem processes. However, building a useful framework out of this axiom is 153
challenged by the qualitative nature of plant identity (Vitousek and others 1997; Chapin 154
and others 2000). Classifying plants into functional groups has proven somewhat useful 155
(see Weiher et al., 1999; Grime, 2001; Westoby et al., 2002), but the most robust 156
approach to date involves the quantitative scaling of specific functional traits from plant 157
to ecosystem (see Lavorel and Garnier, 2002; Garnier et al., 2004; Lavorel, 2013). 158
159
Often referred to as functional trait analysis, this approach is based on Grime’s (1998) 160
biomass ratio hypothesis, which stipulates that one can scale quantitative traits of 161
individual plants (suspected to be of functional significance) to the entire ecosystem by 162
the relative biomass of plants having such traits. In essence, the biomass ratio 163
hypothesis implies that ecosystem functioning is determined in large part by plant traits 164
weighted by their relative dominance. Not surprisingly, the most useful plant traits are 165
shown to be leaf characteristics such as leaf surface to volume ratios, leaf density, and 166
leaf chemical content, in part because they are functionally coupled to ecosystem 167
processes such as NPP, nutrient cycling, decomposition, and herbivory, but also 168
because these leaf traits are associated with fundamental trade-offs between the 169
acquisition and conservation of resources (Grime, 1979; Reiche et al., 1992; Grime et 170
al., 1997; Poorter and Garnier, 1999). 171
172
Secondary succession in forests of the PNW typically begins with the simultaneous 173
establishment of ruderal forbs, broadleaf shrubs, and very long-lived conifers (Dyrness, 174
1973), structurally complemented by large volumes of dead and surviving legacy of the 175
prior forest (Franklin et al., 2002). As a general rule, few species are lost or gained in 176
these systems over successional time, rather species change in relative abundance as 177
the initially dominant broadleaf shrubs and forbs become subordinate to conifer 178
overstories (Halpern, 1989; Halpern and Spies, 1995; Kayes et al., 2010; Wimberly and 179
Spies, 2001). While the exact structure and composition of early-seral forests in the 180
PNW vary by factors such as disturbance type, disturbance severity, site productivity, 181
and sivicultural intervention, the collection of live and dead plants that dominate early-182
seral forests do display some consistent traits that contrast with later stages of forest 183
development. The purpose of this paper is to examine measurable traits of early-seral 184
forests, consider their potential in supporting resource flow through food webs, and 185
explore the utility of trait-based analysis in characterizing trophic functionality throughout 186
forest succession in the PNW. 187
188
3. Postulating functional traits of early-seral forests in the PNW 189
190
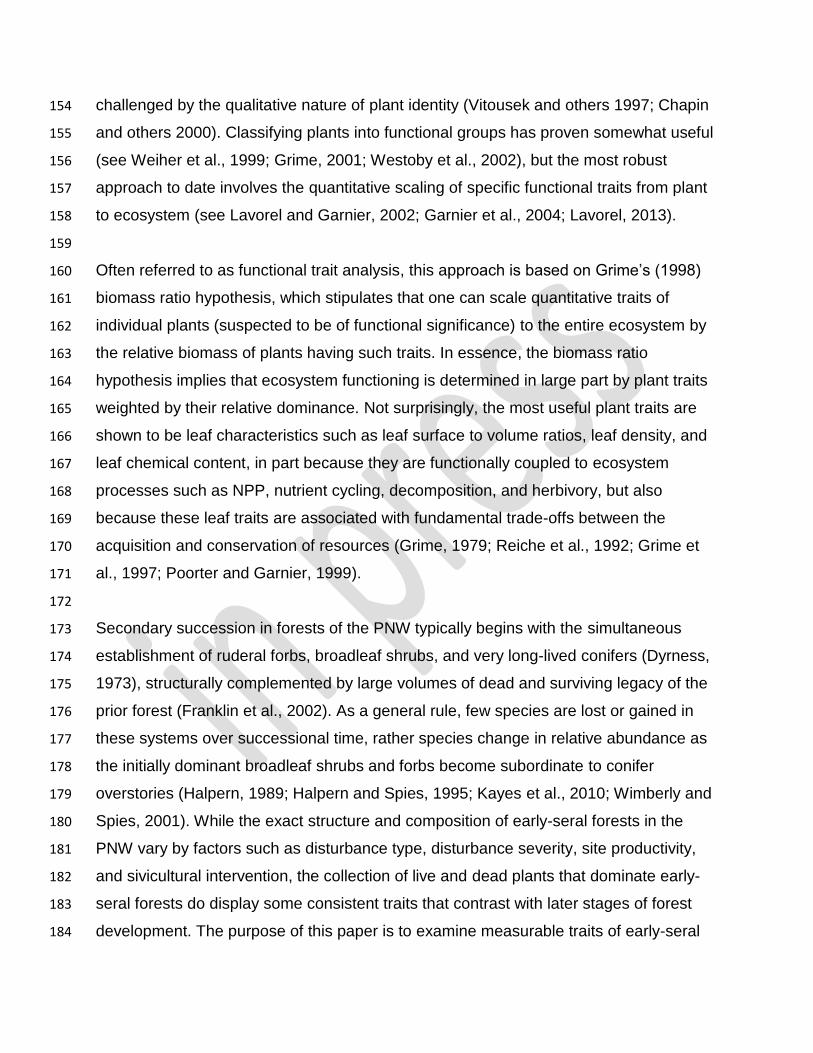
Table 1 lists a number of measurable plant traits which are scalable to the 191
ecosystem and may be particularly useful for quantifying changes in the functionality of 192
PNW forests as they develop. Because the majority of herbivory in forests is provided 193
through leaf production, leaf traits are among the most important in regulating 194
secondary production. Leaf protein concentration, phenolic concentration, specific leaf 195
area (SLA), and longevity all lend to higher leaf digestibility in early-seral forests 196
dominated by shrubs and forbs compared to conifer-dominated mid-seral forests (Table 197
1). Co-variation among these leaf traits across taxa and biomes (driven by both 198
allometric constraints and adaptive evolution) strengthens the connection between 199
seral-specific life strategies and ecosystem provision for consumers (see Poorter et al., 200
2009). However, this co-variation does make it difficult to disentangle the relative 201
importance of each specific leaf trait. 202
203
Reproductive traits such as the structure and production rates of flowers, fruits, and 204
seeds have also proven valuable in inferring ecosystem function in some systems 205
(Lavorel and Garnier, 2002). Certainly, the relative abundance of angiosperms in early-206
seral forests of the PNW affords a set of trophic pathways not fully provided by conifer-207
dominated seres. However, it remains unclear if angiosperm fruiting in early-seral 208
forests transfers more or less primary production to consumers than does conifer seed 209
production, which has been shown to be consumed at rates of up to 90% in the PNW 210
(Gashweiller, 1970). 211
212
Because stems are rarely fed upon, their live traits have not been considered 213
particularly important in driving trophic transfer. With respect to forests, however, two 214
easily quantifiable stem metrics may be especially important in characterizing trophic 215

transfer. The first of these is height. One of the most profound attributes distinguishing 216
early-seral forests from later developmental stages is that aboveground production 217
occurs at heights easily accessible by surface-dwelling herbivores. Does the average 218
height of leaves, fruit, and seeds in mature forests protect them from consumption? 219
Climbing rodents such as squirrels and specialized voles are not confined to any 220
particular canopy strata and it is unlikely that the abundance of arthropod herbivores is 221
height-dependent. Ungulate and lagomorph herbivory, however, is entirely dependent 222
on canopy height, and mice activity is largely confined to the forest floor (Kaufman et al., 223
1985). 224
225
The second important stem trait is wood density, not so much of living wood, but that of 226
dead wood as in indication of its decay status. Approximately one half of net primary 227
production in PNW forests is spent building wood (Campbell et al., 2004) and that which 228
is not combusted or exported is eventually consumed by microbes and detritivores. All 229
wood mass in a forest lies somewhere along a spectrum between live (highest density) 230
and fully decomposed (lowest density), and the transfer of wood mass to decomposers 231
and detrital consumers should be reflected by the collective average wood density. Just 232
as the biomass ratio hypothesis applies to living structures, so should it apply to dead 233
structure. Ecosystem-average wood density is easily assessed by scaling species- and 234
decay class-specific wood densities (including live wood) across plot-level inventories of 235
live and dead structures. The challenge will be to establish a useful relationship 236
between wood density and the flux of past wood production through different 237
decomposer communities. 238
239
The consideration of stem height and decay status as traits of functional significance 240
does deviate somewhat from the traditional view of adaptive plant traits in that realized 241
height and decay status are ontological rather than evolutionary. However, by including 242
these metrics in forest trait analysis, we can capture much of the functional variation 243
associated with growth, disturbance, and legacy structure, which, in the PNW, changes 244
over time much more so than floristic composition (Wimberly and Spies 2001). 245
246
4. Examples of changing traits through succession of PNW forests 247
248
4.1. Approach 249
250
After having identified specific leaf area (SLA) as among the most easily-251
measured and functionally-important ecosystem traits, we quantified early-successional 252
trends in ecosystem-averaged SLA for three different forest types in the PNW, each 253
initiated by stand-replacing wildfire. Specifically, ecosystem-averaged SLA (defined as 254
one-sided surface area of leaf per dry mass of leaf) was assessed for 11 study plots in 255
the Pacific silver fir (Abies amabilis) forest association and 10 plots in the western 256
hemlock (Tsuga heterophylla) forest association for 14 years following the 1991 Warner 257
Creek Fire (using data reported by Brown et al. 2013), and in 8 plots in the Douglas-258
fir/tanoak (Pseudotsuga menziesii / Lithocarpus densiflorus) forest association for 10 259
years following the 2002 Biscuit fire (using original data following the methods of Donato 260
et al., 2009). Ecosystem-averaged SLA was calculated as species-specific SLA 261
weighted by each species’ fractional contribution to total leaf area in a stand. Species-262
specific leaf area was calculated as field-assessed crown cover multiplied by a crown-263
form-specific estimate of Leaf Area Index (LAI). LAI=7 for mature conifer canopy 264
dominants, LAI=4 for mature hardwood co-dominants, LAI=1.5 for woody shrubs, and 265
LAI=1 for forbs (based on Campbell, unpublished data collected throughout the PNW, 266
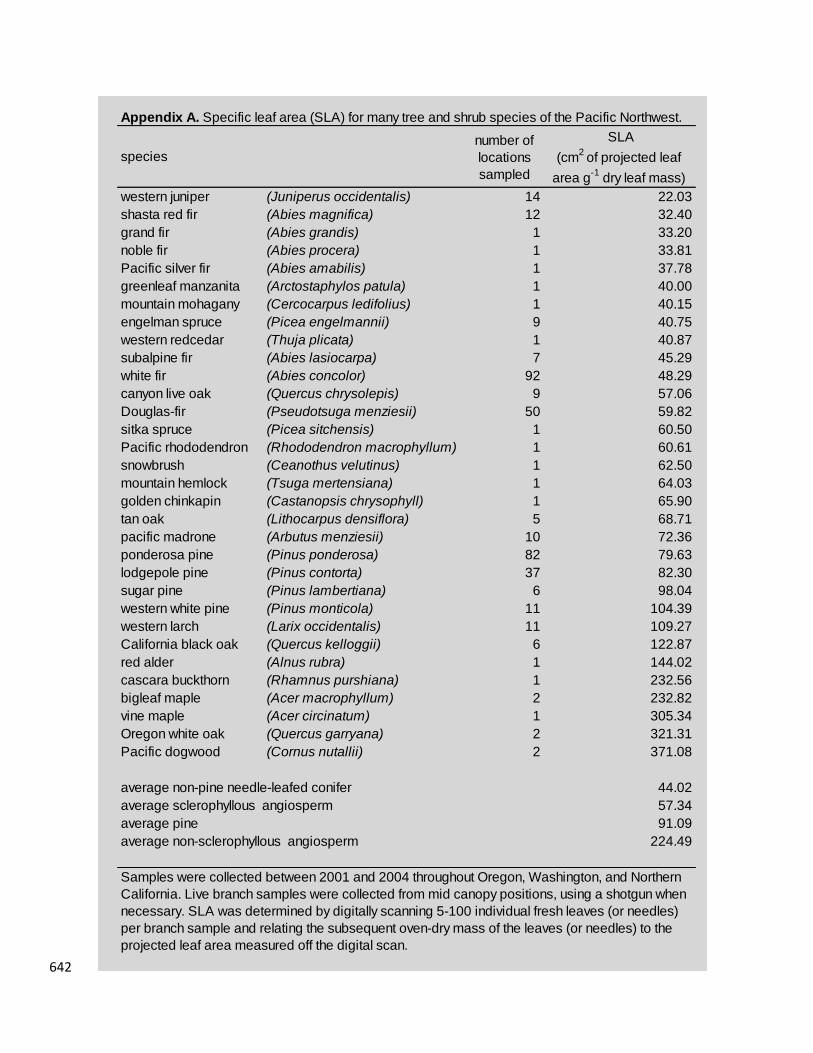
using methods described in Law et al., 2008). Values and sources of species-specific 267
SLA, which ranged from 30 cm2g-1 for incense cedar (Calocedrus decurrens) to 305 268
cm2g-1 for vine maple (Acer circinatum) are provided in Appendix A. 269
270
4.2. Evaluation 271
272
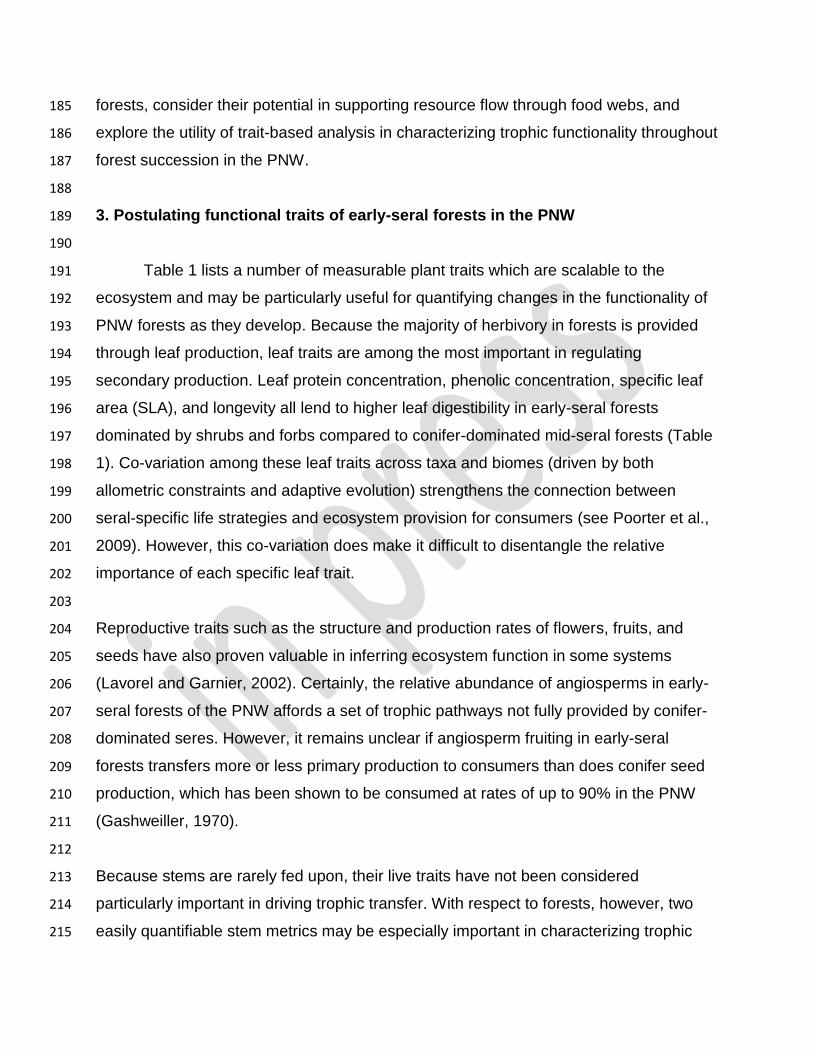
Figure 1 illustrates early-successional trends in ecosystem-averaged SLA for three 273
different forest types in the PNW, each initiated by stand-replacing wildfire. Across 274
these forests, ecosystem-averaged SLA was two to five times greater in the first year 275
following wildfire than it was for neighboring mature forests (dashed horizontal line in 276
Figure 1), owing to a temporary shift towards thinner-leaved angiosperms and away 277

from thicker-leaved conifers. Over time, increasing conifer establishment brings 278
ecosystem-averaged SLA back toward pre-burned levels. Both the magnitude and rate 279
of change vary across communities, reflecting the specific nature of succession at each 280
site. The western hemlock forests, whose mature condition supports more conifer 281
foliage than either the colder silver-fir forests or the dryer Douglas-fir/tanoak forests, 282
experience the largest but shortest-lived successional pattern in SLA. The Douglas-283
fir/tanoak forest, whose mature condition includes a co-dominant class of broadleaf 284
trees, experience the smallest but longest-lived successional pattern in SLA of those 285
reported here. Moreover, the largely sclerophyllous (thick, leathery, evergreen) nature of 286
resprouting shrubs in the Douglas-fir/tanoak forest means that the early-seral shift 287
toward angiosperms results in smaller changes in ecosystem-wide SLA. 288
289
While these examples represent only a subset of PNW forests, and only a single 290
disturbance agent, the simple observation that SLA follows a common trajectory, the 291
variation of which is explainable in terms of basic site condition, suggests that SLA is a 292
valuable metric to evaluate the functional response of these forests to disturbance and 293
help characterize the unique nature of the early-seral condition. 294
295
5. Cases of consumer responses to early-seral traits 296
297
5.1. Approach 298
299
To investigate how the fraction of forest productivity transferred to food webs might vary 300
with SLA, and the associated parameters of leaf digestibility that co-vary with SLA, we 301
considered two existing studies of canopy arthropod and small mammal biomass whose 302
data also afforded coincident assessments of forest SLA. To assess arthropod biomass 303
as a function of host plant SLA, we used data reported by Schowalter et al. (2005a and 304
2005b) collected from various locations throughout the western Cascades and northern 305
Sierras. Arthropod abundance, originally reported as count by species per kilogram of 306
vegetation sampled, was converted to biomass using genus-specific length and 307
generalized mass-to-length insect allometry (Sage, 1982). Overall, 90% of the arthropod 308
biomass reported was composed of folivores (largely Lepidoptera), with the remaining 309
biomass equally represented by homopterans (sap-suckers), predators, and 310
detritivores. 311
312
To assess small mammal biomass as a function of ecosystem-average SLA, we used 313
data reported by Garman (2001) and Dodson et al. (2012). The data reported here all 314
pertain to measurements conducted in the western hemlock forest association on 315
mature forests originated from clearcut harvesting and subsequently subject to various 316
levels of thinning designed to enhance structural complexity. Small mammal trapping 317
was conducted for two years pre-treatment and three years post-treatment using a 318
combination of Sherman live-traps and pit-fall traps designed to minimize variation in 319
capture efficiency across treatments. We converted animal abundance, which was 320
originally reported as individuals captured per trap night, to biomass captured per trap 321
night using species-specific animal mass from Wilson and Carey (2000) and Reid 322
(2006). Overall, small mammal biomass was approximately 70% Townsend’s chipmunk 323
(Neotamias townsendii), 20% Deer mouse (Peromyscus maniculatus), and 10% voles 324
(Arvicolinae) and shrews (Soricidae). We converted associated vegetation data to 325
ecosystem-average SLA using the species-specific values and sources given in 326
Appendix A. 327
328
5.2. Evaluation 329
330
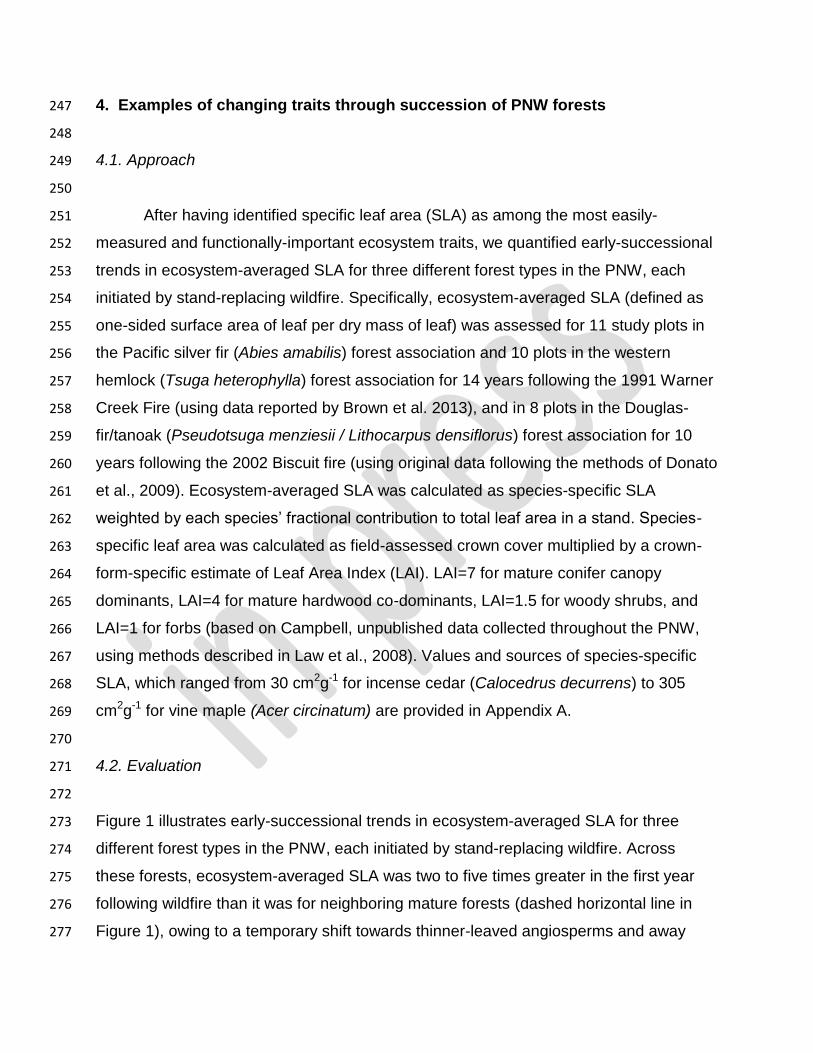
If it is the case, as we suggest above, that successional patterns in SLA affect 331
the fraction of forest productivity transferred to herbivores and their subsequent 332
predators, one may expect to see the ratio of animal biomass to plant biomass increase 333
with increasing SLA and the associated parameters of leaf digestibility that co-vary with 334
SLA. Of the two responses we evaluated (one involving canopy arthropods and one 335
involving small mammals), both show significant relationships between consumer 336
biomass and ecosystem-averaged SLA (Figure 2). 337
338

In the case of small mammals, plot-level variation in ecosystem-averaged SLA resulted 339
from vegetative response to various levels of thinning, designed to add structural 340
complexity to even-aged conifer forests (Garman, 2001; Dodson et al., 2012). Small 341
mammal biomass captured in these forests, as a fraction of total phytomass, increases 342
dramatically with increasing SLA (Figure 2). In the case of canopy arthropods, data 343
published by Schowalter et al. (2005a and 2005b) afforded direct comparison between 344
arthropod biomass per unit plant biomass and the SLA of the host vegetation. As shown 345
in Figure 2, arthropod biomass tends to be higher when the SLA of the host tree is 346
higher. 347
348
Due in part to the project-specific nature of animal capture rates, neither the small 349
mammal nor arthropod biomass trends reported here are generically applicable to other 350
forests. Still, these case studies amount to a proof of concept that leaf traits, measured 351
at the individual level and scaled to the ecosystem, can capture the relative capacity for 352
forests to support food webs over ranges experienced throughout forest succession in 353
the PNW. 354
355
6. Conclusions 356
357
This first objective of this paper was to identify easily-measured vegetation attributes 358
that would best distinguish the functionality of early-seral forests in the PNW from later-359
seral closed-canopy, conifer-dominated seres. Much like the trait-based analysis of 360
other ecosystems (Garnier et al., 2004; Poorter et al., 2009; Navas et al., 2009), we 361
suggest that leaf thickness, particularly SLA, is especially useful in quantifying potential 362
herbivory rates during the early succession of PNW forests. This utility is because SLA 363
is easily measured and scalable to the ecosystem. Furthermore, SLA co-varies with 364
other structural and nutritional qualities, which together constitute the first principles of 365
leaf digestibility (Reiche et al., 1992; Wright et al., 2004; Poorter et al., 2009). New to 366
previous trait-based analysis, we suggest that the density of all wood in a forest, 367
whether dead or alive, should be included as a metric to evaluate functionality in early-368
seral forests. Just as Grime’s (1989) biomass ratio hypothesis applies to living 369

structures, so should it apply to dead structures. The volume of legacy wood present 370
after disturbance is one of the primary axes of variation among early-seral forests in the 371
PNW and its decay status directly reflects the trophic transfer of biomass to detrital and 372
decomposer communities. As such, ecosystem-scaled measures of wood density (live 373
and dead) represent an easily measured and functionally important trait. Finally, we 374
suggest that canopy height be included in the trait analysis of early-seral forest, due to 375
its role in concentrating consumable phytomass in strata reachable by a greater number 376
of herbivores and its obvious relation to forest structural succession. 377
378
The second objective of this paper was to quantify early-successional changes in 379
ecosystem-averaged SLA and compare them to levels expressed in neighboring mature 380
seres. Variation in SLA across forest seres reflects early post-disturbance dominance 381
by broadleaf angiosperms followed by the re-establishment of conifers. Similar 382
successional trends in SLA have been reported for other regions by Garnier (2004), 383
Navas et al. (2009) and Campetella et al. (2011). Variations in SLA across forest 384
associations reflect edapho-climatic differences in conifer growth rate and the relative 385
abundance of sclerophyllous shrubs, whose SLA is intermediate between conifers and 386
thin-leaved deciduous angiosperms. These general trends come as no surprise, given 387
what we already know about the relative abundance of conifers versus broadleaves 388
during early succession in the PNW; and it could be said that Figure 1 amounts to 389
commonly-acknowledged patterns in broadleaf abundance expressed in new units. 390
However, even the simple re-expression of broadleaf abundance into SLA allows us to 391
more precisely capture successional variation in leaf structure and theoretically brings 392
us closer to the underlying mechanisms by which floristic composition may drive trophic 393
transfer at the ecosystem scale. Furthermore, the five-fold variation in SLA we observed 394
among forest seres means that this easily-measured and scalable axis of leaf structure 395
has strong potential as a cross-site functional indicator in the PNW. 396
397
The third objective of this paper was to explore the relationship between forest-wide leaf 398
traits in the PNW and the arthropod and small mammal biomass they support. In both 399
cases, the animal biomass supported per unit leaf biomass was positively and 400

significantly correlated with leaf SLA. Again, it may be said that these trends amount to 401
previously-established relationships between shrub and animal abundance in PNW 402
forests (Sullivan, 1979; Corn et al., 1988; Hammond and Miller, 1998; Fontaine, 2009), 403
and despite the theoretical relationship between SLA and foliar digestibility, the animal 404
responses shown in Figure 2 could be reflecting habitat affinity as much as actual 405
trophic transfer. However, given the number of top-down factors that could cloud a 406
detectable relationship between metrics of leaf digestibility and capturable consumer 407
biomass, it is encouraging to see significant and sensible trends in the first two 408
responses considered. 409
410
By itself, this analysis can neither quantify nor confirm functional connections between 411
the structural attributes of early-seral forests and their particular capacity to support food 412
webs. However, the patterns reported here prove the utility of trait analysis in 413
characterizing trophic functionality throughout forest succession in the PNW. Further 414
research must involve characterization of metrics beyond SLA across a much broader 415
range of early-seral conditions. Due to the paucity of studies targeting the natural early-416
seral condition, an expansion of ground-based studies is warranted (Donato et al, 417
2012). Additionally many functionally-relevant metrics (including SLA, leaf longevity, live 418
and dead wood density, and canopy height) could be computed from existing Forest 419
Service inventory plots. Comparing the functional traits of targeted, rare, early-seral 420
conditions to populations of inventory plots would go a long way toward understanding 421
how unique, or potentially redundant, early-seral functions really are across the 422
landscape. Regarding animal responses to vegetation traits, there are a number of 423
existing studies (largely involving birds and small mammals) that have quantified animal 424
abundance across discrete forest conditions (typically resulting from various 425
management prescriptions). As done for the studies here, more data can be re-426
computed to reflect biomass as a function of continuous vegetation traits. In conclusion, 427
this preliminary investigation lays a framework for linking disturbance type, disturbance 428
severity, and subsequent successional pathways to trophic processes uniquely provided 429
by the early-seral condition of PNW forests. 430
431

432
6. References 433
434
Brown, M.J., Kertis, J., Huff, M.H., 2013. Natural tree regeneration and coarse woody 435
debris dynamics after a forest fire in the western Cascade Range. Res. Pap. PNW-436
RP-592. Portland, OR: U.S. Department of Agriculture, Forest Service, Pacific 437
Northwest Research Station. 50 p. 438
Bryant, J.P., Chapin III, F.S., Klein, D.R., 1983. Carbon/nutrient balance of boreal plants 439
in relation to vertebrate herbivory. Oikos. 40:357–368 440
Campbell, J.C., Alberti, G., Law, B.E., 2008. Carbon dynamics of a Ponderosa pine 441
plantation following fuel reduction treatment in the northern Sierra Nevada. Forest 442
Ecology and Management. 275:453-463. 443
Campbell, J.L., Sun, O.J., Law, B.E., 2004a. Disturbance and net ecosystem production 444
across three climatically distinct landscapes. Global Biogeochemical Cycles. 445
18:GB4017. 446
Campbell, J.L., Sun, O.J., Law, B.E., 2004b. Supply-side controls on soil respiration 447
among Oregon forests. Global Change Biology. 10:1857-1869. 448
Campetella, G., Zoltan, B., Wellstein, C., Canuiio, R., Gatto, S., Chelli, S., Mucina, L., 449
Bartha, S., 2011. Patterns of plant trait–environment relationships along a forest 450
succession Chronosequence. Agriculture, Ecosystems and Environment. 145: 38-451
48. 452
Cebrian, J., 1999. Patterns in the Fate of Production in Plant Communities. The 453
American Naturalist. 154(4):449-468. 454
Chapin, F. S., III, Zavaleta, E. S., Eviner, V. T., Naylor, R. L., Vitousek, P. M., Reynolds, 455
H. L., Hooper, D. U., Lavorel, S., Sala, O. E., Hobbie, S. E., Mack, M. C., Dı´az, S., 456
2000. Consequences of changing biodiversity. Nature. 405:234-242. 457
Colley, P.D., Bryant J.P., Chapin, F.S. III. 1985. Resource availability and plant 458
antiherbivore defense. Science 230(4728): 895-899. 459
Corn P.S., Bury, R.B., Spies, T.A., 1988. Douglas-Fir Forests in the Cascade Mountains 460
of Oregon and Washington: Is the Abundance of Small Mammals Related to Stand 461
Age and Moisture? USDA Forest service GTR 166. 462
Dodson, E. K., Ares, A., Puettmann, K.J., 2012. Early responses to thinning treatments 463
designed to accelerate late successional forest structure in young coniferous stands 464
of western Oregon, USA. Canadian Journal of Forest Research. 42(2): 345-355. 465
Donato, D.C., Fontaine, J.B., Robinson, W.D., Kauffman, J.B., Law, B.E., 2009. 466
Vegetation response to a short interval between high-severity wildfires in a mixed-467
evergreen forest. Journal of Ecology. 97:142–154. 468
Donato, D.C., Campbell, J.L., Franklin, J.F., 2012. Multiple successional pathways and 469
precocity in forest development: Can some forests be born complex? Journal of 470
Vegetation Science. 23:576-584. 471
Dyrness, C.T., 1973. Early stages of plant succession following logging and burning in 472
the western Cascades of Oregon. Ecology. 54(1): 57-69. 473
Fontiane J.B., 2009 Influences of High Severity Fire and Postfire Logging on Avian and 474
Small Mammal Communities of the Siskiyou Mountains, Oregon, USA. PhD 475
Dissertation. Department of Fisheries and Wildlife, Oregon State University, 476
Corvallis, OR. 477
Franklin, J.F., Dyrness, C.T., 1988. Natural vegetation of Oregon and Washington. 478
Corvallis, OR: Oregon State University Press, Corvallis, Oregon. 479
Franklin, J.F., Spies, T.A., Van Pelt, R., et al., 2002. Disturbances and structural 480
development of natural forest ecosystems with silvicultural implications, using 481
Douglas-fir forests as an example. Forest Ecology and Management. 155:399-423. 482
Garman, S.L., 2001. Response of Ground-dwelling Vertebrates to Thinning Young 483
Stands: The Young Stand Thinning and Diversity Study. Report submitted to the 484
Cascade Center for Ecosystem Management Blue River Ranger District Willamette 485
National Forest Blue River, OR 97413. Available at: http://andrewsforest.oregonstate 486
.edu/research/related/ccem/pdf/smallmammals.pdf 487
Garnier, E., Navas, M.L., 2012. A trait-based approach to comparative functional plant 488
ecology: concepts, methods and applications for agroecology: A review. Agronomic 489
Sustainable Development. 32:365-399. 490
Garnier, E., J., Cortez, G., Bille` s, M.L., Navas, C., Roumet, M., Debussche, G., 491
Laurent, A., Blanchard, D., Aubry, A., Bellmann, C., Neill, J.P., Toussaint, 2004. 492
Plant functional markers capture ecosystem properties during secondary 493
succession. Ecology. 85:2630-2637. 494
Gashwiler, J. S., 1970. Plant and mammal changes on a clearcut in west-central 495
Oregon. Ecology. 51:1018-1026. 496
Grime, J. P., 1998. Benefits of plant diversity to ecosystems: immediate, filter and 497
founder effects. Journal of Ecology. 86:902–910. 498
Grime, J. P., 2001. Plant strategies, vegetation processes, and ecosystem properties. 499
Second edition. John Wiley and Sons, Chichester, UK. 500
Grime, J.P., 1979. Plant strategies and Vegetation Processes. John Wiley & Sons, 501
Chichester, UK. 502
Grime, J.P., Thompson, K., Hunt, R. et al., 1997. Integrated screening validates primary 503
axis of specialization in plants. Oikos. 79:259-281. 504
Hagar, J.C. 2007. Wildlife species associated with non-coniferous vegetation in Pacific 505
Northwest conifer forests: A review. Forest Ecology and Management . 246:108-122. 506
Halpern, C.B., 1989. Early successional patterns of forest species: Interactions of life 507
history traits and disturbance. Ecology. 70(3):704-720. 508
Halpern, C.B., Spies, T.A., 1995. Plant species diversity in natural and managed forests 509
of the Pacific Northwest. Ecological Applications. 5(4): 913-934. 510
Hammond, P.C., Miller, J.C., 1998. Comparison of the biodiversity of Lepidoptera within 511
three forested ecosystems. Annals of the Entomological Society of America. 91:323-512
328. 513
Hansen, A.J., Vega, R.M., McKee, A.W., Moldenke, A., 1994. Ecological Processes 514
Linking Forest Structure and Avian Diversityin Western Oregon, in: Boyle, T.B., 515
Boyle C.B., (Eds.) Biodiversity, Temperate Ecosystems, and Global Change. NATO 516
ASI Series 1, Vol. 1. Springer-Verlag, Berlin. 517
Hansen, A.J., Spies, T.A., Swanson, F.J., Ohmann, J.L., 1991. Conserving Biodiversity 518
in Managed Forests. Bioscience. 41(6): 382-392. 519
Jenkins, J.C., Chojnacky, D.C., Heath, L.S., Birdsey, R.A., 2004. Comprehensive 520
Database of Diameter-based Biomass Regressions for North American Tree 521
Species. Gen. Tech. Rep. NE-319. Newtown Square, PA: U.S. Department of 522
Agriculture, Forest Service, Northeastern Research Station. 45 p. 523
Kaufman, D.W., Peak, M.E., Kaufman, G.A., 1985. Peromyscus leucopus in Riparian 524
Woodlands: Use of Trees and Shrubs. Journal of Mammalogy. 66(1):139-143. 525
Kayes, L.J., Anderson, P.D., Puettmann, K.J., 2010. Succession among and within 526
structural layers following wildfire in managed forests. Journal of Vegetation 527
Science. 21:233-247. 528
Keeling, H.C., Philips, O.L., 2007. The global relationship between forest productivity 529
and biomass. Global Ecology and Biogeography. 16:618 -631. 530

Kwit, C., Levey, D.J., Greenberg, C.H., Pearson, S.F., McCarty, J.P., Sargent, S., 531
Mumme, R. L., 2004. Fruit abundance and local distribution of wintering Hermit 532
Thrushes (Catharus guttatus) and Yellow-rumped Warblers (Dendroica coronata) in 533
South Carolina. The Auk. 121:46-57. 534
Lavorel, S., 2013. Plant functional effects on ecosystem services. Journal of Ecology. 535
101:4-8. 536
Lavorel, S., Garnier, E., 2002. Predicting Changes in Community Composition and 537
Ecosystem Functioning from PlantTraits: Revisiting the Holy Grail. Functional 538
Ecology, 16(5):545-556. 539
Law, B.E., Turner, D., Campbell, J.L., Sun, O.J., VanTuyl, S., Ritts W.D., Cohen, W.B., 540
2004. Disturbance and Climate Effects on Carbon Stocks and Fluxes Across 541
Western Oregon USA. Global Change Biology. 10:1429-1444. 542
Law, B.E., Arkebauer, T., Campbell, J.L., Chen, J., Sun, O., Schwartz, M., Van Ingen, 543
C., Verma, S., 2008. Terrestrial Carbon Observations: Protocols for Vegetation 544 Sampling and Data Submission. Report 55, Global Terrestrial Observing System. 545
FAO, Rome. 87 pp. 546
Lowman, M.D., 1992. Leaf Growth Dynamics and Herbivory in Five Species of 547
Australian Rainforest Canopy Trees. Journal of Ecology. 80(3):433-447. 548
Matsuki, S., Koike, T., 2006. Comparison of Leaf Life Span, Photosynthesis and 549
Defensive Traits Across Seven Species of Deciduous Broad-leaf Tree Seedlings. 550
Annals of Botany. 97:813-817. 551
Mattson W., 1980. Herbivory in Relation to Plant Nitrogen Content. Annual Review of 552
Ecology and Systematics. 11:119-161. 553
McNaughton, S.J., Oesterheld, M., Frank, D.A., Williams, K.J., 1989. Ecosystem-level 554
patterns of primary productivity and herbivory in terrestrial habitats. Nature. 341:142-555
144. 556
Moegenburg, S.M., Levey, D.J., 2003. Are fruit and frugivore abundances linked? An 557
experimental study of short-term responses. Ecology. 84:2600-2612. 558
Ohmann, J.L., Gregory, M.J., Spies, T.A., 2007. Influence of environmental, 559
disturbance, and ownership, on forest vegetation of coastal Oregon. Ecological 560
Applications. 17(1):18-33. 561
Navas, M.L., Roumet, C., Bellmann, A., Lauret, G., Garnier, E., 2009. Suites of plant 562
traits in species from different stages of a Mediterranean secondary succession. 563
Plant Biology. 12:183–196. 564
Noss, R.F., Franklin, J.F., Baker, W.L. Schoennagel, T., Moyle, P.B., 2006. Managing 565
fire-prone forests in the western United States. Frontiers in Ecology and the 566
Environment. 4:48-487. 567
Poorter, H., Garnier, E., 1999. Ecological significance of inherent variation in relative 568
growth rate and its com-ponents, in: Pugnaire, F.I., F. (Eds.) Valladares Handbook 569
of Functional Plant Ecology, Marcel Dekker, New York. pp. 81-120. 570
Poorter, H., Niinemets, U., Poorter, L., Wright, I.J., Villar, R., 2009. Causes and 571
consequences of variation in leaf mass per area (LMA): a meta-analysis. New 572
Phytologist. 182: 565–588. 573
Puettmann, K.J., Berger, C.A., 2006. Development of tree and understory vegetation in 574
young Douglas-fir plantations in western Oregon. Western Journal of Applied 575
Forestry. 21(2):94-101. 576
Reich, P.B., Walters, M.B., Ellssvorth, D.S., 1992. Leaf lifespan in relation to leaf, plant 577
and stand characteristics among diverse ecosystems. Ecological Monographs. 578
62(3): 365-392. 579
Reid, F.A., 2006. A Field to Mammals of North America. Fourth edition. Houghton Mifflin 580
Co. Boston, Mass. 581
Sage, R.D., 1982. Wet and dry-weight estimates of incesct and spiders based on 582
length. American Midland Naturalist. 108(2): 407-411. 583
Schowalter, T.D., Zhang, Y.L., 2005. Canopy arthropod assemblages in four overstory 584
and three understory plant species in mixed-conifer old-growth forest in California. 585
Forest Science. 51: 233-242. 586
Schowalter, T.D., Zhang, Y.L., Progar, R.A., 2005. Canopy arthropod response to 587
density and distribution of green trees retained after partial harvest. Ecological 588
Applications 15: 1594-1603. Appendix A1: Ecological Archives A015-047-A1. 589
Shaw D.C., Emest, K.A., Rinker, H.B., Lowman, M.D., 2006. Stand-level herbivory in an 590
old-growth conifer forest canopy. Western North American Naturalist. 66(4):473-481. 591
Shurin, J.B., Gruner, D.S., Hillebrand, H., 2006. All Wet or Dried Up? Real Differences 592
between Aquatic and Terrestrial Food Webs. Proceedings of the Royal Scoiety: 593
Biological Sciences. 273(1582):1-9. 594
Sullivan, T.P., 1979. Demography of populations of deer mice in coastal forest and 595
clear-cut (logged) habitats. Canadian Journal of Zoology. 57:1636-1648. 596

Spies, T.A., McComb, B.C., Kennedy, R.S.H., McGrath, M.T., Olsen, K., Pabst, R.J., 597
2007. Potential effects of forest policies on terrestrial biodiversity in a multi-598
ownership province. Ecological Applications. 17(1):48–65. 599
Swanson, M.E., Franklin, J.F., Beschta, R.L., Crisafulli, C.M., DellaSala, D.A., Hutto, 600
R.L., Lindenmayer, D.B., Swanson, F.J., 2011. The forgotten stage of forest 601
succession: early successional ecosystems on forest sites. Frontiers in Ecology and 602
Environment. 9:117–125. 603
Turner, P.D., Ritts, D., Law, B., Cohen W., Yang, Z., Hudiburg, T., Campbell, J., Duane, 604
M., 2007. Scaling net ecosystem production and net biome production over a 605
heterogeneous region in the western United States. Biogeosciences. 4(4): 597-612. 606
Vitousek, P.M., Mooney, H.A., Lubchenco, J., Mellilo, J.M., 1997. Human domination of 607
earth’s ecosystems. Science 277:494–499. 608
Westoby, M., Falster, D.S., Moles, A.T., Vesk, P.A., Wright. I.J., 2002. Plant ecological 609
strategies: some leading dimensions of variation between species. Annual Review of 610
Ecology and Systematics 33:125–159. 611
Wilson S., Carey, E.B., 2000. Legacy Retention Versus Thinning: Influences on Small 612
Mammals. Northwest Science. 74(2): 131-145. 613
Wimberly M.C., Spies, T.A., 2001. Influences of environment and disturbance on forest 614
patterns in coastal Oregon watersheds. Ecology. 82(5):1443-1459. 615
Wright, I.J., Reich, P.B., Westboy, M., et al., 2004. The worldwide leaf economics 616
spectrum. Nature. 428:821-827. 617
618

Figure captions 619
Figure 1. Ecosystem-scaled SLA of early-seral forests initiated by high-severity wildfire. 620
Circles are the average values among 10 to 12 replicate study plots. Dashed lines show 621
the ecosystem-scaled SLA in neighboring undisturbed mature stands. Data for the 622
Western hemlock and Pacific silver fir forests are from Brown et al. (2013). Data for the 623
Douglas-fir / tanoak forests are original data for this study. SLA (Specific Leaf Area) is a 624
measure of leaf area per unit leaf mass, which in the Pacific Northwest, is higher for 625
angiosperm-dominated early-seral forests than for conifer-dominated mature forests. 626
Figure 2. Biomass of primary consumers per biomass of forest foliage as a function of 627
SLA. Small mammal data are from Garman (2001) and Dodson et al. (2012) where 628
variation in SLA arose from vegetation responses to prescribed canopy removal. 629
Arthropod data are from Scholwater et al. (2005a and 2005b) where variation in SLA 630
resulted from stratified sampling of tree and shrub species. 2-parameter sigmoidal 631
equation fits small mammal data with R2 =0.83 (p<0.001); 2-parameter linear equation 632
fits arthropod data with R2 =0.34 (p<0.01). 633

634
shru
b-d
om
inate
d
early-s
era
l
conife
r-dom
inate
d
mid
-sera
l
leaf tr
aits
pro
tein
concentr
atio
nH
igh n
itrogen d
em
ands o
f hete
rotr
ophic
tis
sue g
row
th e
xpla
in fore
st herb
ivore
pre
fere
nce tow
ard
leave
s w
ith
hig
h p
rote
in c
onte
nt (M
attson, 1980; B
ryant et al.,
1983).
hig
hlo
w
poly
saccarid:p
henolic
ratio
Hig
h d
igestib
le fra
ctio
n p
rom
ote
s le
af herb
ivory
.hig
hlo
w
Specifi
c L
eaf A
rea (
SLA
)T
hin
ner
leave
s a
fford
hig
her
gas e
xchange thus c
o-v
ary
with
above
mentio
ned d
imensio
ns o
f dig
estib
ility
(Wright et al.,
2004).
Herb
ivory
of fo
rest bro
adle
ave
s 2
-40 x
that of conife
rs (
Shaw
et al.,
2006; K
eelin
g a
nd
Phili
ps, 2007).
hig
hlo
w
leaf tu
rnove
r ra
teT
he s
tructu
ral r
equirem
ents
and c
hem
ical d
efe
nses a
fford
ed lo
nger-
lived le
ave
s r
ender
them
less d
igestib
le
than s
hort
er-
lived le
ave
s (
Cole
y et al.
1985; M
ats
uki
, 2006);
but see e
vidence to the c
ontr
ary
(Low
man, 1992).
hig
hlo
w
repro
ductiv
e tra
its
polle
n a
nd n
ecta
rT
his
hig
h-e
nerg
y fo
od s
ourc
e is
the s
ole
tro
phic
path
way
for
entir
e g
uild
s o
f both
vert
ebra
te a
nd n
on v
ert
ebra
te
oblig
ate
nectiv
ore
s.
hig
hlo
w
fleshy
fruit
pro
ductio
nH
igh-c
alo
rie a
nd s
easonally
-im
port
ant fo
od s
ourc
e for
many
vert
ebra
te c
onsum
ers
(M
oegenburg
and L
eve
y,
2003; K
wit
et al.,
2004)
hig
hlo
w
seed p
roductio
nH
igh-c
alo
rie a
nd s
easonally
-im
port
ant fo
od s
ourc
e for
many
vert
ebra
te c
onsum
ers
. S
eed a
bundance
corr
ela
ted w
ith m
ouse a
nd s
mall
birds in
early
sera
l fore
sts
(G
ashw
iller,
1970).
hig
h o
r lo
whig
h o
r lo
w
root tr
aits
root tu
rnove
r ra
teF
ine r
oot tu
rnove
r (r
ecip
rical t
o r
oot siz
e)
contr
ibute
s c
onsum
able
bio
mass to r
hiz
osphere
and a
ssocia
ted s
oil
bio
ta. C
orr
ela
ted w
ith le
af pro
ductio
n a
nd s
oil
hete
rotr
ophic
respiratio
n (
Cam
pbell
et al.,
2004).
hig
hlo
w
respro
utin
g r
ate
Respro
utin
g c
apacity
afford
s r
apid
recove
ry o
f prim
ary
and s
econdary
pro
ductio
n follo
win
g c
anopy-
killi
ng
eve
nts
(F
ontia
ne, 2009, D
onato
et al,
2009).
Str
ictly
speaki
ng o
nly
a p
rom
ote
r of oth
er
traits
.hig
hlo
w
ste
m tra
its
fractio
nal a
llocatio
n to
ste
m
With
ste
m w
ood b
ein
g the le
ast dig
estib
le o
f all
pla
nt tis
sues, gre
ate
r allo
catio
n to le
ave
s a
nd fru
it support
s
more
herb
ivory
.lo
whig
h
sta
ture
Short
sta
ture
pla
nts
afford
more
herb
ivory
by
gro
und-d
welli
ng c
onsum
ers
(S
haw
et al.,
2006)
low
hig
h
density
(of dead w
ood a
t
curr
ent decay
sta
te)
This
tra
it is
diff
ere
nt fr
om
the o
thers
in that it
quantif
ies a
conditi
on s
tate
rath
er
than a
n a
daptiv
e tra
it. H
ow
eve
r
sin
ce tre
e w
ood is
consum
ed lo
ng a
fter
tree d
eath
, a fore
st's
insta
nta
neous c
apacity
to s
upport
consum
ers
depends o
n c
olle
ctiv
e a
ttribute
s o
f both
live
and d
ead p
lants
. D
ead w
ood d
ensity
loss in
dic
ate
s tra
nsfe
r of
energ
y to
detr
itivo
res a
nd fungal c
om
muniti
es
hig
h o
r lo
whig
h o
r lo
w
Ta
ble
1. S
ca
lab
le p
lant tr
aits functio
na
lly r
ele
vant to
tro
phic
tra
nsfe
r in
fo
rest e
co
sys
tem
s
Pla
nt tr
ait
(scala
ble
to e
cosyste
m u
sin
g
bio
mass r
atio h
ypoth
esis
)
Eco
sys
tem
Functio
n(p
rocess a
nd e
xam
ple
s o
f tr
ait foste
ring t
rophic
tra
nsfe
r
in t
em
pera
te fore
st
ecosyste
ms)
ecosyste
m-a
vera
ge t
rait v
alu
e in
Pacifi
c N
ort
hw
est
fore
sts
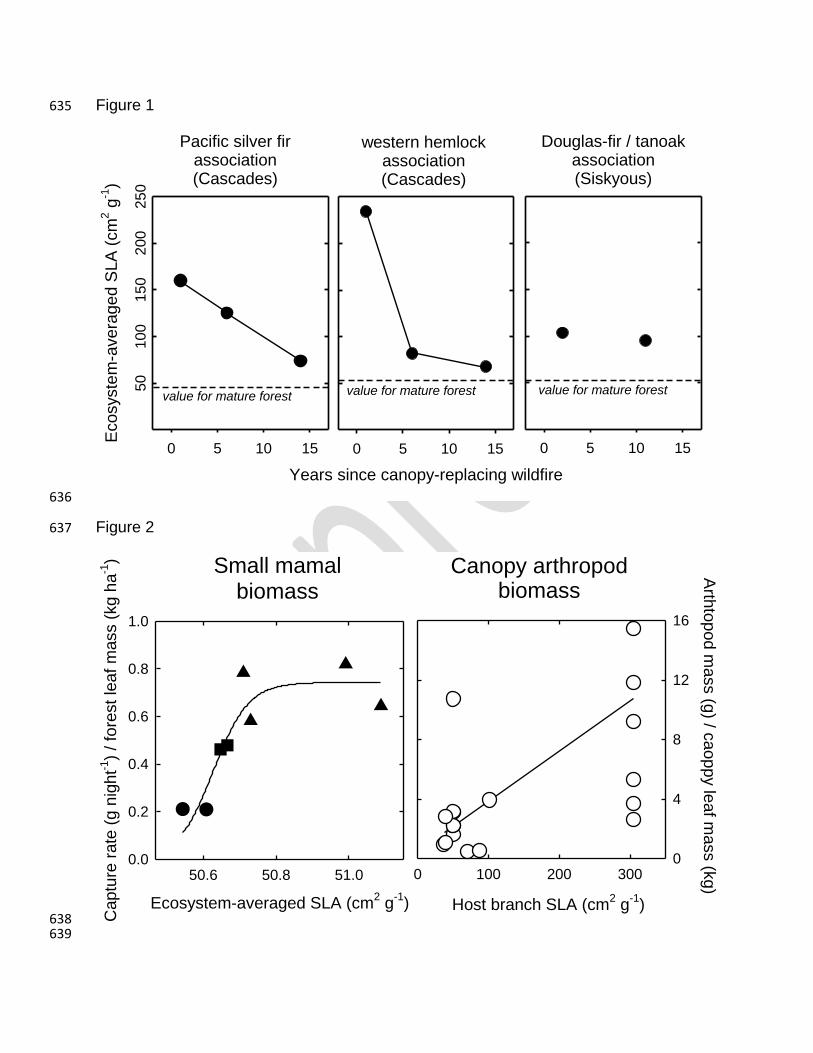
Figure 1 635
636
Figure 2 637
638 639
Pacific silver firassociation(Cascades)
0 5 10 15
Ecosyste
m-a
vera
ged S
LA
(cm
2 g
-1)
50
100
150
200
250
western hemlockassociation(Cascades)
Years since canopy-replacing wildfire
0 5 10 15
Douglas-fir / tanoakassociation(Siskyous)
0 5 10 15
value for mature forest value for mature forest value for mature forest
Small mamalbiomass
Ecosystem-averaged SLA (cm2 g
-1)
50.6 50.8 51.0
Captu
re r
ate
(g n
ight-1
) /
fore
st
leaf
mass (
kg h
a-1
)
0.0
0.2
0.4
0.6
0.8
1.0
Canopy arthropodbiomass
Host branch SLA (cm2 g
-1)
0 100 200 300
Arth
topod m
ass (g
) / caoppy le
af m
ass (k
g)
0
4
8
12
16
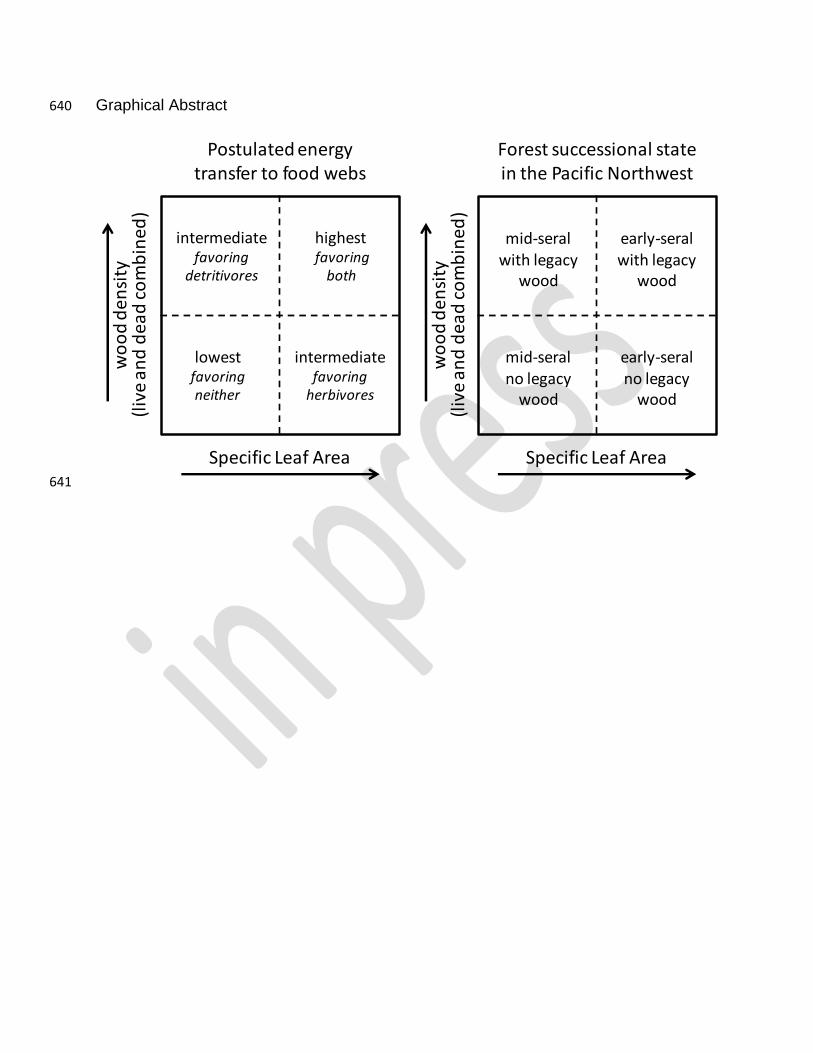
Graphical Abstract 640
641
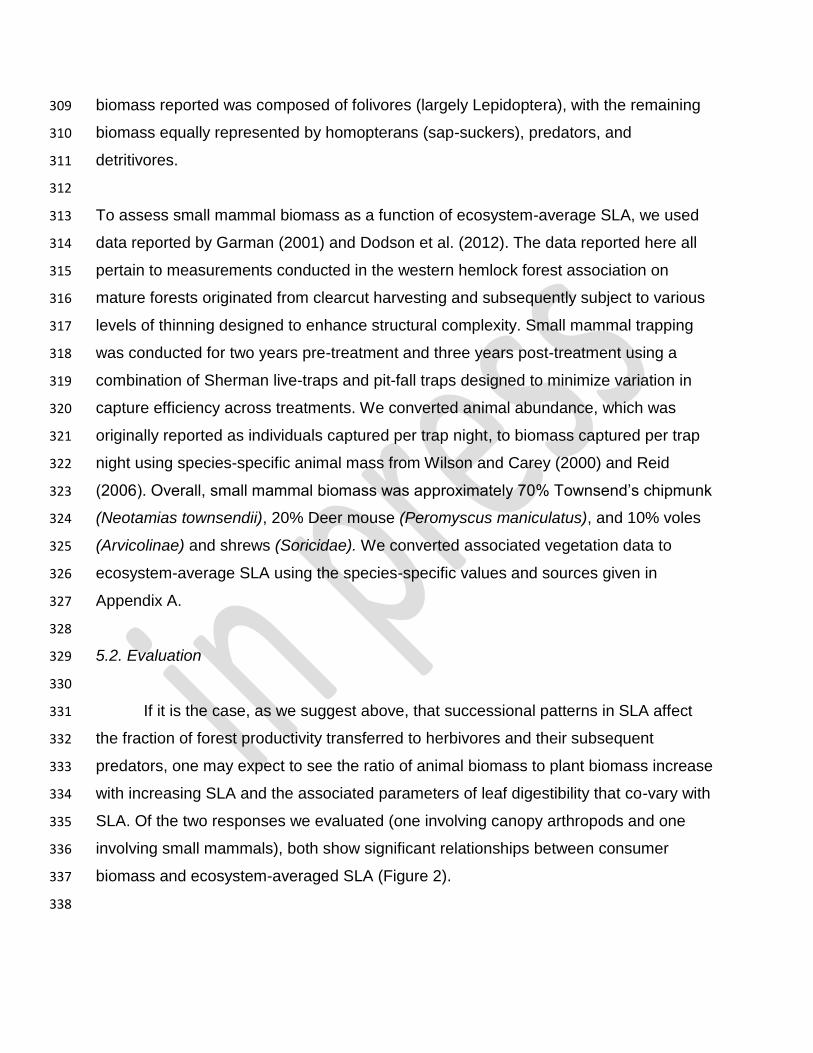
Specific Leaf Area
Postulated energy transfer to food webs
highestfavoring
both
intermediatefavoring
detritivores
intermediatefavoring
herbivores
lowestfavoringneither
Specific Leaf Areaw
oo
d d
ensi
ty(l
ive
an
d d
ead
co
mb
ined
)
Forest successional statein the Pacific Northwest
early-seralno legacy
wood
mid-seralno legacy
wood
early-seral with legacy
wood
mid-seral with legacy
wood
wo
od
de
nsi
ty(l
ive
an
d d
ead
co
mb
ined
)
642
Appendix A. Specific leaf area (SLA) for many tree and shrub species of the Pacific Northwest.
number of
locations
sampled
SLA
(cm2
of projected leaf
area g-1
dry leaf mass)
western juniper (Juniperus occidentalis) 14 22.03
shasta red fir (Abies magnifica) 12 32.40
grand fir (Abies grandis) 1 33.20
noble fir (Abies procera) 1 33.81
Pacific silver fir (Abies amabilis) 1 37.78
greenleaf manzanita (Arctostaphylos patula) 1 40.00
mountain mohagany (Cercocarpus ledifolius) 1 40.15
engelman spruce (Picea engelmannii) 9 40.75
western redcedar (Thuja plicata) 1 40.87
subalpine fir (Abies lasiocarpa) 7 45.29
white fir (Abies concolor) 92 48.29
canyon live oak (Quercus chrysolepis) 9 57.06
Douglas-fir (Pseudotsuga menziesii) 50 59.82
sitka spruce (Picea sitchensis) 1 60.50
Pacific rhododendron (Rhododendron macrophyllum) 1 60.61
snowbrush (Ceanothus velutinus) 1 62.50
mountain hemlock (Tsuga mertensiana) 1 64.03
golden chinkapin (Castanopsis chrysophyll) 1 65.90
tan oak (Lithocarpus densiflora) 5 68.71
pacific madrone (Arbutus menziesii) 10 72.36
ponderosa pine (Pinus ponderosa) 82 79.63
lodgepole pine (Pinus contorta) 37 82.30
sugar pine (Pinus lambertiana) 6 98.04
western white pine (Pinus monticola) 11 104.39
western larch (Larix occidentalis) 11 109.27
California black oak (Quercus kelloggii) 6 122.87
red alder (Alnus rubra) 1 144.02
cascara buckthorn (Rhamnus purshiana) 1 232.56
bigleaf maple (Acer macrophyllum) 2 232.82
vine maple (Acer circinatum) 1 305.34
Oregon white oak (Quercus garryana) 2 321.31
Pacific dogwood (Cornus nutallii) 2 371.08
average non-pine needle-leafed conifer 44.02
average sclerophyllous angiosperm 57.34
average pine 91.09
average non-sclerophyllous angiosperm 224.49
Samples were collected between 2001 and 2004 throughout Oregon, Washington, and Northern
California. Live branch samples were collected from mid canopy positions, using a shotgun when
necessary. SLA was determined by digitally scanning 5-100 individual fresh leaves (or needles)
per branch sample and relating the subsequent oven-dry mass of the leaves (or needles) to the
projected leaf area measured off the digital scan.
species