Training Modules Series February 1982.
41
212.1 82 GR LIBRARY INTERNATIONAL REFERENCE CENTRE FOR COMMUNITY WATER SUPPLY AND SANITATION (IRC) GROUNDWATER EXPLORATION FOR DRINKING WATER SUPPLIES IN DEVELOPING COUNTRIES Training Modules Series February 1982.
Transcript of Training Modules Series February 1982.

212.182 GR
LIBRARYINTERNATIONAL REFERENCE CENTREFOR COMMUNITY WATER SUPPLY ANDSANITATION (IRC)
GROUNDWATER EXPLORATION FOR
DRINKING WATER SUPPLIES
IN DEVELOPING COUNTRIES
Training Modules Series
February 1982.

GROUNDWATER EXPLORATION FOR
DRINKING WATER SUPPLIES
IN DEVELOPING COUNTRIES
Training Modules Series
February 1982.
LIBRARY,CENTREAND SArP.O. BoxTel. (070)
RN: ISLO: rt
2.1 S
INTERNATIONALFOF? COMMUNITYCITATION (IRC)93190. 2bO9 AD
REFERENCEWATER SUPPLY
The Hague3149 11 ext. 141/142
R

NOTE
This Training Module has been prepared by Mr. Ebbo Hofkes, of the
International Reference Centre, using material contributed by
Mr. Leonard Terwey, of BKH Consulting Engineers, The Hague, Netherlands,
and material from other expert sources.

TABLE OF CONTENTS
1. INTRODUCTION
2. SURFACE GEOPHYSICAL METHODS
2.1. Electrical Resistivity Method
2.2. Test Pumping Method
2.3. Seismic Refraction Method
2.4. Photogrammetry and Remote Sensing
2.5. Gravity and Magnetic Surveys
3. SUBSURFACE GEOPHYSICAL METHODS
3.1. Well Logging
3.2. Radiation Logging
REFERENCES
GLOSSARY OF GROUNDWATER TERMS

1. INTRODUCTION
There is much more to groundwater exploration than the mere location of
subsurface water. To be reliable, groundwater exploration must combine
knowledge with experience and common sense. It cannot be achieved by the
mere waving of a magic forked stick as may be claimed by those who practise
what is often referred to as water witching, water dowsing, or water
divining. Methods of exploration include simple hydrogeological tools based
upon the application of common sense, intelligence and good judgement, but
also sophisticated techniques.
The approach to be used in groundwater prospection may cover any or all of
the following steps:
- study of relevant geological maps and reports (if any)
- study of topographical maps (e.g. 1 : 25,000 scale)
- examination of existing wells
- sinking of test holes
- hydraulic methods of exploration
- geophysical investigations (seismic refraction, electric resistivity,
magnetic field measurement etc.)
The first step is to define an approximate area of study and to gather
information on that area. A frequent reason for the failure of an
exploration study is that the study area is too small and may exclude the
best or perhaps the only suitable groundwater source. If, after a
preliminary investigation, the area appears to be too large, then the study
can be narrowed to more specific areas.
Succesful groundwater exploration requires a basic knowledge of the manner
in which water exists in the aquifers (water-bearing ground formations).
Without this knowledge, effective and efficient water prospection is
impossible, and well drilling would become something like a game of
roulette.
Sometimes, a thorough search for information will yield a previous study
that can form a suitable basis for the exploration study. Assuming that no
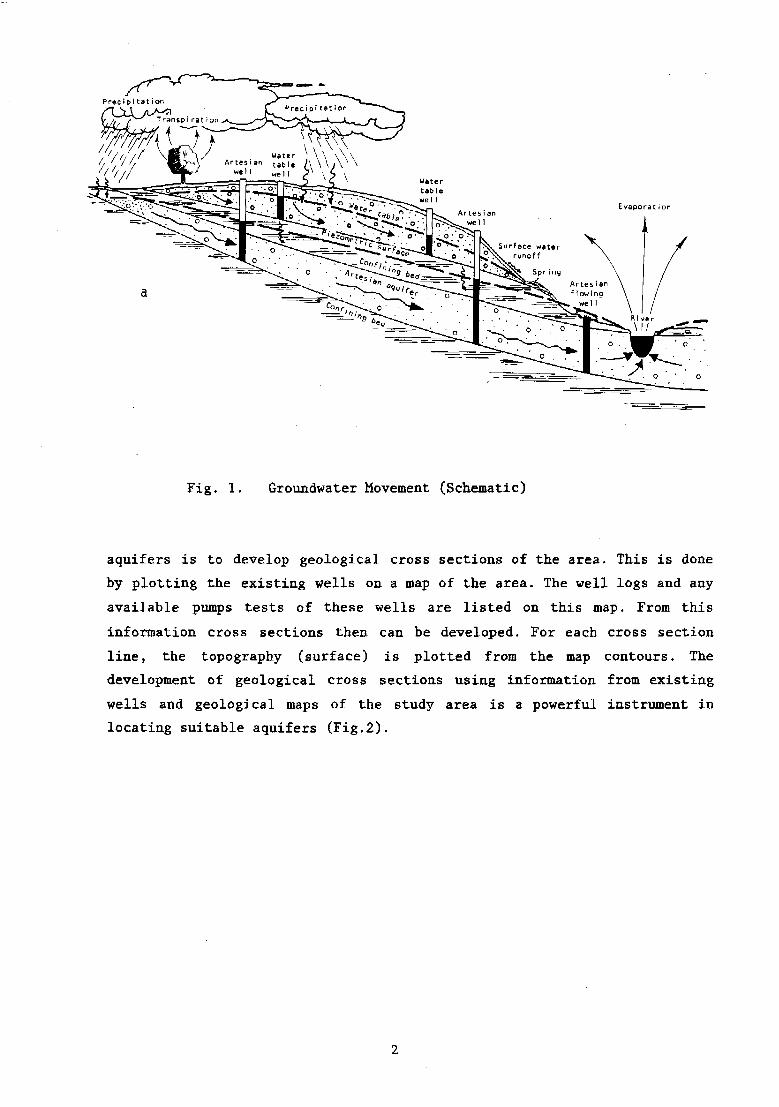
prior study is found, one of the cheapest methods for locating suitable
Evaporat ion
Fig. 1. Groundwater Movement (Schematic)
aquifers is to develop geological cross sections of the area. This is done
by plotting the existing wells on a map of the area. The well logs and any
available pumps tests of these wells are listed on this map. From this
information cross sections then can be developed. For each cross section
line, the topography (surface) is plotted from the map contours. The
development of geological cross sections using information from existing
wells and geological maps of the study area is a powerful instrument in
locating suitable aquifers (Fig.2).

ALLUVIUM t QUATERNARY
j NON-MARINE NEOCENE
fc » « * •*! MARINE NEOCENE
PALEOGENE
[••:.-\---\\y] CRETACEOUS
555861 JURASSIC
V .* I KARROO
INTERNATIONAL BOUNDARY
REGION BOUNDARY
ROAD
RIVER
CORAL
L" V !^C| BASEMENT
Fig.2. Geological map of Mtwara and Lindi regions (Tanzania).

As part of the information collection effort, a survey of the study area
should be made, preferably towards the end of the dry season when
groundwater levels will probably be at their lowest. In some cases this may
be all that is needed for an experienced hydrogeologist to define
groundwater sources for small community supplies, and no further
investigation would be required. If essential data are lacking, some field
work would be necessary to obtain them. The survey should provide
sufficient data to form a basis for the drawing up of a hydrogeological map
showing the distribution of aquifers; depth of the groundwater table and
the piezometric levels. (Fig.3 gives an example).
The most likely locations for groundwater in alluvial formations are in the
valleys near watercourses.
.1329 groundwater head in
observation well*
*\*/ surface water
Scale 1:250.000
Fig.3. Example of a groundwater contour map.
The preparation of such a groundwater map may involve the use of specially
drilled boreholes and geophysical exploration methods. However, the
drilling of boreholes will only be required when an aquifer is to be fully
exploited, for which a knowledge of the hydraulic permeability and water
storage capacity of the ground formation is needed.
Geophysical methods are important tools in groundwater exploration. With
these methods, it is possible to obtain subsurface information about a
proposed well site as effectively and at less cost than through -the
drilling of boreholes. However, the role of traditional hydrogeological
investigations for cost-effective groundwater exploration should not be

overlooked. These should be supplemented, not replaced, by geophysical
exploration techniques such as electrical resistivity, seismic refraction
and well logging. The modern methods are capable of yielding more accurate
information about the subsurface conditions and aquifer characteristics,
and so complement the groundwater data obtained by traditional
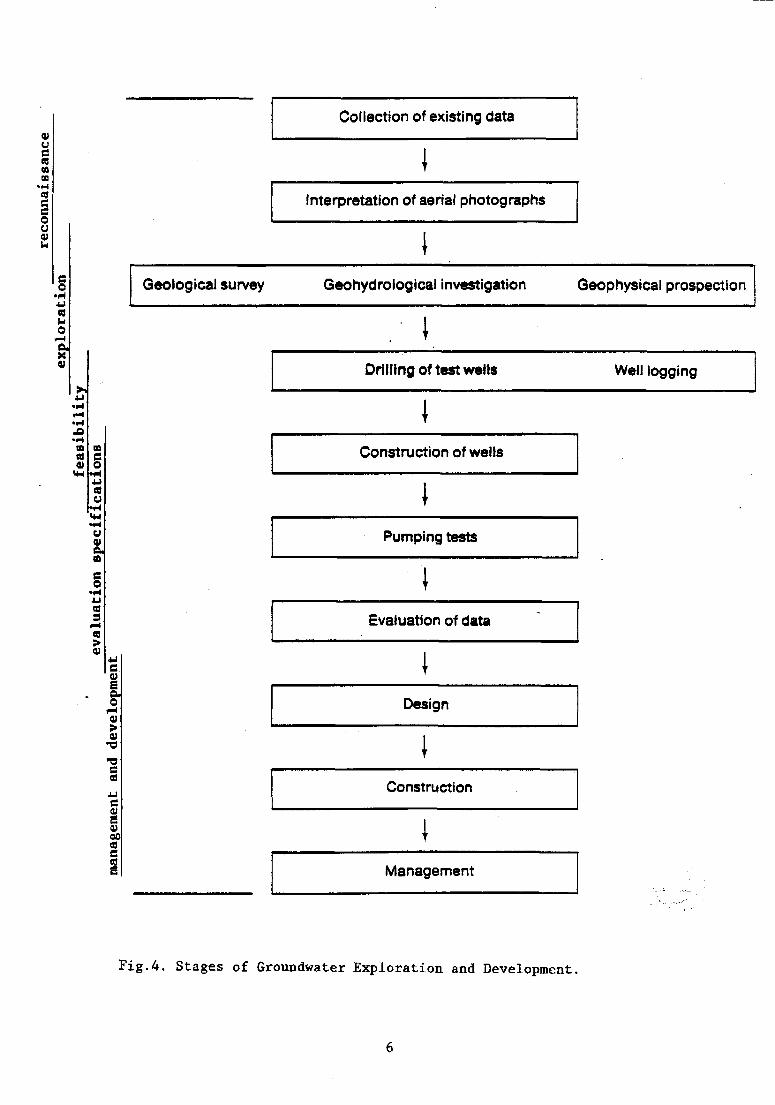
investigations. This is summarized in Fig.4.
Several surface exploration techniques may provide useful information
without requiring costly borings. For instance, stream monitoring can
identify areas where streams are gaining flow from groundwater that might
be intercepted by wells, or where streams are losing water into permeable
stream beds from which water may be withdrawn water directly with wells.
It may be • said that groundwater as yet has not played the important role in
the supplying the world's water needs, which its relatively abundant
availablility would indicate. Its out-of-sight location and the associated
lack of knowledge with respect to its occurrence, have no doubt contributed
to this situation.
01us«COCD
• H
mcou41U
Collection of existing data
Interpretation of aerial photographs
o
l-iO
X01
Geological survey Geohydrologicai investigation
Drilling of test wells
Geophysical prospection
Well logging
9)Construction of welis
D,
o
a
so
CO
s
Pumping tests
Evaluation of data
Design
Construction
Management
Fig.4. Stages of Groundwater Exploration and Development.

2. SURFACE GEOPHYSICAL METHODS
Of all surface geophysical methods only electrical resistivity and seismic
refraction have more than limited application in the exploration of
shallow geological formations. Experience and research have made possible
that geophysical data are interpreted in terms of geological structure,
type of formation, porosity, water content and salinity of the water.
2.1 Electrical Resistivity Method
Electrical resistivity measurements are very useful in understanding the
distribution and quality of groundwater. To interpret the results of an
electrical resistivity survey is specialist work, but is not difficult to
learn how to do the measurements in the field.
Differences in resistivity can indicate the location of permeable strata
because materials with a low permeability such as clay, have low
resistivities, and highly permeable strata such as sands and gravels tend
to have much higher resistivities. Surface resistivity measurements do not
eliminate the need for subsurface borings completely, but they may
considerably reduce the number of borings required.
Resistivity measurements are made by passing an electric current through
the ground between two electrodes and measuring the voltage drop between
two other electrodes. The electrodes are placed in a straight line, at
points symmetrical to a central point. The depth of penetration of the
current is controlled by the spacing of the electrodes. By increasing the
electrode spacing the current can be made to penetrate deeper, and so a
complete resistivity depth probe can be carried out.
The electric resistivity method is particularly useful in cases where there
are marked differences in the resistivity of the ground formations, e.g.
alluvial sediments alternating with clay or sand layers. Resistivity probes
can, under suitable conditions, go as deep as 300m or more. The larger the
depth of the ground formations to be investigated, the larger is the power
required to produce sufficiently large potentials that can be measured
accurately.

There exists a wide range of equipment, from small and portable to big and
heavy which need to be mounted on a truck. Low-cost surface electrical
resistivity equipment has recently been developed in Thailand.
Different electrode arrangements are in use depending on the type of
subsurface information required- In all configurations, the electrodes are
placed in a straight line.
In practice, the Schlumberger electrode spacing arrangement is the most
common. This arrangement has the potential electrodes (P) close together;
the current electrodes (C) are placed at a distance symmetrical to a
central point (the sounding point), which is increased in steps (Fig.5). A
series of resistivity readings are taken at different electrode spacings.
As the electrode spacing increases, a deeper penetration of the electrical
field occurs so that more underground strata will influence the
measurements.
Battery
CsCurrent electrodeP= Potential electrode
_ _ Current line_ _ Equipotential line
Fig.5. Electrical resistivity equipment (Schlumberger arrangement)
8 .

The resistivity probe is started with a short electrode spacing, e.g. 3m.
The current then mainly
resistivity is computed as:
The current then mainly traverses the upper J argor. The apparent
D = l (AB2 - MN2) AVa 4 MN T
pa = apparent resistivity
AB = outer electrodes spacing
MN - inner electrodes spacing
AV = voltage drop
I = electrical current
Note:
The ability of a material to resist the electrical current flow isexpressed as electrical resistivity (p). The resiprocal of it is electricconductivity (#) which is often used when water is concerned. Theelectrical resistance of a homogenius medium is defined as a ratio of thevoltage gradient (E) across a small surface element within it to thecurrent density (I) flowing across the element at right angles to it(Parasnis, 1973). This is called Ohm's law and can be written as follows:
X « p = i CDr P-
The unit of resistivity is ohmm and the unit of conductivity is l/(ohmm) ormho/m. In this context uS/cm is used as a unit of conductivity. The inverserelationship with the units is:
corresponds to 10 000 uS/cmcorresponds to 1 000 uS/cm
In general, the soil consists of a solid, a liquid and a gaseous componentwhich contributes to the electrical formation resistivity (|>). The solidand gaseous components can be regarded as insulators. On the other hand,the liquid component acts as a conductor (electrolyte) by means of thesalts dissolved in it. *
In electrical resistivity measurement using direct current (DC), the
current is used to energise the formations. The measured potentials are
also DC potentials. The current is meassured separately.

In some electrical resistivity measuring equipment the current is kept
constant at 10 milli-ampere by compensating for the varying load conditions
i.e. for the changes in the resistance of the formations. In such
equipment, only the potentials need to be measured. Potentials can be
measured directly with millivolt-meters or microvolt-meters, or they can be
measured by the null method making use of potentiometric circuits.
Most of the boreholes drilled for rural water supply programmes are
shallow,fi.e. less than 30-40 m. Hydrogeological information up to such
shallow depths can be obtained easily by equipment using a small amount of
power for energising the formations. The voltages developed will be of the
order of milli-volts. Thus, the equipment used for such ground
investigations can be simple, compact and portable.
Very low resistivity (<"10 ohm) seldom indicates good aquifers; the water
may be saline or the ground layer is impermeable due to high clay content.
Very high resistivity (>• 500 ohm) indicates dry formations or impermeable
formations with low porosity. Good aquifers usually have resistivity values
higher—tettmi 20o—©ifi"^ if the formation material is coarse and the water
fresh ( EC <^ 400 uS/cm). Young sediments providing a good aquifer often
have a resistivity between 30 and 100 ohm.
When apparent resistivity is plotted against electrode spacing for various
spacings at one location, a smooth curve can be drawn through the points.
Often quite a lot of information about the underground can be deduced even
from qualitative inspection of these curves (Fig.6).
10

J2a>
S2
Sand
Gay
0
20
40
60
Hydrogeologicalcross-section
:£ 100:
I 50
caa.
/
><
w
• •
•
Distance
100
50Lateral profilingelectrode spacing 1/2?40m
10
.12'5501
inddy
100;
•
H
10
I SAND:100S}ffl I
\ - / iI CLAY.- 9Qm I
i i i i i i i
>
Depth profilingSchlumberger arrangement
1 10 100Electrode spacing
.6. Electrical Resistivity Curves and Interpretation.
The quantitative interpretation of the resistivity curves in terms of
subsurface conditions for a multi-layer situation is often a more complex
problem. Additional data may then be necessary for an effective evaluation
of the curves. Formation resistivities vary over a wide range depending
11

upon the rock type, rock porosity, water content and water composition
(Table 1). For aquifers composed of unconsolidated materials, the
resistivity is more dependent on the content and composition of the water
contained in the formation than on the resistivity of the ground materials
themselves.
Table 1
Approximate Range of Electrical Resistivities
(Kollert, 1969)
Rock type RMlatlvtty (ohnwnatrM)
Clay and marlLoamTop-toilClayey soilsSandy soilsLoote sandsRiver sand and gravelMoraineChalkLimestonesSandstonesBasaltCrystalline rocks
10' 1Q* 103 10* 1Q5 , 10*
If a resistivity depth probe is done near to an existing well or borehole
of which the water level, water quality and aquifer thickness are known,
then a correlation between the resistivity values and the hydrogeological
conditions may be established. This would provide a basis for the
interpretation of resistivity depth probes carried out in other areas with
much the same geology.
Conducting the resistivity measurements in a grid pattern over an area,
allows the readings to be plotted on a grid map to form patterns of high
and low resistivity for each electrode spacing used. Lines of equal
resistivity can then be drawn on the map for identification of areas of low
resistivity, which are more likely to be permeable and water-bearing ground
formations, than are high-resistivity areas (Fig.7),
12

\
RECOMMENDED WELL SITE
200 m
Fig. 7 Apparent Resistivity Contour map
(Contour interval: 10 ohm-meter)
A 4^Caophyoieal
Inotitutc »TT 1 T- - J
La4ia
In Tanzania, a pro.iect with Finnish assistance for installation of wells,
found electrical resistivity sounding particularly useful in the location
of aquifers (spec, resistivity > 30 ohm) in sedimentary areas. Clayey
ground layers and layers containing saline water showed low resistivity
(less than 10 ohm).
With electrical resistivity measurements alone it is not possible to
differentiate sand or gravel layers containing saline water from clays or
marl containing fresh water.
13

2.2 Test Pumping Method
Test wells are by far the most common type of exploration borings made.
These wells usually are used to test-pump aquifers located by earlier
surface investigations, and to obtain water samples. Keeping the diameter
of the screened portions of the well at 15 cm (6 in.), the overall cost of
the well can be kept reasonable.
Test pumping is somewhat difficult if the aquifer to be tested is very
permeable or has a close source of recharge. Even at a pumping rate of
4,000-7,500 m3/day possible from such 6-inch dia wells, no sufficient
drawdown may be created to enable the aquifer's potential to be determined
with sufficient accuracy.
In view of the costs of test borehole drilling, by far the best means to
carry out a pumping test is to use an existing well, if one is available.
For a test at the necessary flow rate this usually entails removing an
existing pump and installating a temporary pump that has a higher capacity.
However, pumping an old well at a higher than normal rate can cause
problems such as the collapse of its casing and the loosening of ground
materials opposite the well screen openings which may lead to sand entering
the well.
2.3 Seismic Refraction Method
The seismic refraction method is based on measuring the velocity of elastic
waves transmitted through the underground formations. Changes in seismic
velocity are governed by variations in elastic proporties of the
formations.
The field technique involves creating the seismic waves by striking the
ground surface with a hammer or by firing an explosive charge, and
measuring the time required for the resulting shock wave to travel known
distances. Geophones (detectors) are placed at equal intervals along a
straight line and a seismograph records the time elapsed between the firing
and the arrivel of the resulting wave at each geophone. These waves may
either travel directly from the shot point, or will arrive along a
14

60m
refracted path to the geophone (Fig.8). The greater the contrast in the
various velocities of the shock wave, the more clearly the formations and
their boundaries can be identified.
120.
300, distance, meters
60 Milliseconds
Tig.8 Seismic Refraction
A time distance graph representing the arrival time of the first shock wave
at each geophone against geophone distances from the shot point determines
the seismic wave velocities in formations. The greater the contrast in
velocities, the more clearly the formationsjnd their boundaries can be
identified.
Velocities are lowest In unsaturated, unconsolidated sediments; they
increase markedly for saturated zones. The more consolidated the material,
the higher the velocity; the highest values are recorded insolid igneous
rocks. The depth range of seismic refraction surveys is usually in the
order of 100-200m.
Characteristic seismic velocities for various geological materials are
shown in Table 2.
15

Table 2
Approximate Range of Seismic Velocities
OVERBURDEN, unconsolidated
Unsaturatedloose sand, topsoils i l t , Band, clay
Saturated
silt, sand, clay
BEDROCK, consolidated
weathered, fractured rock
sandstone, conglomerate
shale, limestone
crystalline rocks
0 . 1 , 2 , 3 , 4 , 5 , 6000 a/s
0 , 1 , 2 , 3 , 4 , 5 , 6000 tn/s
velocity, netcrc per »«cond
In seismic refraction surveys a combination of low-velocity contrast and
deep bedrock leads to difficulty, and the depth range is restricted to the
layer with the highest sound velocity. Moreover, quiet surroundings without
noise or interference from traffic or aircraft will be an advantage.
Explosives may only be applied with legal restrictions and regulations. For
shallow exploration, less expensive portable seismographs may be used, and
in quiet surroundings shock waves may be initiated by using hammers.
Where two adjacent subsurface formations have an equal electrical
resistivity, their different seismic refraction velocities may be
distinguished with the seismograph. The seismograph on the other hand
cannot notice a layer of low velocity under a layer of high velocity, but
in this case a difference in electrical resistivity may be detected.
An example of a seismic survey is shown in Figure 9.
16

100 200 300 <.00 500i • Hl\l SMEE' JO* 11
600 700 800
Fig. 9 Seismic Survey
Most seismic equipment is relatively expensive multi-channel equipment.
However, less expensive single-channel equipment uuiuful1 for shallow
exploration, has become available.
2.4 Photogrammetry and Remote Sensing
Photographs taken from aeroplanes or satellites can provide useful
information regarding groundwater resources and conditions.
In addition to conventional black and white and color photographs, the
technology and applications to water resources of remote sensing techniques
such as infrared photography, multispectral and thermal infrared scanning,
and side-looking radar have expanded rapidly in recent years (Table 3). In
general, these techniques sense only those properties and characteristics
associated with the ground surface, from which indirectly subsurface
information may be derived. However, geophysical devices, both airborne and
ground-based have the capacity of greater depth penetration, so that they
can directly indicate subsurface characteristics.
17
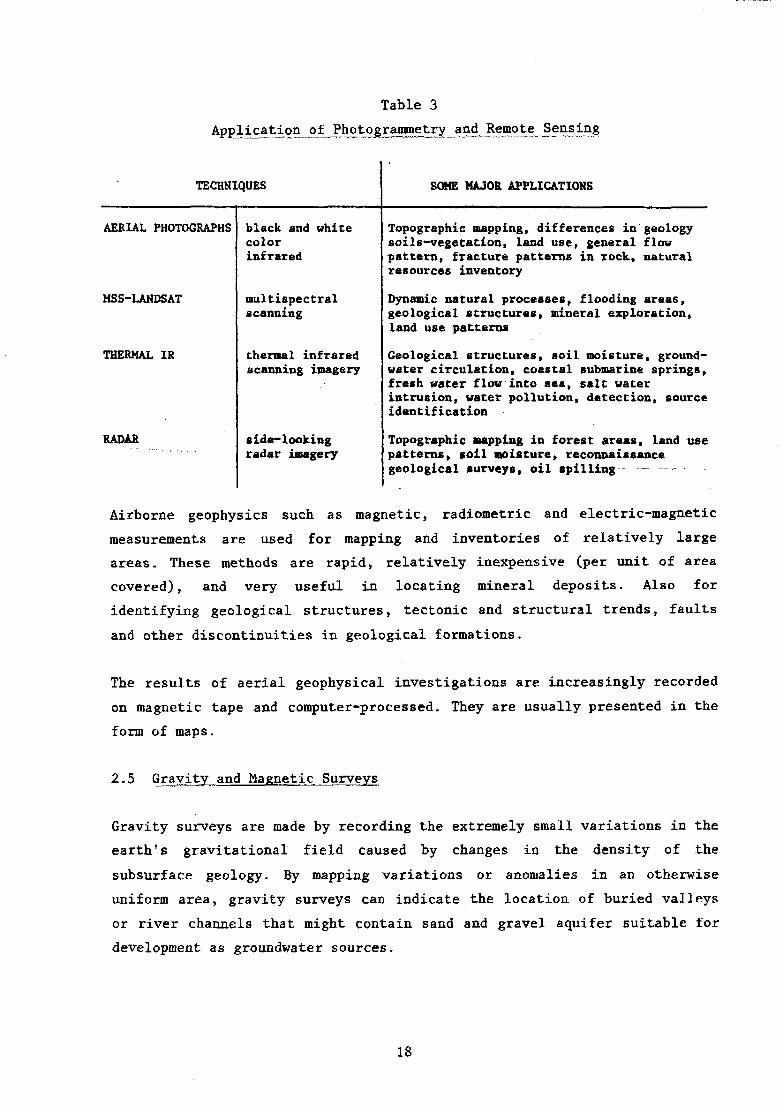
Table 3
Application of
TECHNIQUES
and Jtemote Sensing
SOME MAJOR APPLICATIONS
AERIAL PHOTOGRAPHS
MSS-LANDSAT
THERMAL IR
RADAR
black and whitecolorinfrared
multispectralscanning
thermal infraredscanning imagery
side-lookingradar imagery
Topographic mapping, differences in geologysoils-vegetation, land use, general flowpattern, fracture patterns in rock, naturalresources inventory
Dynamic natural processes, flooding areas,geological structures, mineral exploration,land use patterns
Geological structures, soi l moisture, ground-water circulation, coastal submarine springs,fresh water flow into sea, salt waterintrusion, water pollution, detection, sourceidentification
Topographic mapping in forest areas, land usepatterns, soi l moisture, reconnaissancegeological surveys, o i l spil l ing —
Airborne geophysics such as magnetic, radiometric and electric-magnetic
measurements are used for mapping and inventories of relatively large
areas. These methods are rapid, relatively inexpensive (per unit of area
covered), and very useful in locating mineral deposits. Also for
identifying geological structures, tectonic and structural trends, faults
and other discontinuities in geological formations.
The results of aerial geophysical investigations are increasingly recorded
on magnetic tape and computer-processed. They are usually presented in the
form of maps.
2.5 Gravity and Magnetic Surveys
Gravity surveys are made by recording the extremely small variations in the
earth's gravitational field caused by changes in the density of the
subsurface geology. By mapping variations or anomalies in an otherwise
uniform area, gravity surveys can indicate the location of buried valleys
or river channels that might contain sand and gravel aquifer suitable for
development as groundwater sources.
18
These methods of geophysical prospecting can be useful in determining the
stratigraphy of consolidated rock and in locating major fault and fracture
zones. Analysis of the results may indicate qualitatively the depth to
bedrock and the presence of buried valleys. These methods have little
application to groundwater prospection and, ingeneral, are less suitable
than the seismic refraction or electrical resistivity methods. Subsurface
conditions such as type, dimensions and physical characteristics of the
geological formations can may be determined with these techniques.
19

3. SUBSURFACE GEOPHYSICAL METHODS
Quantitative data about groundwater and conditions under which it occurs
can only be made by subsurface investigations. Test and production well
drilling furnish information on the thickness and composition of perforated
geological formations.
3.1 Well Logging
Well logging provides data on the physical properties and characteristics
of the formations, water composition, and the quality of well construction.
Geophysical measurements made inside a borehole are called geophysical well
logging.
Borehole geophysics such as well logging are used to determine the
lithography and stratigraphy of the borehole. This information is used to
locate the aquifers (where well screens should be placed) and impervious
layers (where plain pipes are to be placed) of measurements obtained with
it.
The well logging technique and the interpretation of measurements obtained
with it, have mainly been developed in oil prospecting. Well logging is
mostly used in connection with fast drilling methods when samples are
difficult to take, e.g. with rotary drilling. Used in groundwater
investigations, well logging can provide information on the lithology and
stratigraphy of the ground formations, and the porosity, resistivity and
salinity of the water in it.
Fig.10 shows a typical electric log of a borehole.
20

normal resistivity
90
Fig.10 Geophysical Well Log
21

There are various applications of geophysical well logging. (Table A).
Table 4
Application of Geophysical Well Logging
single pointresistivity
JC
X
TYPE OF LOG
normalresistivity
X
X
X
X
spontaneouspotential
X
X
naturalgamma
X
X
X
SUBSURFACE PROPERTIESto be investigated
Lithological changes
Thickness, boundaries
Formation resistivity
Groundwater resistivity
Stratigraphical correlation
A wide variety of well logging techniques is available, but the most
important in groundwater exploration are: electric resistivity, spontaneous
potential and natural gamma radiation.
An electric log consists of a record of the apparent resistivity of the
subsurface formations and the spontaneous potential in the borehole, both
plotted against depth below ground surface. These two geophysical
properties are related to the character of the subsurface formations and to
the quality of water contained in them. Gamma ray logging is based on
measuring the natural radiation of gamma rays from certain radioactive
elements that occur in varying amounts in subsurface formations. The gamma
ray log is a diagram showing the relative emission of gamma rays, plotted
against depth below surface.
Changes in radiation are commonly associated with differences between types
of materials. In unconsolidated sediments, for instance, the log indicates
principally clay beds at those depths where the gamma ray intensity is high
and sand strata where the intensity is low. Results from these logs may
give welcome additional information to be combined with the available
subsurface data. This will eventually allow a more detailed interpretation
of the geophysical surface survey results.
22

potential R«si*ttvity Orilier^ log
- + —+-
zrZj
rI T
)(r(f
\
Homogeneous clay(impermeable)
Unconsolidated sand,(permeable, fresh water)
Homogeneous clay,(impermeable)
Dense rock, low porosity. (Impermeable)
Dark shale,
(impermeable)
Sandstone, (permeable, brakish water)
Shale, (impermeable)
Dense-rock, (low porosity.impermeable, probably limestone)
Slule, (streaks, of sandstone,low permeability)
Shale, homogeneous(impermeable)'"
Sfi»le. streaks ot sandstone,
(low permeability)
Sandstone, (streaks of shale,permeable, saime water)
Shale, (lew sandstreaks, impermeable)
Dense rock, weathered onupper part,(low permeability)
Fig. 11 Electrical Resistivity Log (Schematic)
Let us consider how to use the Spontaneous Potential (SP) and Resistivity
curves to distinguish changes in rock formations and water quality. SP
curves are most descriptive in unconsolidated formations. Clay formations
usually are represented by a straight, uniform line. This line is called
the clay-base line and variations from this line to either the right (+) or
the left (-) side are useful in analyzing formation properties.
1) A shift to the right or positive potential usually is indicative of a
permeable fresh water formation.
2) A minor shift to the left or negative potential may also represent a
fresh water aquifer, but with a greater concentration of dissolved
solids.
3) A large shift to the left generally signifies penetration of a saline
aquifer.
23

Resistivity increases toward the right and changes in formation
characteristics affect the resistivity curve in the following ways:
1) Fresh water aquifers and dense rocks have high resistivities and are
denoted by movement of the curve to the right.
2) Clays have low resistivities and are depicted by movement of the
curve to the left side of the log.
3) Aquifers containing highly saline water have resistivities similar
to that of clays.
If you the driller's log is covered up, you can see that it is possible to
determine where the changes in rock type occur, and the thickness of the
major rock units. It may also be possible to delineate the clay or shale
beds. However, when the driller's log is also considered, you are in better
position to evaluate the rock type of your aquifers, to determine whether
changes in porosity are due to variations in lithology or the result of
fractures or solution cavities, and to determine qualitative changes in
water quality.
Figures 12 and 13 show typical examples of well logging results.
The spontaneous potential and the resistivity log are made with a single
instrument, and are commonly known as electrical logs. The down-hole
resistivity instrument is essentially the same as that used for surface
resistivity measurements, except that its probes are hung down in the well.
Readings are taken between probes placed at set distances apart. An
increase in the distance between probes increases the total surface area
and the vertical distance for which the instrument averages the
resistivity. Down-hole resistivities tend to be more precise than surface
resistivities, so that the differing strata in the bore-hole normally can
be recognized. As a rule, soils containing portions of such electrically
active materials as clay will have a very low resistivity. Sands and
gravels will have a moderate resistivity.
Four logs are plotted from the four down-hole logging techniques used: the
drillers'log, the spontaneous potential log, the resistivity log and the
gamma log.
24

CMMIalll l
E-117,1} S MSI,75
GAMMA = NATURAL GAMMA RAY LOG
NEUTRON i NEUTRON - NEUTRON LOG 1 0 - 16000cpro,
RESISTIVITY i ELECTRICAL RESISTIVITY LOG
200 - 700 cpm )
SHORT NORMAL
LONG NORMAL
LATERAL
= POTENTIAL ARRAY AM = 0. 40m
-- POTENTIAL ARRAY AM - 1,60m
% GRADIENT ARRAY -*M = 5.60 rr>
. 0 - 5 0 ohm m . 0 - 2 0 0 ohm m ., I
SPONTANEOUS POTENTIAL LOG
LOGGED BEFORE PIPING ( IN MUDHOLE )
LOGGED AFTER PIPING ( IN PIPED HOLE )
STATIC GROUND WATER LEVEL
GEOLOGICAL SYMBOLS
Soil
LATERITE MUD, ORG.TOP SOIL
CLAY SILT
SANO GRAVEL
Non-metamorphic rockMARL
MUDSTONE CLAYSTONESHALE
SILTSTONE SANDSTONE
LIMESTONE
Metamorphie rock
MICA SCHISTMICA GNEISS
GRANITECLASS
GNEISSMIGMATITE
PEGMATITE
OUARTZITE MARBLE
LETTER SYMBOLSW = WEATHEREDDE = DECOMPOSEDD = DISINTEGRATEDC = CALCAREOUSCL = CLAYEY5 r SILTYSD = SANDYG : GRAVELLYM : MARLYP : PEGMATITICCO = CONGLOMERATICPE = PEBBLY
PIPING
PVC = PLASTIC
ST z STEEL6 in i PIPE DIAMETER
SEPARATE HORIZON
SOIL / ROCK BOUNDARY
Fig.12 Well Logging Profile
25

r •illHLE kt I ItlTIICT
F SOt - JO 7 NEWALA
Fig.13 Well Logging Profile
26

3.2 Radiation Logging
Radio isotopes as groundwater tracers give a direct insight into the
movement and distribution of groundwater within the aquifer . Groundwater
in its natural state contains numerous istopes, and conclusions may be
drawn from the varying levels at which they are present.
The isotopes commonly employed in groundwater investigations are the heavy18
stable isotopes of the water molecule, Deuterium (2H) and Oxygen-18 ( 0),14
and the radio-active isotopes, Tritium (3H) and Carbon-14 ( C). The stable
isotopes are excellent indicators of the movement of water while the
radio-active isotopes are of special value in detecting the residence time,
assuming no contamination of the water has occurred.
In nature, most groundwater is renewed by direct infiltration of
precipitation, by infiltration from surface water or by subsurface inflow.
Owing to the evaporation and exchange processes, the isotope content and
its distribution in time and space can change during the transition from
precipitation to groundwater, and sometimes in the groundwater itself.
There is a global network established jointly by WHO and the International
Atomic Energy Agency, sampling precipitation on a monthly basis, the
samples being analysed for Deuterium, Oxygen-18 and Tritium.
The average precipitation data showing the distribution of stable isotopes
correlated with the groundwater isotope composition, define the origin and
movement of subsurface waters. The short half-life of Tritium provides
valuable information on recent recharge whereas the long half-life of
Carbon-14 dates slow-moving groundwater.
Natural gamma logging means continuous records of gamma radiation produced
by radioisotopes naturally occuring in all rocks. Radioactivity of rocks is
primarily due to the content of radioactive potassium.
Potassium 40 is the most common radio isotope and occurs in several
minerals, including a variety of feldspars, micas and clays. Radioactivity
in sedimentary rocks is highest in finegrained, clayey or shaly rocks, it
is lowest in clean quartz sand, sandstones and limestones. The acid types
27

of igeneous rocks (granites) have the highest, and the ultrabasic rocks the
lowest gamma activity.
Neutron-neutron logging gives information of the total hydrogen content. A
neutron source, used in the measurements, emits fast neutrons which are
moderated (slowed) in the fluid colomn, casing and rock by collisions with
automic nuclei. The element most effective in moderating neutrons is
hydrogen because the nucleus of hydrogen atom has about the same mass as a
neutron. Above the zone of saturation the calibrated and corrected neutron
log provides a continuous measurement of the moisture content, and in the
zone of saturation it provides a record of porosity.
When calibrated, gamma-gamma logging measures the density of rock. The
logging tool concists of a gamma-ray source and a detector shielded in such
a way that it records back-scattered gamma rays from the formation. This
secondary radiation depends on the density of electrones which can roughly
be said to be proportional to the rock density.
Radiation logging can be madeboth in cased and in uncased boreholes. The
intensity of radiation can be measured.as the number of radiation pulses
reaching the detector per time unit. The radius of investigation is small;
the order of magnitude is some ten centimetres.
Table 5
Application of Radio Isotopes in Groundwater Exploration
RADIO - ISOTOPES
-CHARACTERISTICS
isotopenamehalf-life
APPLICATION
recent rechargedating, residence timeoriginmovement
precipitation
Hydrogen
2H(D)Deuteriumstable
XX
0
3H(T)Tritium13,3 yr
X
o
Oxygm
J80Oxygen-18stable
XX
0
Carbon
'*CCarbon-145730 yr
X
X
28

REFERENCES
- A. Bernard! - J. Mouton POSSIBILITB"S ET LIMITES DE LA GE"OPHYSIQUEAVEC LES MgTHODES DES PROFILS DE RESISTIVITY, DES SONDAGES ELECTRIQUES ET'DE LASISMIQUE REFRACTION. Recherche d'Eaux Souterraines dans lesformation cristallines et metamorphiques du socle africain.International Congress of Hydrology, 1975.
- Davis, S.N.; De Wiest, R.HYDROGEOLOGYJohn Wiley & Sons, New York/London, 1970.
Johnson, E.E.GROUND WATER AND WELLSSt.Paul, Minnesota, 1972Universal Oil Products Co.Keller, G.V., Frischknecht, F.C.ELECTRICAL METHODS IN GEOPHYSICAL PROSPECTINGMcMillan, Oxford, 1970.
Kollert, PGROUND WATER EXPLORATION BY ELECTRICAL RESISTIVITY METHODGeophysical Memorandum No.3ABEM (Atlas Copco), Bromma, Sweden, 1969.
P. LasfarguesCASTES DE POTENTIEL - RESISTIVITY - POLARISATION SPONTANE"E - POLARISATIONPROVOQUEE.Chez MASSON & Cie; 1957 - MANUELS DE PROSPECTION GEOPHYSIQUE
J.C. LachaudPROSPECTION ELECTRIQUE - APPLICATION PRACTIQUE DE GE"OPHYSIQUE.OUAGADOUGOU Haute-Volta - EIER - CIEH; 1978.
J.P. Mathiez - G. HuotPROSPECTION GE"OPHYSIQUE ET RECHERCHES d'EAUX SOUTERRAINESExamples d'Application en Afrique Occidentale.Comite interafricain d'etudes Hydrauliques, 1966.
L. Simler - E. Caneiro FeitosaPROSPECTION fJLECTRIQUE - APPLICATION DE LA METHODE ET NOITON PRATIQUEd'EXPLOITATION ET DE PRESENTATION DES RfiSULTATS.Bulletin du B-R.G.M. Section III N° 4, 1968.
29

Terwey, J.L.GEOPHYSICAL INVESTIGATIONSEngineering Geology, 1974, No.10
Tornquist, B.MODERN WATER EXPLORATIONAtlas Copco, Stockholm, 1977
Willis, R.F.GROUNDWATER EXPLORATION AND DEVELOPMENT TECHNIQUESJournal AWWA, October 1979.
30

GLOSSARY
Airborne geophysical survey
Use of geophysical instruments in aircraft to enable electric, magnetic,
radiometric or other measurements to be carried out more rapidly and over
greater areas.
Anomaly
A deviation of physical and chemical properties from normal (as caused by
the presence of subsurface deposits when these are searched for by
geophysical and geochemical methods).
Apparent resistivity
The ground resistivity calculated from measurements and a geometric
factor depending on the electrode configuration. It is an ohms law ratio
of measured voltage V to applied current I, with geometric constant K,
such that
a =
is expressed in ohm-meters.
Apparent resistivity curve
A graph of apparent resistivity against electrode separation. Usually
plotted on logarithmic paper and compared with type or master curves to
determine resistivity, thickness, and depths of subsurface layers.
Aquifer
Geologic formation having structures that permit appreciable quantities
of water to move through it under ordinary field conditions. literally
meaning: water-bearing.
31

Array
Arrangement of a group geophones or shotpoints in seismic studies. The
arrangement of electrodes in resistivity surveying also called
"configuration". Resistivity arrays include: Wenner, Schlumberger,
Dipole-Dipole, Gradient, Pole-Dipole, Pole-Pole.
Arrival time
The time from shot or other energy release to the time picked out for an
event, measured in milliseconds.
Basement
Electrical basement in the surface below which resistivity is very high
and hence variations below this surface do not affect electrical survey
results significantly. Geologic basement is the surface beneath which
sedimentary rocks are not found.
Bedrock
Any solid rock underlying the overburden.
Compressional wave
The type of seismic wave assumed in conventional seismic surveys. Also
known as P-wave, longtudial wave, and dilatational wave.
Conductivity
The ability of a ground material to conduct electricity. The reciprocal
of resistivity. Measured in "mho per meter".
Current electrode
The A and B electrodes in resistivity surveying. Low electrical
resistance at these electrodes is desirable to maximise current flow into
the ground.
32

Drawdown
When a well is pumped, water is removed from the aquifer surrounding the
well whereby the water table will be lowered. The drawdown at a given
point is the distance the water is lowered.
Electrical profiling
An electrical resistivity method utilising fixed electrode spacings in
which the array is moved progressively along the profile to detect
resistivity changes. Also known as electrical trenching.
Electrical sounding
An electrical resistivity methid in which electrode spacing is increased
in orde to detect changes of resistivity with depth. Also known as
electrical drilling.
Formation (geological)
A large and persistent stratum of some kind of rock. Set of strata
possessing a common suite of lithological and/or fauna1 characteristics.
Also loosely employed for any local, more or less related group of rocks.
Gamma ray log
A well log that records the natural radioactivity.
Geometric factor
A numerical factor used to multiply the V/I ratio from measurements
between electrodes to give the apparent resistivity.
Geophone
A moving coil device used to transform seismic energy into an electrical
voltage. Also known as seismometer.
33

Geophysics
The science that uses application of physical properties such as
electricity, magnetism, gravity, etc. in a detailed study of the
composition of the earth's crust.
Ground water
Without further specification; water occupying all voids within a
geologic formation. In practice; water of appreciable quantities
infiltrating into, travelling through and being stored in the ground.
Ground water level
Same as ground water table. The level below which all voids of the rock
or soil, down to unknown depth, are full of water.
Hydrogeology
The science which deals with the occurrence, distribution and movement of
water below the surface of the earth.
Magnetic field
The field of force that surrounds a magnet. The earth has its own
magnetic field which can be measured in terms of total, vertical or
horizontal intensity at any given point.
Master curve
One of a set of theoretical curves calculated from models against which
an observed curve is matched in an effort to find a fit so close that the
model data is applicable to the actual situation.
Neutron log
A porosity well log that mainly measures hydrogen density. A low hydrogen
density indicates low liquid filled porosity.
34

Ohm
Unit of electrical resistance or impendance. One ohm means a potential
drop of one volt per ampere of current. V/I=R.
Ohm-meter
Unit of resistivity, being the resitivity of a meter cube that offers a
resistivity of one ohm to the flow of current between opposite faces.
Reciprocal is mho per meter (conductivity).
Overburden
Clay, sand, boulders and other unconsolidated material overlying bedrock.
Photo interpretation
Examination of aerial photographs or mosaics by stereoscopic or other
methods in orde to detect and analyze geological features not easily
obsevable from the ground.
Radioactivity log
A well log of natural or induced radiation.
Refraction survey
A programme to map geologic structures by using seismic waves that enter
and leave the high velocity medium at the critical angle. The waves are
identified in terms of time after and distance from the shot.
Resistivity method
Observation of electric fields caused by current introduced into the
ground as a means for studying earth resistivity.
35

Resistivity log
A borehole measurement of an electrical resistivity. Normal, lateral,
focussed potential or induction log. Most resistivity logs derive their
readings from 10-100 ft3 material around the probe.
Sediment
In the singular the word is usually applied to material in suspension in
water or recently deposited from suspension. In the plural, the word is
applied to all kinds of deposits from the water of streams, lakes or
seas, and in a more general sense also the material deposited by the
action of wind and ice. Such deposits that have been consolidated are
generally referred to as sedimentary rocks.
Self potential
The natural voltage differences of ground currents which are caused by
chemical reactions in or between subsurface structures. These voltages
are seldom larger than ± 1 volt.
Spacing
Separation (distance) of electrodes.
Time distance curve
A plot of the arrival time against shotpoint- to geophone distance. The
slopes of the segments of the curves give the reciprocals of the apparent
velocities of the various layers.
Timing lines
Lines at precise intervals of time, usually 0.002 sec, on seismograms,
used to measure arrival times as accurately as possible.
36

Traveltime
The time between time' break and the recording of a seismic event.
Well log
A record of one or more physical measurements as a function of depth in a
borehole. Also known as borehole log.
..- .. ... • >JO
37