
Training Guide 2019 - BlueVenn Essentials Training Guide- 2019.1.pdfNew Selection – opens the...
121
Formerly Engage Marketing Platform Engage Essentials Training Guide 2019.1
Transcript of Training Guide 2019 - BlueVenn Essentials Training Guide- 2019.1.pdfNew Selection – opens the...

Formerly Engage Marketing Platform
Engage Essentials
Training Guide 2019.1
2
Table of Contents
Introduction ................................................................................................................... 3
Navigating Engage ....................................................................................................... 5
Analysis in Engage ....................................................................................................... 9
Data Management ...................................................................................................... 28
Folder Management .................................................................................................... 31
Analysis Object Sharing .............................................................................................. 33
Deriving Data .............................................................................................................. 35
Real-time & Dynamic data .......................................................................................... 53
Models ........................................................................................................................ 57
Campaigns in Engage ................................................................................................. 67
Reports ....................................................................................................................... 80
Further Reading & Next Steps .................................................................................... 84
Appendix A ................................................................................................................. 85
Appendix B ................................................................................................................. 87
3
Introduction
Objectives
The objectives for this course are to equip new Engage users with the ability to:
Navigate & become familiar with the solution features
Build data selections, preview data, save and download insights
Present summaries using Pivots, Venn diagrams and Maps
Create & automate one-off of multi-step strategic campaigns
Build customer journey’s that connect relevant campaign messages
Understand how to plan and deploy campaign journey’s
Evaluate campaign reports, determine responders & incorporate future exclusions
This training guide and the examples provided are based on a training database. The Engage
Customer Success team will be happy to provide coaching and assistance to transition users to
‘your own data’ beyond this training course.
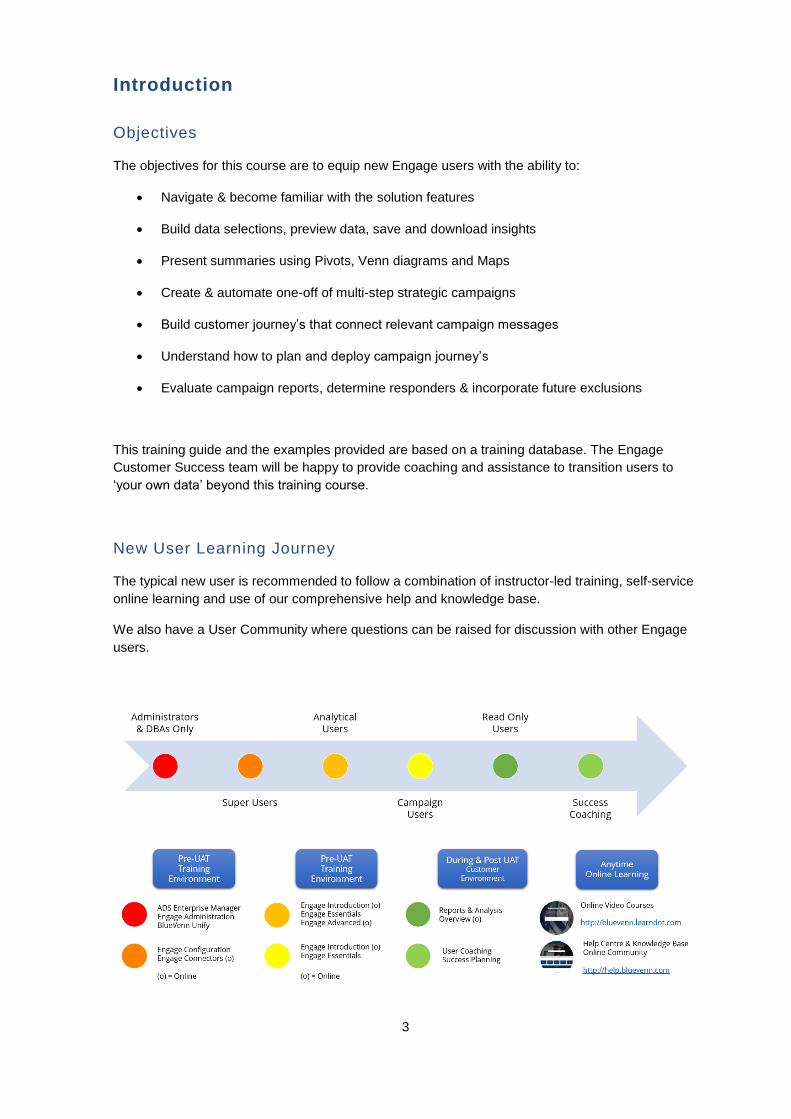
New User Learning Journey
The typical new user is recommended to follow a combination of instructor-led training, self-service
online learning and use of our comprehensive help and knowledge base.
We also have a User Community where questions can be raised for discussion with other Engage
users.

4
Scenario
Naiicha Outdoors - Retail
Naiicha is an outdoor leisure company established around 2005 to sell outdoor clothing and
equipment through stores and via the its online store, operating from premises in the USA and the
UK.
Our website: http://www.naiicha.com
Our source database contains customers and prospects,
some demographic data and transactions back to 2005.
Your job is to analyze sales over the past few years to understand customer trends, buying habits
and profile for more effective campaigning and customer journey management.
Naiicha have a single-customer view (SCV) that feeds into Engage. This relational data source
refreshes every 24 hours, and is presented with four key tables used for analysis. The relational
structure of these tables is shown below:
Household
Individual
Order
Item

5
Navigating Engage
As Engage is a browser-based solution we connect to it using an internet connection and web-
browser. The screen shots used in this manual were taken using Google Chrome, therefore your
view might be slightly different.
Your instructor will tell you the URL and Credentials to use. After a short while, you’ll see an empty
workspace…
This displays the Home screen.
Navigating the Home Screen
The Home screen is always shown first once logged in. It presents a dashboard of currently activity
and results from recent campaigns. The interface has been designed to be intuitive and touch
friendly.
It is possible to filter the campaign timeframe shown to a specific date range, by default it will
display this month.
There are 4 main areas to the Home screen, as below:
1. This is the main navigational area, where Home will return to the main
dashboard shown on login plus:
a. Search – as an alternative to maual navigation, the magnifier performs a
full object search within Engage
b. Reports – allows the creation of RFV, Maps and third-party reports
c. Analysis – area for creation of new analysis objects and viewing data
within Engage
d. Campaigns – where campaign journeys are created and managed

6
e. Models – area for creation of Predictive and Cluster models using R
f. Data – the source database containing source data tables and fields from the
Engage SCV (single customer view)
2. The main settings and configurations for the platform, including your user profile and
preferences
3. Campaign dashboard view displaying an aggregated view of all recent activity including
sends, opens, clicks and conversions
4. This is the Navigation bar which allows support for windows using multiple views and
features at once within the platform.
Inside the database view, all tables, fields and other database elements from the source data
imported will be available.
Search
The search facility within Engage allows a user to
find any item within Engage by part of the name or a
string of characters within the item name.
An item constitutes a field, expression, folder or
saved analysis item such as a Venn, Pivot or
campaign. Field searches are conducted on both
Source and Analysis data.
Results are shown as an alphabetic list in the
Context Panel. As an example, search results for the
word ‘house’ returns the following results:
Solution Overview
Besides navigation of the software interface, it should also be acknowledged that behind the
workspace we have a series of databases, tables and fields holding source data, from our
business. For new analysis, campaigns and data elements created here in Engage there is another
series of database tables, fields and data elements.
7
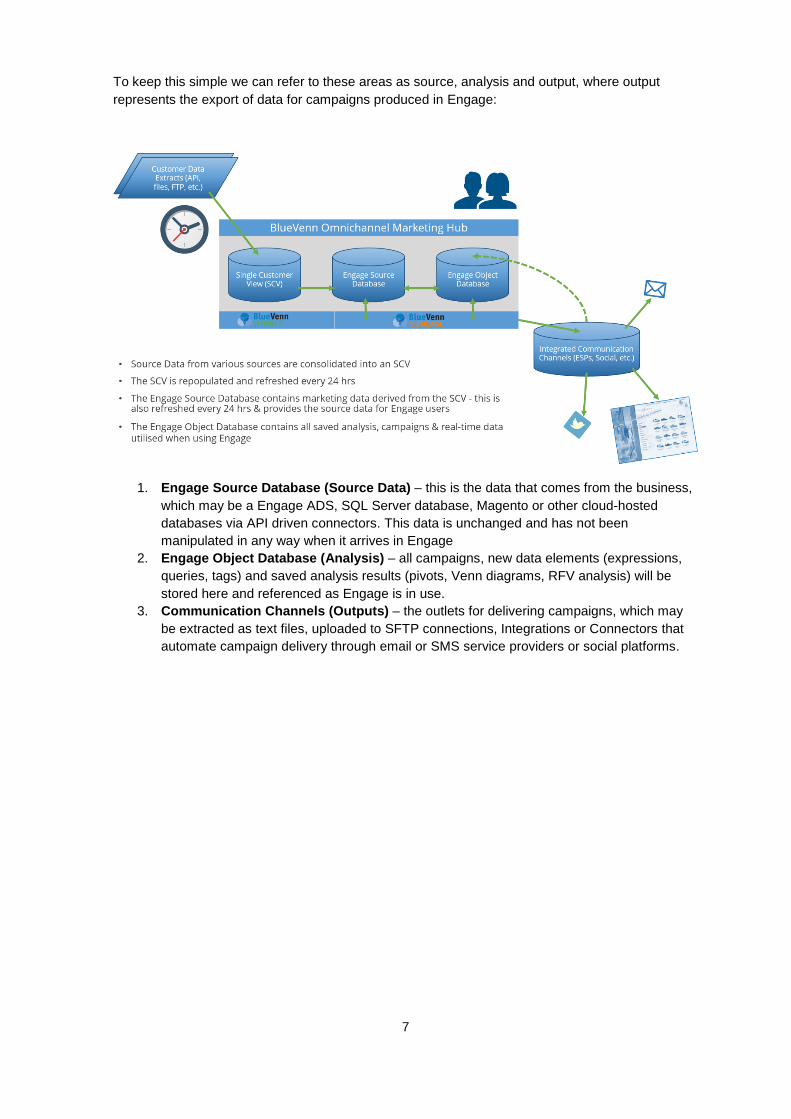
To keep this simple we can refer to these areas as source, analysis and output, where output
represents the export of data for campaigns produced in Engage:
1. Engage Source Database (Source Data) – this is the data that comes from the business,
which may be a Engage ADS, SQL Server database, Magento or other cloud-hosted
databases via API driven connectors. This data is unchanged and has not been
manipulated in any way when it arrives in Engage
2. Engage Object Database (Analysis) – all campaigns, new data elements (expressions,
queries, tags) and saved analysis results (pivots, Venn diagrams, RFV analysis) will be
stored here and referenced as Engage is in use.
3. Communication Channels (Outputs) – the outlets for delivering campaigns, which may
be extracted as text files, uploaded to SFTP connections, Integrations or Connectors that
automate campaign delivery through email or SMS service providers or social platforms.

8
Analysis
9
Analysis in Engage
Analysis takes many forms in software tools like Engage. It may be customer segmentation,
customer behavioral, financial forecasting, transaction analysis, customer retention/acquisition and
more.
Most of the above play a part in using data to influence marketing, and this is the main reason
customers use our solutions.
To enable users to perform the high level analysis listed above, there are several components to
Engage’s functionality that allow users to produce data elements within Engage using the source
data available. For example, if a person’s Date of Birth field exists in the source database, a new
field can be created within Engage to calculate and store each person’s current Age.
This Age field can then be used to produce Age groupings, allowing Customers to be grouped
together based on their age and used to identify significant age groups for different purchase
habits, spending averages and so on.
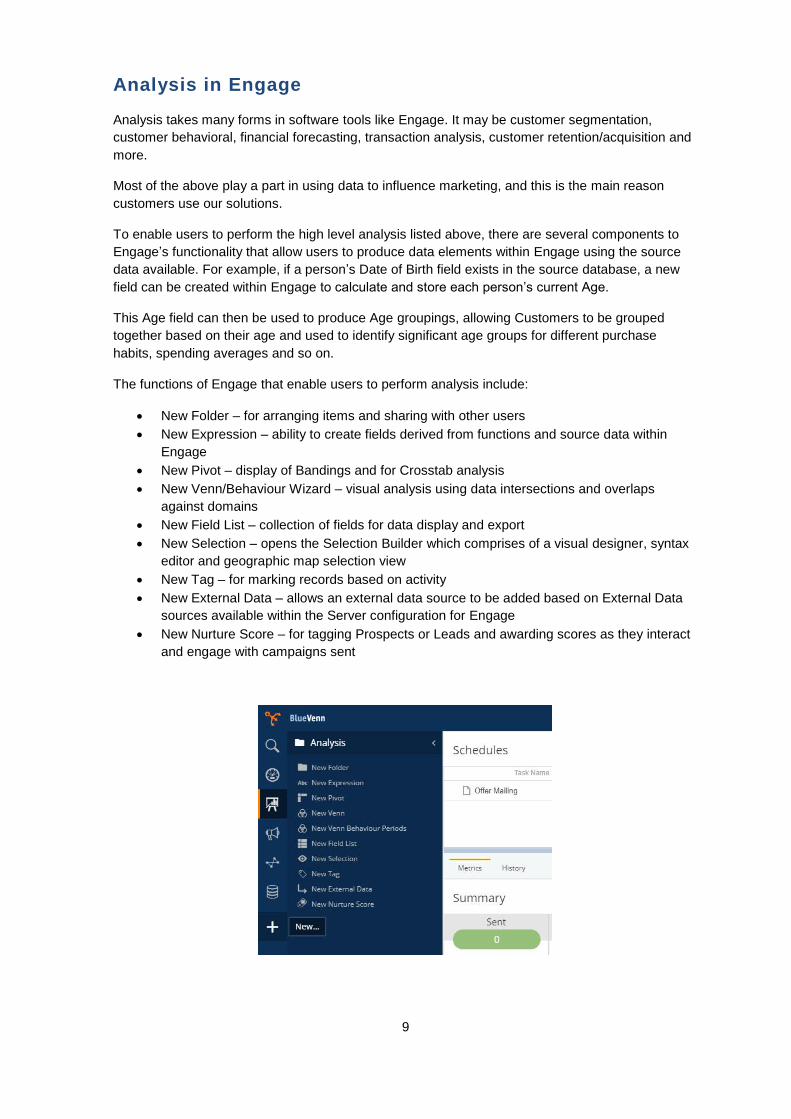
The functions of Engage that enable users to perform analysis include:
New Folder – for arranging items and sharing with other users
New Expression – ability to create fields derived from functions and source data within
Engage
New Pivot – display of Bandings and for Crosstab analysis
New Venn/Behaviour Wizard – visual analysis using data intersections and overlaps
against domains
New Field List – collection of fields for data display and export
New Selection – opens the Selection Builder which comprises of a visual designer, syntax
editor and geographic map selection view
New Tag – for marking records based on activity
New External Data – allows an external data source to be added based on External Data
sources available within the Server configuration for Engage
New Nurture Score – for tagging Prospects or Leads and awarding scores as they interact
and engage with campaigns sent

10
New Calculated Field – creation of an Expression as a Virtual Field directly onto the source
ADS database
New Parametric/Numeric/Date Bandings – creation of data grouped together into
appropriate bands or ranges of related values as a Banding within the Source Database
Some of these functions require background administration and may be configured to be
unavailable to some user roles.
11
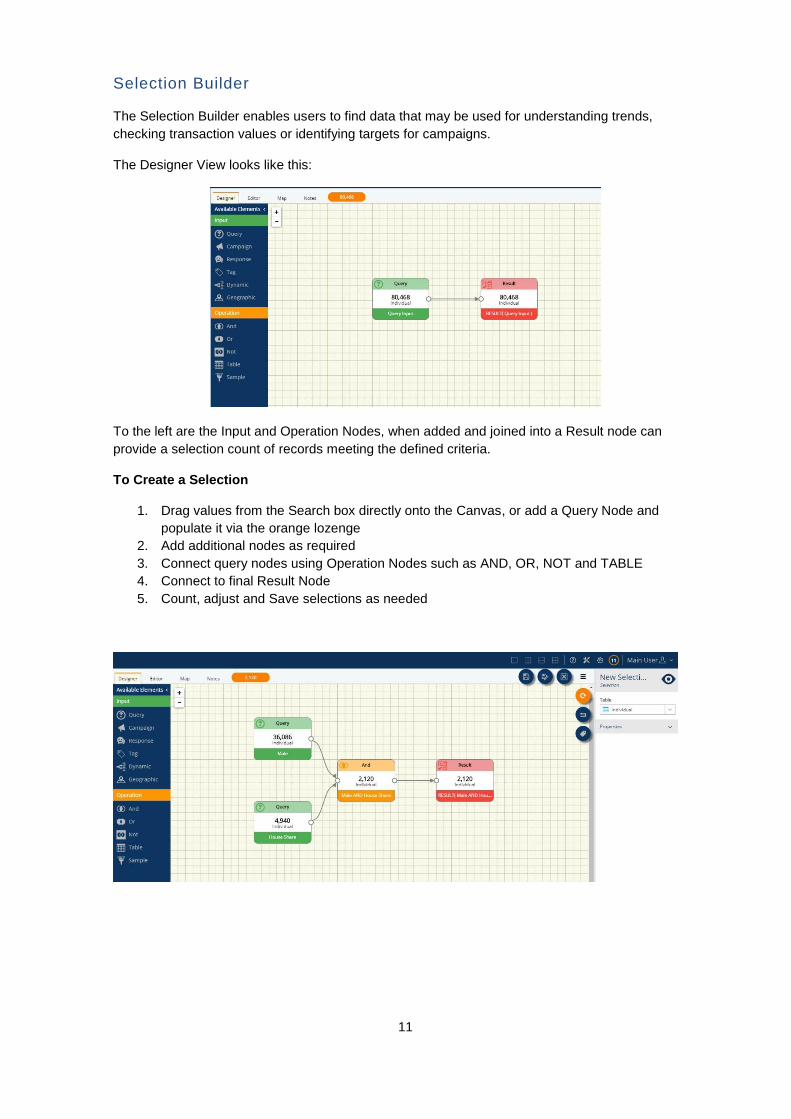
Selection Builder
The Selection Builder enables users to find data that may be used for understanding trends,
checking transaction values or identifying targets for campaigns.
The Designer View looks like this:
To the left are the Input and Operation Nodes, when added and joined into a Result node can
provide a selection count of records meeting the defined criteria.
To Create a Selection
1. Drag values from the Search box directly onto the Canvas, or add a Query Node and
populate it via the orange lozenge
2. Add additional nodes as required
3. Connect query nodes using Operation Nodes such as AND, OR, NOT and TABLE
4. Connect to final Result Node
5. Count, adjust and Save selections as needed

12
The Editor view allows you to view the query syntax used to build the selection.
Within the Editor view it is possible to view data fields to validate the outcome of the selection made
and then tag or export the data if required using the hamburger menu, as below:
It is possible to enter query syntax directly into the Editor view, there is an intelli-sense feature that
lists operators and fields available for use. It is also possible to add fields and values from the
search box results into this window.

13
Map Selections
The Map tab allows the selection to be viewed geographically using the Postcode or Zipcode as a
geo reference. The mapped data is viewable as a Heat Map:
Or can be switched to view as a Cluster map representation of the mapped data:
The map can be zoomed in to make selections, and overlaid with domain criteria to show the
distribution.
The selector tools to the left allow square and circular selections to be made directly from the map,
which are accessible as a separate selection based on the geographic criteria.
To do this, open up a selection and open up the "Map" tab. Pick your selection tool from the left,
then click and drag on the map to begin selecting your data.

14
The selection count, shown as the smaller orange value above, can be sent elsewhere for further
use. Right-clicking on the number provides a paw menu with the following options:
Create new Selection
Use as a new Campaign Audience
Create a new Venn Diagram
Add selected records to a Tag
Create a new Map Report

15
Field lists
A Field List is used to display data and most importantly to determine which fields are exported
during campaign processing.
To Create a New Field List
From the Analysis Menu choose New Field List
Browse through the Database tables and fields
Drag a field of choice to the upper pane
Continue to add fields as required.
To Re-order Fields
Select the field to re-order, drag it up or down to change its position. Refresh the display using the
icon from the Action Menu to update the data preview accordingly.
To Remove Fields
Simply right-click on the field and select Remove Field. It is not possible to remove more than one
field at once.
16
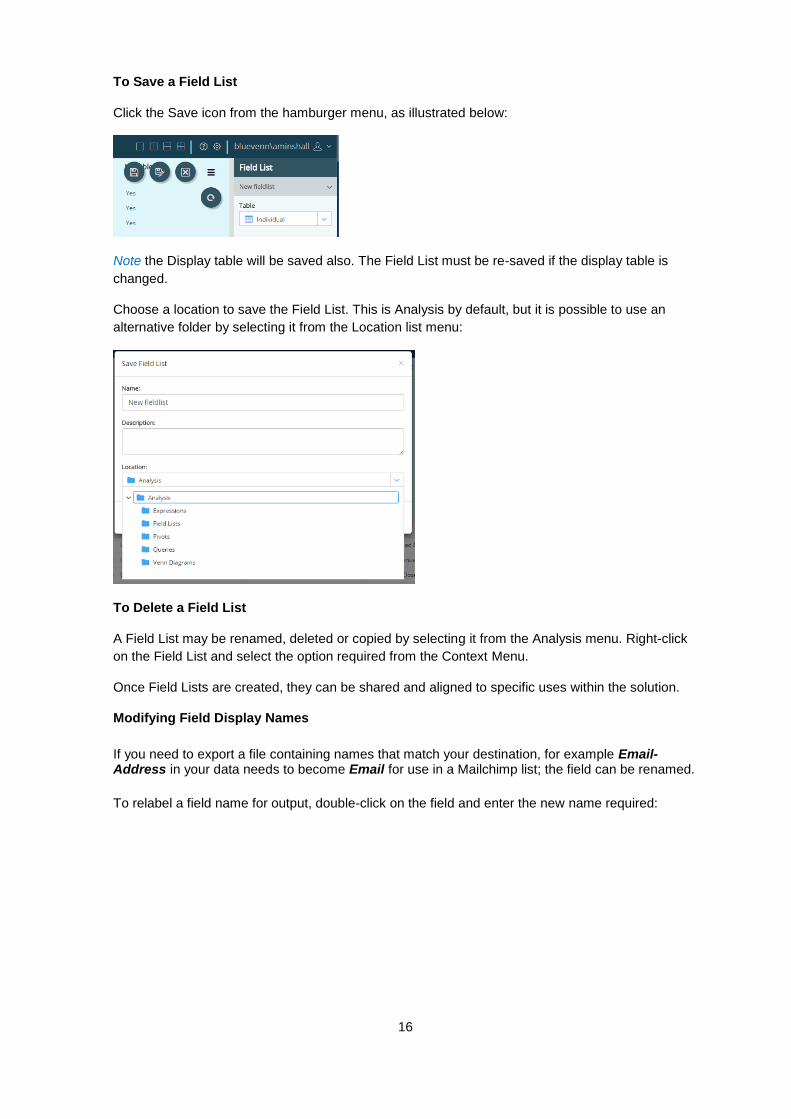
To Save a Field List
Click the Save icon from the hamburger menu, as illustrated below:
Note the Display table will be saved also. The Field List must be re-saved if the display table is
changed.
Choose a location to save the Field List. This is Analysis by default, but it is possible to use an
alternative folder by selecting it from the Location list menu:
To Delete a Field List
A Field List may be renamed, deleted or copied by selecting it from the Analysis menu. Right-click
on the Field List and select the option required from the Context Menu.
Once Field Lists are created, they can be shared and aligned to specific uses within the solution.
Modifying Field Display Names
If you need to export a file containing names that match your destination, for example Email-Address in your data needs to become Email for use in a Mailchimp list; the field can be renamed.
To relabel a field name for output, double-click on the field and enter the new name required:

17
Fields may be renamed differently within any number of Field Lists, so be aware of the mapping used
Renaming does not affect the source field
The new name is used when outputting data only, there is no reference back to the source field that has been renamed in any output files
Masking sensitive fields
For GDPR purposes or to protect sensitive data from users, fields that are masked can be used in
Field Lists but will appear empty. In the screen grab shown above, the Name First field has been
masked. This is configured by an administrator and will affect all users when viewing the data
within the Engage user interface.
Formatting fields
For specifying a date format to be used on output there is a Format column provided on the Field List, as below:
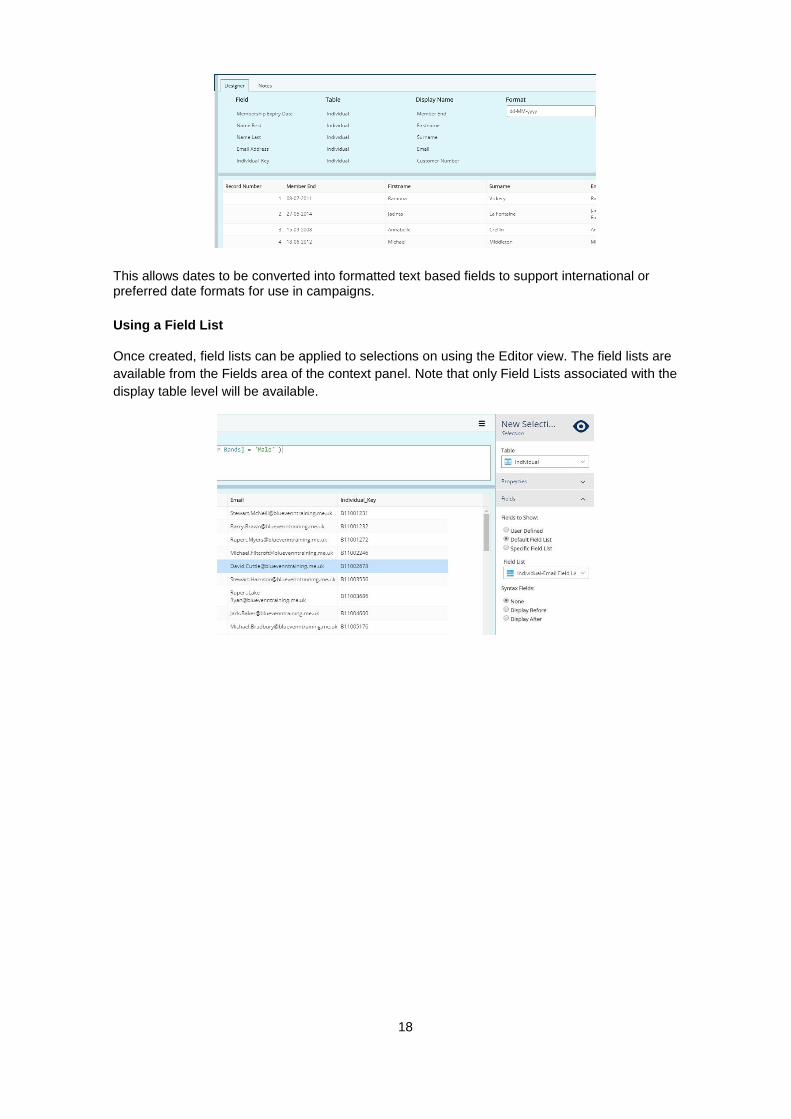
18
This allows dates to be converted into formatted text based fields to support international or preferred date formats for use in campaigns.
Using a Field List
Once created, field lists can be applied to selections on using the Editor view. The field lists are
available from the Fields area of the context panel. Note that only Field Lists associated with the
display table level will be available.

19
Pivots
Pivots in Engage are a cross-reference display of Bandings. They allow users to view 1, 2 or
more Bandings in a single display, which provides a great summary of data trends, customer
segments and transaction hotspots.
Additionally, a Pivot allows data Banding's to be displayed as rows of data, as below.
The orange number represents the total number of records from the selected Table.
Display Table
You can change the Table level in the properties window on the right of the screen, along with
display styles and options.
These include:
1. To filter or omit values, select the Banding name drop down and make the required
selections. Return back to the drop down and choose Select All to restore the full data
2. Display Style - switch to Table (numbers), Table Barchart, Heatmap, etc
3. Measure - shows counts of records by default, use to display sum, average and min/max
values from any numeric data field on the display summary
4. Display - allows switch between counts and percentages
5. Check options to hide empty and uncategorised values

20
6. Pivot domain set to limit the records visible within the Pivot (set as Gold Customers below)
Data columns can be added by dragging another Banding onto the Add Columns drop-zone to
create advanced, multi-dimensional crosstabs.
The default display shows Table Counts, but these can be altered to show Table Bar chart, Heat
map, Row Heat map and Column Heat map.
21
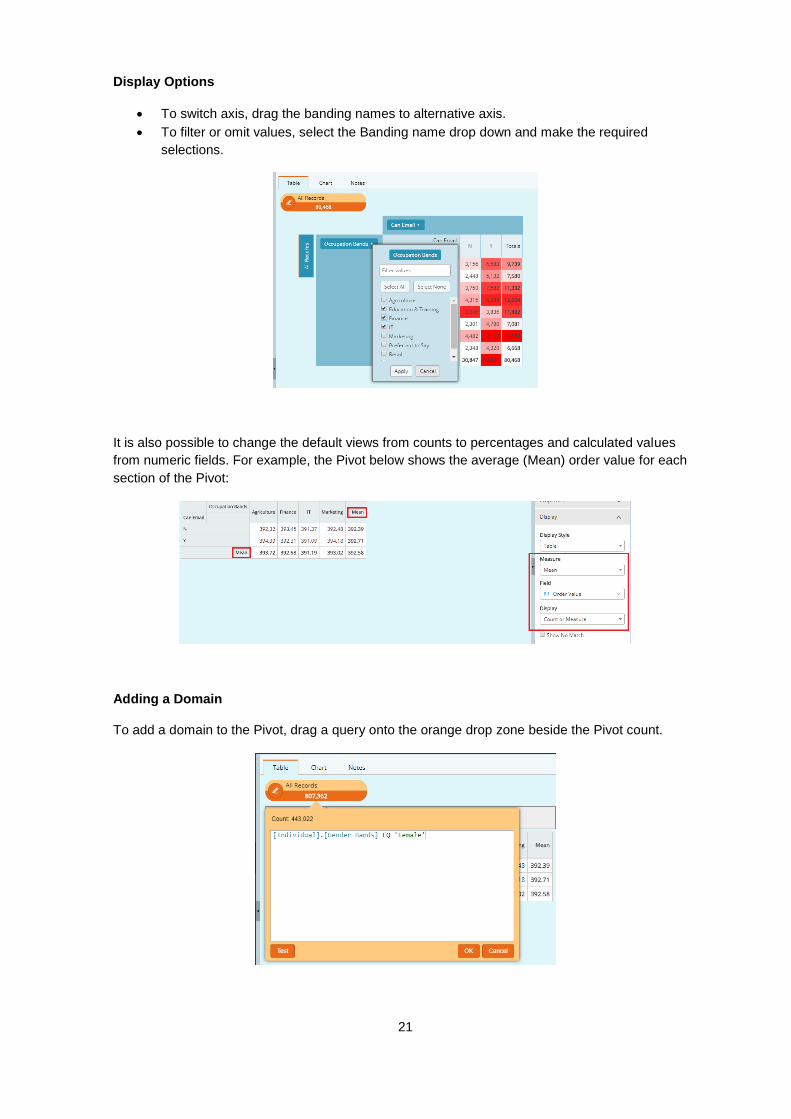
Display Options
To switch axis, drag the banding names to alternative axis.
To filter or omit values, select the Banding name drop down and make the required
selections.
It is also possible to change the default views from counts to percentages and calculated values
from numeric fields. For example, the Pivot below shows the average (Mean) order value for each
section of the Pivot:
Adding a Domain
To add a domain to the Pivot, drag a query onto the orange drop zone beside the Pivot count.
22
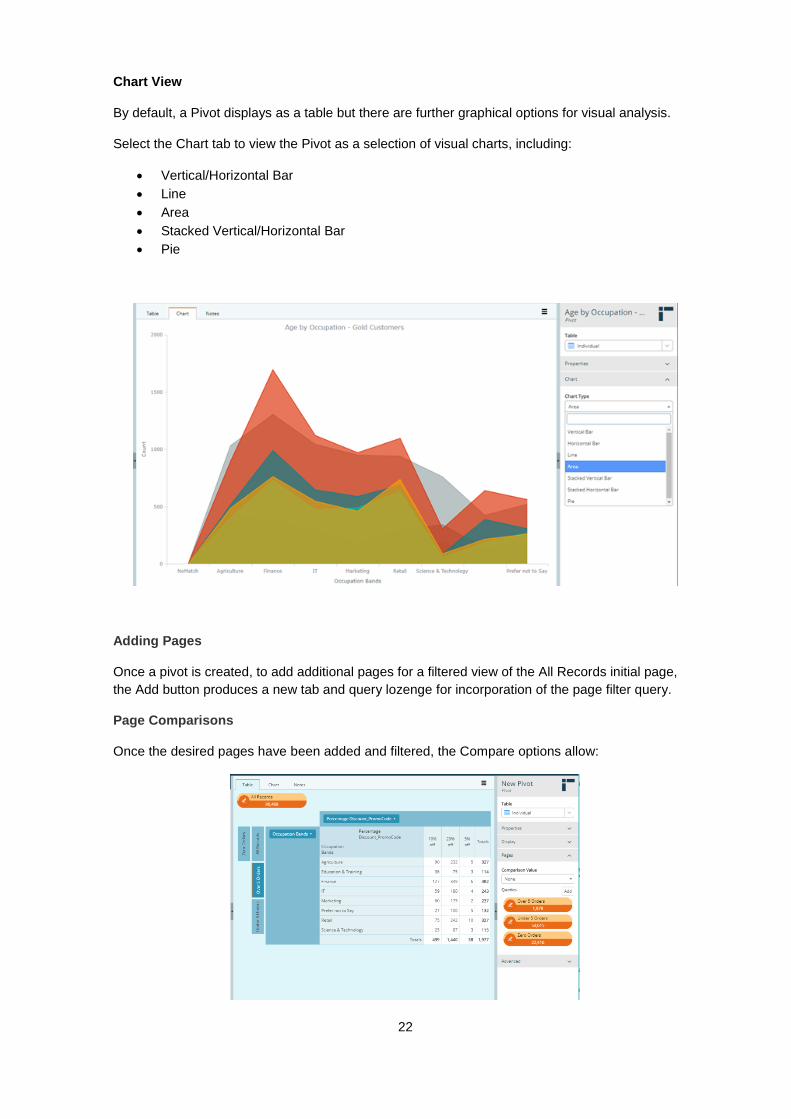
Chart View
By default, a Pivot displays as a table but there are further graphical options for visual analysis.
Select the Chart tab to view the Pivot as a selection of visual charts, including:
Vertical/Horizontal Bar
Line
Area
Stacked Vertical/Horizontal Bar
Pie
Adding Pages
Once a pivot is created, to add additional pages for a filtered view of the All Records initial page,
the Add button produces a new tab and query lozenge for incorporation of the page filter query.
Page Comparisons
Once the desired pages have been added and filtered, the Compare options allow:

23
Difference - for each filtered page against the All Records page to be compared (to show a
positive or negative differences in count volumes)
Index - for setting a base 0 to the All Records page and displaying of the under-
representation or over-representation of each corresponding pivot cell. Any value over 0
equals over-representation and under 0 equals under-representation
Display and Analysis Setting
Where a pivot displays transactions (orders, bookings, sales) by month and year or channel and
brand, the counts in the pivot cells are self-explanatory. However sometimes there is a need to add
criteria such as Booking = "Confirmed" or Payment Type = "Credit Card" which means in each cell
the number contains a little more information.
Then if this pivot is displayed at the Customer level, we expect all of these attributes to roll up into
one. However, relational databases are not that simple, and what actually happens is the query
engine will work with a default ANALYSIS level (the analysis level is where the criteria is
combined).
The result is we find all Customers that have all of those attributes but they are not tied together, or
they didn't occur at the same time.
This is what that looks like:
Within a Pivot we now have the advanced option to specify where we would like to set the Analysis
level and where we would like to set the DISPLAY level (the display level is what we'd like to see
counts).
This ensures we see only the customers that have transactions meeting all of the criteria defined
within a single transaction, ie: they purchased a Polo Neck sweater in 2017 paying with a credit
card.

24
Venn Diagrams
A Venn diagram gives a colorful, graphical representation of the way data interrelates.
It is very useful in segmentation of the data, for example when creating target groups for
campaigns or behavior trends. The name comes from John Venn a 19th century British logician
who devised the notion.
Up to five Domains, defined on the basis of individual queries, can be used in a Venn diagram.
Each is represented by a colored ellipse and intersections are shown in a different color.
Any colored section may be dragged onto the tab bar for later examination in the Engage
workspace.
The Venn may be saved at any point using the Save icon from the hamburger menu. Prior to
saving, if the Venn is to be used by others, the Sets can be renamed using the orange boxes for
better understanding of the Venn.
Using Venn diagram insights
The right-click paw menu, illustrated below, allows users to make use of the Venn diagram insights
elsewhere in the software. By right-clicking on the Venn diagram, users are able to:
1. Send the selected set section to a New
Campaign Audience, Selection, Venn or Tag
2. View the sections as Counts, Percentages
or both
25
Tags
Within Engage a tag is similar to an object – a list of records that are flagged with a 0 or 1, where 1
means the record is part of the Tag.
It is possible to save a selection or to set an action within a campaign step to add records to a Tag.
The Tag can be new or existing.
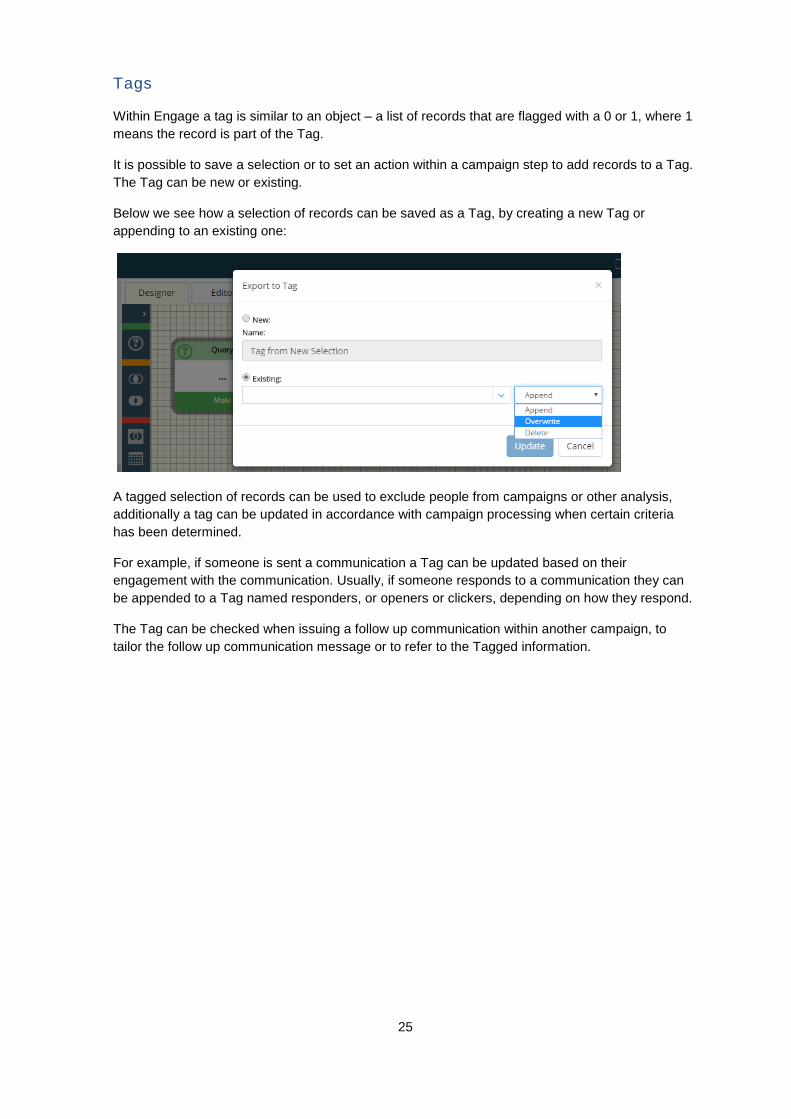
Below we see how a selection of records can be saved as a Tag, by creating a new Tag or
appending to an existing one:
A tagged selection of records can be used to exclude people from campaigns or other analysis,
additionally a tag can be updated in accordance with campaign processing when certain criteria
has been determined.
For example, if someone is sent a communication a Tag can be updated based on their
engagement with the communication. Usually, if someone responds to a communication they can
be appended to a Tag named responders, or openers or clickers, depending on how they respond.
The Tag can be checked when issuing a follow up communication within another campaign, to
tailor the follow up communication message or to refer to the Tagged information.
26
Expressions
Expressions allow data to be derived inside the Engage analysis database using syntax to
calculate a value for each record in the data table used. For users of BlueAnalyzer/MaaX this is the
same principle as a Virtual Field.
Consider using a formula in Microsoft Excel to populate a cell with a calculated value, the
Expression does a very similar thing.
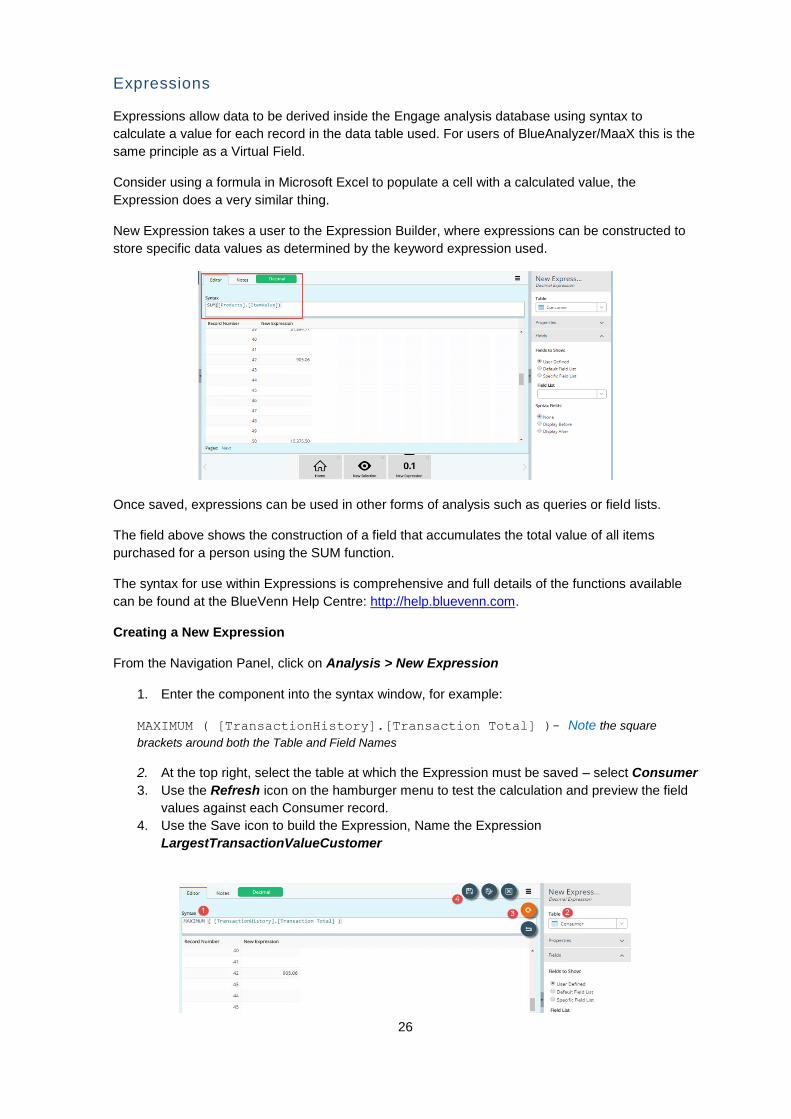
New Expression takes a user to the Expression Builder, where expressions can be constructed to
store specific data values as determined by the keyword expression used.
Once saved, expressions can be used in other forms of analysis such as queries or field lists.
The field above shows the construction of a field that accumulates the total value of all items
purchased for a person using the SUM function.
The syntax for use within Expressions is comprehensive and full details of the functions available
can be found at the BlueVenn Help Centre: http://help.bluevenn.com.
Creating a New Expression
From the Navigation Panel, click on Analysis > New Expression
1. Enter the component into the syntax window, for example:
MAXIMUM ( [TransactionHistory].[Transaction Total] )- Note the square
brackets around both the Table and Field Names
2. At the top right, select the table at which the Expression must be saved – select Consumer
3. Use the Refresh icon on the hamburger menu to test the calculation and preview the field
values against each Consumer record.
4. Use the Save icon to build the Expression, Name the Expression
LargestTransactionValueCustomer

27
Data Management
28
Data Management
In this section we consider some of the advanced uses for data, including sharing among a team of
users and advanced management for the solution.
Some of the items are intended for Administrators and Super Users but are documented here for
context and appreciation of how the platform is configured/configurable.
Channels
In Engage a Channel is a combination of 2 or 3 things …
1. A filename generator 2. A location 3. A process (Optional)
For example:
1. A text channel might simply export data into a file, named in a certain way, to a specified
location
2. An FTP channel might export the data in the same way but, automatically, ‘FTP’ it to a third
party destination
3. If you are using one of our email partners an email channel, this integration can
automatically upload the data from Engage and execute a campaign, all from within a
Campaign Communication Step.
Setting up a Channel is achieved via the Engage Server Config Tool so, if you don’t have access to
that, you will need to ask your system administrator to do it for you.
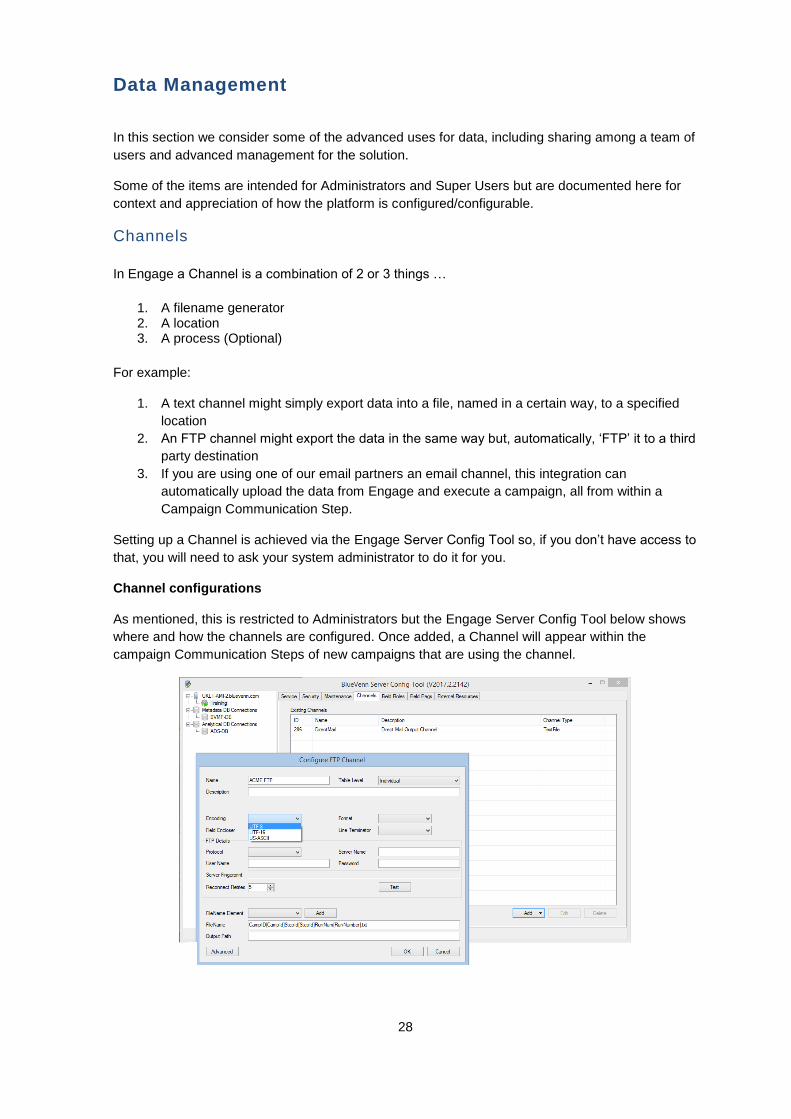
Channel configurations
As mentioned, this is restricted to Administrators but the Engage Server Config Tool below shows
where and how the channels are configured. Once added, a Channel will appear within the
campaign Communication Steps of new campaigns that are using the channel.

29
Global Settings
Within the Settings of Engage, there are several default configurations that can be set to allow all
campaigns and some aspects of Analysis to be configured to a base set of rules. These are as
follows:
Defaults (Analysis)
o Default Table – allows Analysis default table level to be set rather than left blank
o Default Field Lists – allows a default field list to be displayed when a selection is
opened within Editor view
Campaigns
These settings apply to all campaigns for all users.
Allowed Campaign tables – allows tables available for Campaigning to be restricted. At
least one must be selected
Global Suppressions – specified criteria is taken into account when evaluating the
audience for all campaigns. Allows addition of business rules or global domains/exclusions
to apply to all campaign activity
Trial Run Sample Percentage – for speeding up the trial run process, a percentage of
available records is used rather than the entire population within a campaign
Custom Code Names – provides the ability to add custom codes that can be selected
within the Communication Steps of campaigns and included into campaign output

30
Seeds
Allows a query to be added to define which records on each table are Seed records. The relevant
seed table query is referenced for the corresponding table used within the Seed Step of a
Campaign
Manage sharing of elements within Engage
When elements are created and saved, that may be used for managing analysis, campaigns or
created to derive insights and drive campaign audiences, it is possible to share these items
individually or as a folder.
1. To share a single element

31
From the Navigation Panel, right-click on the element to share and select Share with All. All
users with the ability to access other people’s elements will see it.
2. To share a folder of elements
From the Navigation Panel, right-click on the folder to share and select Share with All. All
users with the ability to access other people’s elements will see the folder and its contents.
Folder Management
Folders help keep analysis elements in order. Folders are seen by all users so it’s best to agree
how these will be structured where possible.
New folder creates a folder for organizing a User’s saved analysis, as illustrated below.
Analysis Folders
To create a New Folder, click the option from the Analysis menu, then to add items to the folder
there are two options:
1. Drag the Analysis item into the folder
2. When saving an Analysis item, select the folder from the drop-down list
Campaign Folders
To create a New Folder, click the option from the Campaign menu
To add items to the folder there are two options:

32
1. Drag the Analysis item into the folder
2. When saving an Analysis item, select the folder from the drop-down list
Source Folders
Folders and data elements can be moved within the Source database structure, which can be
useful but also confusing for some Users. It is important to remember that Source Data Folders
relate to the tables of your source database, so changes here must be made with caution and while
bearing this in mind.
33
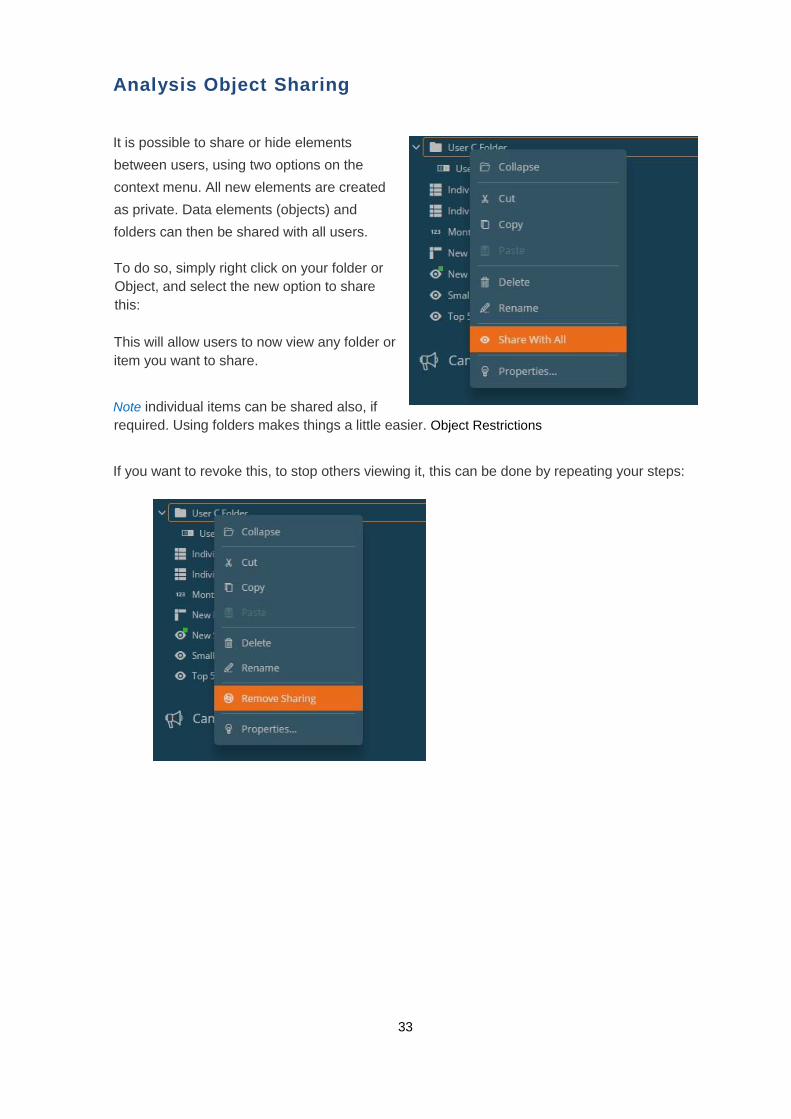
Analysis Object Sharing
It is possible to share or hide elements
between users, using two options on the
context menu. All new elements are created
as private. Data elements (objects) and
folders can then be shared with all users.
To do so, simply right click on your folder or
Object, and select the new option to share
this:
This will allow users to now view any folder or
item you want to share.
Note individual items can be shared also, if
required. Using folders makes things a little easier. Object Restrictions
If you want to revoke this, to stop others viewing it, this can be done by repeating your steps:
34
Deriving Data

35
Deriving Data
Expressions & Bandings
In Engage it is possible to create an Expression to calculate, store, aggregate or record values
based on expression criteria and source data fields.
A Banding is an aggregated set of data records that is calculated as an expression, then stored in a
range or group defined by parameters governed by the data used. For example numbers are
stored in ranges by value or band (segment) size, dates are stored by period, day, month, year or
range and conditional, demographic bandings derived from expression criteria are saved in
parameter groups.
Creating Expressions
The New Expression option takes you to the Expression Builder, where you can create data that
you do not have but for which you do have the source data. A common example of this would be
where your source data contains an Individuals Date of Birth and you use an Expression to
calculate their age.
The available syntax for Expressions is extensive and users can find a full listing in the BlueVenn
Help Centre and Knowledge Portal.
A small number of Expressions have their own syntax and are, therefore, only for use within
Engage real-time objects. These are used to analyse data derived within the Engage database,
such as campaign data, integration data and other external data input sources.
To create an Expression, click on New Expression in the Analysis menu ...
The Expression Builder uses cumulative matching so, as you type the function, it offers
suggestions so, if you type DAYS, you will see a suggestion of how to use the syntax.
When you have entered your syntax you need to select the Table level on the righthand side of the
window, then check the expression using the Refresh button ...

36
The result is viewable below, using a field list to preview the data values derived from the
expression.
In this example, looking at our first Individual, it has been 1,348 days since their most recent
Order. You can save this Expression for future use.

37
Creating Bandings
Within Engage Marketing Platform, you now have the ability to create custom Parametric Bandings.
A Parametric Banding is a banding where each potential returned value can be manually defined
by the user.
The query condition and band label can be typed in from scratch or can be constructed by dragging
and dropping data elements and values from fields or new queries. This allows the user to fully
create their own custom results (Eg creating a customised view of another field in the system, or
creating new sets of data based on multiple fields).
Unlike a Query or a Field Template, these custom Bandings will appear within your Database,
rather than in your "Analysis" Section.
Parametric Bandings
Within Engage, you now have the ability to create custom Parametric Bandings. A Parametric
Banding is a banding where each potential returned value can be manually defined by the user.
The query condition and band label can be typed in from scratch or can be constructed by dragging
and dropping data elements and values from fields or new queries. This allows the user to fully
create their own custom results (E.g. creating a customized view of another field in the system, or
creating new sets of data based on multiple fields).
Unlike a Query or a Field Template, these custom Bandings will appear within your Database,
rather than in your "Analysis" Section.
Creating a Parametric Banding
To start creating a Parametric Banding, first navigate to your database, select a table within your
database, then select "New Parametric Banding".

38
One clicked, you will be presented with the window to begin creating a parametric banding.
The Parametric Banding Window
Once you have selected to create your
parametric banding, you will see from the
window you are presented with this window:
1. Band Creator
2. Banding Options
3. Record Viewer
Parametric Banding Options
Option Function
Table This dropdown will select the table you want to build this banding on. For
example, if you are building a banding to decode an Individuals Gender,
this will be on the Individual Table
Allow Overlap If Ticked
Will calculate each banding independently. If a record fits the criteria
within multiple bands, it will be selected and included within each band.
For example: If Band 1 selected Anyone with a Gender of "Male” and
Band 2 Selected anyone with an Age "35"
- Anyone who is Male will fall into Band 1
- Anyone who is 35 years old will fall into Band 2
- Anyone who is Male and 35 years old will be in both Bands
Allow Overlap o If Unticked
Each band will be calculated in order and is mutually exclusive to one
another. If a record falls into Band 1, it will no longer be able to fit into any
subsequent bands.
For example: If Band 1 selected Anyone with a Gender of "Male" and
Band 2 Selected anyone with an Age "35"

39
- Anyone who is Male will fall into Band 1
- Of the left over Individuals in the database (Females and Undisclosed)
anyone who is 35 will fall into Band 2.
- Of the left over Individuals in the database (Females and Undisclosed)
anyone who is 35 will fall into Band 2.
- There will be no overlap between these
Fields to Show User Defined - Allows the user to drag and drop fields into the record
view.
Default Field List - Will only display the results of the new Parametric
Banding
Specific Field List - When ticked, the user can use the dropdown to select
a Field template to display
Syntax Fields None - Will only display the new parametric banding in the Record Viewer
Display Before - Will display any fields used within the syntax, before the
new parametric banding. Display After - Will display any fields used within
the syntax, after the new parametric banding.
Adding Criteria to a Banding
Once the settings are configured, you can begin entering your criteria. This is done the same as
when building a Query using Engage. To do so, you can use the search bar to grab criteria and
drop it into a window, or you can simply begin typing to fill the Box.
Adding additional bands
Once you have inserted criteria into your first Band, simply click on the greyed out box underneath
labelled "New Band". This will then automatically rename to "Band 2", and the grey box will now
become white, allowing you to insert criteria in. A new Grey box will appear under this, allowing you
to continue creating new bandings.
Removing a Banding
If you have accidentally created too many bandings, you can simply remove the banding by clicking
the "x" in the top right corner next to each banding count.
Renaming a Banding

40
To rename a Banding, simply click on the name, and re-type in a new name. See below, clicking on
"Band 3" will bring a box and text cursor around the text, allowing you to freely type in a new name.
Testing your Banding
In the above example, we have created a Parametric Banding which will decode our fields to make
them more readable. In this example, our original Gender field contains data for "M","F" and "U". In
this example we will rename these to "Male", "Female" and "Undisclosed".
Once the 3 Bands have been created, you can hover over the 3 lines "Options" section, which will
prompt the Paw menu to display
In the above screenshot, each banding has volumes against them. When the banding is first
opened, these will instead display an ellipsis "..." which will remain until the bands have been
counted, using the Paw Menu tool.
41
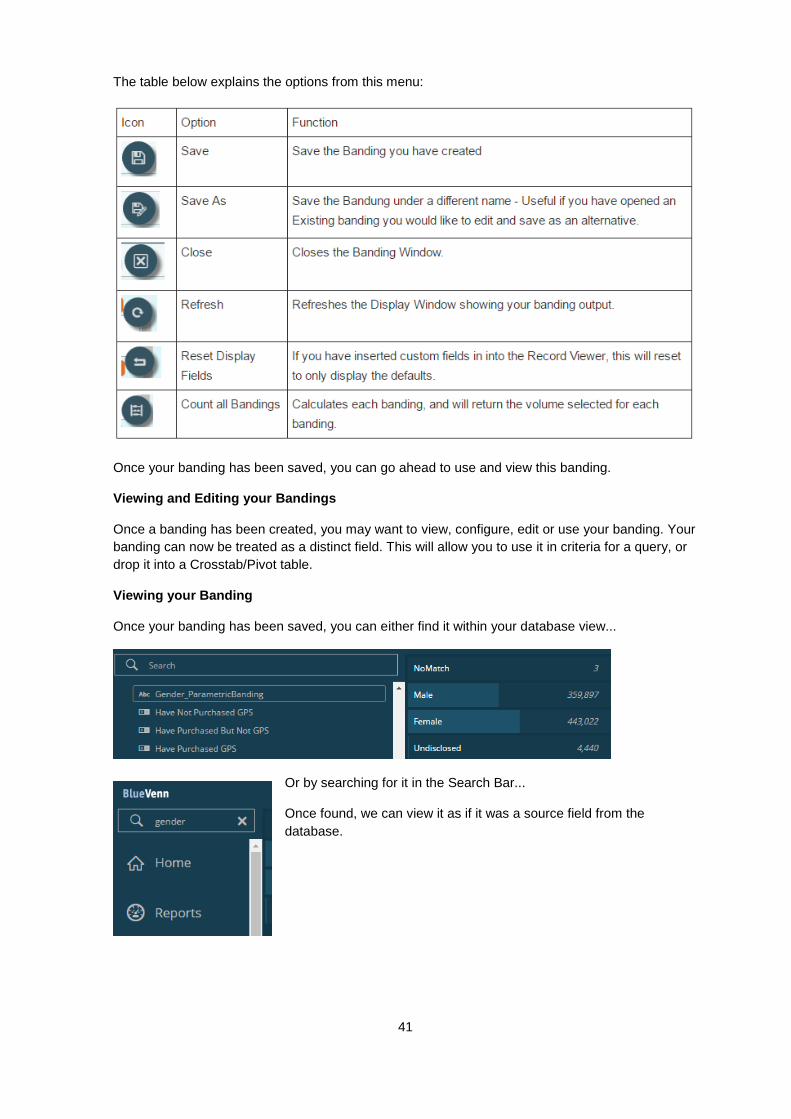
The table below explains the options from this menu:
Once your banding has been saved, you can go ahead to use and view this banding.
Viewing and Editing your Bandings
Once a banding has been created, you may want to view, configure, edit or use your banding. Your
banding can now be treated as a distinct field. This will allow you to use it in criteria for a query, or
drop it into a Crosstab/Pivot table.
Viewing your Banding
Once your banding has been saved, you can either find it within your database view...
Or by searching for it in the Search Bar...
Once found, we can view it as if it was a source field from the
database.

42
Editing a Banding
If you need to edit an existing banding you have created, simply find it within the database view
(See above on viewing your banding) and double click on the banding name. This will then re-open
the window to configure your banding.
Once you have selected to create your parametric banding, you will see from the window you are
presented with the below window:
1. Band Creator
2. Banding Options
3. Record Viewer
If you have accidentally created too many bandings, you can simply remove the banding by clicking
the "x" in the top right corner next to each banding count.
To rename a Banding, simply click on the name, and retype in a new name. See below, clicking on
"Band 3" will bring a box and text cursor around the text, allowing you to freely type in a new name.

43
In the above example, we have created a Parametric Banding which will decode our fields to make
them more readable. In this example, our original Gender field contains data for "M", "F" and "U". In
this example we will rename these to "Male", "Female" and "Undisclosed".
Once the 3 Bands have been created, you can hover over the 3 lines "Options" section, which will
prompt the Paw menu to display
In the above screenshot, each banding has volumes against them. When the banding is first
opened, these will instead display an ellipsis "..." which will remain until the bands have been
counted, using the pawprint tool.
Icon Option Function
Save Save the Banding you have created
Save As Save the Bandung under a different name Useful if you have opened an Existing banding you would like to edit and save as an alternative.
Close Closes the Banding Window.
Refresh Refreshes the Display Window showing your banding output.
Once your banding has been saved, you can go ahead to use and view this banding.
Once a banding has been created, you may want to view, configure, edit or use your banding. Your
banding can now be treated as a Distinct field. This will allow you to use it in criteria for a query, or
drop it into a Pivot display.
Reset Display
Fields
If you have inserted custom fields in into the Record Viewer, this will reset to
only display the defaults.
Count all Bandings Calculates each banding, and will return the volume selected for each
banding.

44
Once your banding has been saved, you can either find it within your database view:
Or by searching for it in the Search Bar...
Once found, we can view it as if it was a source field from the database.
Numeric Bandings
An addition to parametric bandings is the inclusion of Numeric Bandings within Engage. These will
allow you to segment and split your data into more readable chunks specifically designed to
manipulate and segment numeric fields.
To begin creating a Numeric Banding, select your
source database (in our example, our 'BV Training'
ADS). Then select the table you wish to build on. In
our example, we will be building a numeric banding
on the age of Individuals in our database, so will
focus on the Individuals table:
Once created, you will see the new window where
you can configure your numeric banding and begin to
edit how this data is segmented. By Default, the
"Source Field" dropdown will be empty. We have
then gone to select our "Age" field on the Individuals
table.
45
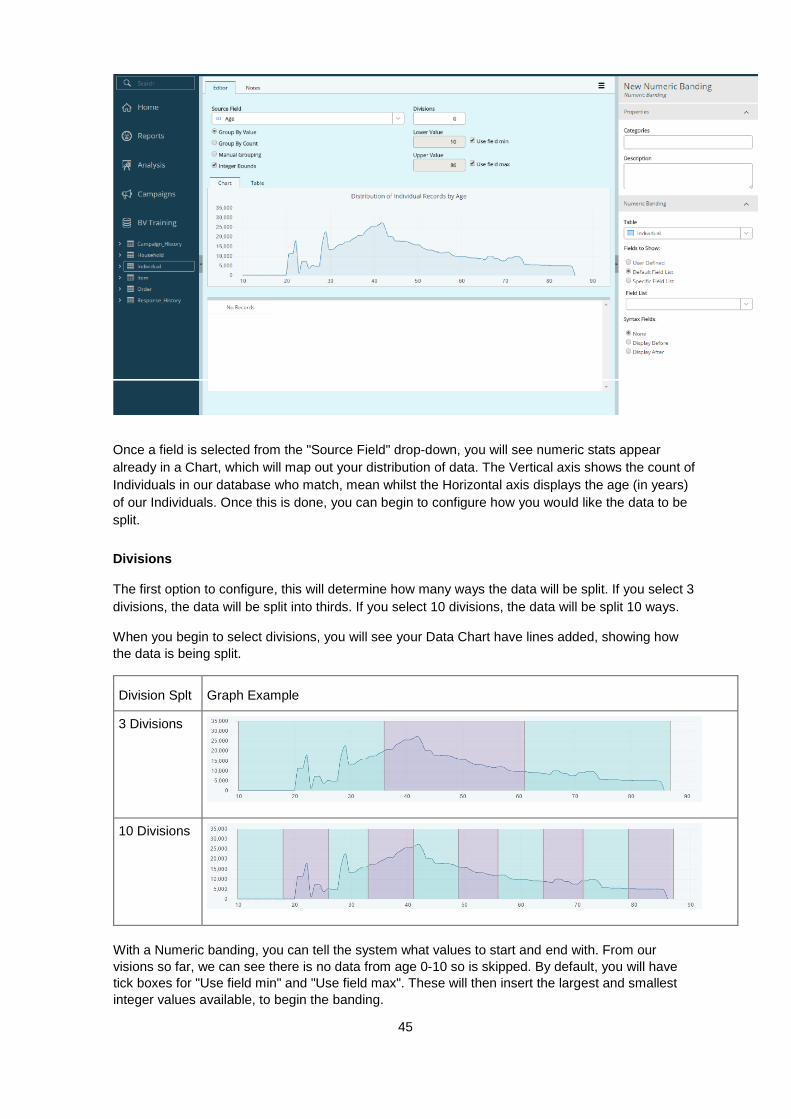
Once a field is selected from the "Source Field" dropdown, you will see numeric stats appear
already in a Chart, which will map out your distribution of data. The Vertical axis shows the count of
Individuals in our database who match, mean whilst the Horizontal axis displays the age (in years)
of our Individuals. Once this is done, you can begin to configure how you would like the data to be
split.
Divisions
The first option to configure, this will determine how many ways the data will be split. If you select 3
divisions, the data will be split into thirds. If you select 10 divisions, the data will be split 10 ways.
When you begin to select divisions, you will see your Data Chart have lines added, showing how
the data is being split.
Division Splt Graph Example
3 Divisions
10 Divisions
With a Numeric banding, you can tell the system what values to start and end with. From our
visions so far, we can see there is no data from age 010 so is skipped. By default, you will have
tick boxes for "Use field min" and "Use field max". These will then insert the largest and smallest
integer values available, to begin the banding.
46
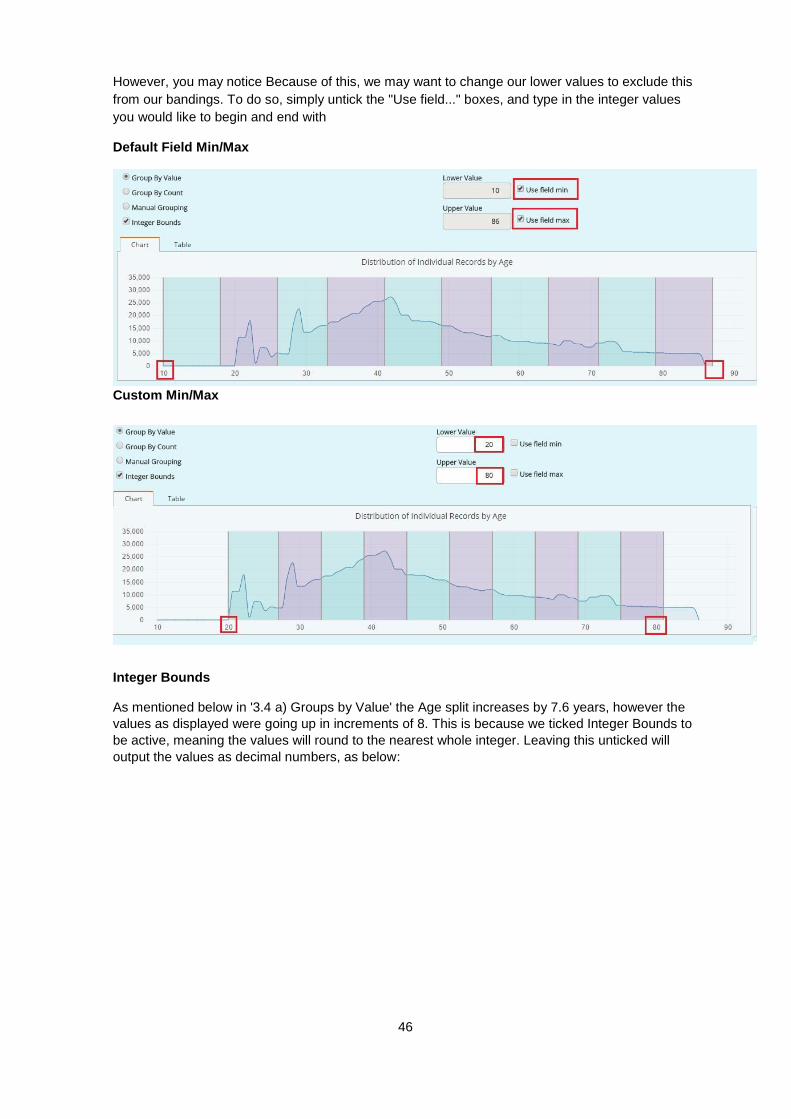
However, you may notice Because of this, we may want to change our lower values to exclude this
from our bandings. To do so, simply untick the "Use field..." boxes, and type in the integer values
you would like to begin and end with
Default Field Min/Max
Custom Min/Max
Integer Bounds
As mentioned below in '3.4 a) Groups by Value' the Age split increases by 7.6 years, however the
values as displayed were going up in increments of 8. This is because we ticked Integer Bounds to
be active, meaning the values will round to the nearest whole integer. Leaving this unticked will
output the values as decimal numbers, as below:

47
Integer Bounds Ticked Integer Bounds Unchecked
Banding Grouping Options
The next option will be to decide how you would like your output to be grouped. This will determine
how your bandings operate together and become segmented, by either of the 3 options available;
1. Group by Name
The default option, this will take your total numeric data (In this example Age ranges, from 10 to
86). As we have selected 10 Divisions, this will then split each Division equally 10 ways, as shown
by the new manipulated graph. As our total age range is between 10 and 86, each of the 10
segments will represent 7.6 years. (N.B. Ticking 'Integer
Bounds' as below will roll the values to whole numbers, so the values increment in 8s)
48
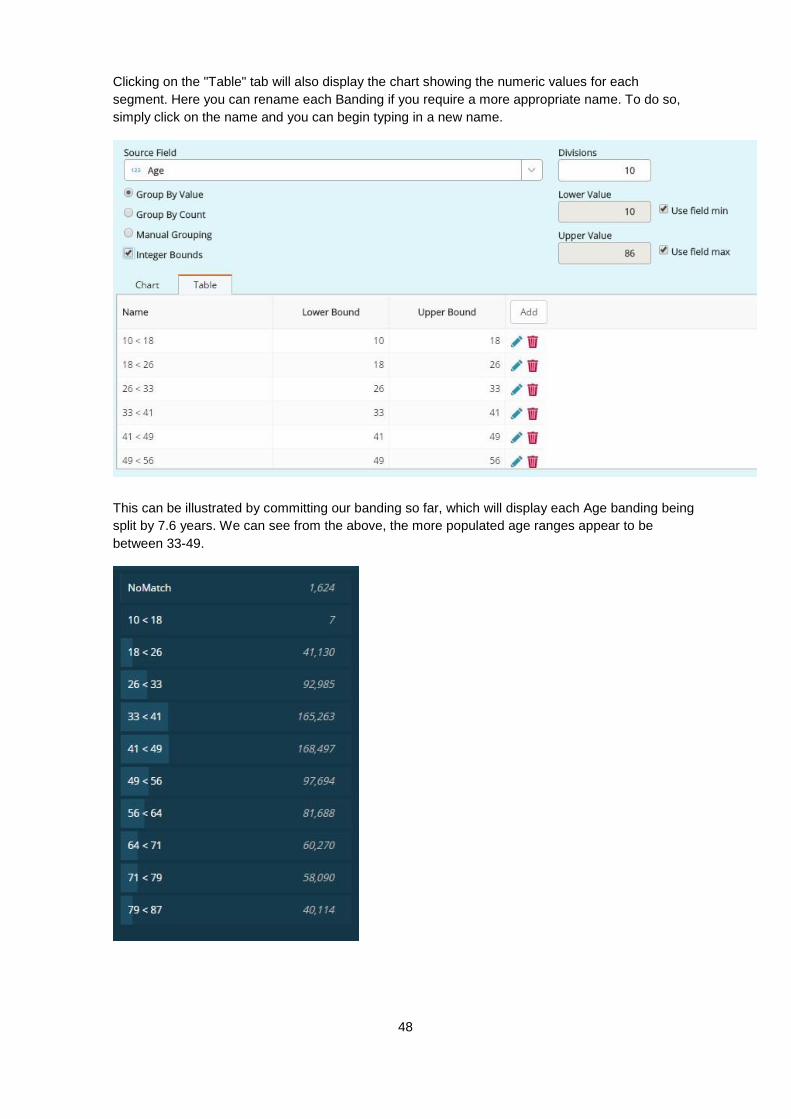
Clicking on the "Table" tab will also display the chart showing the numeric values for each
segment. Here you can rename each Banding if you require a more appropriate name. To do so,
simply click on the name and you can begin typing in a new name.
This can be illustrated by committing our banding so far, which will display each Age banding being
split by 7.6 years. We can see from the above, the more populated age ranges appear to be
between 3349.

49
2. Group by Count
Instead of grouping evenly by the Age value, 'Group By Count' will ensure each of our 10 Divisions
has an equal count of Individuals. To do this, the Age bandings will change now depending on how
each age bracket is represented within the database. As our database has a large representation
of Individuals between the age of 3545, these sections will include a smaller range of Ages, to
ensure each Division has the same volume of Individuals.
However as our Database includes a very under represented volume of individuals between the
age of 10 and 29, this is all included within one Division, as illustrated below.
Clicking on the "Table" tab will also display the chart showing the numeric values for each
segment. Here you can rename each Banding if you require a more appropriate name. To do so,
simply click on the name and you can begin rename each Banding if you require a more
appropriate name. To do so, simply click on the name and you can begin typing in a new name.

50
Once committed, we can see each Division has an equal distribution of Individuals within each.

51
3. Manual Grouping
Whilst 'Group by Count' and 'Group By Value' will automatically create the banding parameters for
you, there is also the functionality to create your own bandings manually.
To do this in the chart view, you can simply click and drag on any of the division lines, to arrange
them how you see appropriate. You will know which line is being moved, by the line turning Red as
below (see line by the 30year mark)
The same can also be done by clicking on the "Table" tab, which will allow you to type in and
create your divisions and banding parameters, to give more precision in configuring these values.

52
‘Real-time’ & Dynamic Data

53
Real-time & Dynamic data
Dynamic Splits
As Engage is offering new metrics to be able to load in, manipulate and manage your data, there is
also the need to be able to split your data in campaigns, based on the outcomes of these new
features. In order to accommodate this, the new "Decision" node has been created; "Dynamic Split"
When dragged out, this node works similarly to a Query split, where you will select one set of data
based on your data, the split the remainder of your data elsewhere.

54
Source Types
As you can see with the above image, there are 3 source types available;
Source
Type
Release
Version
Function
Model
2017.1
Using R Logic's modelling module, the dynamic split module will score
and rank contacts based on their Model's score. Anyone who fits into
the assigned ranking/criteria will be passed through the Output, whilst all
others are passed into the "remainder". This scoring is based on the
below Source Score criteria.
N.B. This is the only Dynamic split Source which uses the "Remove
records that already match" Function. When ticked, any Individuals
passed through the split who were included in the original model criteria
won't be included in the Output.
External
Data
2017.2 With Engage's new External Data feature, any contacts who link and
match to the external data will be passed through the Output.
Nurture
Scoring
2017.2
Using Engage's new Nurture Scoring, anyone whose Nurture score fits
in with the below Source Score criteria will be passed through the
Output channel.
Source Score Criteria
The "Take Type" gives you a number of options, to decide how you would like to split this data.
These values will be based on either your Nurture or Model Scores.

55
Take Type Description
Take First Using an Integer, this will select N amount of individuals, ordered
Descending with the highest value first.
Take Last Using an Integer, this will select N amount of individuals, ordered
ascending with the lowest value first.
Take Over Will select all individuals who have a value higher than N
Take Under Will select all individuals who have a value lower than N
Take Equal Will select all individuals who have a value equal to N
Take Not Equal Will select all individuals who have a value which is not equal to N
Note the "Remove records that already match criteria" option will be greyed out for Nurture Scores
and External Data, as this only applies to Source Types of "Model" when using the Modelling
nodes.
In the below example, we have taken our full marketable database, then used the Dynamic Split to
split everyone with an engagement score of 150 or higher, and pushed these through to a special
offer campaign, whilst the remainder receive the monthly newsletter:

56
As shown, of the 498k marketable individuals in the system, 74.4k have an engagement score of
150 or higher, based on their previous interactions within our campaigns.
The remaining 421k individuals are pushed through to the regular newsletter, once these have
been split.

57
Models
Selection Prediction & Cluster Models
This provides the ability to build predictive models using R modelling capabilities. Using a target
audience, reasonable demographic variables and an optional comparison domain, users can
predict how likely a contact is to react in the same way as the target audience.
For example, to find contacts who are likely to become GPS customers we can identify those
people that already are and use them as a target.
Demographics can then be fed in for use by the model predication process to identify the key
characteristics of a GPS customer, and how they correlate to the rest of the domain.
Once the model design is complete, the training process runs through the prediction tests using a
cutting strategy to cut the data and compare variables against the target to predict a model to
score. This process repeats several times and derives a score, which is accompanied by a
robustness to indicate how robust the model is.

58
Training a Model
To train a model design, select the Train Model icon from the hamburger menu as shown below:
Once the training process is complete, which can last a few minutes for large data selections, the
robustness score and statistics will be calculated.
The scoring process produces a Boolean value of 01 with a staged increase in likelihood up to 1.
The model can the be used to determine people who are predicted to be GPS customers using a
simple selection like this, where 0 means unlikely, but up to 1 is highly likely. Below is requesting
the Top 500 likely GPS customers based on the model prediction score:

59
A 5star model is the best possible, so we can Score this model enabling it to be used in Selections
and Campaigns.
A 5star model is the best possible, so we can Score this model enabling it to be used in Selections
and Campaigns.

60
Scoring a Model
To score a model design, select the Score Model icon from the hamburger menu as shown below:
Using Models in Selections
The Model is used within a Selection using the Prediction node, as shown below:
Once added, the criteria available for using the model is available on the context panel to the right.
The model is chosen from the list, then the 'Take Type' is specified from a range of options. These
are:
Take First Number of records Takes the first N records from the table that have been
scored by the model, for a specifically sized record
selection
Take Last Number of records Takes the last N records from the table that have been
scored by the model, for a specifically sized record
selection
Take Over Score Takes all records that are above a given score, from the
decimal range between 0 to 1
Take Under Score Takes all records that are below a given score, from the
decimal range between 0 to 1
Take Equal Score Takes all records that are equal to a specific score
Take Not Equal Score
Takes all records that are not equal to a specified score

61
Using Models in Campaigns
The Model is used within a Campaign using the Prediction step, as shown below:
Again the criteria for how the model is used is the same as that shown above for a selection. The
incoming Audience step will be evaluated to determine if any records meet the criteria of those
modelled, for example if they already bought the product.
These records then drop into the remainder total during processing, and from the model, the 'taken
records' pass through to the next stage of the campaign.
In the example above the audience contains no records that meet the model requirement, a score
of over 0.2. The query split step shows us 24 records belong to Individuals from the incoming
Audience that already have a GPS product.
Cluster Models
The process to building a Cluster model is very similar to the outline provided above for selection
predication models, but the result and outcome of cluster model should be interpreted differently.
Clustering is the task of dividing the main contact group or data points into a number of groups so
that data points in the same groups are more similar to other data points in the same group than
those in other groups. In simple words, the aim is to segregate groups with similar traits and assign
them into clusters.

62
Cluster models will then allow the user to select groups of contacts for analysis or campaign
purposes that have been identified within the clusters produced inside the model.
Design View
Analysis Table - the contact or person level of the database at which the model is being
produced
Modeling Method - this is the algorithm and method to be used for the cluster model
Variables - this area is used to add the variables for use within the model, clusters will be
based on the values of these variables. It is often advised to use clean data variables with
reliable values that will be valuable to the quality of the model
Model Query - this optional query is used for specifying the contact data set for which the
model should be based upon. This can contain a sample query for models to apply to the
entire contact table and then removed once tested.
Once the model design is complete, the training process runs through the cluster evaluation
process.
Evaluation Process
Evaluation of a cluster model takes the selected variables and uses a subset of the data to try to fit
the variable against a range of clusters.
Once the evaluation has been performed, an elbow chart is generated to display how much more
successfully each additional cluster fit the variables that have been evaluated.

63
A good indicator of how many clusters users to generate is the data point at which the line ceases
to drop.
Once the data point is selected, indicating as above that the user requires 3 clusters to be
generated, the Training process can be started.

64
Training Process
The Training process takes the selected variables and the desired number of clusters then tries to find the best method of fitting all those variables in a cluster. Once training has been performed, the cluster definitions are saved into the model.
The model Training details are displayed on completion, as shown below.
There isn't a rating system applied to Cluster models, as a cluster cannot be proven as better than another, it represents a different correlation to other data variables used and matched within other clusters.
Each cluster number (1-3) is recorded against every corresponding record in the source data table as a new value. The trained model must be scored to record the clusters information.

65
Scoring a Model
To score a model design, select the Score Model button from the screen as shown above, which will produce the Score information below but will also write the cluster values to the database.
As with Selection Prediction Models, Cluster Models may be scheduled to be Trained and Scored
on a regular basis.

66
Campaigns
67
Campaigns in Engage
Campaigns in Engage can be either:
A one-off, personalized communications with a promotional offer of a product, service or
event for customers or prospects to buy
A multi-stage, linear series of communications that advise contacts of your business offer
at a relevant stage of their lifetime with your business, be that as a lead, prospect or
customer
A multi-stage journey of decisive messages that may cross several campaigns with
audience criteria that is based on transactional and demographic data, combined with
engagement data gathered from interactions with previous campaigns in the journey
For a lead, you may be presenting your product or service offering across a series of speculative
messages that are designed to entice the lead to react to specific details of the communications
For a prospect you may know more about their preferences, have a little history of their
engagement and be able to target offers effectively
For a customer you may be looking to cross-sell, up-sell gather reviews, retain loyalty or simply
ensure repeat orders for your business
Campaign Wizards
Within Engage there are Campaign Wizards that allow users to step through questions to build a
campaign framework.
The Anniversary Campaign Wizard is used to build a one-off promotional campaign to recognize a
birthday, renewal date, trip anniversary or anything connected to a date.
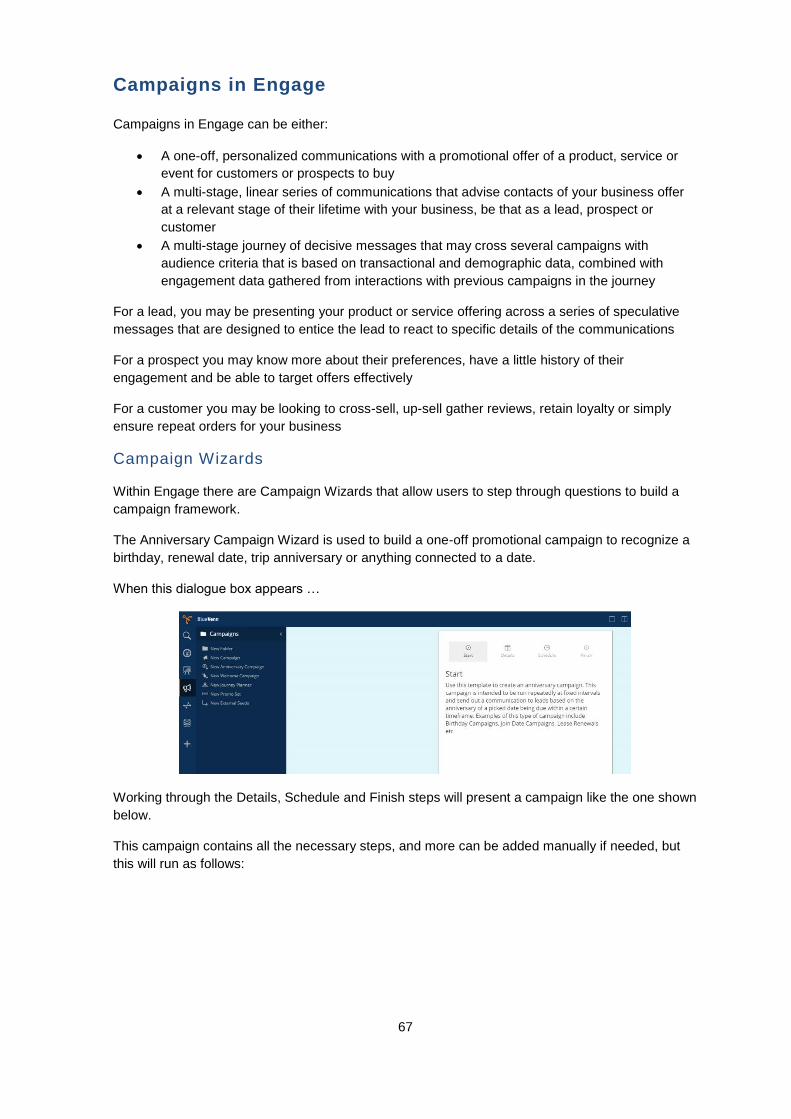
When this dialogue box appears …
Working through the Details, Schedule and Finish steps will present a campaign like the one shown
below.
This campaign contains all the necessary steps, and more can be added manually if needed, but
this will run as follows:

68
Audience – this step identifies all contacts that have a membership renewal pending in the
next 7 days
Communication – this step outputs the data to the email channel, to send the renewal
notice to all relevant contacts
Wait – this step holds the contacts for 7 days, so if this campaign runs daily, contacts will
not be send the email more than once
Exit - after 7 days, the contacts being held are released and available for the next relevant
offer or next year’s renewal campaign
There is another, more complex multi-stage campaign wizard called New Welcome Campaign,
which allows a second communication step to be configured.
While the wizards are useful, there is often a need to alter or add steps to suit specific
requirements. Therefore, we will explore the steps in more detail and understand their use within
campaigns.
Campaign Steps
There are several campaign steps can be used to build a campaign workflow, allowing audiences
to enter processing, decision based split of paths through the campaign and management of
communications, timing and scheduling.
To make sense of this, the steps are split into three types:
1. Audience – allows data to enter the campaign, these steps are coloured green
2. Decision – allows the audience to be split by criteria enabling audiences to be managed
differently based on data, preferences, actions or triggers. These steps are orange
3. Action – shown in red, these steps allow data to leave the campaign as a communication
or exit, hold records for responses or test outcomes
69
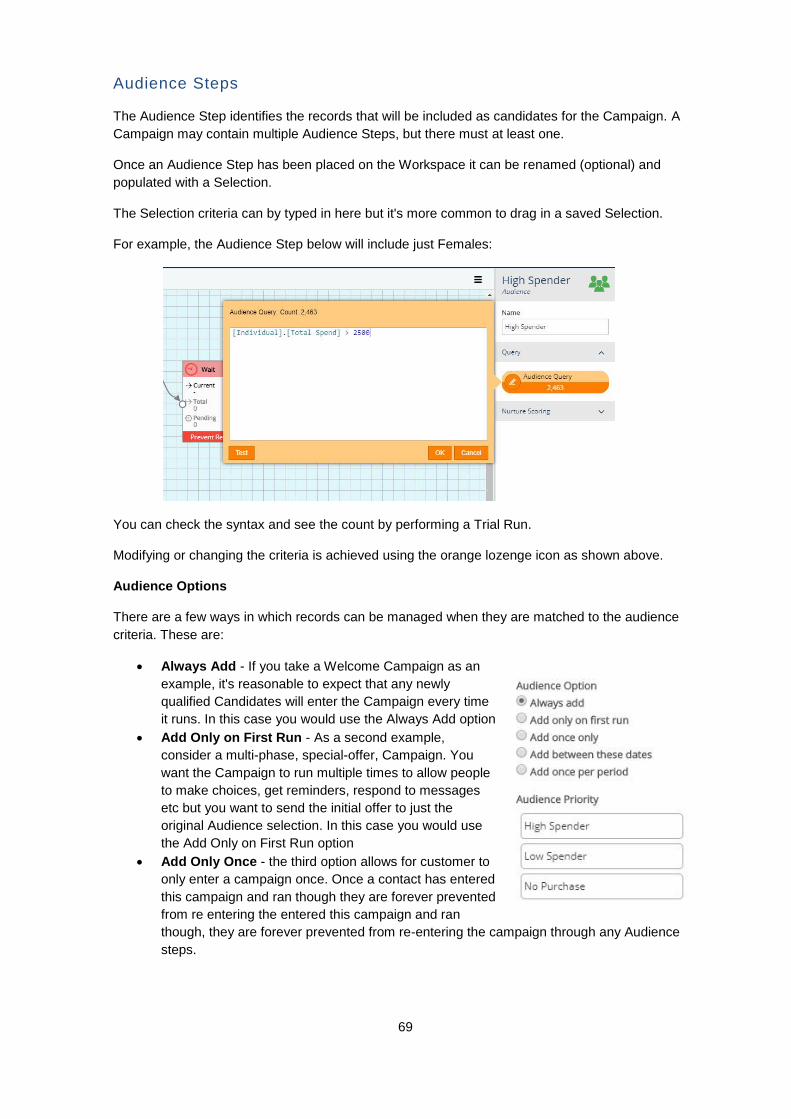
Audience Steps
The Audience Step identifies the records that will be included as candidates for the Campaign. A
Campaign may contain multiple Audience Steps, but there must at least one.
Once an Audience Step has been placed on the Workspace it can be renamed (optional) and
populated with a Selection.
The Selection criteria can by typed in here but it's more common to drag in a saved Selection.
For example, the Audience Step below will include just Females:
You can check the syntax and see the count by performing a Trial Run.
Modifying or changing the criteria is achieved using the orange lozenge icon as shown above.
Audience Options
There are a few ways in which records can be managed when they are matched to the audience
criteria. These are:
Always Add - If you take a Welcome Campaign as an
example, it's reasonable to expect that any newly
qualified Candidates will enter the Campaign every time
it runs. In this case you would use the Always Add option
Add Only on First Run - As a second example,
consider a multi-phase, special-offer, Campaign. You
want the Campaign to run multiple times to allow people
to make choices, get reminders, respond to messages
etc but you want to send the initial offer to just the
original Audience selection. In this case you would use
the Add Only on First Run option
Add Only Once - the third option allows for customer to
only enter a campaign once. Once a contact has entered
this campaign and ran though they are forever prevented
from re entering the entered this campaign and ran
though, they are forever prevented from re-entering the campaign through any Audience
steps.

70
This function is useful for re-engagement and welcome campaigns, which you will want to
send routinely to new contacts or customers who now match a specific criteria however,
would not want to send multiple times to the same contact.
Add between these dates – this option would be used (for example) if you were running a
Campaign where people could buy tickets for an event. Obviously the Campaign would
have an End Date so that it doesn't run after the date of the event but there's another
issue. As with the above example of "Add only on first run", you want the Campaign to run
multiple times but you need to stop adding new Candidates a few days before the date of
the event to give you time to ship the tickets. In this case you would use the Add between
these dates option.
This means your campaign can continue to run to move records through the journey,
without having to manually prevent new records from feeding into the campaign after a
certain time.
Add once per period – to ensure that a contact did not receive a repeating campaign too
often, such as a 10% discount message following every purchase, this option can be
employed to restrict the number of times the campaign sends a communication. If John
makes a purchase then he could qualify for the audience and receive the communicated
10% discount for a repeat purchase, but if John then purchases again within the period
specified, perhaps within a month, he’ll not be added to campaign audience again. Should
he repurchase after the 1 month period specified then he’ll be selected and send the
communication again when the campaign is next ran.
Audience Priority
In a Campaign with multiple Audiences, like this ...
... the prioritization does not change to the order in which they were added to the campaign canvas.
71
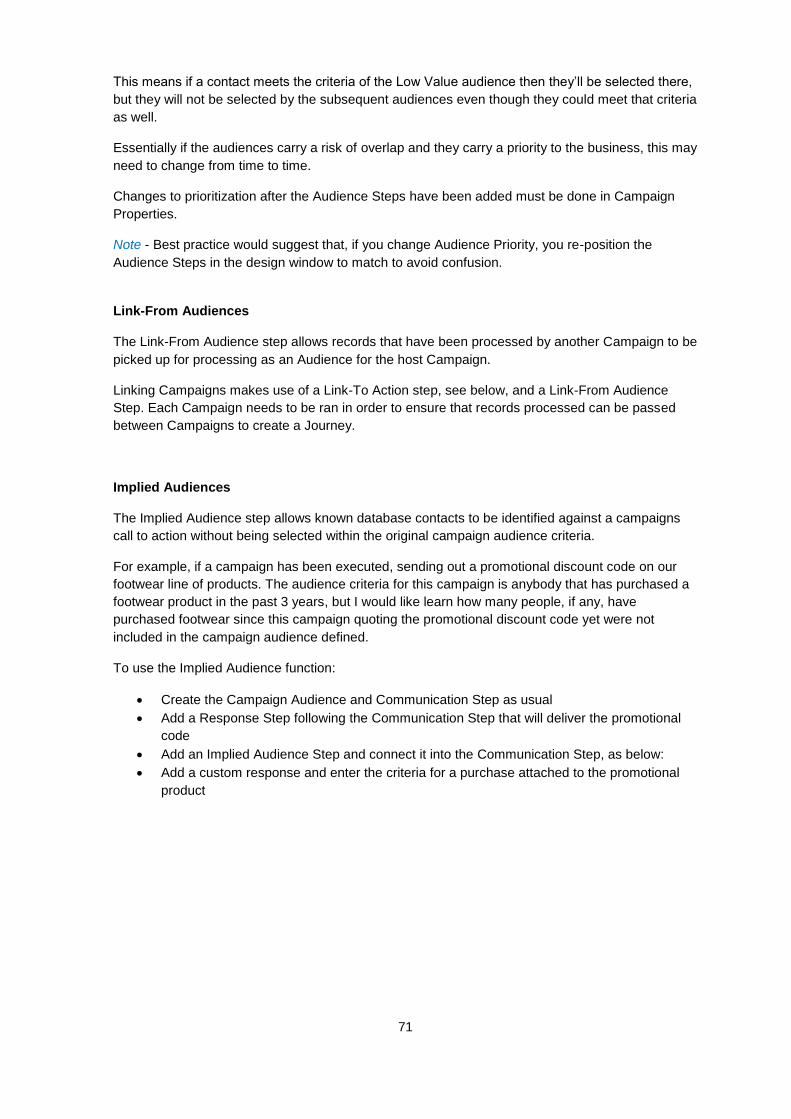
This means if a contact meets the criteria of the Low Value audience then they’ll be selected there,
but they will not be selected by the subsequent audiences even though they could meet that criteria
as well.
Essentially if the audiences carry a risk of overlap and they carry a priority to the business, this may
need to change from time to time.
Changes to prioritization after the Audience Steps have been added must be done in Campaign
Properties.
Note - Best practice would suggest that, if you change Audience Priority, you re-position the
Audience Steps in the design window to match to avoid confusion.
Link-From Audiences
The Link-From Audience step allows records that have been processed by another Campaign to be
picked up for processing as an Audience for the host Campaign.
Linking Campaigns makes use of a Link-To Action step, see below, and a Link-From Audience
Step. Each Campaign needs to be ran in order to ensure that records processed can be passed
between Campaigns to create a Journey.
Implied Audiences
The Implied Audience step allows known database contacts to be identified against a campaigns
call to action without being selected within the original campaign audience criteria.
For example, if a campaign has been executed, sending out a promotional discount code on our
footwear line of products. The audience criteria for this campaign is anybody that has purchased a
footwear product in the past 3 years, but I would like learn how many people, if any, have
purchased footwear since this campaign quoting the promotional discount code yet were not
included in the campaign audience defined.
To use the Implied Audience function:
Create the Campaign Audience and Communication Step as usual
Add a Response Step following the Communication Step that will deliver the promotional
code
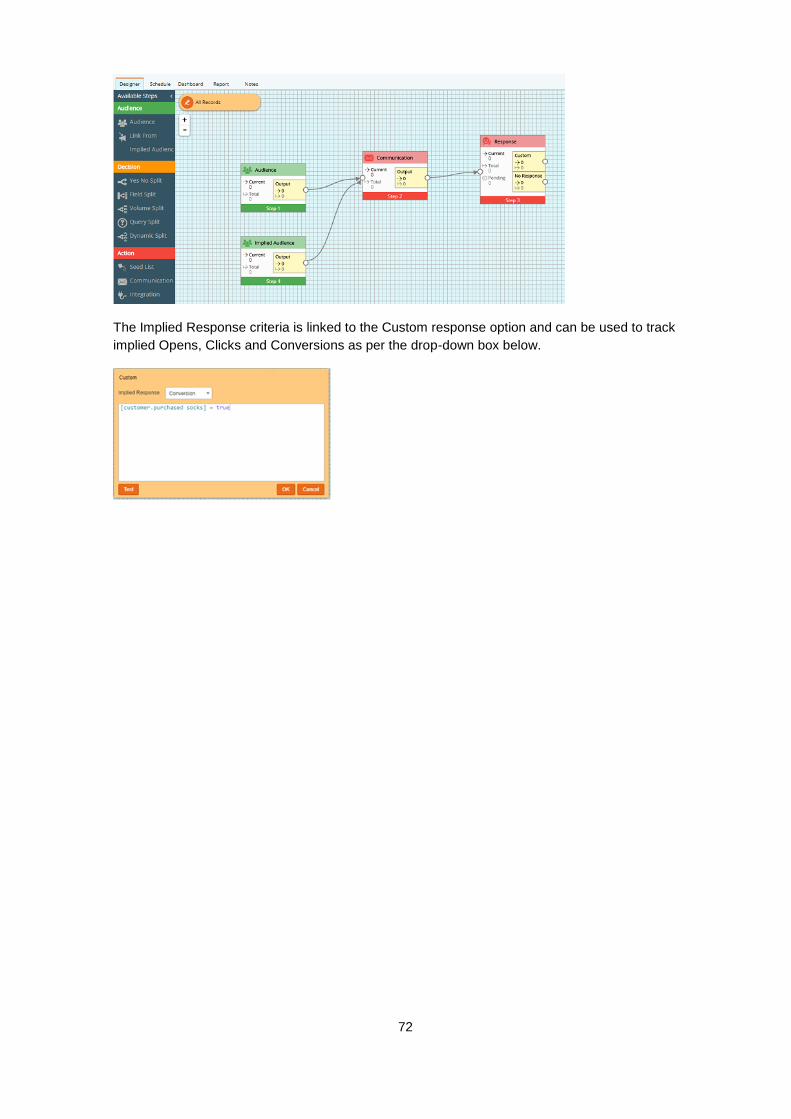
Add an Implied Audience Step and connect it into the Communication Step, as below:
Add a custom response and enter the criteria for a purchase attached to the promotional
product
72
The Implied Response criteria is linked to the Custom response option and can be used to track
implied Opens, Clicks and Conversions as per the drop-down box below.

73
Decision Steps
Decision Steps determine where records are moved next within the campaign. The Decision can
result in multiple outputs from the campaign or a single journey based on a true or false decision.
The steps available are:
Yes No Split
Field Split
Volume Split
Query Split
Dynamic Split
The Yes No Split Step lets you branch the Campaign flow based on whether records do or do not
match Selection criteria.
Once an Audience Step has been placed on the Workspace it can be renamed (optional) and
populated with a Selection.
The Selection criteria can by typed in here but it's more common to drag in a saved Selection.
For example, with this Yes No Split Step, Individuals who drive a Ford will go down the Yes branch
and everyone else will go down No:
The same principle applies to other Decision Splits. It is possible to have multiple splits within a
Campaign to manage the various stages and conditions of the campaign flow.
Action Steps
Action Steps perform some kind of import action, to move records along the campaign or hold
records at specific points.
The steps available are:
Communication Step
Wait Step
Response Step
Exit Step
Tag Step
Dedupe Step
Seed Step
Control Step
Link To/Link From

74
The Communication Step is probably the most important, and can also be thought of as an output
step.
For example, if your Email Services Provider (ESP) is one with which we have partnered, you can
use a Communication Step to upload the candidate list, match to a creative and send an email or
SMS campaign as here:
A Communication Step requires a Channel and a Field List.

75
Linking Campaigns
Campaign Links allows users to easily push and pull data across two separate campaigns. This
helps to streamline and intertwine multiple campaigns, and is the first stage in developing a full
platform customer journey. The first stage of this is through the introduction of two new Elements in
a campaign workspace, and the first time a new Campaign Audience/Input element has been
introduced; Link To and Link From
Link To
Link To is the first step we will look at, in which you can add in the action to link any records
directed to that step, into another campaign:
As we can see, the records above journey through the "Link To" campaign, where they will now be
available to be inserted into another campaign, via our new Audience step, "Link From..."
Link From
As highlighted in our Available Steps, Link From is our new addition to our Audience steps. This
allows us to pull data into the campaign, treating this data as a new audience. This allows us to pull
this data without the requirement of writing the syntax / audience criteria into an audience node.
Here we can see the 360 individuals pushed through our "Link To..." step, being fed into our
second stage of our customer journey.
Once this is linked and data is transferring, we can see this relationship back in our original Link To
Step. As highlighted below, we can see this Link To step is now linked to Stage 2 of our Welcome
Journey, and is feeding our data through.
From now on, as each of our campaigns runs, the data is passed from one Journey into the other,
without any further intervention.
76
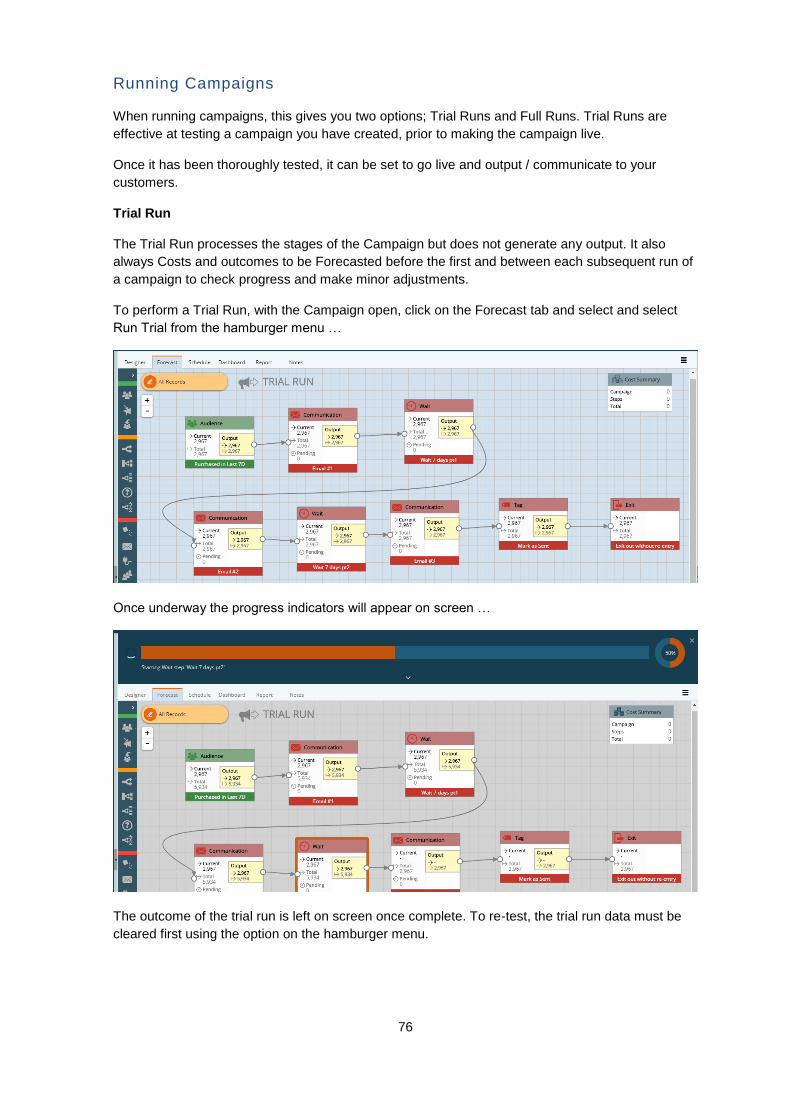
Running Campaigns
When running campaigns, this gives you two options; Trial Runs and Full Runs. Trial Runs are
effective at testing a campaign you have created, prior to making the campaign live.
Once it has been thoroughly tested, it can be set to go live and output / communicate to your
customers.
Trial Run
The Trial Run processes the stages of the Campaign but does not generate any output. It also
always Costs and outcomes to be Forecasted before the first and between each subsequent run of
a campaign to check progress and make minor adjustments.
To perform a Trial Run, with the Campaign open, click on the Forecast tab and select and select
Run Trial from the hamburger menu …
Once underway the progress indicators will appear on screen …
The outcome of the trial run is left on screen once complete. To re-test, the trial run data must be
cleared first using the option on the hamburger menu.

77
Full Run
Full runs of the campaign can be triggered from the Designer tab, using the hamburger menu icon
as shown below …
As with the trial run, the progress of the run for the campaign will be shown as it sends the
communication data out through the relevant channels for communications and to record the
history of event.
Scheduled Run
If there is a requirement to run the campaign more than once, on a regular schedule or at a
convenient time, then the Schedule tab can be used to administer this.
From the Schedule tab, clicking Add Schedule Item will present the drop-down options as below …
Once scheduled, the campaign will fire and process the records available to the audience, move
contacts through the campaign and provide communications along the journey.
78
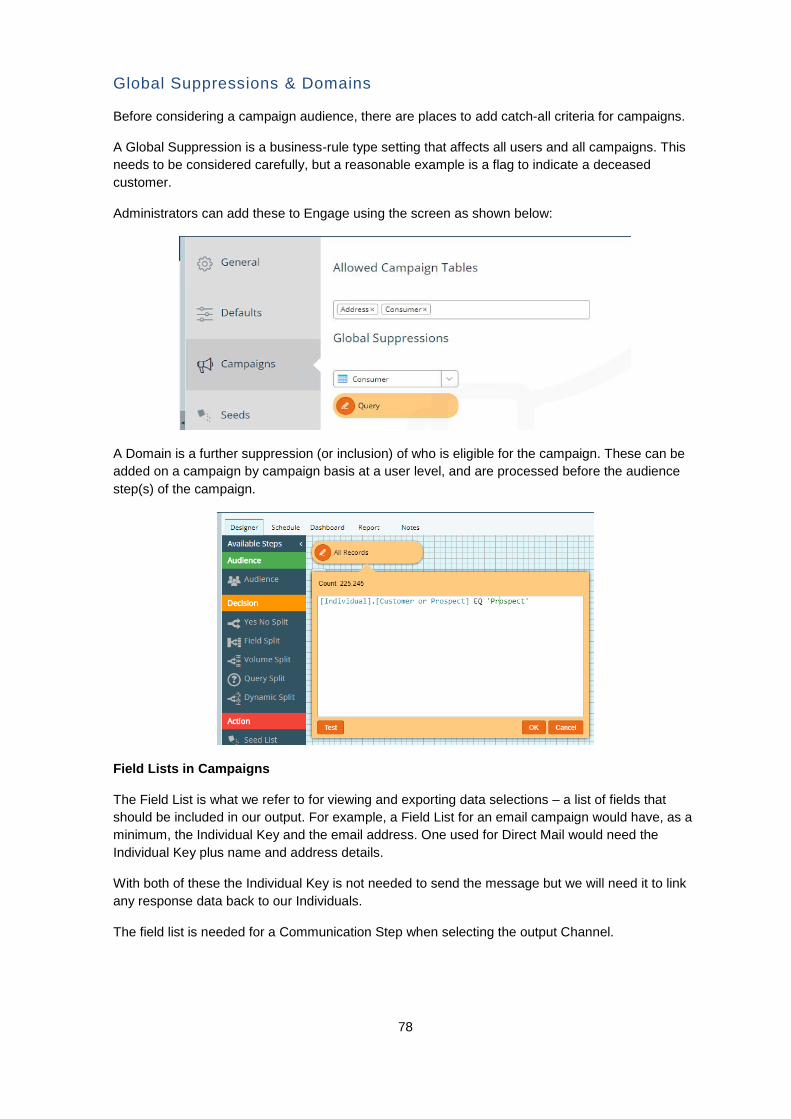
Global Suppressions & Domains
Before considering a campaign audience, there are places to add catch-all criteria for campaigns.
A Global Suppression is a business-rule type setting that affects all users and all campaigns. This
needs to be considered carefully, but a reasonable example is a flag to indicate a deceased
customer.
Administrators can add these to Engage using the screen as shown below:
A Domain is a further suppression (or inclusion) of who is eligible for the campaign. These can be
added on a campaign by campaign basis at a user level, and are processed before the audience
step(s) of the campaign.
Field Lists in Campaigns
The Field List is what we refer to for viewing and exporting data selections – a list of fields that
should be included in our output. For example, a Field List for an email campaign would have, as a
minimum, the Individual Key and the email address. One used for Direct Mail would need the
Individual Key plus name and address details.
With both of these the Individual Key is not needed to send the message but we will need it to link
any response data back to our Individuals.
The field list is needed for a Communication Step when selecting the output Channel.

79
Channels
Channels are created, and made available to users within Campaigns, to manage the output
methods for processing the Communication.
A channel will be configured to request the relevant information to fulfill the communication. For
example:
Text Channel – outputs a flat file in a pre-defined format. Requirements are a Field List.
Email Channel – outputs data records directly into a database for processing, upload to an
Email Provider and sending of an Email creative (campaign in the Email Provider).
Requirements are a Field List, Address Book to upload records to and an Email Creative to
send (both selectable from the Channel)
FTP Channel – outputs a flat file that is uploaded from a specific folder to the FTP site
configured within the channel
Social channel – a Facebook or Twitter channel is used to post an advert to those contacts
who can be matched by email address exported from an Engage campaign to that used in
the social media application. When a match is available, the contact will see the campaign
when using their social media account.
Channels are created for users of Engage, by BlueVenn consultants or your Administrator.
Integrated channels such as ESPs or social channels require a Connector which manages the
pushing and pulling of data between Engage and the channel.

80
Reports
Reports are used to display results of user analysis.
Currently, Engage allows reporting at two level using different approaches:
1. Campaign run reports and Dashboards – Report and Dashboard tabs found inside each
Campaign to display the latest run(s) of a campaign
2. Linked reports - Many of our Engage customers use products like Tableau, Google
Analytics and Power BI to provide insight into the performance of marketing campaigns
that are deployed from the solution. These third-party reporting tools provide publishing
options meaning a shared URL can be used to access the reports. These URLs can be
embedded into Engage.
To View Campaign Reports & Dashboards
Browse for your campaign and drag it out to open it.
1. Click on the Dashboard tab, adjust the date ranges as needed:

81
2. Click on the Report tab, adjust the run number to focus as needed:
Each Audience step, Communication step, Channel and run is detailed within this report. When an
active channel, connected to an email provider, social network or integration that provide response
data is available, response event values are also reported here.
To add a linked Report
Click Reports > New Linked Report
Enter the URL into the Address bar and hit Save. The data held within the published report will be
visible and updated in real-time with the third party provider.
82
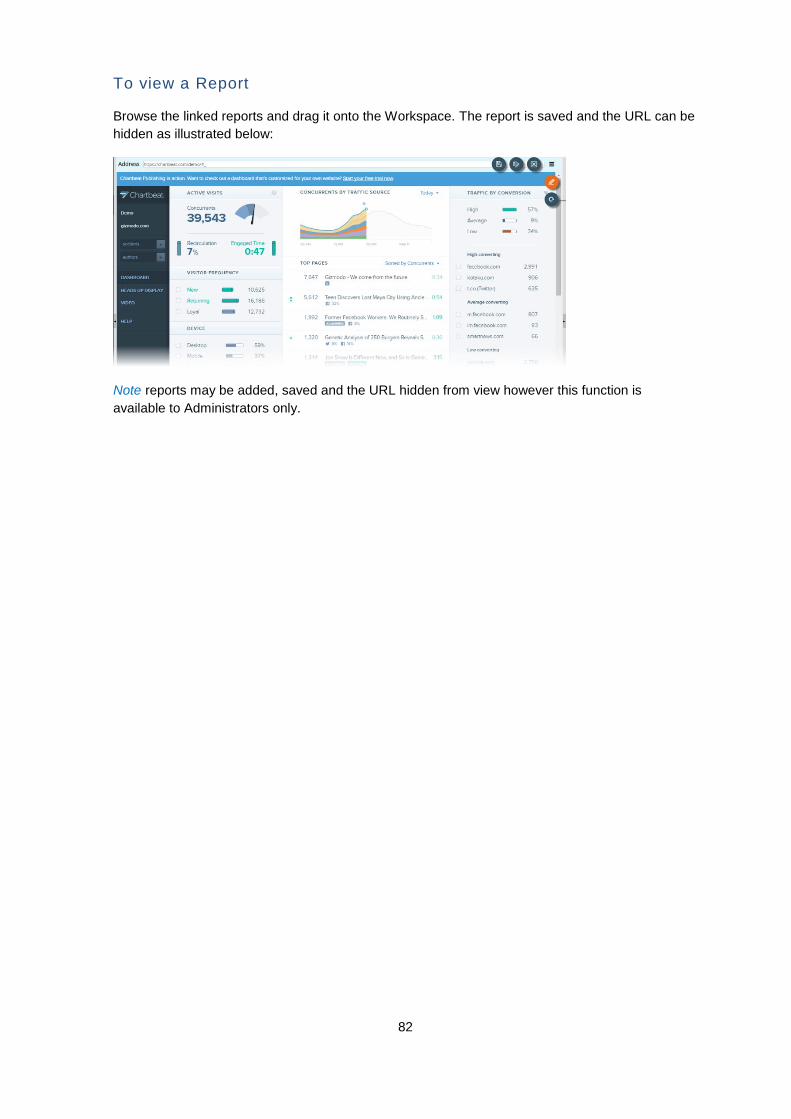
To view a Report
Browse the linked reports and drag it onto the Workspace. The report is saved and the URL can be
hidden as illustrated below:
Note reports may be added, saved and the URL hidden from view however this function is
available to Administrators only.

83
Notes

84
Further Reading & Next Steps
Please visit our Help Centre to read more about Engage and to gain assistance for the solutions
we provide – you will find the web address below.
Coaching & Workshops
The transition from theory to practice can often be a difficult one, so our Customer Success team
are able to offer coaching in specific areas to ease this process. Short, on-site or web-based
instructor-led sessions can be provided to guide you through best practices on-screen and give
advice on how to best leverage your data within the BlueVenn solution suite.
Please contact [email protected] to discussing booking some coaching assistance.
Feedback:
Please provide feedback on your training and workshop experiences here, this helps us improve
the service we give to our customers:
http://bit.ly/bv916fb
Help/Support:
Email questions to our team at the address below and read through our help articles and guides in
the Help Centre:
Support Email – [email protected]
Help Centre – http://help.bluevenn.com

85
Appendix A
Comparison of Database Terms
ADS users (blueANALYZER or MaaX) will most likely want to utilize data items created in the
source database (ADS) and the Engage database. All derived data objects created in the ADS are
available for use in Engage.
The table below explains how these elements compare and therefore, may be used within Engage.
This is recommended information for users of blueANALYZER or MaaX who now have access to
Engage and wish to compare the functionality between software.
ADS Engage Comparison and Uses within Engage
Virtual Field Expression
Virtual Field - if the field is discrete, then a list of possible options will appear for drag and drop selection onto Workspace.
A discrete Virtual Field can be displayed in the same way as a Banding in the ADS, listing all values and count. The result is a Pivot display.
Expression - the expression can only be used within a Engage Query.
Banding Pivot
When a Banding created in the ADS is dragged onto the Workspace it is displayed as a Pivot. Pivot displays contain the same information as a Banding display, with data labels and counts beside one another.
A Banding can also be created inside Engage, but it is stored on the ADS directly and therefore appears in the Source Data view.
It is not possible to create a Pivot without a Banding being available first.

86
ADS Engage Comparison and Uses within Engage
Query or
Selection
(drag n
drop)
Selection
These are used for the same purposes between products. When a query is opened in ADS, the count of records meeting the criteria is displayed as a record selection.
In Engage, a Selection Query displays a value of In this Set or Not in this Set, so the In this Set option needs to be dragged out to display the query results. Both the query syntax and records meeting the criteria are displayed.
Object Tag
The equivalent of an Object in Engage is a Tag, however Objects from the ADS can be used in the same way as a query.
Objects will need to be maintained within the ADS for use in Engage. A Tag however can be created, appended or deleted from within a Engage Campaign.
Crosstab Pivot The Crosstab, an interaction of two or more bandings on a single display, is known as a Pivot within Engage.
Campaign Campaign Campaigns exist in both products however they are created, saved and processed differently. It is not possible to import campaigns created in the ADS into Engage, therefore they must be created from scratch in Engage either using a wizard or from an empty canvas.

87
Appendix B
Engage Expression Syntax
Expression and Selection query syntax in Engage is based on MS-SQL query language however
uses its own set of statements, commands and variables.
The list below details the Engage Marketing Platform expressions and data type definitions. This
will be expanded on over time and updates will be referenced from the Online Help Articles in the
Engage Help Centre.
Data Type Definitions
Currency A system of money used in various countries.
DateTime Represents a point in time, typically expressed as a date and/or time of day.
Geographic
Postal or zip code based data type used for distance calculation and mapping data.
Integer A positive or negative whole number, or zero.
Text Any written material including letters, numbers and characters also used to define a literal value when contained in quotation marks.
Boolean Holds values that can be only True or False. For example 0/1, Y/N or True/False.
Decimal
A fraction written in the form of a dot followed by one or more numbers. For example 1.00.
Function Definitions
Abs Returns: Decimal Category: Maths Functions Parameters:
o fieldNameOrValue Decimal The numeric field or value to perform the calculation on.
Returns the Absolute Value of a number i.e. "The distance from zero" irrespective of whether it is a positive or negative value.
After Returns: Boolean Category: Parameters:
o fieldName Text The field on which to sort records by.

88
o sourceQuery Text A query string that represents the set of records to check.
o targetQuery Text A query string that represents the set of records to check.
o filterQuery Optional Text A query string so that you can restrict the records being checked.
Takes the child records for each parent and sorts them by the field specified in the fieldName parameter. Checks the source query against the target query and returns True if any of the records in the source query came after those in the target query.
Age Returns: Integer Category: Date Functions Parameters:
o dateFieldOrDate Text A date field or value.
Returns the age in years from the value supplied to the current system date.
AgeAt Returns: Integer Category: Date Functions Parameters:
o dateField DateTime The date field to use in the calculation.
o dateFieldOrDate DateTime The date field or value to use as the point in time.
Returns the age in years from the value supplied in the first argument to the value supplied in the second argument.
Anniversary_Date Returns: DateTime Category: Date Functions Parameters:
o dateFieldOrDate DateTime The date value or date field to base the anniversary calculation on
o number Optional Integer The number of the anniversary (i.e. 2 for the second anniversary)
Returns the date of an anniversary
Anniversary_DaysTo Returns: Integer Category: Date Functions Parameters:
o dateFieldOrDate DateTime The date value or date field to base the anniversary calculation on

89
o number Optional Integer The number of the anniversary (i.e. 2 for the second anniversary)
Returns the number of days to an anniversary
AreaLabel Returns: Geographic Category: Geographic Functions Parameters:
o fieldNameOrPostalCode Geographic The geographic field to extract the area section from.
This function will extract the area label from a postcode in standard UK format.
Average Returns: Decimal Category: Parameters:
o fieldName Text The numeric field for which to calculate of the average.
o filterQuery Optional Text A query string defining the records to include in the calculation.
Takes all the child records that match the optional filter query and sums the values for each parent record. Then divides the sum by the number of child records for the parent that match the criteria.
AverageByIndex Returns: Decimal Category: Parameters:
o fieldName Text A numeric field to be used in the calculation of the average.
o index Integer The number of records to use in the calculation.
o orderByFieldName Optional Text The field to sort each parents child records by.
o filterQuery Optional Text A query string represents the records to include in the calculation.
Takes all the child records for each parent that match the optional filter criteria and fall within the specified index and returns the average for each parent record.
AvgDiff Returns: Decimal Category: Parameters:
o fieldName Decimal Returns a number that represents the average difference between each of a child record of the parent.

90
o fieldOrder Optional Text The field to use for the sorting the child records.
o filterQuery Optional Text A query string representing the domain of records to include.
Returns a number that represents the average difference between each of a child records of the parent.
BandIndex Returns: Integer Category: Objects Parameters:
o bandingName Text The name of the banding to use.
This function will return a number that indicates which element of a band each record falls into.
Before Returns: Boolean Category: Parameters:
o fieldName Text The field by which to sort the records.
o sourceQuery Text A query string that represents the set of records to check.
o targetQuery Text A query string that represents the set of records to check.
o filterQuery Optional Text A query string to restrict the records being checked.
Takes the child records for each parent and sorts them by the field specified in the fieldName parameter.
CampaignSelection Returns: Unknown Category: Campaign Functions Parameters:
o expression Text CampaignSelection Expression
Specialised function to allow querying on standard campaign history and response tables.
Categorise Returns: Text Category: Text Functions Parameters:
o fieldNameOrExpression Text The field or expression to be categorised.
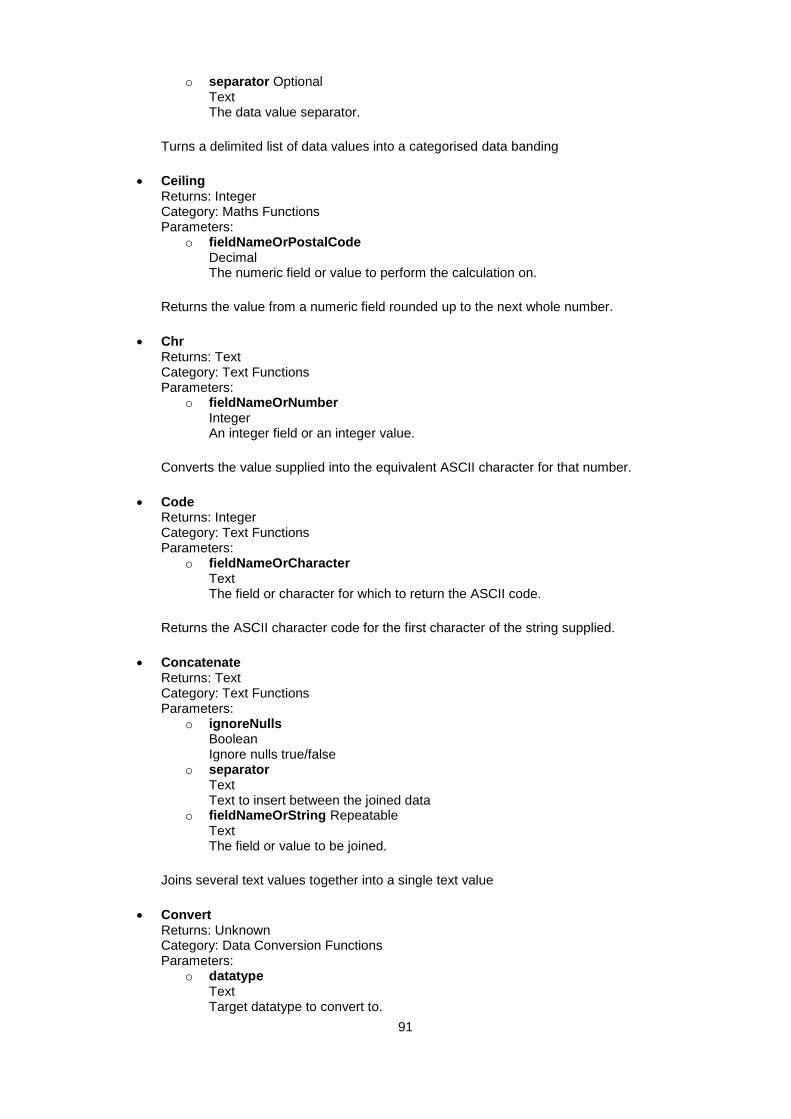
91
o separator Optional Text The data value separator.
Turns a delimited list of data values into a categorised data banding
Ceiling Returns: Integer Category: Maths Functions Parameters:
o fieldNameOrPostalCode Decimal The numeric field or value to perform the calculation on.
Returns the value from a numeric field rounded up to the next whole number.
Chr Returns: Text Category: Text Functions Parameters:
o fieldNameOrNumber Integer An integer field or an integer value.
Converts the value supplied into the equivalent ASCII character for that number.
Code Returns: Integer Category: Text Functions Parameters:
o fieldNameOrCharacter Text The field or character for which to return the ASCII code.
Returns the ASCII character code for the first character of the string supplied.
Concatenate Returns: Text Category: Text Functions Parameters:
o ignoreNulls Boolean Ignore nulls true/false
o separator Text Text to insert between the joined data
o fieldNameOrString Repeatable Text The field or value to be joined.
Joins several text values together into a single text value
Convert Returns: Unknown Category: Data Conversion Functions Parameters:
o datatype Text Target datatype to convert to.
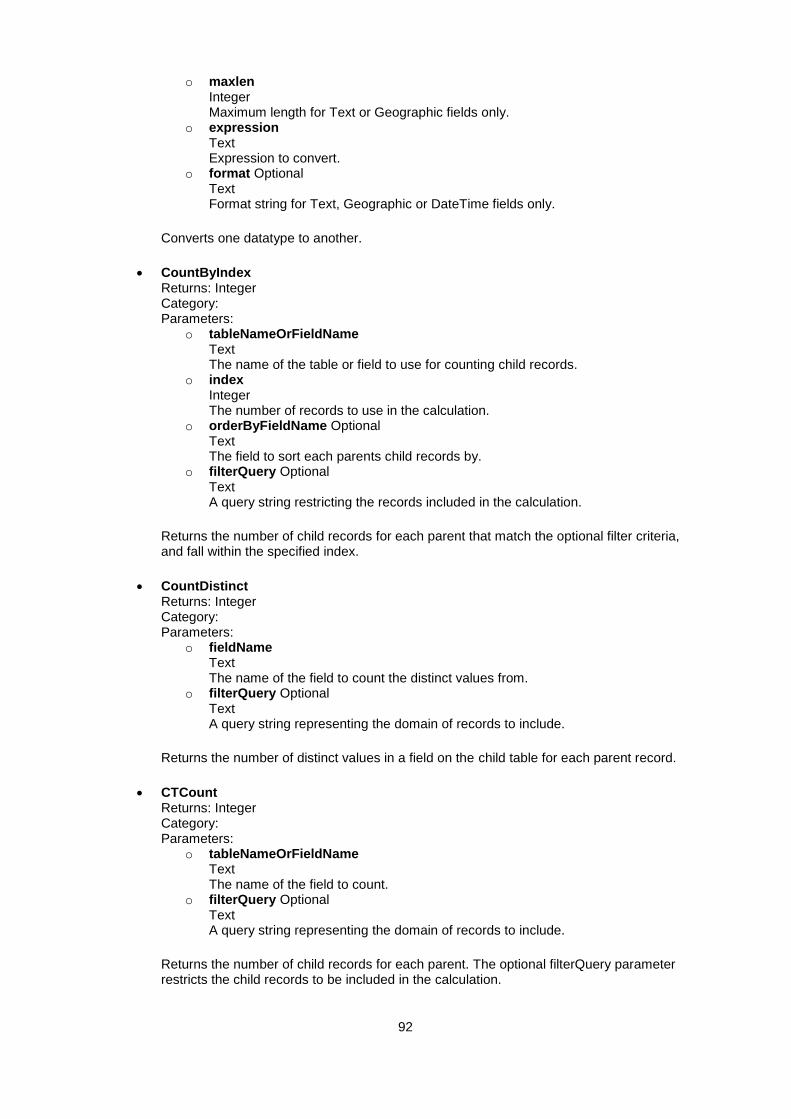
92
o maxlen Integer Maximum length for Text or Geographic fields only.
o expression Text Expression to convert.
o format Optional Text Format string for Text, Geographic or DateTime fields only.
Converts one datatype to another.
CountByIndex Returns: Integer Category: Parameters:
o tableNameOrFieldName Text The name of the table or field to use for counting child records.
o index Integer The number of records to use in the calculation.
o orderByFieldName Optional Text The field to sort each parents child records by.
o filterQuery Optional Text A query string restricting the records included in the calculation.
Returns the number of child records for each parent that match the optional filter criteria, and fall within the specified index.
CountDistinct Returns: Integer Category: Parameters:
o fieldName Text The name of the field to count the distinct values from.
o filterQuery Optional Text A query string representing the domain of records to include.
Returns the number of distinct values in a field on the child table for each parent record.
CTCount Returns: Integer Category: Parameters:
o tableNameOrFieldName Text The name of the field to count.
o filterQuery Optional Text A query string representing the domain of records to include.
Returns the number of child records for each parent. The optional filterQuery parameter restricts the child records to be included in the calculation.

93
CTSum Returns: Integer Category: Parameters:
o fieldName Text The name of the field used to calculate the sum.
o filterQuery Optional Text A query string representing the domain of records to include.
Returns a number that represents the sum of a parents child records.
DateAdd Returns: DateTime Category: Date Functions Parameters:
o dateFieldOrDate Text A date field or value be used in the calculation.
o numericValue Integer The number of intervals to add to the date supplied.
o tstringInterval Text The size of the interval to add.
Adds a time interval to the input date.
DatePart Returns: DateTime Category: Date Functions Parameters:
o dateFieldOrDate DateTime The date field to use in the calculation.
Returns just the date part from a value that includes the date and time.
Day Returns: Integer Category: Date Functions Parameters:
o dateFieldOrDate DateTime The date to use in the calculation.
Returns the day component of the date supplied. Any leading zeros are removed.
DayOfMonth Returns: Integer Category: Date Functions Parameters:
o dateFieldOrDate DateTime The date to use in the calculation
Returns the day in a month for the date supplied, from 1 to 31.

94
DayOfWeek Returns: Integer Category: Date Functions Parameters:
o dateFieldOrDate DateTime The date to use in the calculation.
Returns the day of week component of the date supplied. Any leading zeros are removed.
DayOfYear Returns: Integer Category: Date Functions Parameters:
o dateFieldOrDate DateTime The date to use in the calculation.
Returns the day of the year for the date supplied. Any leading zeros are removed.
DaysTo Returns: Integer Category: Date Functions Parameters:
o dateField DateTime The first date field to use in the calculation.
o dateFieldOrDate DateTime A second date to use in the calculation.
Returns the number of whole days between two given dates.
Decode Returns: Unknown Category: Conditions Parameters:
o fieldName Text The source field to use.
o val Repeatable Unknown The source value to be decoded.
o result Optional Repeatable Unknown The target value to substitute.
Decodes values within a discrete field to an alternative set of values.
Distance Returns: Integer Category: Geographic Functions Parameters:
o fieldName1OrPostalCode1 Geographic Geographic value for the start point.
o fieldName2OrPostalCode2 Geographic Geographic value for the end point.
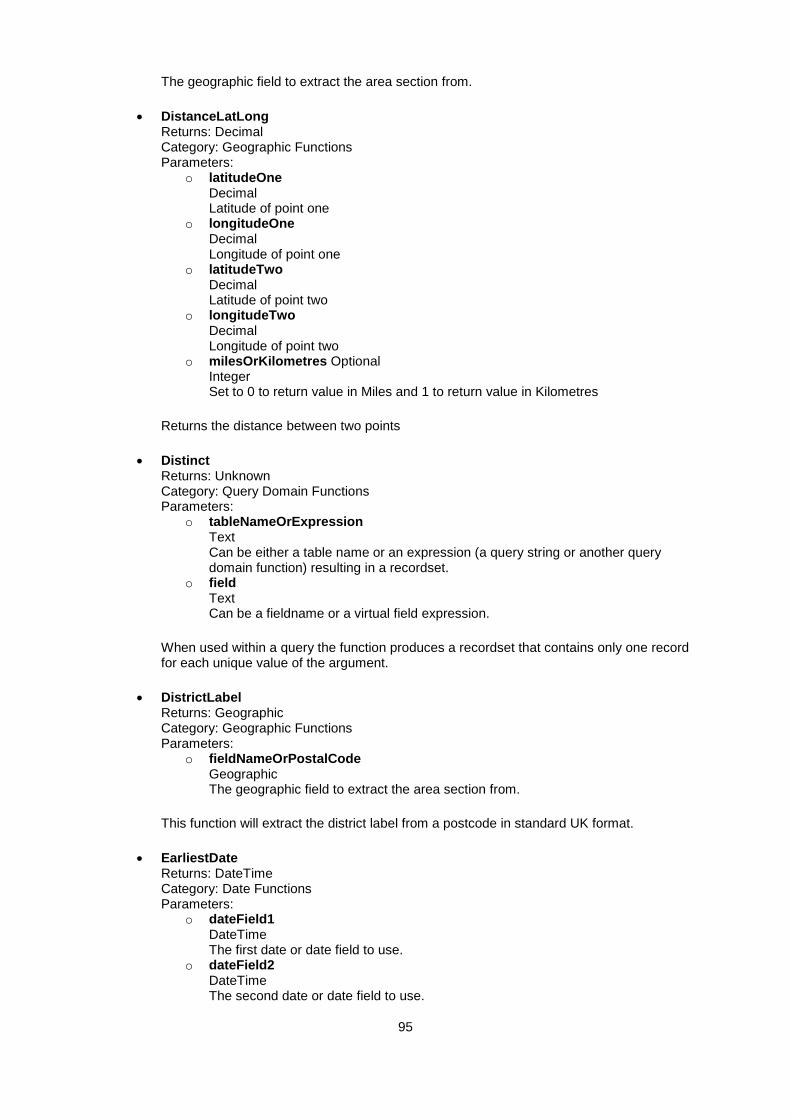
95
The geographic field to extract the area section from.
DistanceLatLong Returns: Decimal Category: Geographic Functions Parameters:
o latitudeOne Decimal Latitude of point one
o longitudeOne Decimal Longitude of point one
o latitudeTwo Decimal Latitude of point two
o longitudeTwo Decimal Longitude of point two
o milesOrKilometres Optional Integer Set to 0 to return value in Miles and 1 to return value in Kilometres
Returns the distance between two points
Distinct Returns: Unknown Category: Query Domain Functions Parameters:
o tableNameOrExpression Text Can be either a table name or an expression (a query string or another query domain function) resulting in a recordset.
o field Text Can be a fieldname or a virtual field expression.
When used within a query the function produces a recordset that contains only one record for each unique value of the argument.
DistrictLabel Returns: Geographic Category: Geographic Functions Parameters:
o fieldNameOrPostalCode Geographic The geographic field to extract the area section from.
This function will extract the district label from a postcode in standard UK format.
EarliestDate Returns: DateTime Category: Date Functions Parameters:
o dateField1 DateTime The first date or date field to use.
o dateField2 DateTime The second date or date field to use.

96
o dateFieldN Optional Repeatable DateTime The Nth date or date field to use.
Given a number of date fields or dates this function will return the earliest date from those supplied.
Exp Returns: Decimal Category: Maths Functions Parameters:
o fieldNameOrValue Decimal The numeric field or value to perform the calculation on.
Returns e raised to the power of the value in a numeric field.
First Returns: Unknown Category: Parameters:
o fieldName Text The name of a field to return the value from.
o index Optional Integer The index of the record to return
o filterQuery Optional Text A query string representing the domain of records to include.
For each parent record, returns the value from the first child record. The child records are looked at in natural unsorted order.
Flag Returns: Unknown Category: Parameters:
o fieldName Text The field to use at the many end.
o linkTable Unknown The name of the table at the one end of the link.
o filterQuery Optional Text A query string representing the domain of records to include.
Flags the first occurrence of a record that meets the criteria supplied in the filterQuery argument.
Floor Returns: Integer Category: Maths Functions Parameters:
o fieldNameOrValue Decimal The numeric field or value to perform the calculation on.
97
Returns the value from a numeric field rounded down to the next whole number.
Format Returns: Geographic Category: Geographic Functions Parameters:
o fieldNameOrPostalCode Geographic The geographic field to extract the area section from.
o format Integer A number that indicates the formatting that should be applied.
The format function allows the output format of a Geographic field to be changed into a number of different formats.
GeoSelection Returns: Unknown Category: Geographic Functions Parameters:
o latitude Decimal The latitude value of the central point
o longitude Decimal The longitude value of the central point
o radius Integer The radius to select from the central point in metres
A specialised function that selects all the leads within a radius specified in metres of a central geographic point.
GetArea Returns: Geographic Category: Geographic Functions Parameters:
o fieldNameOrPostalCode Geographic The geographic field to extract the area section number from.
This function returns the internal area number of standard UK postcode.
GetDistrict Returns: Integer Category: Geographic Functions Parameters:
o fieldNameOrPostalCode Geographic The geographic field to extract the district section number from.
This function returns the internal area number of a standard UK postcode.
GetEasting Returns: Integer Category: Geographic Functions Parameters:

98
o fieldNameOrPostalCode Geographic The geographic field to extract the easting from.
Returns the distance, in metres from the OSGB reference point, near the Scilly Isles, due east to a specified postcode.
GetIsba Returns: Integer Category: Geographic Functions Parameters:
o fieldNameOrPostalCode Geographic The geographic field to extract the ISBA region from.
Returns the ISBA TV region as derived from the postcode.
GetNorthing Returns: Integer Category: Geographic Functions Parameters:
o fieldNameOrPostalCode Geographic The geographic field to extract the northing from.
Returns the distance, in metres from the OSGB reference point, near the Scilly Isles, due north to a specified postcode.
GetSector Returns: Integer Category: Geographic Functions Parameters:
o fieldNameOrPostalCode Geographic The geographic field to extract the district sector number from.
This function returns the internal sector number of a standard UK postcode.
Hour Returns: Unknown Category: Date Functions Parameters:
o dateFieldOrDate Unknown A date field or value.
This function returns just the hour from a date time field.
If Returns: Unknown Category: Conditions Parameters:
o condition Text The condition to be evaluated.
o TRUE Unknown The value to return if the condition is true.

99
o FALSE Unknown The value to return if the condition is false.
Checks whether the condition is true or false and returns the value specified in the true argument if the condition is met or in the false argument if it is not.
Index Returns: Integer Category: Parameters:
o tableNameOrFieldName Text The name of the table at the many end of the link, or a field on this table.
o linkTable Text The name of the parent table.
o filterQuery Optional Text A query string representing the domain of records to include.
Returns a number for each child record that indicates its index.
IndexOf Returns: Integer Category: Text Functions Parameters:
o fieldNameOrString Text The field or string to be searched.
o fieldNameOrString Text The substring to find.
o start Optional Integer The character position to begin the search.
Returns the position of the first character that matches the specified string.
IsNull Returns: Unknown Category: Conditions Parameters:
o fieldName Text The field to check the value of.
o fieldNameOrConstantValue Unknown The value to replace null with.
The function will check the value for a specified field and if the value is NULL it will replace the NULL value with the value supplied in the field name or constant value argument.
KeyValue Returns: Unknown Category: Data Conversion Functions Parameters:

100
o filePath Text The fully qualified path to the file being imported
o encoding Text The file encoding (i.e. UNICODE, UTF8, ASCII)
o separator Text The data separator
o encloser Text The data encloser (use 'SINGLE', 'DOUBLE' or 'NONE')
o datatype Text The target type (use 'INT','DECIMAL','DATE', 'TEXT', 'BIGINT', 'BOOLEAN')
o headerRow Boolean Does the file contain a header row (true or false)
o length Optional Integer Key length
o format Optional Text Date format
Imports data from a key file
Label Returns: Text Category: Query Domain Functions Parameters:
o fieldName Text Field name to find a label for.
Returns field label if present.
Largest Returns: Unknown Category: Date Functions Parameters:
o ignoreNulls Boolean Flag value to determine whether or not to ignore null values
o fieldNameOrValue Unknown The values to compare to determine the largest value
o fieldNameOrValue Optional Repeatable Unknown The values to compare to determine the largest value
Returns the largest value from the supplied values.
Last Returns: Unknown Category: Parameters:
o fieldName Text The name of a field to return the value from.

101
o index Optional Integer The index of the record to return.
o filterQuery Optional Text A query string representing the domain of records to include.
Returns the value from the last child record for each parent record
LastDeleteDate Returns: DateTime Category: Constants Parameters:
o tableName Text The table to retrieve the last deletion time from.
Using the table name supplied the function returns a date and time that represents the last time that a delete action was carried out on the specified table.
LastPrimaryValue Returns: Unknown Category: Constants Parameters:
o tableName Text The table to retrieve the last primary value from.
Using the table name supplied the function returns the value of the primary key on the last record of the specified table.
LastUpdateDate Returns: DateTime Category: Constants Parameters:
o tableName Text The table to retrieve the last update date value from.
Using the table name supplied the function returns the last date and time that the specified table was subject to an update or append of records.
LatestDate Returns: DateTime Category: Date Functions Parameters:
o dateField1 DateTime The first date or date field to use.
o dateField2 DateTime The second date or date field to use.
o dateFieldN Optional Repeatable DateTime The Nth date or date field to use.
Given a number of date fields or dates this function will return the latest date from those supplied.

102
Left Returns: Text Category: Text Functions Parameters:
o fieldNameOrString Text The number of characters to select.
o length Integer The number of characters to select.
Returns the number of characters specified from the left-hand end of a string.
Len Returns: Integer Category: Text Functions Parameters:
o fieldNameOrString Text The field or string to obtain the length of.
Returns the number of characters in the specified string.
Ln Returns: Decimal Category: Maths Functions Parameters:
o fieldNameOrValue Decimal The numeric field or value to perform the calculation on.
Returns the Natural Logarithm (base 2.71828) for the values in a numeric field.
Lower Returns: Text Category: Text Functions Parameters:
o fieldNameOrString Text The text field or value to be lowercased.
Converts all the characters of the specified string into lower case.
LTrim Returns: Text Category: Text Functions Parameters:
o fieldNameOrString Text The field or string to be trimmed
Returns a character string after it removes leading blanks
Max Returns: Decimal Category: Maths Functions Parameters:

103
o fieldNameOrValue Decimal The first numeric field or value to perform the calculation on.
o fieldNameOrValue Decimal The second numeric field or value to perform the calculation on.
Returns the Maximum Value across two fields.
MaxByIndex Returns: Decimal Category: Parameters:
o fieldName Text A numeric field to be used in the calculation of the maximum.
o index Integer The number of records to use in the calculation.
o orderByFieldName Optional Text The field to sort each parents child records by.
o filterQuery Optional Text A query string represents the records to include in the calculation.
o Resolution Level Optional Text The table to resolve the count, only required when used in dynamic query calculations
Takes all the child records for each parent that match the optional filter criteria and fall within the specified index and returns the maximum for each parent record.
MaxDiff Returns: Integer Category: Parameters:
o fieldName Integer The numeric field to base the calculation on.
o fieldOrder Optional Text The field to use for sorting the child records.
o filterQuery Optional Text A query string representing the domain of records to include.
For each parent, returns a number that represents the maximum difference between each of the child records.
Maximum Returns: Integer Category: Parameters:
o fieldName Text The field to return the value from.
o index Optional Integer Specifies the index value to be used.

104
o filterQuery Optional Text A query string representing the domain of records to include.
Returns the maximum value of a field on the child table for each parent record.
Min Returns: Decimal Category: Maths Functions Parameters:
o fieldNameOrValue Decimal The first numeric field or value to perform the calculation on.
o fieldNameOrValue Decimal The second numeric field or value to perform the calculation on.
Returns the Minimum Value across two fields.
MinByIndex Returns: Decimal Category: Parameters:
o fieldName Text A numeric field to be used in the calculation of the minimum.
o index Integer The number of records to use in the calculation.
o orderByFieldName Optional Text The field to sort each parents child records by.
o filterQuery Optional Text A query string represents the records to include in the calculation.
o Resolution Level Optional Text The table to resolve the count, only required when used in dynamic query calculations
Takes all the child records for each parent that match the optional filter criteria and fall within the specified index and returns the minimum for each parent record.
MinDiff Returns: Integer Category: Parameters:
o fieldName Text The numeric field to base the calculation on.
o fieldOrder Optional Text The field to use for sorting the child records.
o filterQuery Optional Text A query string representing the domain of records to include.
For each parent, returns a number that represents the minimum difference between each of the child records.

105
Minimum Returns: Integer Category: Parameters:
o fieldName Text The field to return the value from.
o index Optional Integer Specifies the index value to be used.
o filterQuery Optional Text A query string representing the domain of records to include.
Returns the minimum value of the field on the child table for each parent record.
Minute Returns: Unknown Category: Date Functions Parameters:
o dateFieldOrDate Optional DateTime A date field or value.
This function returns just the minute from a date time field.
Mode Returns: Unknown Category: Parameters:
o fieldName Text The field to return the value from.
o index Optional Integer 0 or 1 being the most popular, 2 being the second most popular. -1 being the least popular,-2 being the second least popular etc.
o filterQuery Optional Text Allows the records included in the calculation to be filtered.
o tieValue Optional Text It is possible that two or more field values may have the same frequency. A user specified value can be returned in such cases.
Return the most frequent value of a field.
ModelSelection Returns: Unknown Category: Model Functions Parameters:
o nameOrId Unknown The name or id of the model
o takeType Text The take type, i.e. TakeEqual, TakeOver, TakeUnder, TakeBetween, etc.
o takeValue Integer The take value

106
o takeValue Optional Integer The second take value used for TakeBetween
A specialised function that selects leads from a model.
Month Returns: Unknown Category: Date Functions Parameters:
o dateFieldOrDate Unknown The date to use in the calculation.
Returns just the month element of the date supplied.
MonthsTo Returns: Unknown Category: Date Functions Parameters:
o dateField DateTime The first date field to use in the calculation.
o dateFieldOrDate DateTime A second date to use in the calculation.
Returns the number of whole months between two given dates.
NetWorkDays Returns: Integer Category: Date Functions Parameters:
o dateFieldOrDate DateTime The first date field or value (usually the earlier date)
o dateFieldOrDate DateTime The second date field or value
Returns the number of working days between two dates
Not Returns: Unknown Category: Query Domain Functions Parameters:
o expression Text A query string that defines a recordset.
This function inverts the recordset that is created by the expression argument.
NPerTable Returns: Unknown Category: Parameters:
o tableNameOrExpression Text
107
Can be either a table name, or an expression (a query string or another query domain function) resulting in a recordset
o tableName Text The name of the table at the one end of the one-to-many relationship
o N Integer The number N of records to be selected
o orderByFieldName Optional Text Records will be sorted based on the field specified in this parameter
o ReverseSort Optional Boolean This parameter indicates whether records should be sorted in reverse order. Records are sorted in ascending order by default. 0 - Ascending, 1 - Reverse/Descending
Allows N records to be selected from a table across a 1 to many join based on the value of a field at the many end
NthAfter Returns: Unknown Category: Parameters:
o sourceQuery Text A query string that represents the set of records to check.
o linkTable Text The name of the many-to-one linked table.
o N Integer The index value to be used.
o All Optional Integer 1: Flag all records up to and including the Nth record. 0 just flag Nth record. 0 is the default.
o filterQuery Optional Text A query string representing the domain of records to include.
Flags child records that are after records that meet the criteria given in the source query.
NthBefore Returns: Unknown Category: Parameters:
o sourceQuery Text A query string that represents the set of records to check.
o linkTable Unknown The name of the table at the one end.
o N Integer The index value to be used.
o All Integer 1: Flag all records up to and including the Nth record. 0 just flag Nth record. 0 is the default.

108
o filterQuery Optional Text A query string representing the domain of records to include.
Flags child records that are before records that meet the criteria given in the source query.
Object Returns: Integer Category: Objects Parameters:
o objectName Text The name object to use.
This function returns a 1 or a 0 for each record to indicate if it falls within the domain of an object.
OneInN Returns: Unknown Category: Query Domain Functions Parameters:
o tableNameOrExpression Text Can be either a table name, or an expression (a query string or another query domain function) resulting in a recordset.
o nValue Integer A number representing the systematic frequency at which to sample records.
o offset Integer A number representing the record at which to start sampling, as read from the first record in the table.
When used within a query the function produces a recordset that contains a sample of records.
OnePerTable Returns: Unknown Category: Query Domain Functions Parameters:
o tableNameOrExpression Text Can be either a table name or an expression (a query string or another query domain function) resulting in a recordset.
o tableName Text The name of the table at the one end of the one-to-many relationship.
When used within a query the function produces a recordset that contains one record for each parent record defined by the relationship between the tables.
PenultimateDeleteDate Returns: DateTime Category: Constants Parameters:
o tableName Text The table to retrieve the last deletion time from.
109
Using the table name supplied the function returns a date and time that represents the penultimate time that a delete action was carried out on the specified table.
PenultimatePrimaryValue Returns: Unknown Category: Constants Parameters:
o tableName Text The table to retrieve the penultimate primary key value from.
Using the table name supplied the function returns the value of the primary key on the last record of the specified table at the time of the penultimate update.
PenultimateUpdateDate Returns: DateTime Category: Constants Parameters:
o tableName Text The table to retrieve the penultimate update date value from.
Using the table name supplied the function returns the penultimate date and time that the specified table was subject to an update or append of records.
Power Returns: Decimal Category: Maths Functions Parameters:
o fieldNameOrValue Decimal The numeric field or value to perform the calculation on.
o fieldNameOrValue Integer The power to raise the number by.
Raises the value in a numeric field to a specified power.
Proper Returns: Text Category: Text Functions Parameters:
o fieldNameOrString Text Field or string to use.
Uppercases the first letter of each separate word in the specified string.
Query Returns: Unknown Category: Parameters:
o testQuery Text A query string that represents the set of records to check.
o filterQuery Optional Text Query string that represents the set of records to check.
110
Creates a query on the appropriate table to the test query and filter query combined.
Rand Returns: Decimal Category: Maths Functions Parameters:
o fieldNameOrValue Decimal The number to use as the seed for random number generation.
Returns a random number between 1 and the value specified.
RandomSample Returns: Integer Category: Objects Parameters:
o percent Integer A number representing the percent of records to return at random from the recordset.
o tableNameOrFieldName Optional Text Table name of field name to take sample from.
o filterQuery Optional Text Query string to filter recordset.
This function will return a 1 or 0 to indicate if each record falls within the specified sample. The sampleP function should be used instead.
Recency Returns: Unknown Category: Parameters:
o tableNameOrFieldName Text The name of the table at the many end of the link, or a field on this table.
o linkTable Text The name of the parent table.
o filterQuery Optional Text A query string representing the domain of records to include.
Returns a number for each child record that indicates its recency.
RFVSelection Returns: Unknown Category: RFV Functions Parameters:
o segment Integer The RFV segment to select
o interval Optional Integer The optional RFV interval number
A specialised function that selects leads based on recency, frequency and value.

111
Right Returns: Text Category: Text Functions Parameters:
o fieldNameOrString Text The field or string value to use.
o length Integer The number of characters to select.
Returns the number of characters specified from the right hand end of a string.
Round Returns: Integer Category: Maths Functions Parameters:
o fieldNameOrValue Decimal The numeric field or value to perform the calculation on.
o precisionValue Integer Precision value to return. The default is 0.
Rounds the values in a numeric field.
RTrim Returns: Text Category: Text Functions Parameters:
o fieldNameOrString Text The field or string to be trimmed
Returns a character string after truncating all trailing blanks
SampleN Returns: Unknown Category: Query Domain Functions Parameters:
o tableNameOrExpression Text Can be either a table name, or an expression (a query string or another query domain function) resulting in a recordset.
o number Integer A number representing the number of records to return at random from the recordset defined by the expression argument.
When used within a query the function produces a recordset of only a number of the records from the input recordset.
SampleP Returns: Unknown Category: Query Domain Functions Parameters:
o tableNameOrExpression Text

112
Can be either a table name, or an expression (a query string or another query domain function) resulting in a recordset.
o percent Integer A number representing the percent of records to return at random from the recordset defined by the expression argument.
When used within a query the function produces a recordset of only a percentage of the records from the input recordset.
Sdev Returns: Integer Category: Parameters:
o fieldName Text The name of the field to use in the calculation.
o filterQuery Optional Text A query string representing the domain of records to include.
Returns a number that represents the standard deviation of a parents child records.
SdevByIndex Returns: Integer Category: Parameters:
o orderByFieldName Optional Text The field on which to sort child records.
o index Integer The number of records to include in the calculation.
o orderByFieldName Optional Text The field on which to sort child records.
o filterQuery Optional Text A query string representing the domain of records to include.
Returns a number that represents the standard deviation of a parents child records. However, only the number of records specified by the index parameter will be used.
Second Returns: Unknown Category: Date Functions Parameters:
o dateFieldOrDate DateTime A date field or value.
This function returns just the second from a date time field.
SectorLabel Returns: Text Category: Geographic Functions Parameters:

113
o fieldNameOrPostalCode Geographic The geographic field to extract the sector section from.
This function will extract the sector label from a postcode in standard UK format.
Sign Returns: Integer Category: Maths Functions Parameters:
o fieldNameOrValue Decimal The numeric field or value to perform the calculation on.
Returns -1 for negative values in a field, 0 for zero values and 1 for positive values.
SizeSelection Returns: Unknown Category: Query Domain Functions Parameters:
o tableNameOrExpression Text Can be either a table name, or an expression (a query string or another query domain function) resulting in a recordset.
o size Integer The number of records to return.
o offset Integer A number representing the record at which to start sampling, as read from the first record in the table.
When used within a query the function produces a recordset of the specified number of records.
Soundex Returns: Unknown Category: Text Functions Parameters:
o fieldNameOrString Text The field name or string value to which Soundex should be applied.
o language Optional Integer Optional parameter. 0 Indicates UK Soundex, 1 Indicates French Soundex. If left blank then UK is used.
o length Optional Integer Integer value between 4 and 15. If left blank the default is 4.
A detailed description of the soundex function can be found at the following web address: http://en.wikipedia.org/wiki/Soundex .
Sqrt Returns: Decimal Category: Maths Functions Parameters:

114
o fieldNameOrValue Decimal The numeric field or value to perform the calculation on.
Returns the square root of a value in a numeric field.
Square Returns: Decimal Category: Maths Functions Parameters:
o fieldNameOrValue Decimal The numeric field or value to perform the calculation on.
Returns the square of a value in a numeric field.
Stat5thPercentile Returns: Unknown Category: Field Statistics Functions Parameters:
o fieldName Text The name of the field to calculate the statistic on.
o fromValue Optional Integer The lowest value for the field to include in the calculation of the statistic.
o toValue Optional Integer The highest value for the field to include in the calculation of the statistic.
o sampleSize Optional Integer A number representing the number of records to include.
o filterQuery Optional Text A query string representing the domain of records to calculate the statistic for.
This function returns the 5th percentile value for every record in a table.
Stat95thPercentile Returns: Unknown Category: Field Statistics Functions Parameters:
o fieldName Text The name of the field to calculate the statistic on.
o fromValue Optional Integer The lowest value for the field to include in the calculation of the statistic.
o toValue Optional Integer The highest value for the field to include in the calculation of the statistic.
o sampleSize Optional Integer A number representing the number of records to include.
o filterQuery Optional Text A query string representing the domain of records to calculate the statistic for.
This function returns the 95th percentile value for every record in a table.

115
StatMaximum Returns: Unknown Category: Field Statistics Functions Parameters:
o fieldName Text The name of the field to calculate the statistic on.
o fromValue Optional Integer The lowest value for the field to include in the calculation of the statistic.
o toValue Optional Integer The highest value for the field to include in the calculation of the statistic.
o sampleSize Optional Integer A number representing the number of records to include.
o filterQuery Optional Text A query string representing the domain of records to calculate the statistic for.
This function returns the maximum value for every record in a table.
StatMean Returns: Unknown Category: Field Statistics Functions Parameters:
o fieldName Text The name of the field to calculate the statistic on.
o fromValue Optional Integer The lowest value for the field to include in the calculation of the statistic.
o toValue Optional Integer The highest value for the field to include in the calculation of the statistic.
o sampleSize Optional Integer A number representing the number of records to include.
o filterQuery Optional Text A query string representing the domain of records to calculate the statistic for.
This function returns the mean value for every record in a table.
StatMedian Returns: Unknown Category: Field Statistics Functions Parameters:
o fieldName Text The name of the field to calculate the statistic on.
o fromValue Optional Integer The lowest value for the field to include in the calculation of the statistic.
o toValue Optional Integer The highest value for the field to include in the calculation of the statistic.
o sampleSize Optional Integer A number representing the number of records to include.

116
o filterQuery Optional Text A query string representing the domain of records to calculate the statistic for.
This function returns the median value for every record in a table.
StatMinimum Returns: Unknown Category: Field Statistics Functions Parameters:
o fieldName Text The name of the field to calculate the statistic on.
o fromValue Optional Integer The lowest value for the field to include in the calculation of the statistic.
o toValue Optional Integer The highest value for the field to include in the calculation of the statistic.
o sampleSize Optional Integer A number representing the number of records to include.
o filterQuery Optional Text A query string representing the domain of records to calculate the statistic for.
This function returns the minimum value for every record in a table.
StatMode Returns: Unknown Category: Field Statistics Functions Parameters:
o fieldName Text The name of the field to calculate the statistic on.
o fromValue Optional Integer The lowest value for the field to include in the calculation of the statistic.
o toValue Optional Integer The highest value for the field to include in the calculation of the statistic.
o sampleSize Optional Integer A number representing the number of records to include.
o filterQuery Optional Text A query string representing the domain of records to calculate the statistic for.
This function returns the mode value for every record in a table.
StatRecordCount Returns: Unknown Category: Field Statistics Functions Parameters:
o fieldName Text Field or table name to calculate the statistic on.
o fromValue Optional Integer The lowest value for the field to include in the calculation of the statistic.

117
o toValue Optional Integer The highest value for the field to include in the calculation of the statistic.
o sampleSize Optional Integer A number representing the number of records to include.
o filterQuery Optional Text A query string representing the domain of records to calculate the statistic for.
This function returns the record count value for every record in a table.
StatSdev Returns: Unknown Category: Field Statistics Functions Parameters:
o fieldName Text The name of the field to calculate the statistic on.
o fromValue Optional Integer The lowest value for the field to include in the calculation of the statistic.
o toValue Optional Integer The highest value for the field to include in the calculation of the statistic.
o sampleSize Optional Integer A number representing the number of records to include.
o filterQuery Optional Text A query string representing the domain of records to calculate the statistic for.
This function returns the standard deviation value for every record in a table.
StatSum Returns: Unknown Category: Field Statistics Functions Parameters:
o fieldName Text The name of the field to calculate the statistic on.
o fromValue Optional Integer The lowest value for the field to include in the calculation of the statistic.
o toValue Optional Integer The highest value for the field to include in the calculation of the statistic.
o sampleSize Optional Integer A number representing the number of records to include.
o filterQuery Optional Text A query string representing the domain of records to calculate the statistic for.
This function returns the sum value for every record in a table.
Strip Returns: Text Category: Text Functions Parameters:
118
o fieldNameOrString Text The field or string to strip.
Removes all spaces from a string.
Substring Returns: Text Category: Text Functions Parameters:
o fieldNameOrString Text The field or string to obtain the substring from.
o start Integer The character position to start obtaining the substring from.
o length Integer The number of characters to obtain from the string.
Returns a number of characters from the middle of a string.
SumByIndex Returns: Integer Category: Parameters:
o fieldName Text The name of the field used to calculate the Sum.
o index Integer The number of records to include in the calculation.
o orderByField Optional Text The field to sort the by.
o fiterQuery Optional Text A query string representing the domain of records to include.
A query string representing the domain of records to include.
Table Returns: Unknown Category: Query Domain Functions Parameters:
o tableNameOrExpression Text Can be either a table name, or an expression (a query string or another query domain function) resulting in a recordset.
o tableName Text The table level at which the recordset resulting from the first argument should be represented.
The function increases the flexibility of the query language by mimicking the results of rolling a selection.
TagSelection Returns: Unknown
119
Category: Campaign Functions Parameters:
o 'Tag Name' or TagID Text The tag name or tag id to use
Function to allow querying of Tags by name or id
TagValueSelection Returns: Unknown Category: Selection Functions Parameters:
o nameOrId Unknown The name or id of the tag
o takeType Text The take type, i.e. TakeEqual, TakeOver, TakeUnder, TakeBetween, etc.
o takeValue Integer The take value
o takeValue Optional Integer The second take value used for TakeBetween
A specialised function that selects leads from tagged data.
TimePart Returns: Unknown Category: Date Functions Parameters:
o dateFieldOrDate DateTime The date field to use in the calculation.
Returns the time part from a datetime value.
TimeStampAdd Returns: DateTime Category: Constants Parameters:
o Interval Text One of the following constants SQL_TSI_FRAC_SECOND, SQL_TSI_SECOND, SQL_TSI_MINUTE, SQL_TSI_HOUR, SQL_TSI_DAY, SQL_TSI_WEEK, SQL_TSI_MONTH, SQL_TSI_QUARTER, or SQL_TSI_YEAR.
o Count Integer The count of the interval that is added
o dateFieldOrDate DateTime The date to use in the calculation.
Returns a new date value based on adding an interval to the date supplied.
TopN Returns: Unknown Category: Sampling Data Parameters:

120
o tableNameOrExpression Text Can be either a table name or an expression (a query string or another query domain function) resulting in a recordset.
o field Text The numeric field on which to order the records.
o nValue Integer The number of records to return.
o reverse Optional Boolean Boolean value to determine whether the records with the Highest values for the field are selected (False) or the Lowest values for the field are selected (True).
When used within a query the function produces a recordset that contains the top or bottom n records based on their values for a given numeric field.
TrackField Returns: Decimal Category: Objects Parameters:
o bandingName1 Text The first banding to use.
o bandingName2 Text The second banding to use.
This function is used to return the difference between the band index of the same record on different bands.
Unichr Returns: Text Category: Text Functions Parameters:
o fieldNameOrNumber Integer A field (containing a numeric value) or a numeric value.
The function returns the Unicode character for the numeric value supplied.
Unicode Returns: Integer Category: Text Functions Parameters:
o fieldNameOrCharacter Text A field containing a character value or a character value.
The function returns the Unicode character code for the character value supplied.
Upper Returns: Text Category: Text Functions Parameters:
o fieldNameOrString Text The field or string to convert to uppercase.

121
Uppercases all the characters in the string supplied.
Val Returns: Integer Category: Text Functions Parameters:
o fieldNameOrString Text The field or value to convert.
Converts a string into a numeric value. For invalid numeric values, 0 will be returned.
WeekDay Returns: Unknown Category: Date Functions Parameters:
o dateFieldOrDate DateTime The date field to use in the calculation.
o format Integer Long or short representation of the day.
Returns the day of the week for the date supplied.
WeightedMode Returns: Unknown Category: Parameters:
o fieldName Text Return the most frequent value of a field based a weight field.
o WeightField Text The name of the weight field parameter
o index Optional Integer 0 or 1 being the most popular, 2 being the second most popular. -1 being the least popular,-2 is the second least popular etc.
o filterQuery Optional Text Allows the records included in the calculation to be filtered.
o tieValue Optional Text It is possible that two or more field values may have the same frequency. A user-specified value can be returned in such cases.
For each parent record this cross-table function will return the most frequent value of a field from a child table in accordance with the weight field parameter. So, for example, you can establish the most frequently purchased or most valuable product code.
Year Returns: Unknown Category: Date Functions Parameters:
dateFieldOrDate DateTime The date field to use in the calculation. Returns the year portion of the date supplied.