
TRAFFIC PRE-FEASIBILITY STUDY FOR INDORE … REPORT FOR INDORE METRO.pdftraffic pre-feasibility...
82
TRAFFIC PRE-FEASIBILITY STUDY FOR INDORE METRO CLIENT: URBAN ADMINISTRATION AND DEVELOPMENT DEPARTMENT GOVERNMENT OF MADYAPRADESH DELHI METRO RAIL CORPORATION LTD. Metro Bhawan, Fire Brigade Lane, Barakhamba Road, New Delhi-110 001 8 TH APRIL, 2013 PREPARED BY
Transcript of TRAFFIC PRE-FEASIBILITY STUDY FOR INDORE … REPORT FOR INDORE METRO.pdftraffic pre-feasibility...
TRAFFIC PRE-FEASIBILITY STUDY
FOR
INDORE METRO
CLIENT: URBAN ADMINISTRATION AND DEVELOPMENT DEPARTMENT
GOVERNMENT OF MADYAPRADESH
DELHI METRO RAIL CORPORATION LTD.
Metro Bhawan, Fire Brigade Lane, Barakhamba Road, New Delhi-110 001
8TH APRIL, 2013
PREPARED BY
TRAFFIC PRE-FEASIBILITY STUDY
FOR
INDORE METRO
CLIENT: URBAN ADMINISTRATION AND DEVELOPMENT DEPARTMENT
GOVERNMENT OF MADYAPRADESH
PREPARED BY
DELHI METRO RAIL CORPORATION LTD. Metro Bhawan, Fire Brigade Lane, Barakhamba Road, New Delhi-110 001
8TH APRIL, 2013
2
Traffic pre feasibility study for Indore metro
Contents 1.0 INRODUCTION ....................................................................................................................... 4
Table 1: Metro Alternative Networks considered in the study .................................................. 5
Figure 1: Alternative Metro Network considered for Indore ..................................................... 6
Figure 2: Tested Metro Alignment for Indore ............................................................................ 7
2.0 INDORE CITY .......................................................................................................................... 8
Figure 3 Overview of Indore and surrounding towns ................................................................. 8
3.0 Earlier Study .......................................................................................................................... 9
Figure 4: MRTS Corridors proposed in past study .................................................................... 10
4.0 Demography of Indore ........................................................................................................ 11
5.0 Economic Base .................................................................................................................... 12
Table 2: Proposed Distribution of Workers by Occupational Structure in Horizon Year 2025 13
6.0 Traffic Surveys ..................................................................................................................... 14
Table 3: Summary of traffic volume count at 20 locations in Indore ....................................... 14
Table 4 Congestion on Roads in CBD area ................................................................................ 17
7.0 Trip Forecasting Procedure ................................................................................................. 18
TABLE 3 ADOPTED POPULATION DENSITY/HECTARE ............................................................... 20
TABLE 4 PROJECTED POPULATION ............................................................................................ 22
TABLE 5 PROJECTED TRIP PRODUCTION ................................................................................... 24
TABLE 6 PROJECTED TRIP ATTRACTION .................................................................................... 24
TABLE 7: MODE SHARE OF PASSENGERS ON ROAD (2011) ...................................................... 25
Table 8: Utility Model Inputs .................................................................................................... 27
Figure 5: Mode share among passenger vehicles without metro ............................................ 28
Figure 6: Mode share between public and private passenger vehicles with metro ................ 28
Table 9: Average mode share for without metro situation ...................................................... 29
Figure 7: Distribution of Trips according to Length (2016) ....................................................... 30
8.0 RIDERSHIP FORECAST .......................................................................................................... 33
Table 10: Summery of forecasting ............................................................................................ 33
Table 11: Daily Boarding for different horizon years ................................................................ 33
Table 12: Trip transfer at two interchanges ............................................................................. 34
3
Traffic pre feasibility study for Indore metro
Table 13: Peak Hour Peak Direction (PHPDT) Boarding and Alighting for Different Horizon Years ......................................................................................................................................... 35
Table 14: Direction wise Peak Hour Link Load for Different Horizon Years ............................. 37
Table 15: Traffic Parameters (Year 2021) ................................................................................. 39
9.0 Conclusion ........................................................................................................................... 39
9.1 Recommendation ................................................................................................................ 39
10.0 Transport Oriented Development .................................................................................... 40

4
Traffic pre feasibility study for Indore metro
1.0 INRODUCTION
Pre-feasibility traffic study was conducted to assess the requirement of MRTS in
Indore. Aim was to find out the best feasible alignment of a grade separated
mass rapid transit system (metro rail). Whether and when a metro system will be
needed for a city depends upon several factors which may include daily ridership
and traffic growth, average trip length and revenue likely to be earned on one
side and the cost of metro line construction, maintenance and operation on the
other side. Cost of construction and maintenance depends upon the length of the
line (also percent length of elevated or/and underground length) to be
constructed. Maintenance cost includes cost of power, rolling stock, signaling
and telecommunication, general and special technical and civil maintenance and
staff cost. As a matter of fact, maintenance cost and revenue generation solely
depend upon the ridership which is estimated through traffic modeling and traffic
survey. Therefore traffic study is the first and most important component of the
metro network implementation in a city. Budget funding is also another issue.
1.1 Scope and Methodology
Scope of this report was to estimate daily ridership on metro alignments which
are proposed under different options. Initial alignment proposal is made on the
basis of connectivity between location of employment centers and residential
places and passenger traffic flow.
Traditional four stage model for travel demand estimation was used and for that,
necessary input data base was prepared first, which consists of (1) Primary and
secondary travel related data collection, (2) Making them usable as input to
calibrate travel demand models, (3) Generating outputs for further analysis (4)
Recommending alignment for metro line construction. Procedural details are
given in section 2.
1.2 Preliminary alignment
Different alternative metro lines were thought by physically observing the city
from existing landuse in the city and by identifying the traffic corridors which are
connecting important landuses such as employment centers and residential
5
Traffic pre feasibility study for Indore metro
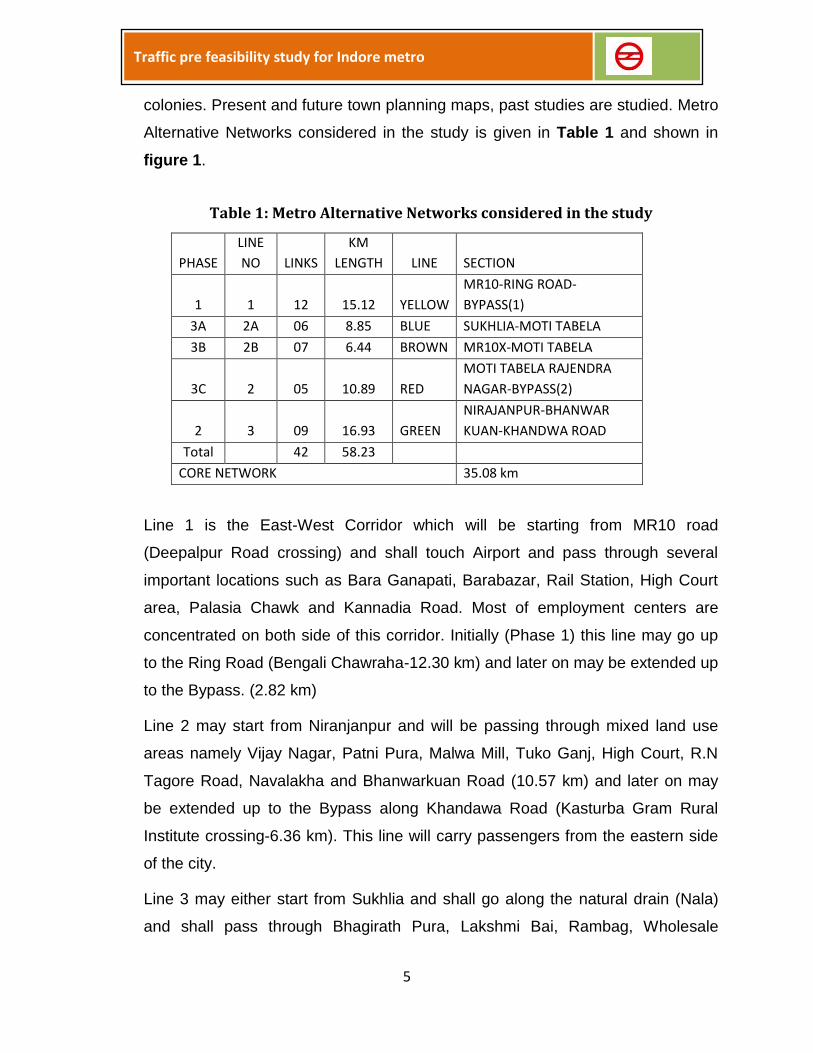
colonies. Present and future town planning maps, past studies are studied. Metro
Alternative Networks considered in the study is given in Table 1 and shown in
figure 1.
Table 1: Metro Alternative Networks considered in the study
PHASE
LINE
NO LINKS
KM
LENGTH LINE SECTION
1 1 12 15.12 YELLOW
MR10-RING ROAD-
BYPASS(1)
3A 2A 06 8.85 BLUE SUKHLIA-MOTI TABELA
3B 2B 07 6.44 BROWN MR10X-MOTI TABELA
3C 2 05 10.89 RED
MOTI TABELA RAJENDRA
NAGAR-BYPASS(2)
2 3 09 16.93 GREEN
NIRAJANPUR-BHANWAR
KUAN-KHANDWA ROAD
Total
42 58.23
CORE NETWORK 35.08 km
Line 1 is the East-West Corridor which will be starting from MR10 road
(Deepalpur Road crossing) and shall touch Airport and pass through several
important locations such as Bara Ganapati, Barabazar, Rail Station, High Court
area, Palasia Chawk and Kannadia Road. Most of employment centers are
concentrated on both side of this corridor. Initially (Phase 1) this line may go up
to the Ring Road (Bengali Chawraha-12.30 km) and later on may be extended up
to the Bypass. (2.82 km)
Line 2 may start from Niranjanpur and will be passing through mixed land use
areas namely Vijay Nagar, Patni Pura, Malwa Mill, Tuko Ganj, High Court, R.N
Tagore Road, Navalakha and Bhanwarkuan Road (10.57 km) and later on may
be extended up to the Bypass along Khandawa Road (Kasturba Gram Rural
Institute crossing-6.36 km). This line will carry passengers from the eastern side
of the city.
Line 3 may either start from Sukhlia and shall go along the natural drain (Nala)
and shall pass through Bhagirath Pura, Lakshmi Bai, Rambag, Wholesale
6
Traffic pre feasibility study for Indore metro
Markets at Rajwada, Imli Bazar and Moti Tabela (8.85 km). This line may also
start from the crossing of MR10 and Ujjain Road and pass through Kabir Kheda,
Banganga, Meri Mata Chowk and Khejuri Bazar, Rajwada (Jawahar Road) and
Motitabela (6.44 km). From Motitabela, this line shall pass through the places
such as Collectorate, Katju Colony, Usha Nagar and Sudama Nagar and reach
Rajendra Nagar (5.77 km). Later this line may further be extended up to
Bypass(2) near Rau Rail Station (5.12 km) Along both the alternatives of this line,
residential areas such as Bagirathpura, Banganga, Lakshmi Bai, Sukhlia,
Rajendra Nagar exist. Some areas such as Annapurna, Collectorate have mixed
landuse and some areas such as Krishnapura, Rajwada, Cloth Market are work
and market places. Line 3 shall be approximately parallel to line 2 in the Western
side of the city.
.
Figure 1: Alternative Metro Network considered for Indore
These three lines together shall create a public transport network which will be
able to cater to significant amount of public transport demand of the city. There
7
Traffic pre feasibility study for Indore metro
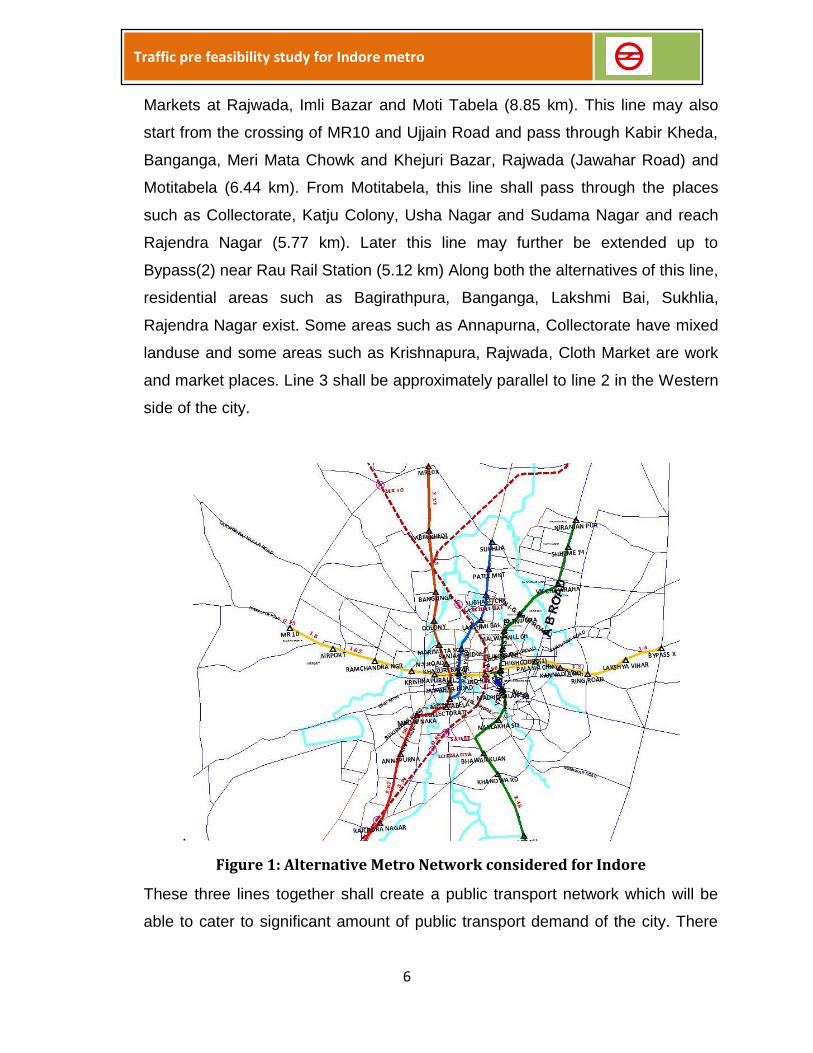
will be two interchange stations at (1) High Court and at (2) Rajwada
(Krishnapuram) which will help passengers from any area to other area along the
three corridors within 30-35 minutes.
To begin with, core network may be developed whose total length will be 35.08
km and later on may be extended as required.
Figure 2: Tested Metro Alignment for Indore
After physically observing the areas around the proposed alignments, it was
found that line 3A will be more suitable than line 3B due to its proximity to
residential areas. So alignment 3B was not tested. Alignments that are tested are
finalized after considering traffic flow on arterials, traffic generation from
important places such as rail stations, industrial and commercial zones, and
availability of road space, and finally to fulfill the objective of connecting different
parts of the city. Metro network tested is shown in figure 2.
8
Traffic pre feasibility study for Indore metro
2.0 INDORE CITY
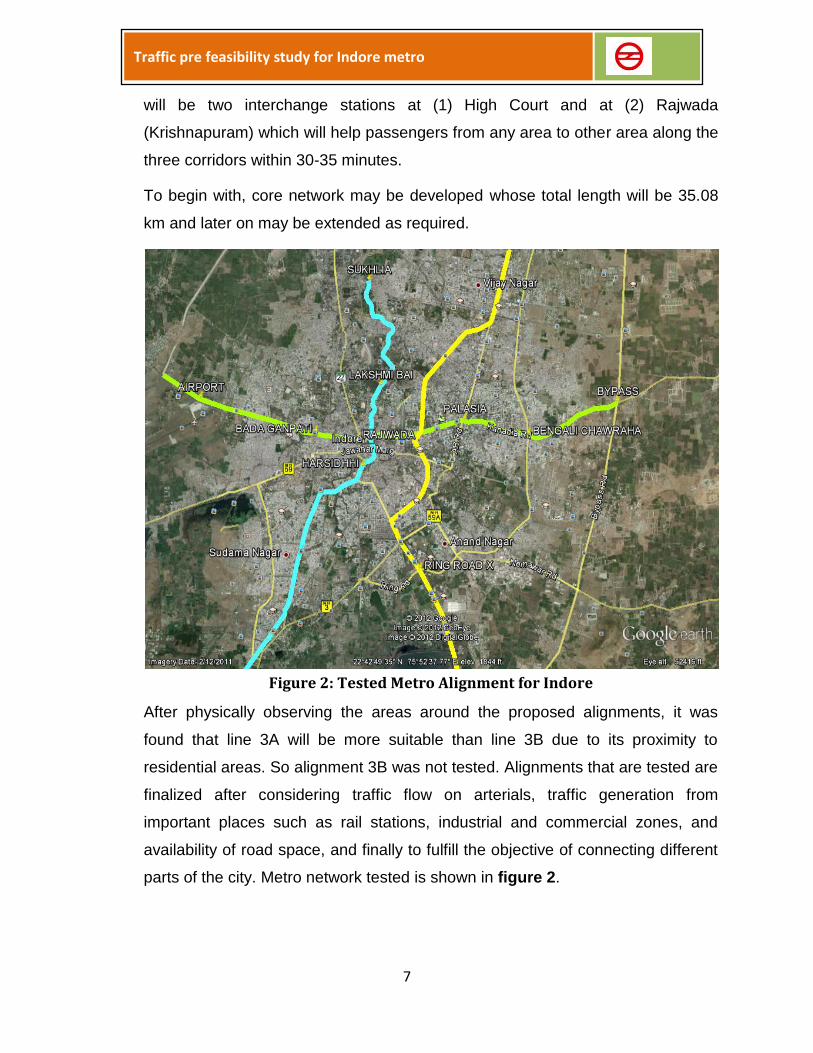
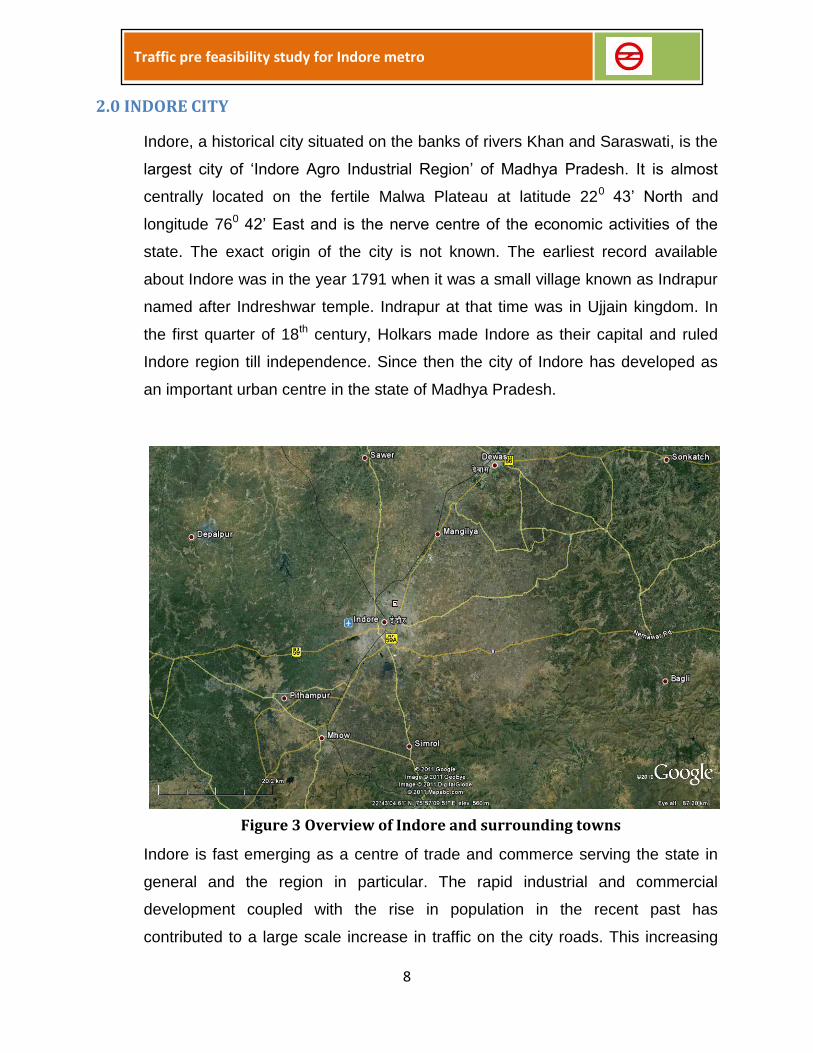
Indore, a historical city situated on the banks of rivers Khan and Saraswati, is the
largest city of ‘Indore Agro Industrial Region’ of Madhya Pradesh. It is almost
centrally located on the fertile Malwa Plateau at latitude 220 43’ North and
longitude 760 42’ East and is the nerve centre of the economic activities of the
state. The exact origin of the city is not known. The earliest record available
about Indore was in the year 1791 when it was a small village known as Indrapur
named after Indreshwar temple. Indrapur at that time was in Ujjain kingdom. In
the first quarter of 18th century, Holkars made Indore as their capital and ruled
Indore region till independence. Since then the city of Indore has developed as
an important urban centre in the state of Madhya Pradesh.
Figure 3 Overview of Indore and surrounding towns
Indore is fast emerging as a centre of trade and commerce serving the state in
general and the region in particular. The rapid industrial and commercial
development coupled with the rise in population in the recent past has
contributed to a large scale increase in traffic on the city roads. This increasing

9
Traffic pre feasibility study for Indore metro
intensity of traffic has resulted in the manifestation of a number of problems like
congestion, delay, accidents, pollution etc. which pose a potential threat to the
economic vitality and productive efficiency of the city.
3.0 Earlier Study
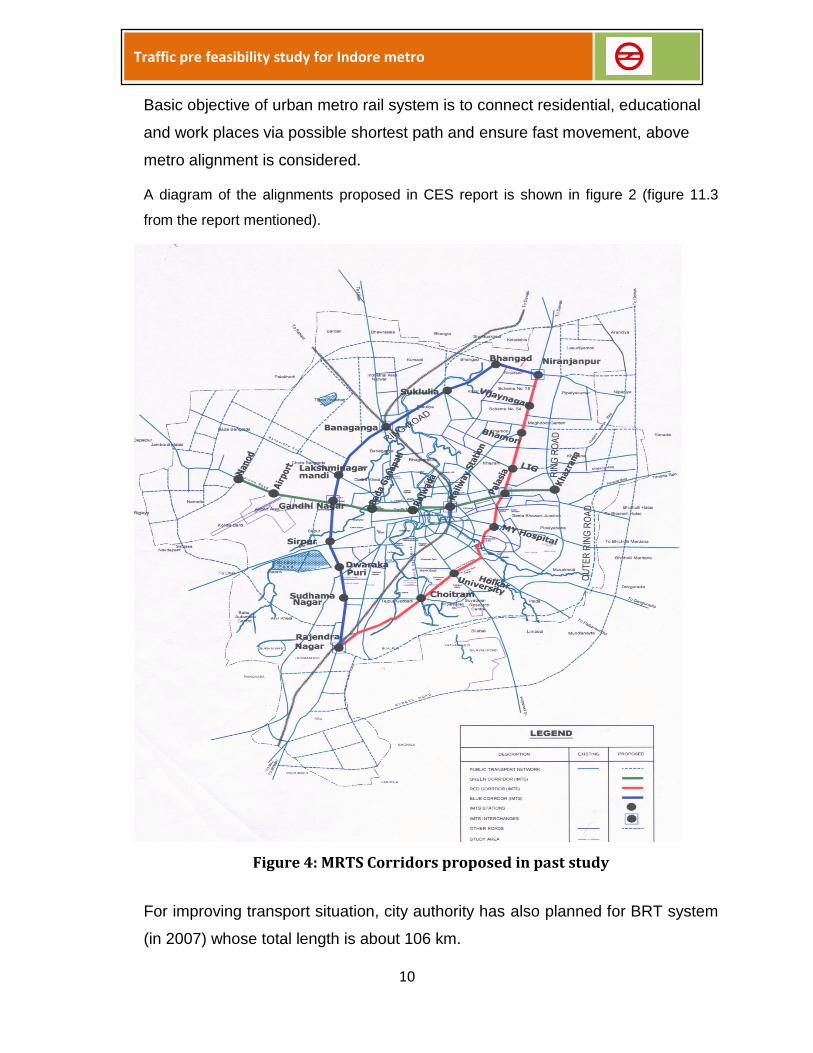
In 2003, CTTS for Indore was conducted by CES and associates in which
several proposals were made regarding construction of flyovers, ROB/RUB,
Freight Terminals, Widening of existing bridges, Pedestrian facilities and New
River bridges which may be seen in the final report of the study1 - In that report,
rail based mass transport corridors were proposed. One which is known as East-
West corridor, starts from Kharjana and ends at Nanod (length 12.30 km). Along
this line several stations were identified namely Khazrana, Palasia, Indore
Railway Station, Rajwada, Bada Ganapatii, Gandhinagar, Airport and Nanod.
Second corridor (Eastern North-South Corridor) was proposed from Niranjanpur
to Rajendra Nagar via Niranjanpur, Vijaynagar, Bhamori, LIG, Palasia, M. Y. Hospital,
Holkar University, Choitram and Rajendra Nagar (length 15.25 km).
The third corridor (Western North-South Corridor) was also from Niranjanpur and up
to Rajendra Nagar which passes through Bhangad, Sukhliya, Banaganga, Lakshminagar
Mandi, Gandhinagar, Sirpur, Dwarakapuri and Sudhama Nagar (length 17.20 km).
It is observed that the corridors (2nd and 3rd) proposed in CES report have not
ventured to enter within the core area of the city where work place locations
exist. The corridors are practically bypasses or ring type public transport
alignments and probably will not help commuters to reach their work place
destinations in the core area easily. Hence these two corridors may not serve the
purpose of connecting CBD with other parts of the city which line 2 and 3 (in this
study) will do.
11 Comprehensive Traffic & Transportation Study for Indore Urban Area, Date: January 2004, CES in association
with ICF Kaiser and Anil Varma Associates, Final Report
10
Traffic pre feasibility study for Indore metro
Basic objective of urban metro rail system is to connect residential, educational
and work places via possible shortest path and ensure fast movement, above
metro alignment is considered.
A diagram of the alignments proposed in CES report is shown in figure 2 (figure 11.3
from the report mentioned).
Figure 4: MRTS Corridors proposed in past study
For improving transport situation, city authority has also planned for BRT system
(in 2007) whose total length is about 106 km.
11
Traffic pre feasibility study for Indore metro
Corridor 1: AB. Road [23.8 km]
Corridor 2: Eastern Ring Road [23.65 km]
Corridor 3: M.R. 10 Corridor [8.71 km]
Corridor 4: River Side Road Corridor [14.5 km]
Corridor 5: Western Ring Road [15.9 km]
Corridor 6: Badaganpti — Airport [5.3 km]
Corridor 7: RW2 Ujjain Road — Airport [9.5 km]
Other Corridors: M.G Road, RNT Road and YN Road [together 19.1 km]
When the completed, BRTS will cover 106 km, connecting all major corridors in
Indore, Phase-I of the project proposes three corridors: the AB Road pilot
corridor, the Vijayanagar Chowraha-Ujjain Road junction and Ujjain Road
junction-the Airport. The current Rs. 130-crore AB Road pilot corridor runs along
11.7 km and will cater to around 70,000 passengers daily. The following corridors
were proposed to be executed under JNNURM.
In the present study, line 1 (MR10-Bypass Crossing) and East West Corridor are almost
similar, except that line 1 is a urban metro line and the latter was a rail based system,
partly elevated and partly at grade.
4.0 Demography of Indore
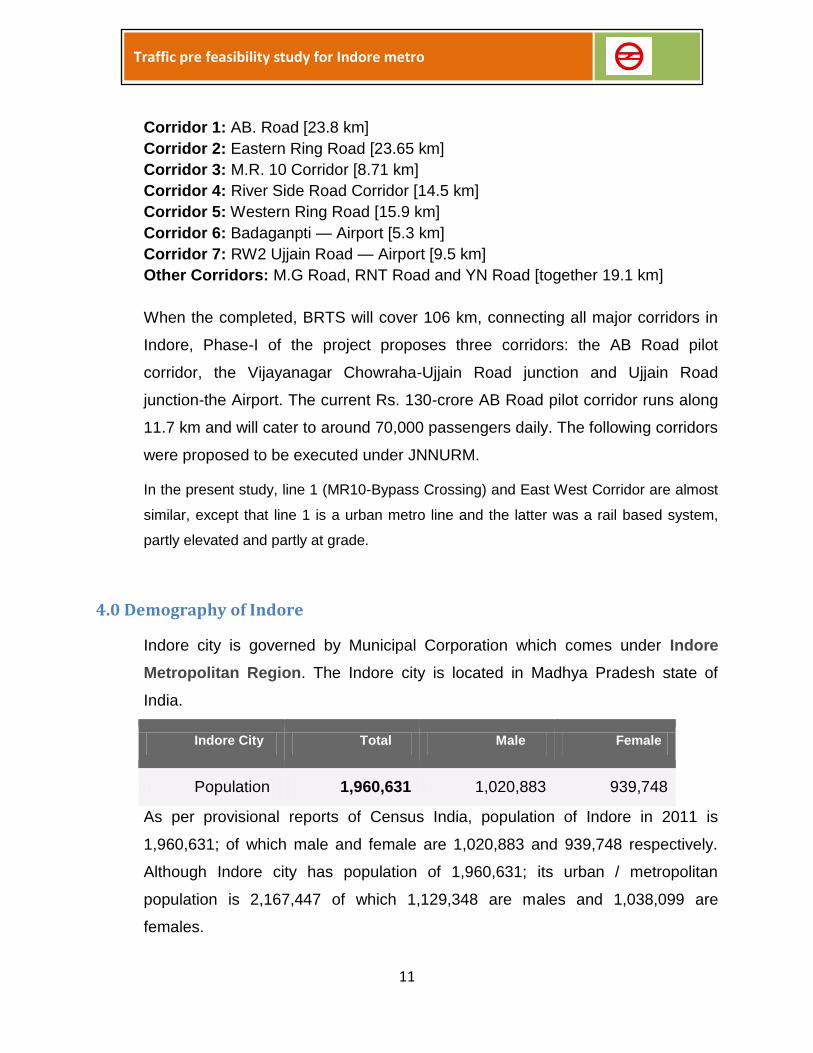
Indore city is governed by Municipal Corporation which comes under Indore
Metropolitan Region. The Indore city is located in Madhya Pradesh state of
India.
Indore City Total Male Female
Population 1,960,631 1,020,883 939,748
As per provisional reports of Census India, population of Indore in 2011 is
1,960,631; of which male and female are 1,020,883 and 939,748 respectively.
Although Indore city has population of 1,960,631; its urban / metropolitan
population is 2,167,447 of which 1,129,348 are males and 1,038,099 are
females.
12
Traffic pre feasibility study for Indore metro
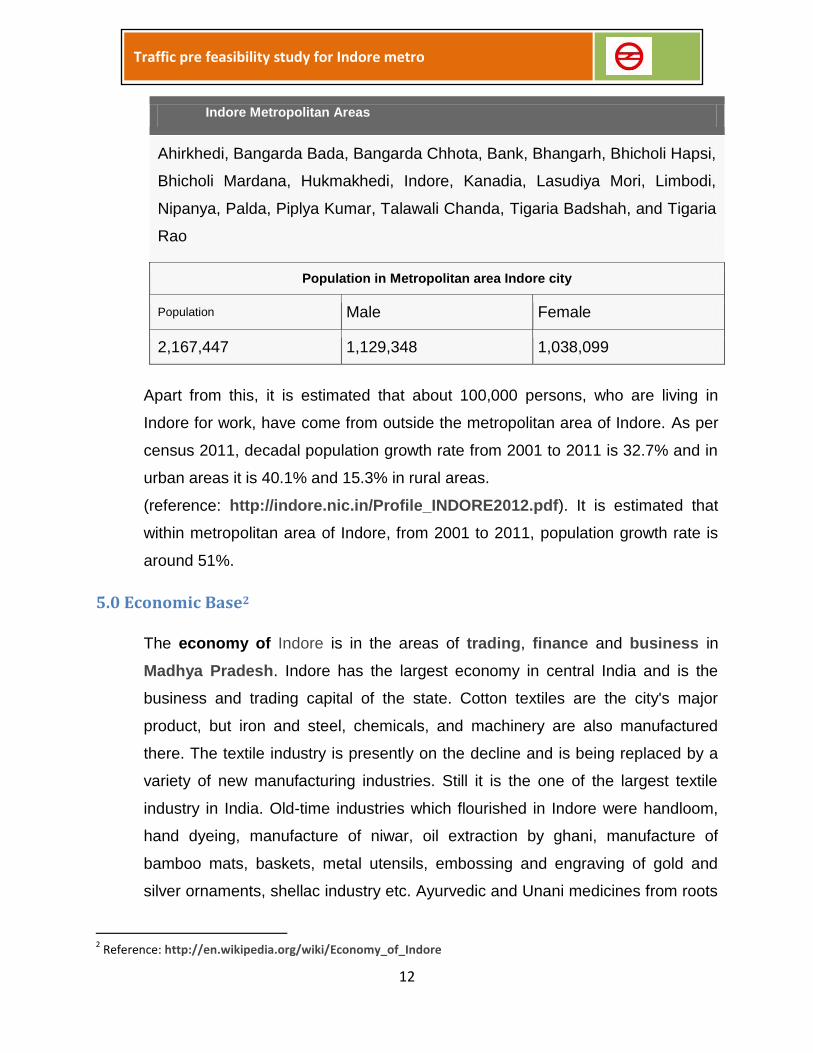
Indore Metropolitan Areas
Ahirkhedi, Bangarda Bada, Bangarda Chhota, Bank, Bhangarh, Bhicholi Hapsi,
Bhicholi Mardana, Hukmakhedi, Indore, Kanadia, Lasudiya Mori, Limbodi,
Nipanya, Palda, Piplya Kumar, Talawali Chanda, Tigaria Badshah, and Tigaria
Rao
Population in Metropolitan area Indore city
Population Male Female
2,167,447 1,129,348 1,038,099
Apart from this, it is estimated that about 100,000 persons, who are living in
Indore for work, have come from outside the metropolitan area of Indore. As per
census 2011, decadal population growth rate from 2001 to 2011 is 32.7% and in
urban areas it is 40.1% and 15.3% in rural areas.
(reference: http://indore.nic.in/Profile_INDORE2012.pdf). It is estimated that
within metropolitan area of Indore, from 2001 to 2011, population growth rate is
around 51%.
5.0 Economic Base2
The economy of Indore is in the areas of trading, finance and business in
Madhya Pradesh. Indore has the largest economy in central India and is the
business and trading capital of the state. Cotton textiles are the city's major
product, but iron and steel, chemicals, and machinery are also manufactured
there. The textile industry is presently on the decline and is being replaced by a
variety of new manufacturing industries. Still it is the one of the largest textile
industry in India. Old-time industries which flourished in Indore were handloom,
hand dyeing, manufacture of niwar, oil extraction by ghani, manufacture of
bamboo mats, baskets, metal utensils, embossing and engraving of gold and
silver ornaments, shellac industry etc. Ayurvedic and Unani medicines from roots
2 Reference: http://en.wikipedia.org/wiki/Economy_of_Indore
13
Traffic pre feasibility study for Indore metro
and herbs were manufactured under state patronage. Apart from textile industry,
Indore has oil seed extraction industry, confectionery, paper and straw board,
factories for asbestos products, RCC pipes and poles, machine tools and
accessories, electrical machinery and appliances, electronics goods, bicycles
and ready-made garments etc. Indore accounts for about one third of the total
‘Namkeen’ (variety of gram flour snacks) production of India. Indore economy
includes both the traditional agro industries and modern corporate and IT
companies. A number of management and engineering schools have been
opened in Indore in order to supply the growing demand of professionals.
Indore Urban Agglomeration had estimated 3.30-lakh workers in 1991. The
workforce increased from a size of 1.13 lakh in 1961 recording an average
annual growth rate of 3.64% per annum during 1961-1991. Number of Workers
estimated at present (2011) is 6.81 lakh.
Indore's CBD is the largest in state and also has plenty of surrounding
commercial areas which are considered part of Indore. A notable one is
Pithampur SEZ.
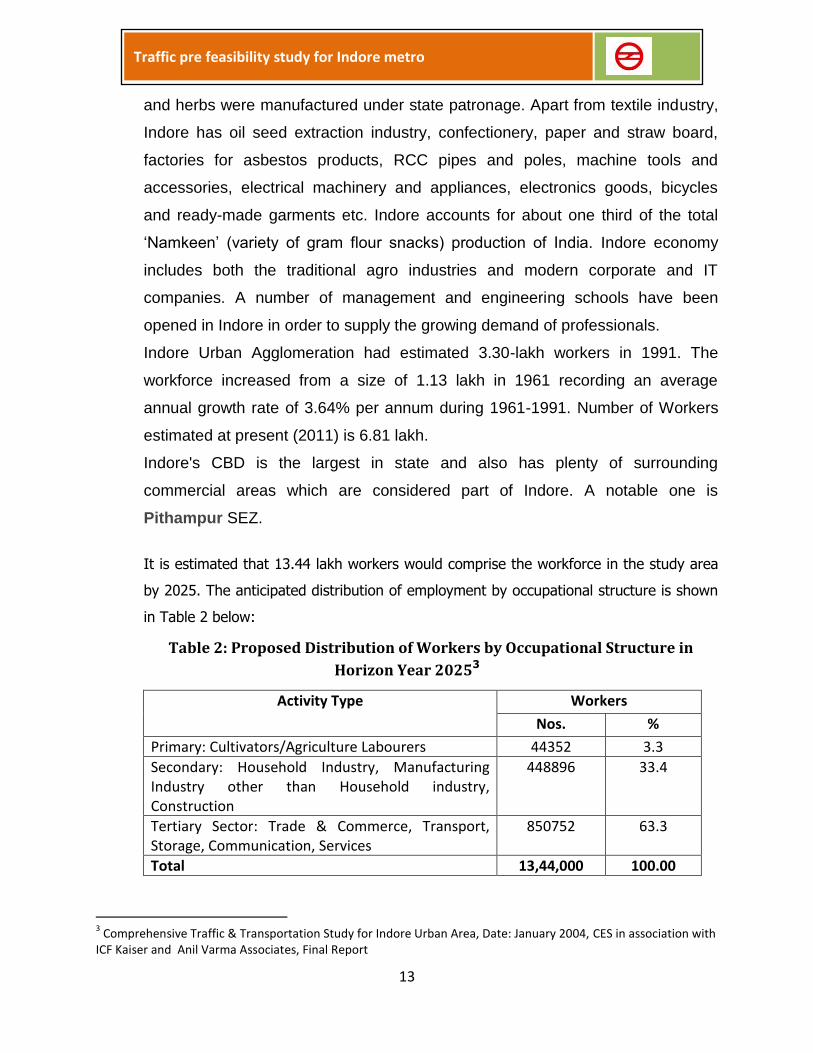
It is estimated that 13.44 lakh workers would comprise the workforce in the study area
by 2025. The anticipated distribution of employment by occupational structure is shown
in Table 2 below:
Table 2: Proposed Distribution of Workers by Occupational Structure in
Horizon Year 20253
Activity Type Workers
Nos. %
Primary: Cultivators/Agriculture Labourers 44352 3.3
Secondary: Household Industry, Manufacturing Industry other than Household industry, Construction
448896 33.4
Tertiary Sector: Trade & Commerce, Transport, Storage, Communication, Services
850752 63.3
Total 13,44,000 100.00
3 Comprehensive Traffic & Transportation Study for Indore Urban Area, Date: January 2004, CES in association with
ICF Kaiser and Anil Varma Associates, Final Report

14
Traffic pre feasibility study for Indore metro
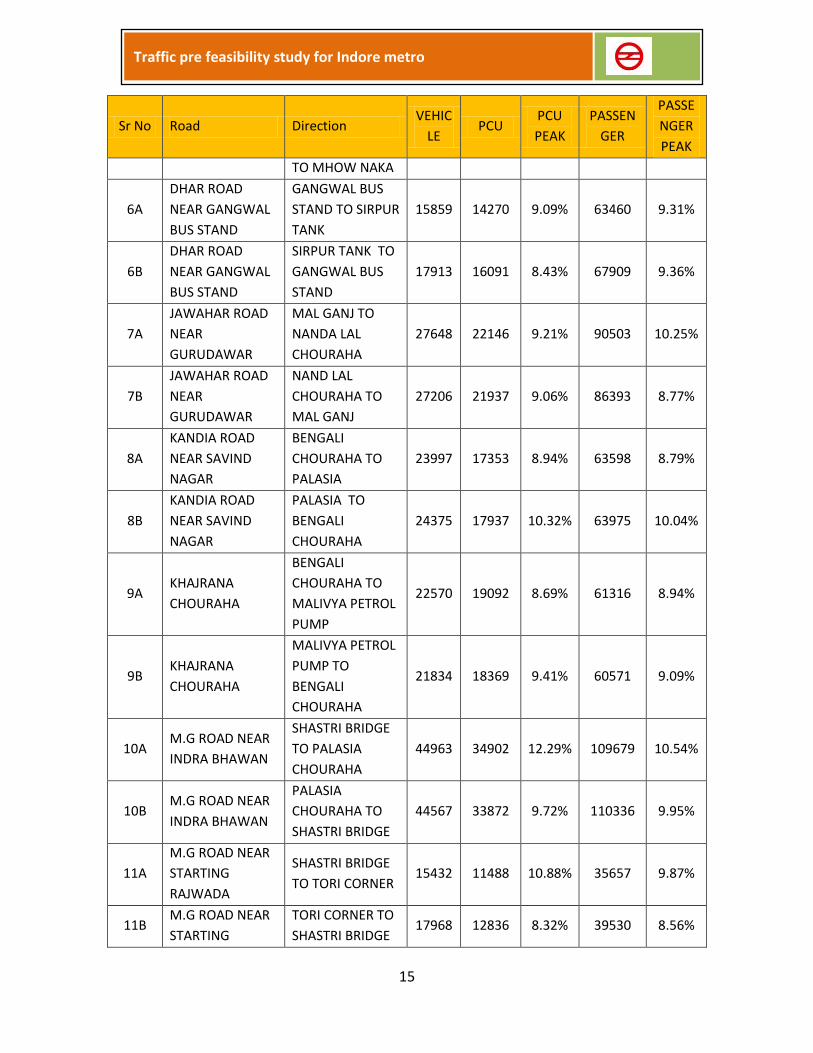
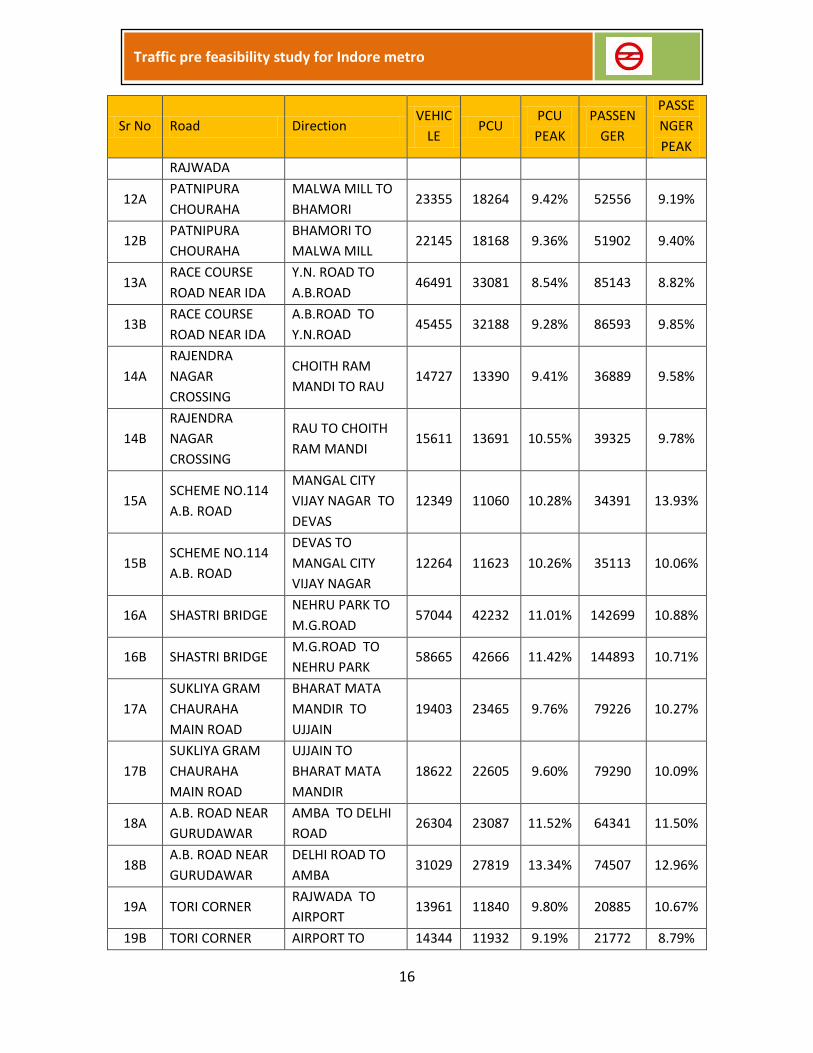
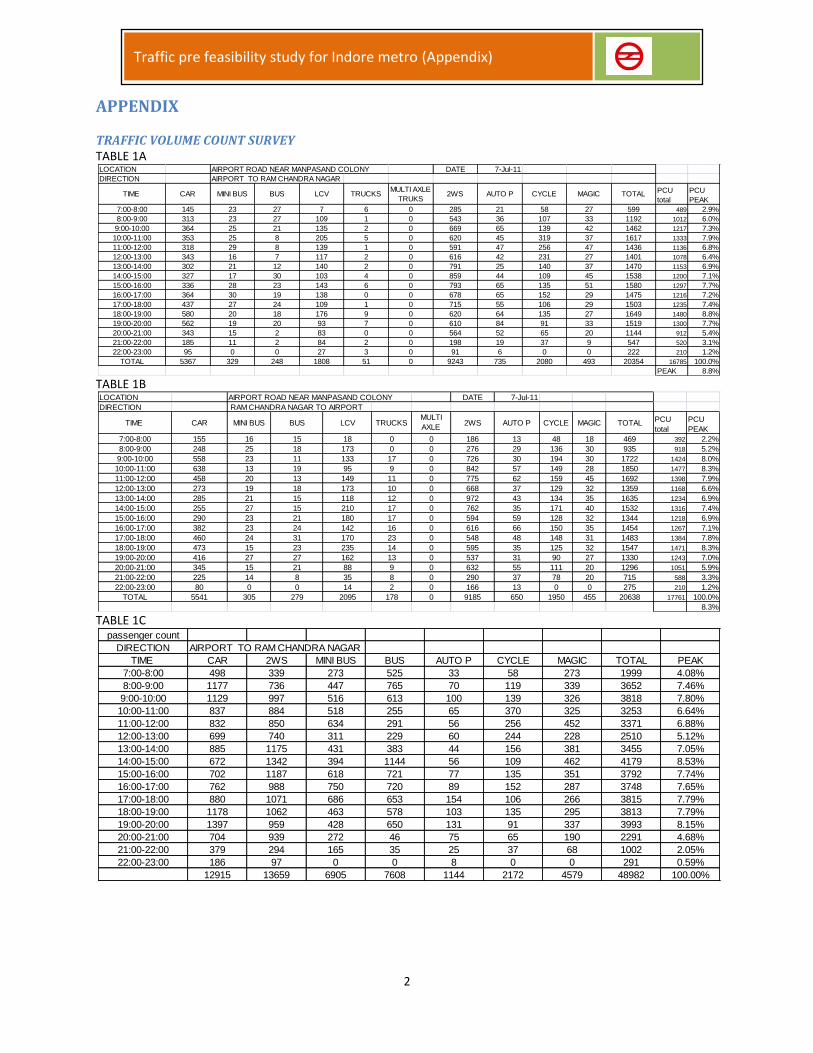
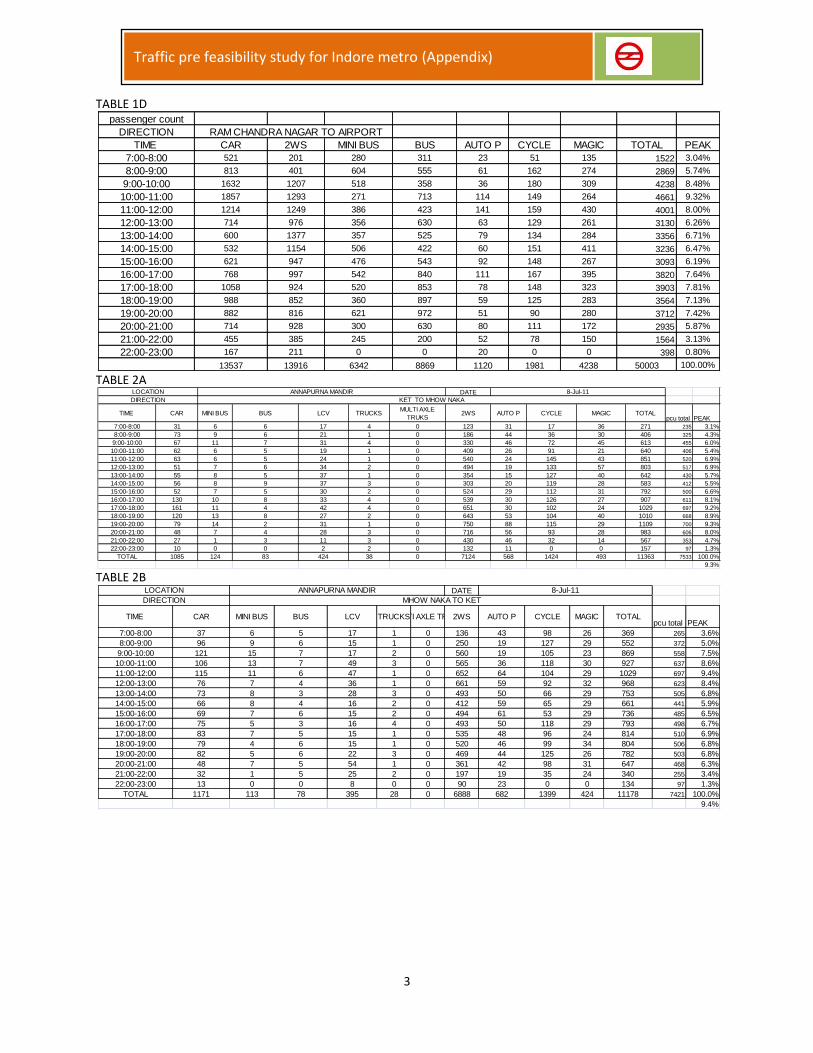
6.0 Traffic Surveys
To understand traffic flow volume and modal split of vehicular and passenger
traffic, TVC and Occupancy survey was conducted at 20 points within the city. A
Summary is shown in table 3.
Vehicle includes all vehicles on road, and PCU are total vehicles converted in
PCU. Passengers are by passenger vehicle only. Direction wise split is given for
all the locations to examine volume-capacity-ratio (VCR).
Table 3: Summary of traffic volume count at 20 locations in Indore
Sr No Road Direction VEHIC
LE PCU
PCU
PEAK
PASSEN
GER
PASSE
NGER
PEAK
1A
AIRPORT ROAD
NEAR
MANPASAND
COLONY
AIRPORT TO
RAM CHANDRA
NAGAR
20354 16785 8.81% 48982 8.53%
1B
AIRPORT ROAD
NEAR
MANPASAND
COLONY
RAM CHANDRA
NAGAR TO
AIRPORT
20638 17761 8.32% 50003 9.32%
2A ANNAPURNA
MANDIR
KET TO MHOW
NAKA 11363 7533 9.29% 21806 9.95%
2B ANNAPURNA
MANDIR
MHOW NAKA TO
KET 11178 7421 9.39% 20904 9.03%
3A BAN GANGA
BAN GANGA TO
GANESH DHAM
COLONY
19079 15438 9.05% 48257 10.56%
3B BAN GANGA
GANESH DHAM
COLONY TO BAN
GANGA
19000 15136 10.13% 51591 11.52%
4A BHANWAR KUWA
CHOURAHA
UNIVERSITY TO
TOWER
CHOURAHA
33150 23935 10.41% 77088 10.62%
4B BHANWAR KUWA
CHOURAHA
TOWER
CHOURAHA TO
UNIVERSITY
31914 23132 9.05% 77046 8.92%
5A G.D.COLLEGE MHOW NAKA TO
COLLECTORATE 44123 32587 8.03% 116490 9.03%
5B G.D.COLLEGE COLLECTORATE 44581 33965 8.50% 112322 9.13%
15
Traffic pre feasibility study for Indore metro
Sr No Road Direction VEHIC
LE PCU
PCU
PEAK
PASSEN
GER
PASSE
NGER
PEAK
TO MHOW NAKA
6A
DHAR ROAD
NEAR GANGWAL
BUS STAND
GANGWAL BUS
STAND TO SIRPUR
TANK
15859 14270 9.09% 63460 9.31%
6B
DHAR ROAD
NEAR GANGWAL
BUS STAND
SIRPUR TANK TO
GANGWAL BUS
STAND
17913 16091 8.43% 67909 9.36%
7A
JAWAHAR ROAD
NEAR
GURUDAWAR
MAL GANJ TO
NANDA LAL
CHOURAHA
27648 22146 9.21% 90503 10.25%
7B
JAWAHAR ROAD
NEAR
GURUDAWAR
NAND LAL
CHOURAHA TO
MAL GANJ
27206 21937 9.06% 86393 8.77%
8A
KANDIA ROAD
NEAR SAVIND
NAGAR
BENGALI
CHOURAHA TO
PALASIA
23997 17353 8.94% 63598 8.79%
8B
KANDIA ROAD
NEAR SAVIND
NAGAR
PALASIA TO
BENGALI
CHOURAHA
24375 17937 10.32% 63975 10.04%
9A KHAJRANA
CHOURAHA
BENGALI
CHOURAHA TO
MALIVYA PETROL
PUMP
22570 19092 8.69% 61316 8.94%
9B KHAJRANA
CHOURAHA
MALIVYA PETROL
PUMP TO
BENGALI
CHOURAHA
21834 18369 9.41% 60571 9.09%
10A M.G ROAD NEAR
INDRA BHAWAN
SHASTRI BRIDGE
TO PALASIA
CHOURAHA
44963 34902 12.29% 109679 10.54%
10B M.G ROAD NEAR
INDRA BHAWAN
PALASIA
CHOURAHA TO
SHASTRI BRIDGE
44567 33872 9.72% 110336 9.95%
11A
M.G ROAD NEAR
STARTING
RAJWADA
SHASTRI BRIDGE
TO TORI CORNER 15432 11488 10.88% 35657 9.87%
11B M.G ROAD NEAR
STARTING
TORI CORNER TO
SHASTRI BRIDGE 17968 12836 8.32% 39530 8.56%
16
Traffic pre feasibility study for Indore metro
Sr No Road Direction VEHIC
LE PCU
PCU
PEAK
PASSEN
GER
PASSE
NGER
PEAK
RAJWADA
12A PATNIPURA
CHOURAHA
MALWA MILL TO
BHAMORI 23355 18264 9.42% 52556 9.19%
12B PATNIPURA
CHOURAHA
BHAMORI TO
MALWA MILL 22145 18168 9.36% 51902 9.40%
13A RACE COURSE
ROAD NEAR IDA
Y.N. ROAD TO
A.B.ROAD 46491 33081 8.54% 85143 8.82%
13B RACE COURSE
ROAD NEAR IDA
A.B.ROAD TO
Y.N.ROAD 45455 32188 9.28% 86593 9.85%
14A
RAJENDRA
NAGAR
CROSSING
CHOITH RAM
MANDI TO RAU 14727 13390 9.41% 36889 9.58%
14B
RAJENDRA
NAGAR
CROSSING
RAU TO CHOITH
RAM MANDI 15611 13691 10.55% 39325 9.78%
15A SCHEME NO.114
A.B. ROAD
MANGAL CITY
VIJAY NAGAR TO
DEVAS
12349 11060 10.28% 34391 13.93%
15B SCHEME NO.114
A.B. ROAD
DEVAS TO
MANGAL CITY
VIJAY NAGAR
12264 11623 10.26% 35113 10.06%
16A SHASTRI BRIDGE NEHRU PARK TO
M.G.ROAD 57044 42232 11.01% 142699 10.88%
16B SHASTRI BRIDGE M.G.ROAD TO
NEHRU PARK 58665 42666 11.42% 144893 10.71%
17A
SUKLIYA GRAM
CHAURAHA
MAIN ROAD
BHARAT MATA
MANDIR TO
UJJAIN
19403 23465 9.76% 79226 10.27%
17B
SUKLIYA GRAM
CHAURAHA
MAIN ROAD
UJJAIN TO
BHARAT MATA
MANDIR
18622 22605 9.60% 79290 10.09%
18A A.B. ROAD NEAR
GURUDAWAR
AMBA TO DELHI
ROAD 26304 23087 11.52% 64341 11.50%
18B A.B. ROAD NEAR
GURUDAWAR
DELHI ROAD TO
AMBA 31029 27819 13.34% 74507 12.96%
19A TORI CORNER RAJWADA TO
AIRPORT 13961 11840 9.80% 20885 10.67%
19B TORI CORNER AIRPORT TO 14344 11932 9.19% 21772 8.79%
17
Traffic pre feasibility study for Indore metro
Sr No Road Direction VEHIC
LE PCU
PCU
PEAK
PASSEN
GER
PASSE
NGER
PEAK
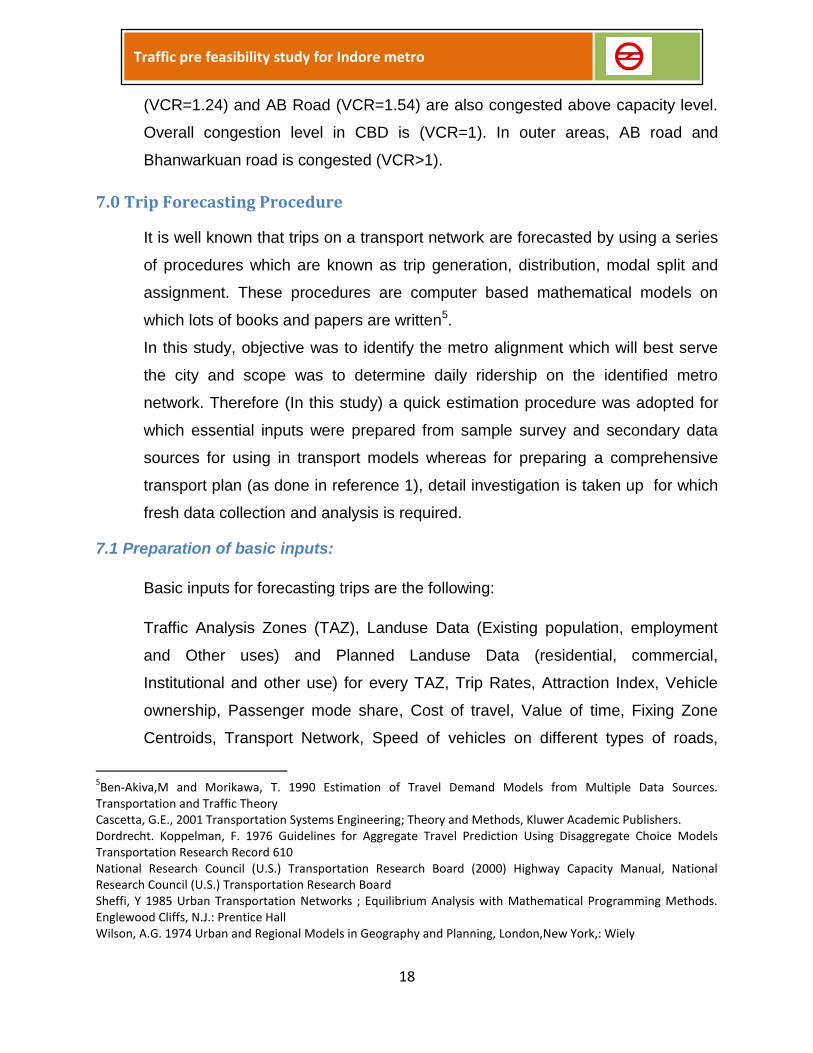
RAJWADA
20A YASHWANT ROAD RAJWADA TO
COLLECTORATE 11517 8944 10.99% 30726 10.81%
20B YASHWANT ROAD COLLECTORATE
TO RAJWADA 10298 8335 8.95% 30298 9.92%
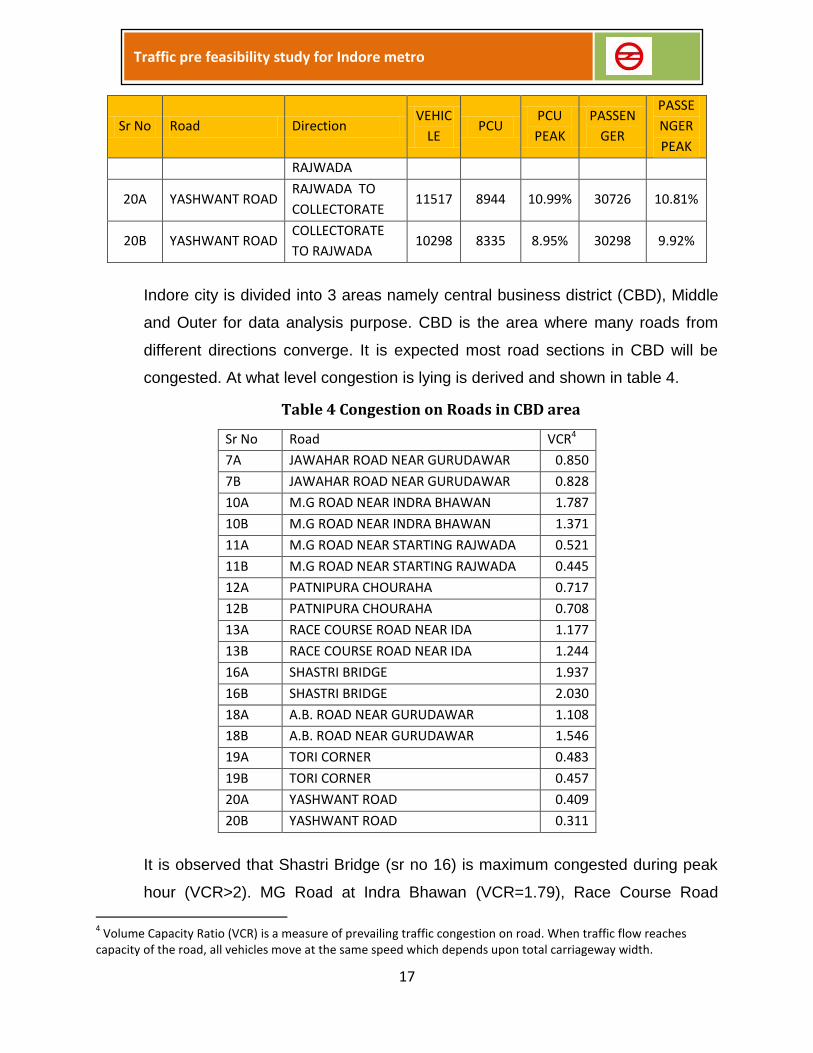
Indore city is divided into 3 areas namely central business district (CBD), Middle
and Outer for data analysis purpose. CBD is the area where many roads from
different directions converge. It is expected most road sections in CBD will be
congested. At what level congestion is lying is derived and shown in table 4.
Table 4 Congestion on Roads in CBD area
Sr No Road VCR4
7A JAWAHAR ROAD NEAR GURUDAWAR 0.850
7B JAWAHAR ROAD NEAR GURUDAWAR 0.828
10A M.G ROAD NEAR INDRA BHAWAN 1.787
10B M.G ROAD NEAR INDRA BHAWAN 1.371
11A M.G ROAD NEAR STARTING RAJWADA 0.521
11B M.G ROAD NEAR STARTING RAJWADA 0.445
12A PATNIPURA CHOURAHA 0.717
12B PATNIPURA CHOURAHA 0.708
13A RACE COURSE ROAD NEAR IDA 1.177
13B RACE COURSE ROAD NEAR IDA 1.244
16A SHASTRI BRIDGE 1.937
16B SHASTRI BRIDGE 2.030
18A A.B. ROAD NEAR GURUDAWAR 1.108
18B A.B. ROAD NEAR GURUDAWAR 1.546
19A TORI CORNER 0.483
19B TORI CORNER 0.457
20A YASHWANT ROAD 0.409
20B YASHWANT ROAD 0.311
It is observed that Shastri Bridge (sr no 16) is maximum congested during peak
hour (VCR>2). MG Road at Indra Bhawan (VCR=1.79), Race Course Road
4 Volume Capacity Ratio (VCR) is a measure of prevailing traffic congestion on road. When traffic flow reaches
capacity of the road, all vehicles move at the same speed which depends upon total carriageway width.
18
Traffic pre feasibility study for Indore metro
(VCR=1.24) and AB Road (VCR=1.54) are also congested above capacity level.
Overall congestion level in CBD is (VCR=1). In outer areas, AB road and
Bhanwarkuan road is congested (VCR>1).
7.0 Trip Forecasting Procedure
It is well known that trips on a transport network are forecasted by using a series
of procedures which are known as trip generation, distribution, modal split and
assignment. These procedures are computer based mathematical models on
which lots of books and papers are written5.
In this study, objective was to identify the metro alignment which will best serve
the city and scope was to determine daily ridership on the identified metro
network. Therefore (In this study) a quick estimation procedure was adopted for
which essential inputs were prepared from sample survey and secondary data
sources for using in transport models whereas for preparing a comprehensive
transport plan (as done in reference 1), detail investigation is taken up for which
fresh data collection and analysis is required.
7.1 Preparation of basic inputs:
Basic inputs for forecasting trips are the following:
Traffic Analysis Zones (TAZ), Landuse Data (Existing population, employment
and Other uses) and Planned Landuse Data (residential, commercial,
Institutional and other use) for every TAZ, Trip Rates, Attraction Index, Vehicle
ownership, Passenger mode share, Cost of travel, Value of time, Fixing Zone
Centroids, Transport Network, Speed of vehicles on different types of roads,
5Ben-Akiva,M and Morikawa, T. 1990 Estimation of Travel Demand Models from Multiple Data Sources.
Transportation and Traffic Theory Cascetta, G.E., 2001 Transportation Systems Engineering; Theory and Methods, Kluwer Academic Publishers. Dordrecht. Koppelman, F. 1976 Guidelines for Aggregate Travel Prediction Using Disaggregate Choice Models Transportation Research Record 610 National Research Council (U.S.) Transportation Research Board (2000) Highway Capacity Manual, National Research Council (U.S.) Transportation Research Board Sheffi, Y 1985 Urban Transportation Networks ; Equilibrium Analysis with Mathematical Programming Methods. Englewood Cliffs, N.J.: Prentice Hall Wilson, A.G. 1974 Urban and Regional Models in Geography and Planning, London,New York,: Wiely
19
Traffic pre feasibility study for Indore metro
Delay characteristics, Growth rates of population, employment, Vehicle statistics,
Vehicular growth rates, Accident Statistics.
7.2 Traffic Analysis Zones (TAZ):
In CTTS (ref 1, chapter 3 page 1) 83 TAZs were identified with in the study area
and 30 in remaining parts of Madhya Pradesh including rest of India. One of
purpose was to identify the corridors for heavy flow traffic movement, while
another purpose was to prepare a transport improvement policy for the future of
Indore and its adjoining areas. Landuse transport Model (Garin Lowry) was used
for identifying the traffic zones in which specific land use should be allocated.
Short term traffic and Transportation Improvement Measures were also
suggested.
As urban metro rail system is a smaller network for facilitating quicker and better
movement within the city, traffic zone requirement is higher to catch even smaller
movement ( <1.0 km) within the city. With smaller zone size, it is possible to
identify specific zones for trip boarding and alighting. In this study, 109 internal
zones and 11 external zones are identified. External zones are gates to enter the
city by road.
7.3 Landuse Data:
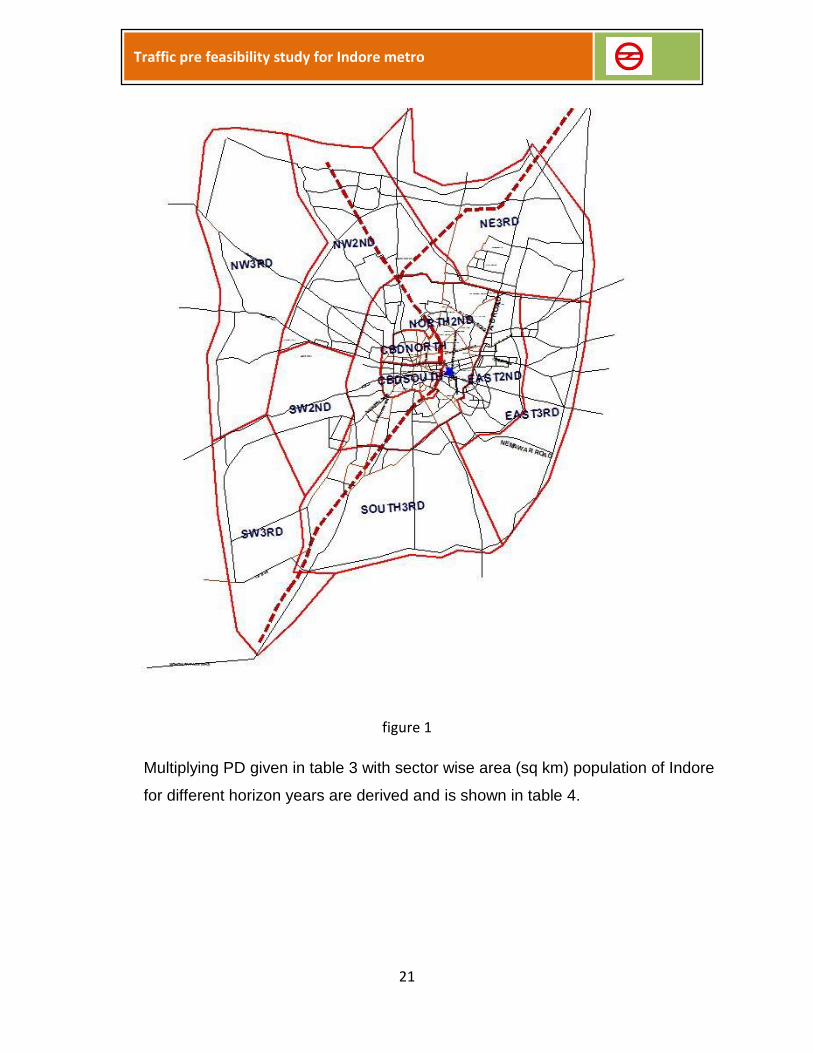
Study area was first divided in to 11 sectors as shown in figure 1. These sectors
were made keeping core area (CBD) at the center and surrounding the CBD
second layers and surrounding the second layer sectors third layer sectors were
constructed. It is observed that population in the second layer outside the core
area is lower and lowest in the third layer sectors. Average population densities
were fixed per sector so that total population matches with 2001 and 2011
census population.
Total study area (as per GIS map) was 348.68 sq km and average population
density (PD) was found to be 43 per hectare. For population projection, a
scheme for applying growth rate was adopted which says that if PD is very high
20
Traffic pre feasibility study for Indore metro
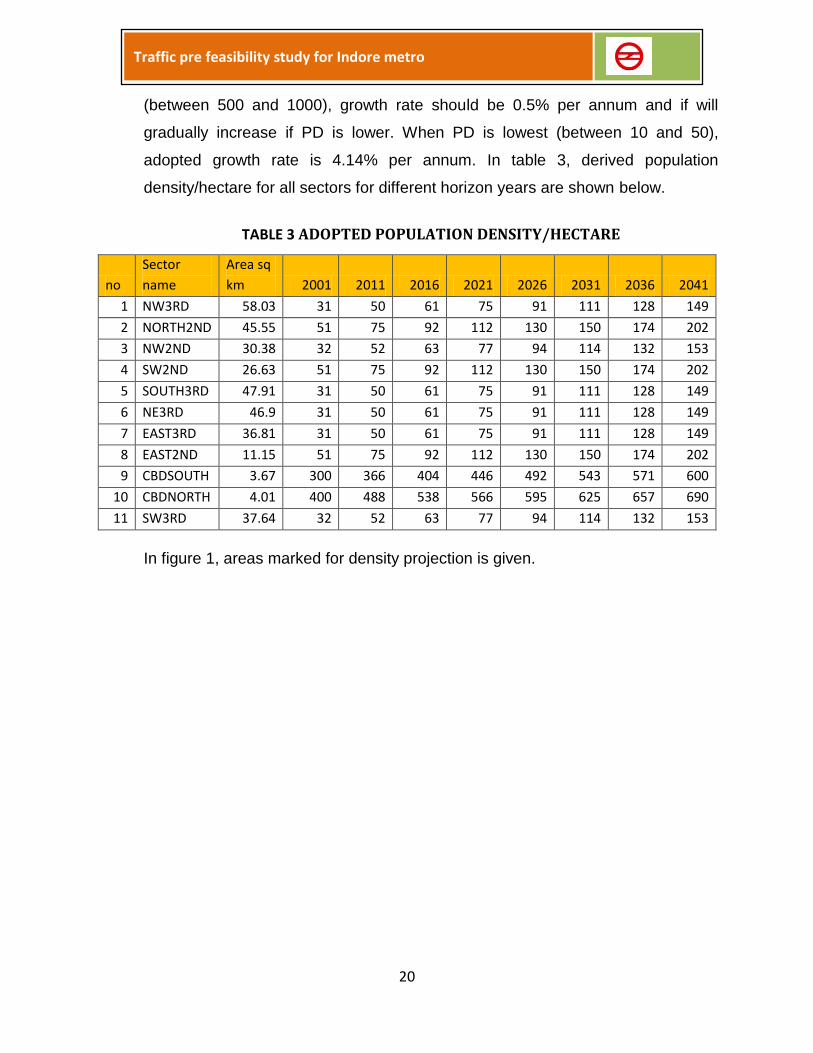
(between 500 and 1000), growth rate should be 0.5% per annum and if will
gradually increase if PD is lower. When PD is lowest (between 10 and 50),
adopted growth rate is 4.14% per annum. In table 3, derived population
density/hectare for all sectors for different horizon years are shown below.
TABLE 3 ADOPTED POPULATION DENSITY/HECTARE
no
Sector
name
Area sq
km 2001 2011 2016 2021 2026 2031 2036 2041
1 NW3RD 58.03 31 50 61 75 91 111 128 149
2 NORTH2ND 45.55 51 75 92 112 130 150 174 202
3 NW2ND 30.38 32 52 63 77 94 114 132 153
4 SW2ND 26.63 51 75 92 112 130 150 174 202
5 SOUTH3RD 47.91 31 50 61 75 91 111 128 149
6 NE3RD 46.9 31 50 61 75 91 111 128 149
7 EAST3RD 36.81 31 50 61 75 91 111 128 149
8 EAST2ND 11.15 51 75 92 112 130 150 174 202
9 CBDSOUTH 3.67 300 366 404 446 492 543 571 600
10 CBDNORTH 4.01 400 488 538 566 595 625 657 690
11 SW3RD 37.64 32 52 63 77 94 114 132 153
In figure 1, areas marked for density projection is given.
21
Traffic pre feasibility study for Indore metro
figure 1
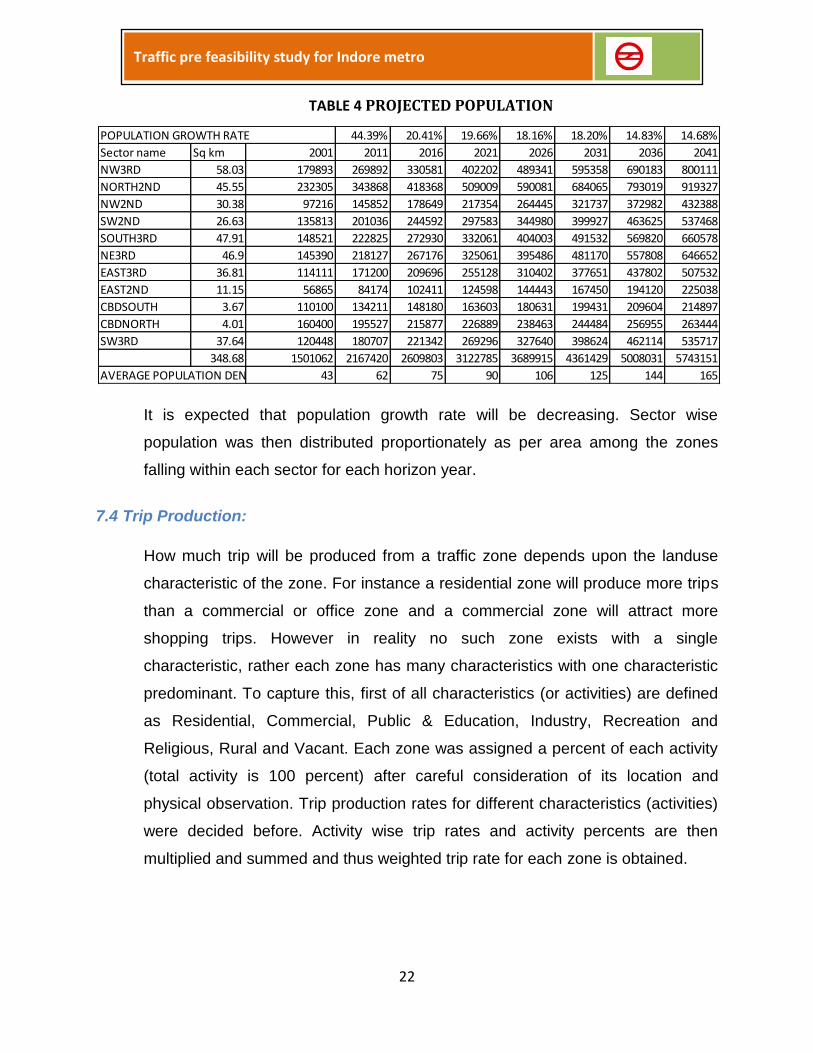
Multiplying PD given in table 3 with sector wise area (sq km) population of Indore
for different horizon years are derived and is shown in table 4.
22
Traffic pre feasibility study for Indore metro
TABLE 4 PROJECTED POPULATION
It is expected that population growth rate will be decreasing. Sector wise
population was then distributed proportionately as per area among the zones
falling within each sector for each horizon year.
7.4 Trip Production:
How much trip will be produced from a traffic zone depends upon the landuse
characteristic of the zone. For instance a residential zone will produce more trips
than a commercial or office zone and a commercial zone will attract more
shopping trips. However in reality no such zone exists with a single
characteristic, rather each zone has many characteristics with one characteristic
predominant. To capture this, first of all characteristics (or activities) are defined
as Residential, Commercial, Public & Education, Industry, Recreation and
Religious, Rural and Vacant. Each zone was assigned a percent of each activity
(total activity is 100 percent) after careful consideration of its location and
physical observation. Trip production rates for different characteristics (activities)
were decided before. Activity wise trip rates and activity percents are then
multiplied and summed and thus weighted trip rate for each zone is obtained.
POPULATION GROWTH RATE 44.39% 20.41% 19.66% 18.16% 18.20% 14.83% 14.68%
Sector name Sq km 2001 2011 2016 2021 2026 2031 2036 2041
NW3RD 58.03 179893 269892 330581 402202 489341 595358 690183 800111
NORTH2ND 45.55 232305 343868 418368 509009 590081 684065 793019 919327
NW2ND 30.38 97216 145852 178649 217354 264445 321737 372982 432388
SW2ND 26.63 135813 201036 244592 297583 344980 399927 463625 537468
SOUTH3RD 47.91 148521 222825 272930 332061 404003 491532 569820 660578
NE3RD 46.9 145390 218127 267176 325061 395486 481170 557808 646652
EAST3RD 36.81 114111 171200 209696 255128 310402 377651 437802 507532
EAST2ND 11.15 56865 84174 102411 124598 144443 167450 194120 225038
CBDSOUTH 3.67 110100 134211 148180 163603 180631 199431 209604 214897
CBDNORTH 4.01 160400 195527 215877 226889 238463 244484 256955 263444
SW3RD 37.64 120448 180707 221342 269296 327640 398624 462114 535717
348.68 1501062 2167420 2609803 3122785 3689915 4361429 5008031 5743151
AVERAGE POPULATION DENSITY 43 62 75 90 106 125 144 165
23
Traffic pre feasibility study for Indore metro
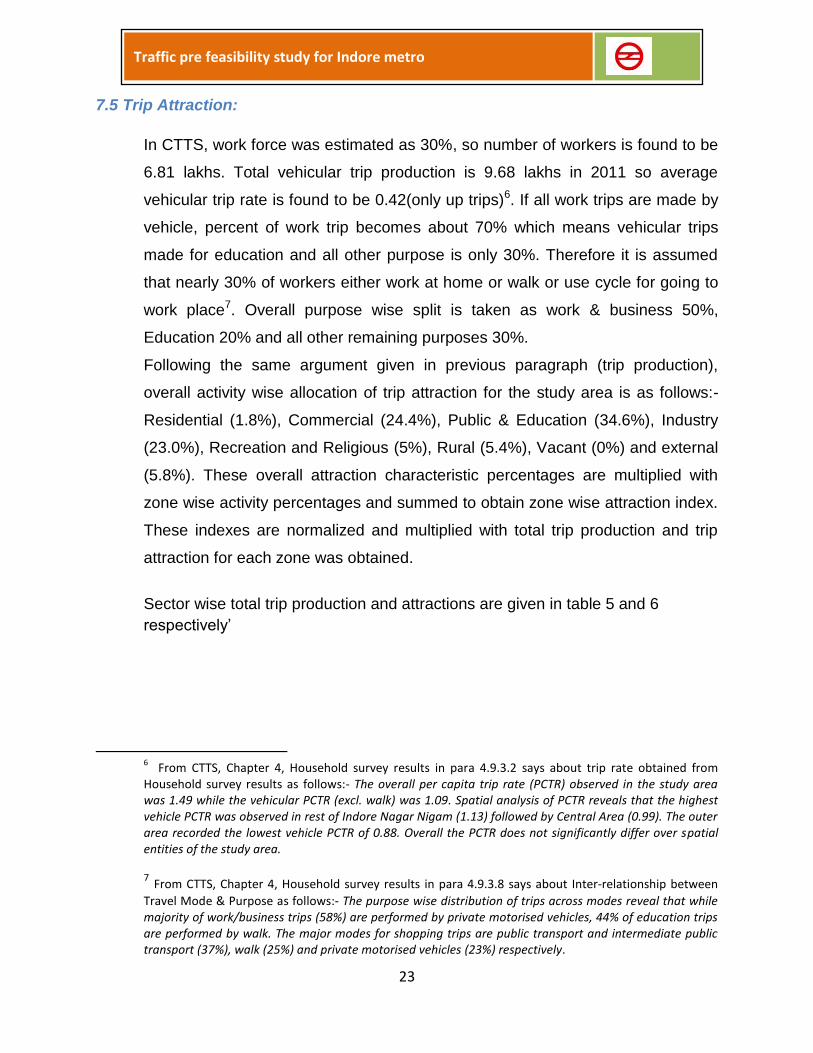
7.5 Trip Attraction:
In CTTS, work force was estimated as 30%, so number of workers is found to be
6.81 lakhs. Total vehicular trip production is 9.68 lakhs in 2011 so average
vehicular trip rate is found to be 0.42(only up trips)6. If all work trips are made by
vehicle, percent of work trip becomes about 70% which means vehicular trips
made for education and all other purpose is only 30%. Therefore it is assumed
that nearly 30% of workers either work at home or walk or use cycle for going to
work place7. Overall purpose wise split is taken as work & business 50%,
Education 20% and all other remaining purposes 30%.
Following the same argument given in previous paragraph (trip production),
overall activity wise allocation of trip attraction for the study area is as follows:-
Residential (1.8%), Commercial (24.4%), Public & Education (34.6%), Industry
(23.0%), Recreation and Religious (5%), Rural (5.4%), Vacant (0%) and external
(5.8%). These overall attraction characteristic percentages are multiplied with
zone wise activity percentages and summed to obtain zone wise attraction index.
These indexes are normalized and multiplied with total trip production and trip
attraction for each zone was obtained.
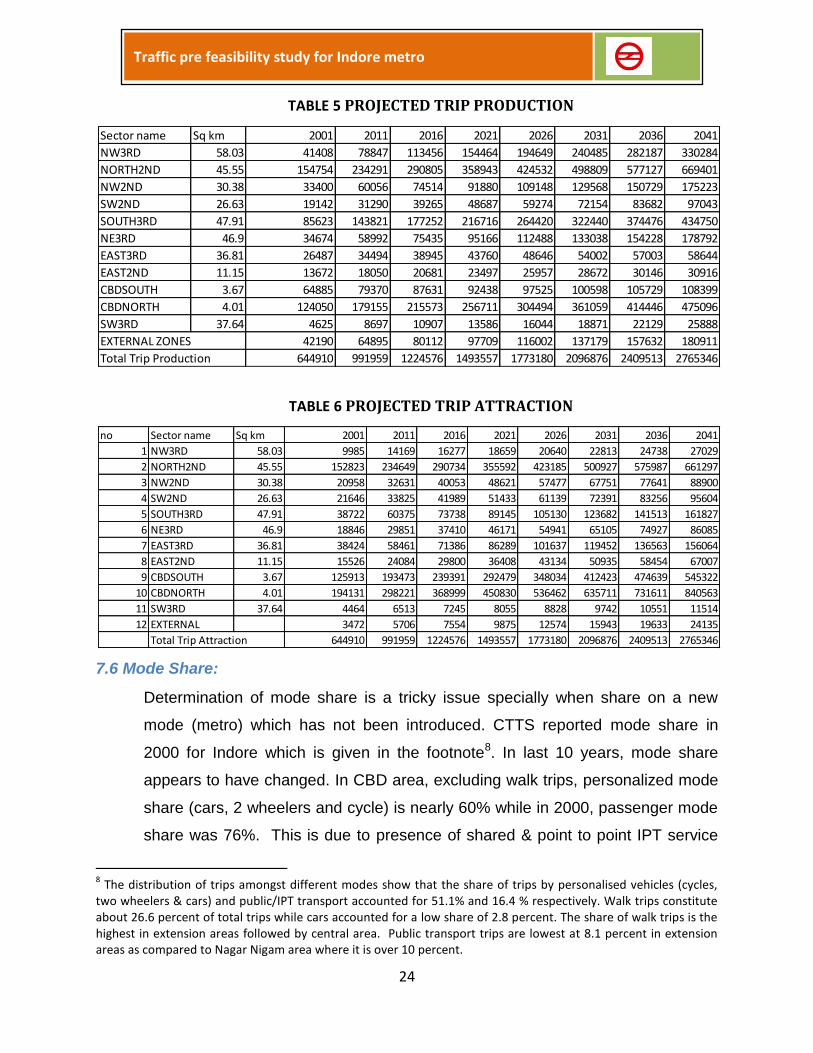
Sector wise total trip production and attractions are given in table 5 and 6
respectively’
6 From CTTS, Chapter 4, Household survey results in para 4.9.3.2 says about trip rate obtained from
Household survey results as follows:- The overall per capita trip rate (PCTR) observed in the study area was 1.49 while the vehicular PCTR (excl. walk) was 1.09. Spatial analysis of PCTR reveals that the highest vehicle PCTR was observed in rest of Indore Nagar Nigam (1.13) followed by Central Area (0.99). The outer area recorded the lowest vehicle PCTR of 0.88. Overall the PCTR does not significantly differ over spatial entities of the study area. 7 From CTTS, Chapter 4, Household survey results in para 4.9.3.8 says about Inter-relationship between
Travel Mode & Purpose as follows:- The purpose wise distribution of trips across modes reveal that while majority of work/business trips (58%) are performed by private motorised vehicles, 44% of education trips are performed by walk. The major modes for shopping trips are public transport and intermediate public transport (37%), walk (25%) and private motorised vehicles (23%) respectively.
24
Traffic pre feasibility study for Indore metro
TABLE 5 PROJECTED TRIP PRODUCTION
TABLE 6 PROJECTED TRIP ATTRACTION
7.6 Mode Share:
Determination of mode share is a tricky issue specially when share on a new
mode (metro) which has not been introduced. CTTS reported mode share in
2000 for Indore which is given in the footnote8. In last 10 years, mode share
appears to have changed. In CBD area, excluding walk trips, personalized mode
share (cars, 2 wheelers and cycle) is nearly 60% while in 2000, passenger mode
share was 76%. This is due to presence of shared & point to point IPT service
8 The distribution of trips amongst different modes show that the share of trips by personalised vehicles (cycles,
two wheelers & cars) and public/IPT transport accounted for 51.1% and 16.4 % respectively. Walk trips constitute about 26.6 percent of total trips while cars accounted for a low share of 2.8 percent. The share of walk trips is the highest in extension areas followed by central area. Public transport trips are lowest at 8.1 percent in extension areas as compared to Nagar Nigam area where it is over 10 percent.
Sector name Sq km 2001 2011 2016 2021 2026 2031 2036 2041
NW3RD 58.03 41408 78847 113456 154464 194649 240485 282187 330284
NORTH2ND 45.55 154754 234291 290805 358943 424532 498809 577127 669401
NW2ND 30.38 33400 60056 74514 91880 109148 129568 150729 175223
SW2ND 26.63 19142 31290 39265 48687 59274 72154 83682 97043
SOUTH3RD 47.91 85623 143821 177252 216716 264420 322440 374476 434750
NE3RD 46.9 34674 58992 75435 95166 112488 133038 154228 178792
EAST3RD 36.81 26487 34494 38945 43760 48646 54002 57003 58644
EAST2ND 11.15 13672 18050 20681 23497 25957 28672 30146 30916
CBDSOUTH 3.67 64885 79370 87631 92438 97525 100598 105729 108399
CBDNORTH 4.01 124050 179155 215573 256711 304494 361059 414446 475096
SW3RD 37.64 4625 8697 10907 13586 16044 18871 22129 25888
EXTERNAL ZONES 42190 64895 80112 97709 116002 137179 157632 180911
Total Trip Production 644910 991959 1224576 1493557 1773180 2096876 2409513 2765346
no Sector name Sq km 2001 2011 2016 2021 2026 2031 2036 2041
1 NW3RD 58.03 9985 14169 16277 18659 20640 22813 24738 27029
2 NORTH2ND 45.55 152823 234649 290734 355592 423185 500927 575987 661297
3 NW2ND 30.38 20958 32631 40053 48621 57477 67751 77641 88900
4 SW2ND 26.63 21646 33825 41989 51433 61139 72391 83256 95604
5 SOUTH3RD 47.91 38722 60375 73738 89145 105130 123682 141513 161827
6 NE3RD 46.9 18846 29851 37410 46171 54941 65105 74927 86085
7 EAST3RD 36.81 38424 58461 71386 86289 101637 119452 136563 156064
8 EAST2ND 11.15 15526 24084 29800 36408 43134 50935 58454 67007
9 CBDSOUTH 3.67 125913 193473 239391 292479 348034 412423 474639 545322
10 CBDNORTH 4.01 194131 298221 368999 450830 536462 635711 731611 840563
11 SW3RD 37.64 4464 6513 7245 8055 8828 9742 10551 11514
12 EXTERNAL 3472 5706 7554 9875 12574 15943 19633 24135
Total Trip Attraction 644910 991959 1224576 1493557 1773180 2096876 2409513 2765346
25
Traffic pre feasibility study for Indore metro
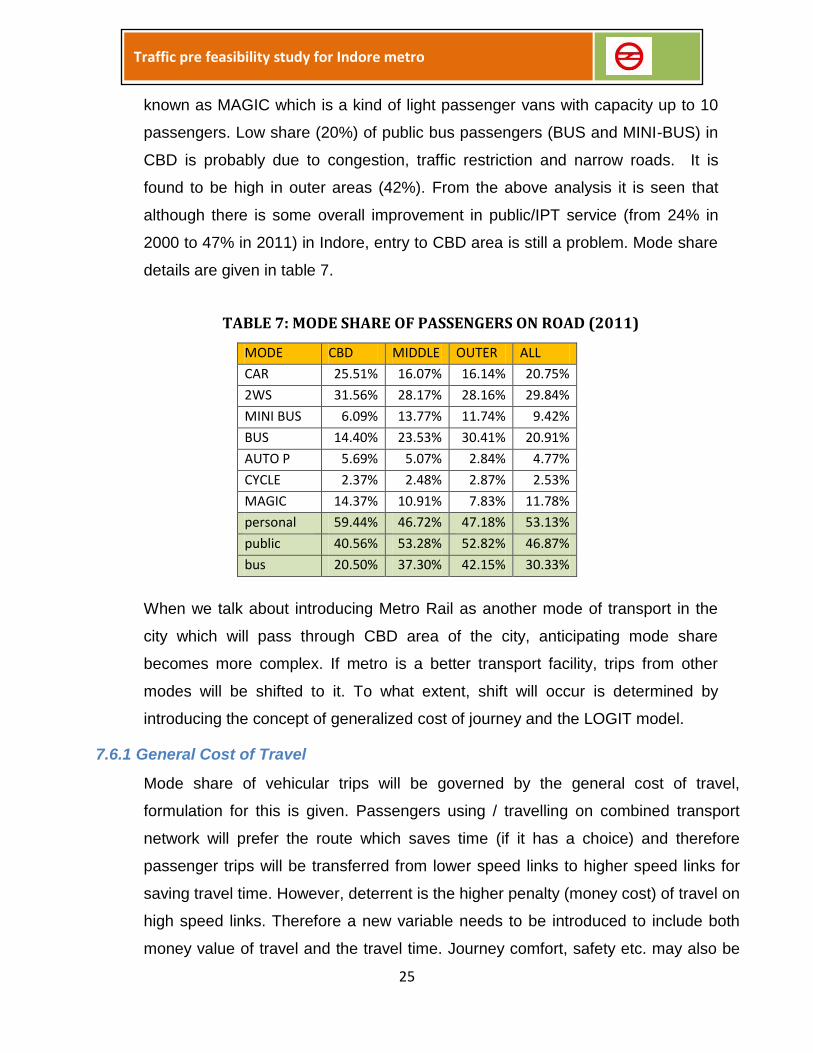
known as MAGIC which is a kind of light passenger vans with capacity up to 10
passengers. Low share (20%) of public bus passengers (BUS and MINI-BUS) in
CBD is probably due to congestion, traffic restriction and narrow roads. It is
found to be high in outer areas (42%). From the above analysis it is seen that
although there is some overall improvement in public/IPT service (from 24% in
2000 to 47% in 2011) in Indore, entry to CBD area is still a problem. Mode share
details are given in table 7.
TABLE 7: MODE SHARE OF PASSENGERS ON ROAD (2011)
MODE CBD MIDDLE OUTER ALL
CAR 25.51% 16.07% 16.14% 20.75%
2WS 31.56% 28.17% 28.16% 29.84%
MINI BUS 6.09% 13.77% 11.74% 9.42%
BUS 14.40% 23.53% 30.41% 20.91%
AUTO P 5.69% 5.07% 2.84% 4.77%
CYCLE 2.37% 2.48% 2.87% 2.53%
MAGIC 14.37% 10.91% 7.83% 11.78%
personal 59.44% 46.72% 47.18% 53.13%
public 40.56% 53.28% 52.82% 46.87%
bus 20.50% 37.30% 42.15% 30.33%
When we talk about introducing Metro Rail as another mode of transport in the
city which will pass through CBD area of the city, anticipating mode share
becomes more complex. If metro is a better transport facility, trips from other
modes will be shifted to it. To what extent, shift will occur is determined by
introducing the concept of generalized cost of journey and the LOGIT model.
7.6.1 General Cost of Travel
Mode share of vehicular trips will be governed by the general cost of travel,
formulation for this is given. Passengers using / travelling on combined transport
network will prefer the route which saves time (if it has a choice) and therefore
passenger trips will be transferred from lower speed links to higher speed links for
saving travel time. However, deterrent is the higher penalty (money cost) of travel on
high speed links. Therefore a new variable needs to be introduced to include both
money value of travel and the travel time. Journey comfort, safety etc. may also be
26
Traffic pre feasibility study for Indore metro
included. Generalized cost is introduced to incorporate both time and money spent
on travel. Quantity of resources spent for travel on any public mode from origin to
destination can be divided into several components such as walking time from origin
to bus stand/metro/rail station, waiting time at the boarding point, fare paid, in
vehicle journey time, time and money spent from alighting point for going to
destination. Therefore, generalized travel cost for any route is sum of the money
costs of travel on a link which constitutes the route. Generalized Cost on a link(i)
may be given as
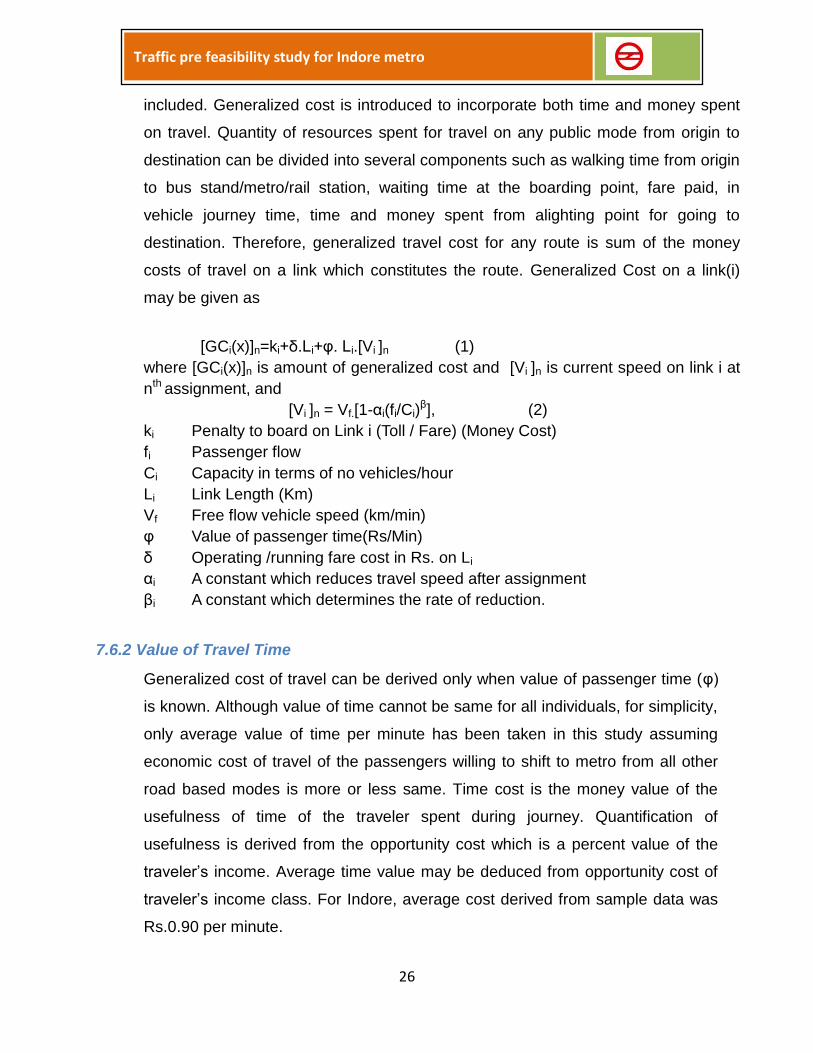
[GCi(x)]n=ki+δ.Li+φ. Li.[Vi ]n (1)
where [GCi(x)]n is amount of generalized cost and [Vi ]n is current speed on link i at
nth assignment, and
[Vi ]n = Vf.[1-αi(fi/Ci)β], (2)
ki Penalty to board on Link i (Toll / Fare) (Money Cost)
fi Passenger flow
Ci Capacity in terms of no vehicles/hour
Li Link Length (Km)
Vf Free flow vehicle speed (km/min)
φ Value of passenger time(Rs/Min)
δ Operating /running fare cost in Rs. on Li
αi A constant which reduces travel speed after assignment
βi A constant which determines the rate of reduction.
7.6.2 Value of Travel Time
Generalized cost of travel can be derived only when value of passenger time (φ)
is known. Although value of time cannot be same for all individuals, for simplicity,
only average value of time per minute has been taken in this study assuming
economic cost of travel of the passengers willing to shift to metro from all other
road based modes is more or less same. Time cost is the money value of the
usefulness of time of the traveler spent during journey. Quantification of
usefulness is derived from the opportunity cost which is a percent value of the
traveler’s income. Average time value may be deduced from opportunity cost of
traveler’s income class. For Indore, average cost derived from sample data was
Rs.0.90 per minute.
27
Traffic pre feasibility study for Indore metro
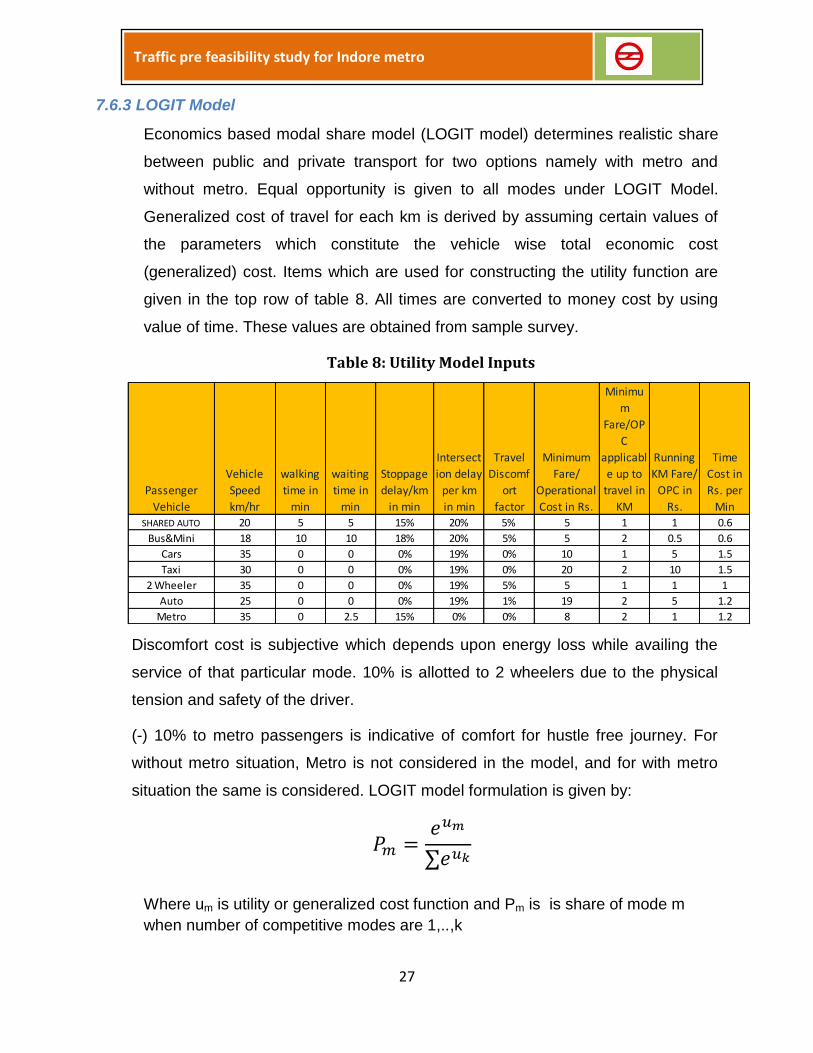
7.6.3 LOGIT Model
Economics based modal share model (LOGIT model) determines realistic share
between public and private transport for two options namely with metro and
without metro. Equal opportunity is given to all modes under LOGIT Model.
Generalized cost of travel for each km is derived by assuming certain values of
the parameters which constitute the vehicle wise total economic cost
(generalized) cost. Items which are used for constructing the utility function are
given in the top row of table 8. All times are converted to money cost by using
value of time. These values are obtained from sample survey.
Table 8: Utility Model Inputs
Discomfort cost is subjective which depends upon energy loss while availing the
service of that particular mode. 10% is allotted to 2 wheelers due to the physical
tension and safety of the driver.
(-) 10% to metro passengers is indicative of comfort for hustle free journey. For
without metro situation, Metro is not considered in the model, and for with metro
situation the same is considered. LOGIT model formulation is given by:
Where um is utility or generalized cost function and Pm is is share of mode m
when number of competitive modes are 1,..,k
Passenger
Vehicle
Vehicle
Speed
km/hr
walking
time in
min
waiting
time in
min
Stoppage
delay/km
in min
Intersect
ion delay
per km
in min
Travel
Discomf
ort
factor
Minimum
Fare/
Operational
Cost in Rs.
Minimu
m
Fare/OP
C
applicabl
e up to
travel in
KM
Running
KM Fare/
OPC in
Rs.
Time
Cost in
Rs. per
MinSHARED AUTO 20 5 5 15% 20% 5% 5 1 1 0.6
Bus&Mini 18 10 10 18% 20% 5% 5 2 0.5 0.6
Cars 35 0 0 0% 19% 0% 10 1 5 1.5
Taxi 30 0 0 0% 19% 0% 20 2 10 1.5
2 Wheeler 35 0 0 0% 19% 5% 5 1 1 1
Auto 25 0 0 0% 19% 1% 19 2 5 1.2
Metro 35 0 2.5 15% 0% 0% 8 2 1 1.2
28
Traffic pre feasibility study for Indore metro
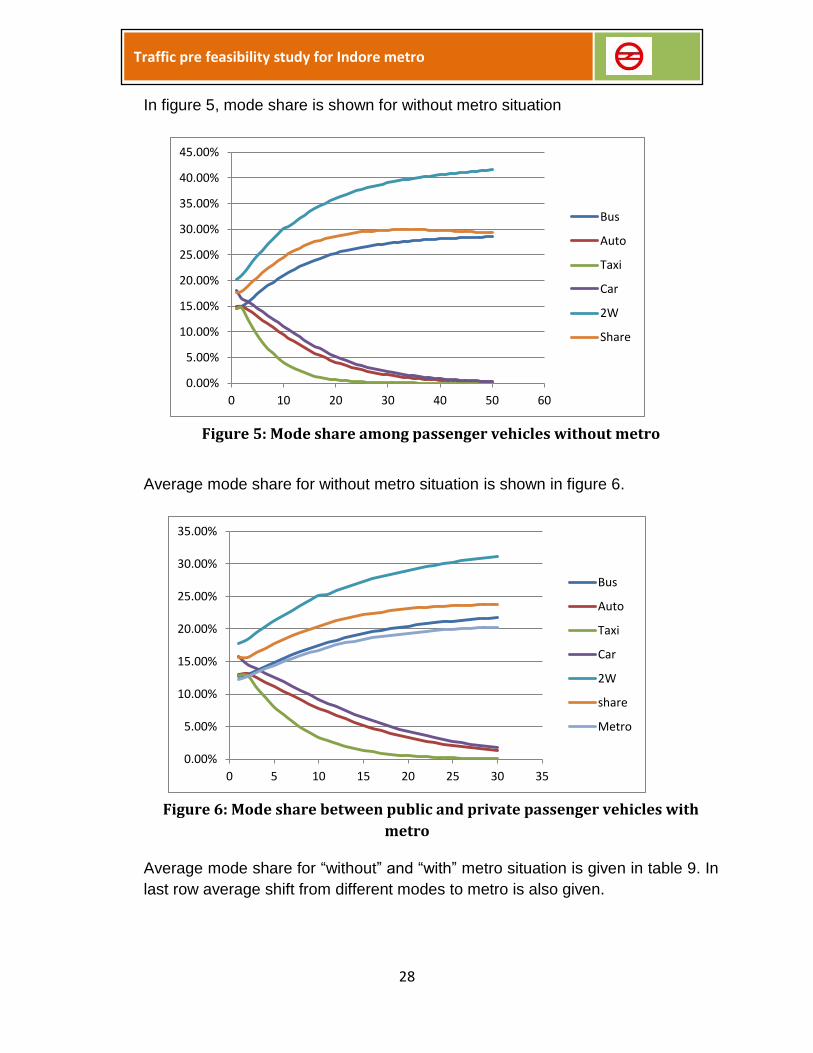
In figure 5, mode share is shown for without metro situation
Figure 5: Mode share among passenger vehicles without metro
Average mode share for without metro situation is shown in figure 6.
Figure 6: Mode share between public and private passenger vehicles with
metro
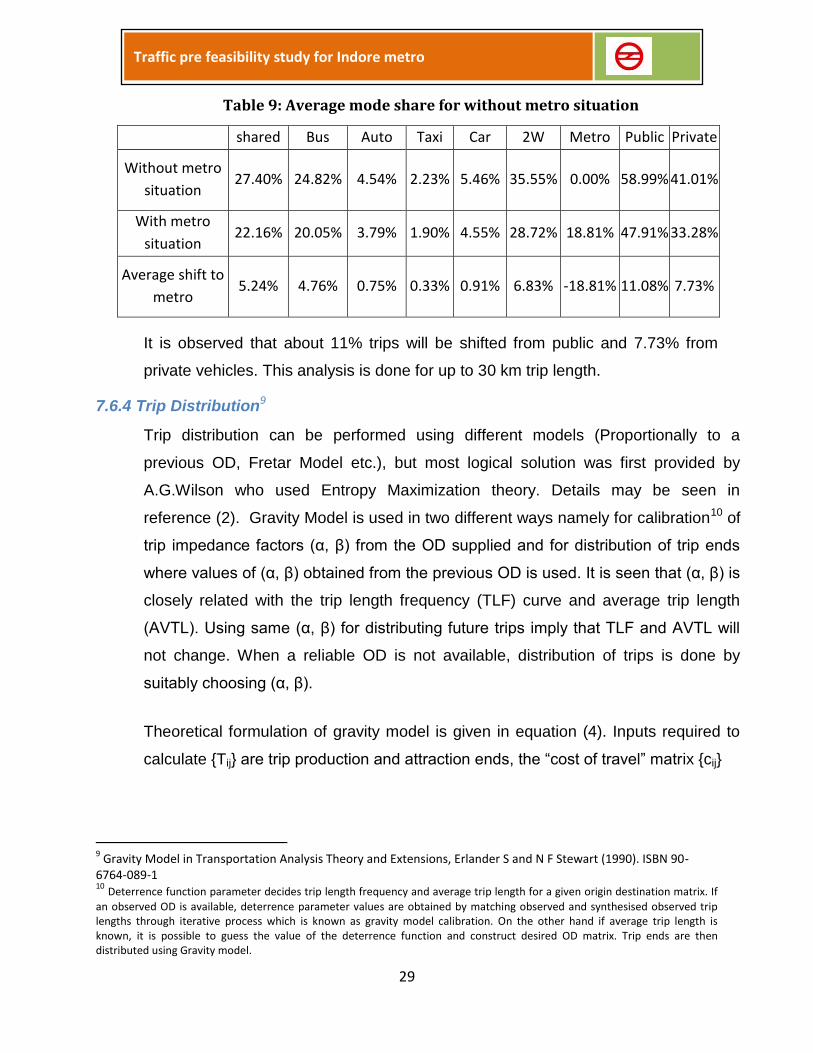
Average mode share for “without” and “with” metro situation is given in table 9. In
last row average shift from different modes to metro is also given.
0.00%
5.00%
10.00%
15.00%
20.00%
25.00%
30.00%
35.00%
40.00%
45.00%
0 10 20 30 40 50 60
Bus
Auto
Taxi
Car
2W
Share
0.00%
5.00%
10.00%
15.00%
20.00%
25.00%
30.00%
35.00%
0 5 10 15 20 25 30 35
Bus
Auto
Taxi
Car
2W
share
Metro
29
Traffic pre feasibility study for Indore metro
Table 9: Average mode share for without metro situation
shared Bus Auto Taxi Car 2W Metro Public Private
Without metro
situation 27.40% 24.82% 4.54% 2.23% 5.46% 35.55% 0.00% 58.99% 41.01%
With metro
situation 22.16% 20.05% 3.79% 1.90% 4.55% 28.72% 18.81% 47.91% 33.28%
Average shift to
metro 5.24% 4.76% 0.75% 0.33% 0.91% 6.83% -18.81% 11.08% 7.73%
It is observed that about 11% trips will be shifted from public and 7.73% from
private vehicles. This analysis is done for up to 30 km trip length.
7.6.4 Trip Distribution9
Trip distribution can be performed using different models (Proportionally to a
previous OD, Fretar Model etc.), but most logical solution was first provided by
A.G.Wilson who used Entropy Maximization theory. Details may be seen in
reference (2). Gravity Model is used in two different ways namely for calibration10 of
trip impedance factors (α, β) from the OD supplied and for distribution of trip ends
where values of (α, β) obtained from the previous OD is used. It is seen that (α, β) is
closely related with the trip length frequency (TLF) curve and average trip length
(AVTL). Using same (α, β) for distributing future trips imply that TLF and AVTL will
not change. When a reliable OD is not available, distribution of trips is done by
suitably choosing (α, β).
Theoretical formulation of gravity model is given in equation (4). Inputs required to
calculate {Tij} are trip production and attraction ends, the “cost of travel” matrix {cij}
9 Gravity Model in Transportation Analysis Theory and Extensions, Erlander S and N F Stewart (1990). ISBN 90-
6764-089-1 10
Deterrence function parameter decides trip length frequency and average trip length for a given origin destination matrix. If
an observed OD is available, deterrence parameter values are obtained by matching observed and synthesised observed trip lengths through iterative process which is known as gravity model calibration. On the other hand if average trip length is known, it is possible to guess the value of the deterrence function and construct desired OD matrix. Trip ends are then distributed using Gravity model.
30
Traffic pre feasibility study for Indore metro
and values of α and β. Using shortest path generation computer program, zone to
zone shortest distance matrix {cij} is generated. Values of α and β are set to 0.133
and 0.875 which generated average trip length between 7-8 km for Indore.
Gravity model formulation
Tij = AiPjRiCjcij-β
e-αc
ij
where Tij are trips from zone I to j, cij is cost of travel from i to j, Pj = trips produced from
zone j, Ai , = trips attracted to zone i, Ri = 1/ [∑nj=1 PjCjcij
-βe-αcij ] & Cj= 1/ [∑n
i=1 AiRicij-βe-αc
ij ] and
α, β are deterrence constants, Ri, Cj are model constants which are fixed through iterative
process
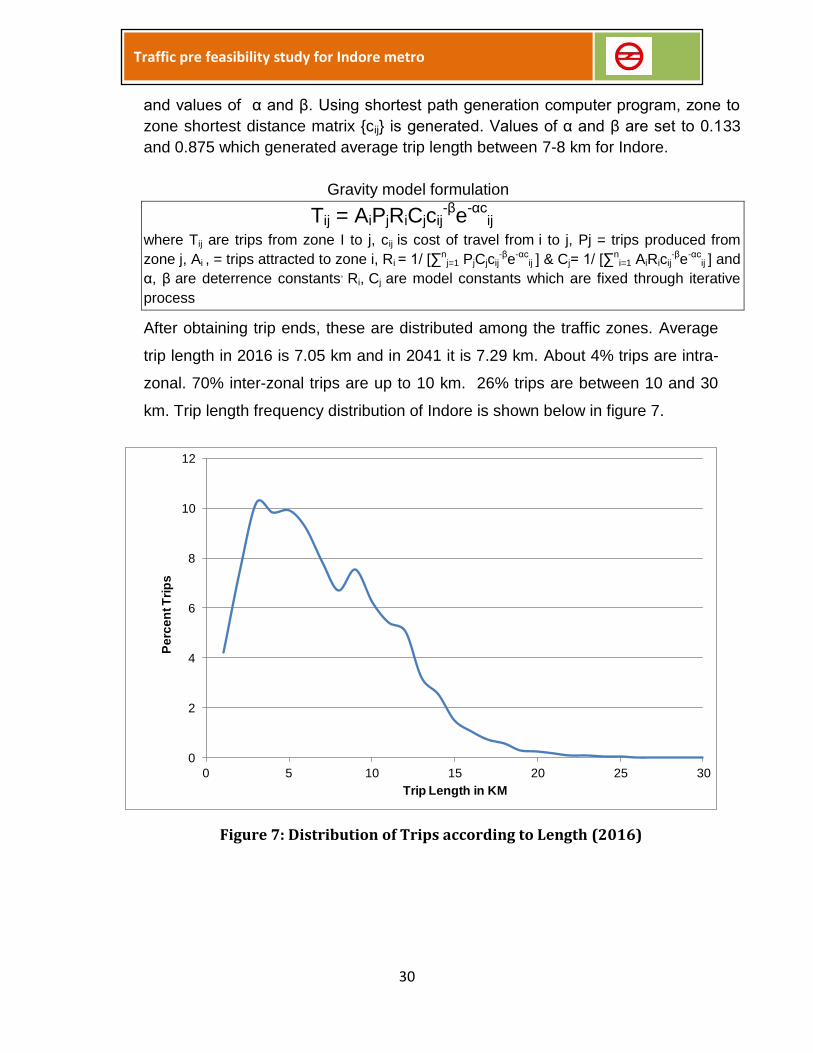
After obtaining trip ends, these are distributed among the traffic zones. Average
trip length in 2016 is 7.05 km and in 2041 it is 7.29 km. About 4% trips are intra-
zonal. 70% inter-zonal trips are up to 10 km. 26% trips are between 10 and 30
km. Trip length frequency distribution of Indore is shown below in figure 7.
Figure 7: Distribution of Trips according to Length (2016)
0
2
4
6
8
10
12
0 5 10 15 20 25 30
Pe
rce
nt T
rip
s
Trip Length in KM
31
Traffic pre feasibility study for Indore metro
7.6.5 Trip Assignment
Several traffic assignment techniques such as capacity restrained, incremental
loading, user equilibrium, dynamic assignment etc. are available. All of them are
developed by considering (or hypothetically assuming) different kind of
passenger behavior.
In Capacity restrained assignment model, trips (full OD matrix) are assigned
repeatedly on the network where modified link cost is used which is based upon
previously assigned link load. Modified cost of travel on each link may increase
or decrease due to reduction or increase of link load. After several assignment,
when link cost becomes stable, link load is averaged.
In incremental loading assignment, OD matrix is partly assigned (10%-20% each
time) and link cost is modified on the basis of the part assignment. Link loads
obtained from each part assignment are added.
User equilibrium model uses full OD on the full network by considering that trips
will be assigned on different routes connecting for each OD pair in such an
optimal manner that any other route other than the selected routes will increase
the total trip cost. The method is a mathematical optimization program and not
heuristic like capacity restrained or incremental loading.
In some traffic assignment models, transit trips are assigned on transit network
which is a part of the total network and before that non-transit mode trips are
preloaded on the network.
Any of the assignment models described above is standalone computer model in
the sense that for each assignment separate network and OD is required. For
instance when Mass Transit Trip matrix is assigned, the network consisting of
only mass transport links are considered, similarly when private trips are
assigned, private mode network is used. In many past studies, mode wise trip
matrices are developed and assigned on the respective networks. But as all the
matrices will be using the road network concurrently (partly or fully), it is difficult
to decide priority of assignment (which OD should be assigned first and which

32
Traffic pre feasibility study for Indore metro
should be the next) and current congestion level. Therefore issue to adopt a
particular assignment technique becomes complex when there are several
competitive modes are concurrently using common road network.
To overcome the difficulty, Trip matrices are assigned on the respective networks
on incremental loading basis as described. 4 ODs are assigned on 4 different
networks (20% at a time) and before next loading link costs of each link are
modified as per speed-flow model. Under speed-flow model, only roads links
(with 2,4,6 and 8 lane) are brought. Metro links have been assumed higher
capacity which is as per the frequency of service. Dummy links (road node-metro
node, rail node-road node, metro node –rail node and all links connecting zone
nodes) have unlimited capacity. Public trips use all types network while private
trips use road only network but both public and private modes share the road
only network. So roads become congested and journey costs are increased due
to delay and discomfort. So to avoid congestion and reduce delay, trips from OD
matrix use metro links as it is found less costly.
After assignment, (zone to zone) trip paths are searched to determine if it has
used the metro network on its way from origin to destination. When a trip
changes its track from a road node to metro node, it really boards at some station
on its way to destination and pays a penalty in terms of higher fare and alights at
some other station nearest to its destination. By scanning the metro network after
assignment, total boarding and alighting at each station are obtained. Link loads
are also obtained and PHPDT traffic is determined.
33
Traffic pre feasibility study for Indore metro
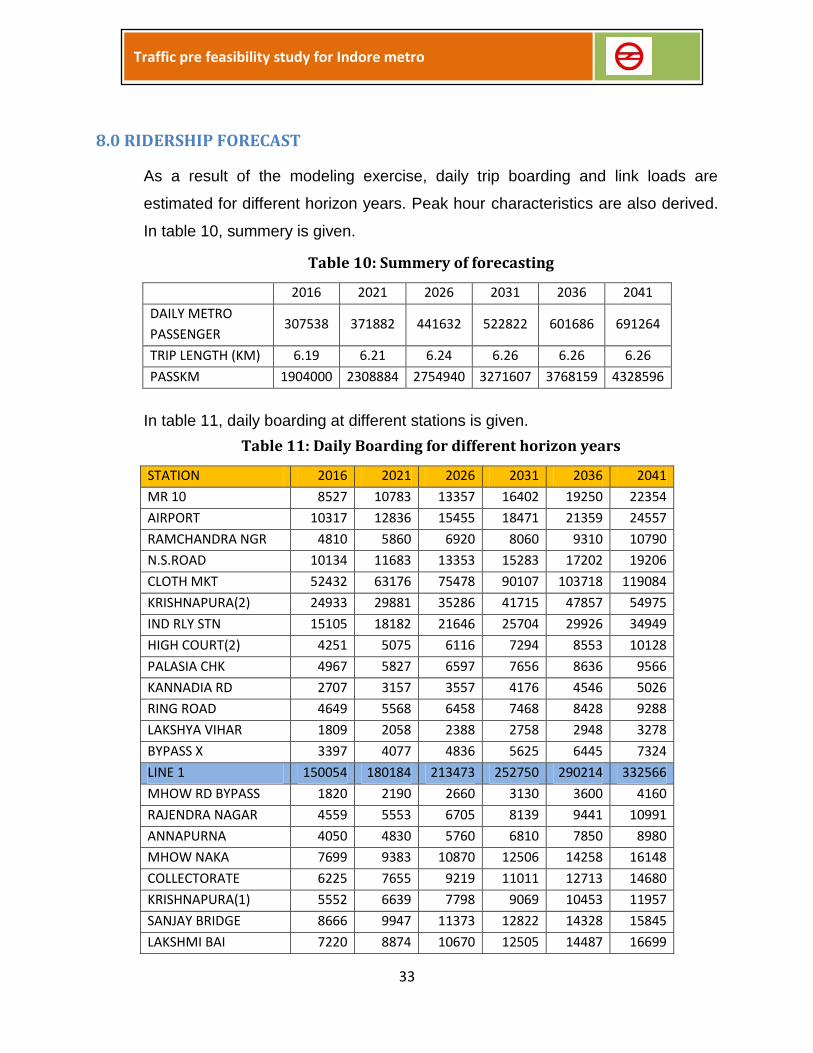
8.0 RIDERSHIP FORECAST
As a result of the modeling exercise, daily trip boarding and link loads are
estimated for different horizon years. Peak hour characteristics are also derived.
In table 10, summery is given.
Table 10: Summery of forecasting
2016 2021 2026 2031 2036 2041
DAILY METRO
PASSENGER 307538 371882 441632 522822 601686 691264
TRIP LENGTH (KM) 6.19 6.21 6.24 6.26 6.26 6.26
PASSKM 1904000 2308884 2754940 3271607 3768159 4328596
In table 11, daily boarding at different stations is given.
Table 11: Daily Boarding for different horizon years
STATION 2016 2021 2026 2031 2036 2041
MR 10 8527 10783 13357 16402 19250 22354
AIRPORT 10317 12836 15455 18471 21359 24557
RAMCHANDRA NGR 4810 5860 6920 8060 9310 10790
N.S.ROAD 10134 11683 13353 15283 17202 19206
CLOTH MKT 52432 63176 75478 90107 103718 119084
KRISHNAPURA(2) 24933 29881 35286 41715 47857 54975
IND RLY STN 15105 18182 21646 25704 29926 34949
HIGH COURT(2) 4251 5075 6116 7294 8553 10128
PALASIA CHK 4967 5827 6597 7656 8636 9566
KANNADIA RD 2707 3157 3557 4176 4546 5026
RING ROAD 4649 5568 6458 7468 8428 9288
LAKSHYA VIHAR 1809 2058 2388 2758 2948 3278
BYPASS X 3397 4077 4836 5625 6445 7324
LINE 1 150054 180184 213473 252750 290214 332566
MHOW RD BYPASS 1820 2190 2660 3130 3600 4160
RAJENDRA NAGAR 4559 5553 6705 8139 9441 10991
ANNAPURNA 4050 4830 5760 6810 7850 8980
MHOW NAKA 7699 9383 10870 12506 14258 16148
COLLECTORATE 6225 7655 9219 11011 12713 14680
KRISHNAPURA(1) 5552 6639 7798 9069 10453 11957
SANJAY BRIDGE 8666 9947 11373 12822 14328 15845
LAKSHMI BAI 7220 8874 10670 12505 14487 16699
34
Traffic pre feasibility study for Indore metro
STATION 2016 2021 2026 2031 2036 2041
SUBHASH CHWK 4340 5480 6630 7970 9332 10819
PATEL MARKET 490 580 700 860 990 1130
SUKHLIA 6590 7969 9495 11340 13099 15186
LINE 2 57211 69100 81880 96162 110551 126595
NIRANJAN PUR 7598 9245 10840 12660 14676 17127
SCHEME 74 7252 8971 10756 12881 14888 17235
VN CHAWRAHA 2557 3076 3616 4085 4661 5184
PATNIPURA 8398 10277 12397 14953 17203 19959
MALWA MIL 10019 12267 14824 17714 20436 23696
TUKO GANJ 6710 8040 9740 11820 13646 15718
HIGH COURT(1) 2879 3577 4254 5051 5868 6785
MADHUMILAN SQ 10509 12797 14965 17497 20247 23474
NAVLAKHA SQ 16985 20952 24460 28610 33149 38258
BHAWAR KUAN 3546 4395 5145 6043 7012 7991
KHANDWA RD 18063 21811 26216 31389 36067 41455
SAI BAGH 4996 5904 7126 8393 9559 10788
BYPASS(2) 2777 3307 3966 4845 5545 6474
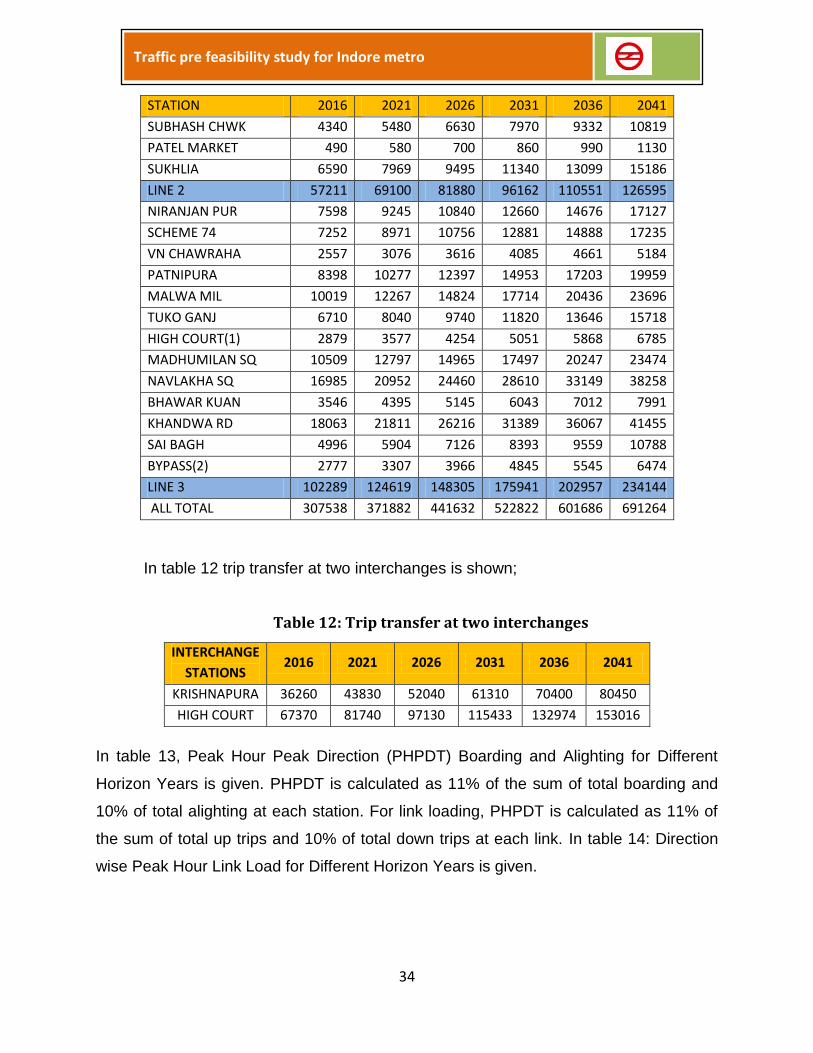
LINE 3 102289 124619 148305 175941 202957 234144
ALL TOTAL 307538 371882 441632 522822 601686 691264
In table 12 trip transfer at two interchanges is shown;
Table 12: Trip transfer at two interchanges
INTERCHANGE
STATIONS 2016 2021 2026 2031 2036 2041
KRISHNAPURA 36260 43830 52040 61310 70400 80450
HIGH COURT 67370 81740 97130 115433 132974 153016
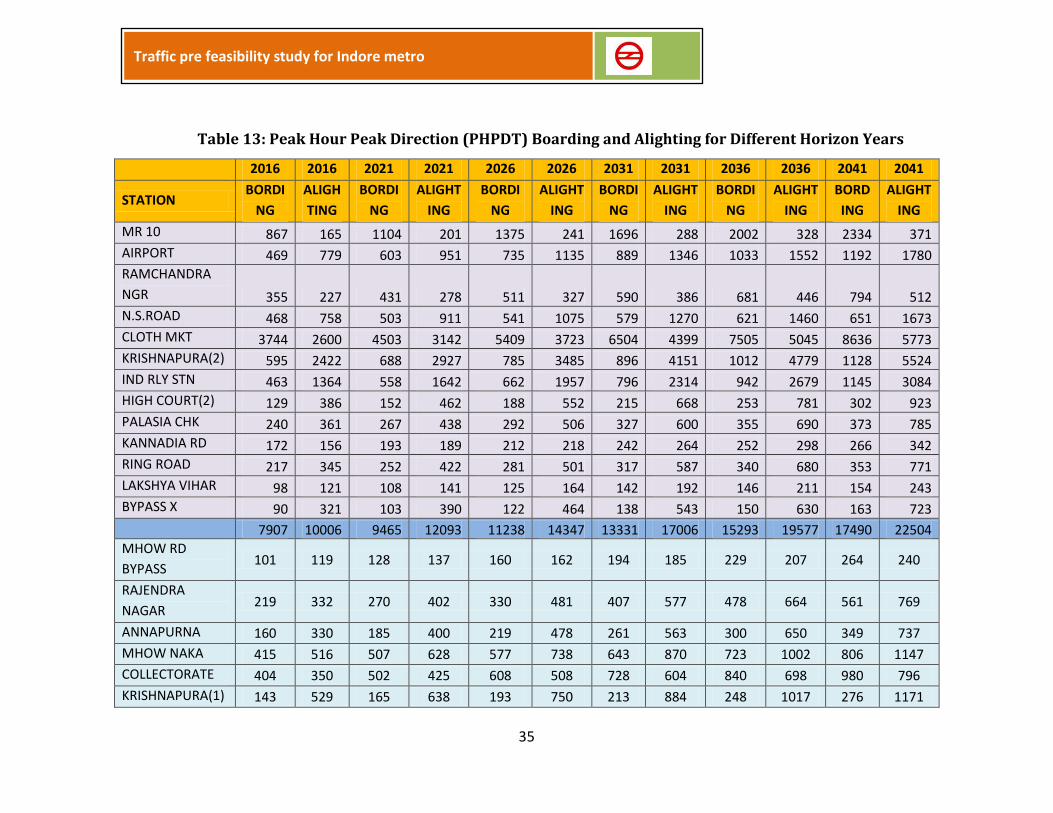
In table 13, Peak Hour Peak Direction (PHPDT) Boarding and Alighting for Different
Horizon Years is given. PHPDT is calculated as 11% of the sum of total boarding and
10% of total alighting at each station. For link loading, PHPDT is calculated as 11% of
the sum of total up trips and 10% of total down trips at each link. In table 14: Direction
wise Peak Hour Link Load for Different Horizon Years is given.
35
Traffic pre feasibility study for Indore metro
Table 13: Peak Hour Peak Direction (PHPDT) Boarding and Alighting for Different Horizon Years
2016 2016 2021 2021 2026 2026 2031 2031 2036 2036 2041 2041
STATION BORDI
NG
ALIGH
TING
BORDI
NG
ALIGHT
ING
BORDI
NG
ALIGHT
ING
BORDI
NG
ALIGHT
ING
BORDI
NG
ALIGHT
ING
BORD
ING
ALIGHT
ING
MR 10 867 165 1104 201 1375 241 1696 288 2002 328 2334 371
AIRPORT 469 779 603 951 735 1135 889 1346 1033 1552 1192 1780
RAMCHANDRA
NGR 355 227 431 278 511 327 590 386 681 446 794 512
N.S.ROAD 468 758 503 911 541 1075 579 1270 621 1460 651 1673
CLOTH MKT 3744 2600 4503 3142 5409 3723 6504 4399 7505 5045 8636 5773
KRISHNAPURA(2) 595 2422 688 2927 785 3485 896 4151 1012 4779 1128 5524
IND RLY STN 463 1364 558 1642 662 1957 796 2314 942 2679 1145 3084
HIGH COURT(2) 129 386 152 462 188 552 215 668 253 781 302 923
PALASIA CHK 240 361 267 438 292 506 327 600 355 690 373 785
KANNADIA RD 172 156 193 189 212 218 242 264 252 298 266 342
RING ROAD 217 345 252 422 281 501 317 587 340 680 353 771
LAKSHYA VIHAR 98 121 108 141 125 164 142 192 146 211 154 243
BYPASS X 90 321 103 390 122 464 138 543 150 630 163 723
7907 10006 9465 12093 11238 14347 13331 17006 15293 19577 17490 22504
MHOW RD
BYPASS 101 119 128 137 160 162 194 185 229 207 264 240
RAJENDRA
NAGAR 219 332 270 402 330 481 407 577 478 664 561 769
ANNAPURNA 160 330 185 400 219 478 261 563 300 650 349 737
MHOW NAKA 415 516 507 628 577 738 643 870 723 1002 806 1147
COLLECTORATE 404 350 502 425 608 508 728 604 840 698 980 796
KRISHNAPURA(1) 143 529 165 638 193 750 213 884 248 1017 276 1171

36
Traffic pre feasibility study for Indore metro
2016 2016 2021 2021 2026 2026 2031 2031 2036 2036 2041 2041
STATION BORDI
NG
ALIGH
TING
BORDI
NG
ALIGHT
ING
BORDI
NG
ALIGHT
ING
BORDI
NG
ALIGHT
ING
BORDI
NG
ALIGHT
ING
BORD
ING
ALIGHT
ING
SANJAY BRIDGE 500 549 547 657 592 784 637 915 681 1053 712 1205
LAKSHMI BAI 282 591 363 711 431 860 497 1016 583 1170 671 1350
SUBHASH CHWK 429 96 542 121 655 147 790 175 928 202 1079 230
PATEL MARKET 37 22 44 26 54 30 68 36 78 42 90 47
SUKHLIA 500 297 608 356 725 424 865 507 1001 584 1165 673
3192 3731 3860 4501 4545 5363 5303 6332 6089 7287 1165 1350
NIRANJAN PUR 602 317 735 384 850 461 987 544 1145 631 1342 730
SCHEME 74 571 307 713 372 853 449 1032 527 1195 606 1386 700
VN CHAWRAHA 149 161 174 198 197 241 223 271 240 324 261 367
PATNIPURA 654 363 800 444 975 525 1174 635 1358 724 1582 833
MALWA MIL 723 489 894 590 1088 706 1300 844 1513 960 1755 1112
TUKO GANJ 460 352 551 422 675 503 827 603 958 693 1110 792
HIGH COURT(1) 60 288 76 357 88 426 103 508 123 587 140 681
MADHUMILAN
SQ 767 505 937 611 1087 724 1261 856 1460 990 1697 1143
NAVLAKHA SQ 1268 787 1575 960 1826 1133 2127 1335 2464 1547 2857 1772
BHAWAR KUAN 215 214 266 266 310 313 363 368 421 428 483 484
KHANDWA RD 1386 799 1678 961 2034 1138 2454 1344 2829 1535 3261 1755
SAI BAGH 418 187 491 224 610 253 723 292 830 327 943 362
BYPASS(2) 235 101 284 117 342 138 423 163 484 187 563 221
6334 4246 7725 5149 9232 6099 10978 7221 12680 8301 3261 1772

37
Traffic pre feasibility study for Indore metro
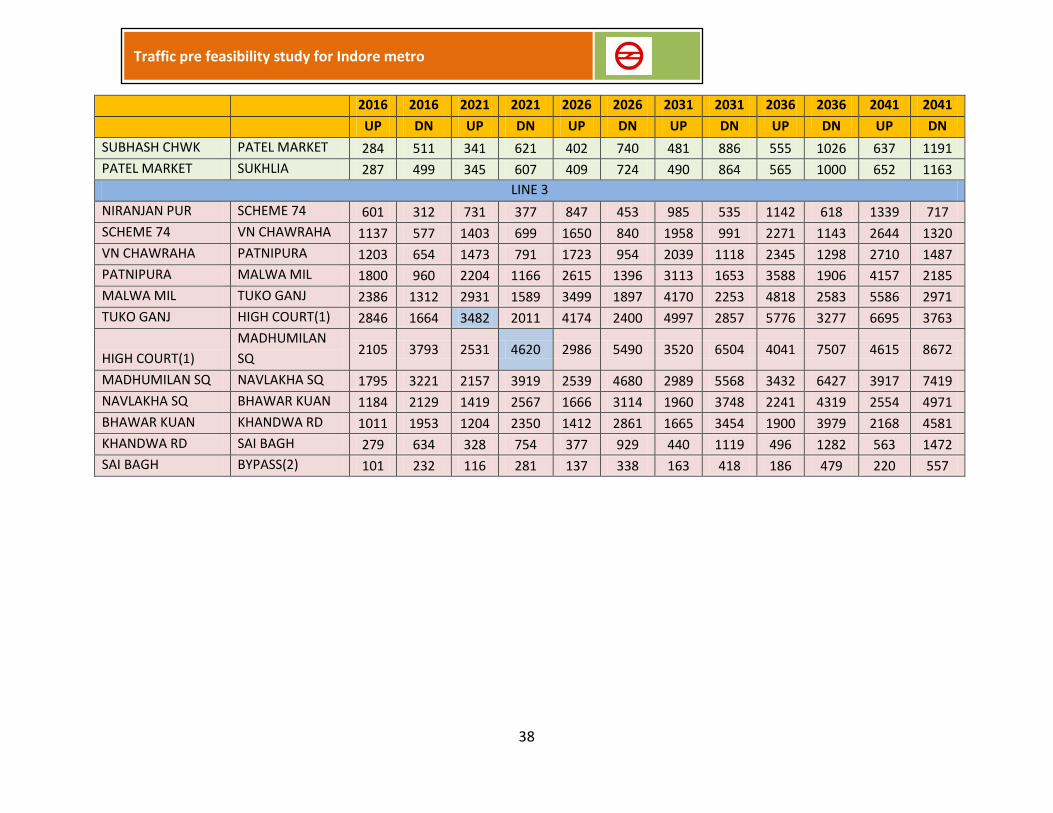
Table 14: Direction wise Peak Hour Link Load for Different Horizon Years
2016 2016 2021 2021 2026 2026 2031 2031 2036 2036 2041 2041
UP DN UP DN UP DN UP DN UP DN UP DN
LINE 1
MR 10 AIRPORT 846 163 1075 198 1337 237 1651 282 1949 320 2274 362
AIRPORT
RAMCHANDRA
NGR 1248 873 1589 1056 1964 1259 2408 1490 2826 1710 3286 1956
RAMCHANDRA NGR N.S.ROAD 1562 1059 1966 1281 2412 1523 2922 1800 3421 2070 3977 2364
N.S.ROAD CLOTH MKT 1935 1721 2353 2076 2818 2462 3342 2911 3857 3346 4418 3826
CLOTH MKT KRISHNAPURA(2) 4830 3473 5829 4191 6999 4957 8379 5843 9681 6709 11116 7662
KRISHNAPURA(2) IND RLY STN 4179 5198 5019 6272 5955 7447 7051 8821 8105 10130 9262 11660
IND RLY STN HIGH COURT(2) 3664 5565 4399 6714 5215 7974 6188 9440 7126 10839 8178 12453
HIGH COURT(2) PALASIA CHK 1241 757 1504 850 1770 953 2093 1078 2412 1152 2761 1208
PALASIA CHK KANNADIA RD 923 560 1119 635 1321 718 1556 814 1790 864 2050 910
KANNADIA RD RING ROAD 773 394 938 451 1112 515 1303 583 1502 623 1719 655
RING ROAD LAKSHYA VIHAR 437 185 526 208 621 244 727 277 833 293 958 313
LAKSHYA VIHAR BYPASS X 318 90 387 103 460 121 538 138 625 150 718 162
LINE 2
MHOW RD BYPASS
RAJENDRA
NAGAR 101 119 128 137 160 162 194 185 229 207 264 240
RAJENDRA NAGAR ANNAPURNA 288 436 358 522 440 622 542 739 631 843 726 973
ANNAPURNA MHOW NAKA 439 757 533 911 647 1088 787 1286 914 1476 1057 1692
MHOW NAKA COLLECTORATE 822 1241 1002 1501 1178 1780 1378 2103 1578 2418 1795 2772
COLLECTORATE KRISHNAPURA(1) 1185 1549 1456 1878 1725 2228 2031 2633 2338 3035 2678 3470
KRISHNAPURA(1) SANJAY BRIDGE 1351 1553 1626 1870 1950 2175 2297 2520 2643 2881 3035 3266
SANJAY BRIDGE LAKSHMI BAI 893 1143 1076 1430 1292 1709 1525 2026 1762 2372 2023 2748
LAKSHMI BAI SUBHASH CHWK 361 920 437 1139 520 1366 618 1638 715 1912 815 2218
38
Traffic pre feasibility study for Indore metro
2016 2016 2021 2021 2026 2026 2031 2031 2036 2036 2041 2041
UP DN UP DN UP DN UP DN UP DN UP DN
SUBHASH CHWK PATEL MARKET 284 511 341 621 402 740 481 886 555 1026 637 1191
PATEL MARKET SUKHLIA 287 499 345 607 409 724 490 864 565 1000 652 1163
LINE 3
NIRANJAN PUR SCHEME 74 601 312 731 377 847 453 985 535 1142 618 1339 717
SCHEME 74 VN CHAWRAHA 1137 577 1403 699 1650 840 1958 991 2271 1143 2644 1320
VN CHAWRAHA PATNIPURA 1203 654 1473 791 1723 954 2039 1118 2345 1298 2710 1487
PATNIPURA MALWA MIL 1800 960 2204 1166 2615 1396 3113 1653 3588 1906 4157 2185
MALWA MIL TUKO GANJ 2386 1312 2931 1589 3499 1897 4170 2253 4818 2583 5586 2971
TUKO GANJ HIGH COURT(1) 2846 1664 3482 2011 4174 2400 4997 2857 5776 3277 6695 3763
HIGH COURT(1)
MADHUMILAN
SQ 2105 3793 2531 4620 2986 5490 3520 6504 4041 7507 4615 8672
MADHUMILAN SQ NAVLAKHA SQ 1795 3221 2157 3919 2539 4680 2989 5568 3432 6427 3917 7419
NAVLAKHA SQ BHAWAR KUAN 1184 2129 1419 2567 1666 3114 1960 3748 2241 4319 2554 4971
BHAWAR KUAN KHANDWA RD 1011 1953 1204 2350 1412 2861 1665 3454 1900 3979 2168 4581
KHANDWA RD SAI BAGH 279 634 328 754 377 929 440 1119 496 1282 563 1472
SAI BAGH BYPASS(2) 101 232 116 281 137 338 163 418 186 479 220 557
39
Traffic pre feasibility study for Indore metro
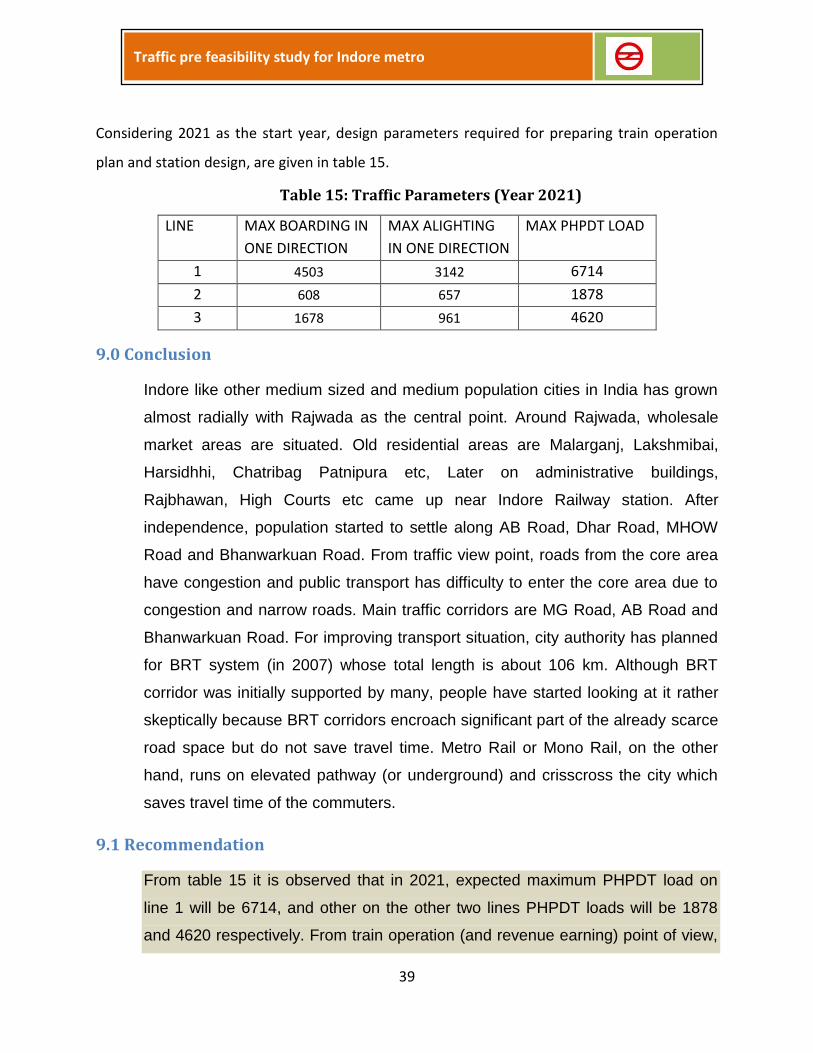
Considering 2021 as the start year, design parameters required for preparing train operation
plan and station design, are given in table 15.
Table 15: Traffic Parameters (Year 2021)
LINE MAX BOARDING IN
ONE DIRECTION
MAX ALIGHTING
IN ONE DIRECTION
MAX PHPDT LOAD
1 4503 3142 6714
2 608 657 1878
3 1678 961 4620
9.0 Conclusion
Indore like other medium sized and medium population cities in India has grown
almost radially with Rajwada as the central point. Around Rajwada, wholesale
market areas are situated. Old residential areas are Malarganj, Lakshmibai,
Harsidhhi, Chatribag Patnipura etc, Later on administrative buildings,
Rajbhawan, High Courts etc came up near Indore Railway station. After
independence, population started to settle along AB Road, Dhar Road, MHOW
Road and Bhanwarkuan Road. From traffic view point, roads from the core area
have congestion and public transport has difficulty to enter the core area due to
congestion and narrow roads. Main traffic corridors are MG Road, AB Road and
Bhanwarkuan Road. For improving transport situation, city authority has planned
for BRT system (in 2007) whose total length is about 106 km. Although BRT
corridor was initially supported by many, people have started looking at it rather
skeptically because BRT corridors encroach significant part of the already scarce
road space but do not save travel time. Metro Rail or Mono Rail, on the other
hand, runs on elevated pathway (or underground) and crisscross the city which
saves travel time of the commuters.
9.1 Recommendation
From table 15 it is observed that in 2021, expected maximum PHPDT load on
line 1 will be 6714, and other on the other two lines PHPDT loads will be 1878
and 4620 respectively. From train operation (and revenue earning) point of view,
40
Traffic pre feasibility study for Indore metro
none of these lines may strongly be recommended for full metro rail.
Nevertheless, as a borderline case, line 1 may be considered for mono-rail from
2021 and line 3 also for mono rail from 2026 when expected PHPDT will be 5490
10.0 Transport Oriented Development
Any mass transport system may be successful if it becomes sustainable in the
sense that it should serve the city for a reasonably long period (30-40 years) by
providing a dependable service to the citizen.
Suitable Transport System is planned and provided when demand arise; on the
other hand the same system may help to develop the city in an organised
manner by distributing passenger flow in different directions of the city.
In particular, Metro Rail Transport System in Indore warrants that future
residential and employment zones are required to be developed along the
proposed metro lines. Areas near to the stations such as MR10, AIRPORT,
Lakshya Vihar, Bypass Crossing (on line 1); Sukhlia, MHOW Road Bypass,
Rajendra Nagar (on line 2); Niranjanpur, Khandwa Road, SAI Bagh and
Khandwa Road Bypass Crossing (on line 3) may be developed as Residential
areas. These stations are located at both ends of the proposed lines. Journey
time from these areas will be below 30 minutes to CBD areas.
Haphazard construction of workplaces (multi story buildings in particular) in CBD
should not be encouraged.
Also wherever possible (space availability), metro stations may be designed as
commercial and business centers so that peoples use these metro stations for
shopping and entertainment purpose.
Traffic pre feasibility study for Indore metro (Appendix)
DATA REPORT
TRAFFIC VOLUME COUNT SURVEY TABLES , ZONE WISE PROJECTED POPULATION, TRIP PRODUCTION FROM TRAFFIC ZONES (ONLY UP TRIPS),TRIP ATTRACTION TO TRAFFIC ZONES (ONLY UP TRIPS)
2
Traffic pre feasibility study for Indore metro (Appendix)
APPENDIX
TRAFFIC VOLUME COUNT SURVEY TABLE 1A
TABLE 1B
TABLE 1C
LOCATION AIRPORT ROAD NEAR MANPASAND COLONY DATE 7-Jul-11
DIRECTION AIRPORT TO RAM CHANDRA NAGAR
TIME CAR MINI BUS BUS LCV TRUCKSMULTI AXLE
TRUKS2WS AUTO P CYCLE MAGIC TOTAL PCU
total
PCU
PEAK
7:00-8:00 145 23 27 7 6 0 285 21 58 27 599 489 2.9%
8:00-9:00 313 23 27 109 1 0 543 36 107 33 1192 1012 6.0%
9:00-10:00 364 25 21 135 2 0 669 65 139 42 1462 1217 7.3%
10:00-11:00 353 25 8 205 5 0 620 45 319 37 1617 1333 7.9%
11:00-12:00 318 29 8 139 1 0 591 47 256 47 1436 1136 6.8%
12:00-13:00 343 16 7 117 2 0 616 42 231 27 1401 1078 6.4%
13:00-14:00 302 21 12 140 2 0 791 25 140 37 1470 1153 6.9%
14:00-15:00 327 17 30 103 4 0 859 44 109 45 1538 1200 7.1%
15:00-16:00 336 28 23 143 6 0 793 65 135 51 1580 1297 7.7%
16:00-17:00 364 30 19 138 0 0 678 65 152 29 1475 1216 7.2%
17:00-18:00 437 27 24 109 1 0 715 55 106 29 1503 1235 7.4%
18:00-19:00 580 20 18 176 9 0 620 64 135 27 1649 1480 8.8%
19:00-20:00 562 19 20 93 7 0 610 84 91 33 1519 1300 7.7%
20:00-21:00 343 15 2 83 0 0 564 52 65 20 1144 912 5.4%
21:00-22:00 185 11 2 84 2 0 198 19 37 9 547 520 3.1%
22:00-23:00 95 0 0 27 3 0 91 6 0 0 222 210 1.2%
TOTAL 5367 329 248 1808 51 0 9243 735 2080 493 20354 16785 100.0%
PEAK 8.8%
LOCATION AIRPORT ROAD NEAR MANPASAND COLONY DATE 7-Jul-11
DIRECTION RAM CHANDRA NAGAR TO AIRPORT
TIME CAR MINI BUS BUS LCV TRUCKSMULTI
AXLE
TRUKS
2WS AUTO P CYCLE MAGIC TOTAL PCU
total
PCU
PEAK
7:00-8:00 155 16 15 18 0 0 186 13 48 18 469 392 2.2%
8:00-9:00 248 25 18 173 0 0 276 29 136 30 935 918 5.2%
9:00-10:00 558 23 11 133 17 0 726 30 194 30 1722 1424 8.0%
10:00-11:00 638 13 19 95 9 0 842 57 149 28 1850 1477 8.3%
11:00-12:00 458 20 13 149 11 0 775 62 159 45 1692 1398 7.9%
12:00-13:00 273 19 18 173 10 0 668 37 129 32 1359 1168 6.6%
13:00-14:00 285 21 15 118 12 0 972 43 134 35 1635 1234 6.9%
14:00-15:00 255 27 15 210 17 0 762 35 171 40 1532 1316 7.4%
15:00-16:00 290 23 21 180 17 0 594 59 128 32 1344 1218 6.9%
16:00-17:00 382 23 24 142 16 0 616 66 150 35 1454 1267 7.1%
17:00-18:00 460 24 31 170 23 0 548 48 148 31 1483 1384 7.8%
18:00-19:00 473 15 23 235 14 0 595 35 125 32 1547 1471 8.3%
19:00-20:00 416 27 27 162 13 0 537 31 90 27 1330 1243 7.0%
20:00-21:00 345 15 21 88 9 0 632 55 111 20 1296 1051 5.9%
21:00-22:00 225 14 8 35 8 0 290 37 78 20 715 588 3.3%
22:00-23:00 80 0 0 14 2 0 166 13 0 0 275 210 1.2%
TOTAL 5541 305 279 2095 178 0 9185 650 1950 455 20638 17761 100.0%
8.3%
passenger count
DIRECTION AIRPORT TO RAM CHANDRA NAGAR
TIME CAR 2WS MINI BUS BUS AUTO P CYCLE MAGIC TOTAL PEAK
7:00-8:00 498 339 273 525 33 58 273 1999 4.08%
8:00-9:00 1177 736 447 765 70 119 339 3652 7.46%
9:00-10:00 1129 997 516 613 100 139 326 3818 7.80%
10:00-11:00 837 884 518 255 65 370 325 3253 6.64%
11:00-12:00 832 850 634 291 56 256 452 3371 6.88%
12:00-13:00 699 740 311 229 60 244 228 2510 5.12%
13:00-14:00 885 1175 431 383 44 156 381 3455 7.05%
14:00-15:00 672 1342 394 1144 56 109 462 4179 8.53%
15:00-16:00 702 1187 618 721 77 135 351 3792 7.74%
16:00-17:00 762 988 750 720 89 152 287 3748 7.65%
17:00-18:00 880 1071 686 653 154 106 266 3815 7.79%
18:00-19:00 1178 1062 463 578 103 135 295 3813 7.79%
19:00-20:00 1397 959 428 650 131 91 337 3993 8.15%
20:00-21:00 704 939 272 46 75 65 190 2291 4.68%
21:00-22:00 379 294 165 35 25 37 68 1002 2.05%
22:00-23:00 186 97 0 0 8 0 0 291 0.59%
12915 13659 6905 7608 1144 2172 4579 48982 100.00%
3
Traffic pre feasibility study for Indore metro (Appendix)
TABLE 1D
TABLE 2A
TABLE 2B
passenger count
DIRECTION RAM CHANDRA NAGAR TO AIRPORT
TIME CAR 2WS MINI BUS BUS AUTO P CYCLE MAGIC TOTAL PEAK
7:00-8:00 521 201 280 311 23 51 135 1522 3.04%
8:00-9:00 813 401 604 555 61 162 274 2869 5.74%
9:00-10:00 1632 1207 518 358 36 180 309 4238 8.48%
10:00-11:00 1857 1293 271 713 114 149 264 4661 9.32%
11:00-12:00 1214 1249 386 423 141 159 430 4001 8.00%
12:00-13:00 714 976 356 630 63 129 261 3130 6.26%
13:00-14:00 600 1377 357 525 79 134 284 3356 6.71%
14:00-15:00 532 1154 506 422 60 151 411 3236 6.47%
15:00-16:00 621 947 476 543 92 148 267 3093 6.19%
16:00-17:00 768 997 542 840 111 167 395 3820 7.64%
17:00-18:00 1058 924 520 853 78 148 323 3903 7.81%
18:00-19:00 988 852 360 897 59 125 283 3564 7.13%
19:00-20:00 882 816 621 972 51 90 280 3712 7.42%
20:00-21:00 714 928 300 630 80 111 172 2935 5.87%
21:00-22:00 455 385 245 200 52 78 150 1564 3.13%
22:00-23:00 167 211 0 0 20 0 0 398 0.80%
13537 13916 6342 8869 1120 1981 4238 50003 100.00%
DATE
TIME CAR MINI BUS BUS LCV TRUCKSMULTI AXLE
TRUKS2WS AUTO P CYCLE MAGIC TOTAL
pcu total PEAK
7:00-8:00 31 6 6 17 4 0 123 31 17 36 271 235 3.1%
8:00-9:00 73 9 6 21 1 0 186 44 36 30 406 325 4.3%
9:00-10:00 67 11 7 31 4 0 330 46 72 45 613 455 6.0%
10:00-11:00 62 6 5 19 1 0 409 26 91 21 640 406 5.4%
11:00-12:00 63 6 5 24 1 0 540 24 145 43 851 520 6.9%
12:00-13:00 51 7 6 34 2 0 494 19 133 57 803 517 6.9%
13:00-14:00 55 8 5 37 1 0 354 15 127 40 642 430 5.7%
14:00-15:00 56 8 9 37 3 0 303 20 119 28 583 412 5.5%
15:00-16:00 52 7 5 30 2 0 524 29 112 31 792 500 6.6%
16:00-17:00 130 10 8 33 4 0 539 30 126 27 907 611 8.1%
17:00-18:00 161 11 4 42 4 0 651 30 102 24 1029 697 9.2%
18:00-19:00 120 13 8 27 2 0 643 53 104 40 1010 668 8.9%
19:00-20:00 79 14 2 31 1 0 750 88 115 29 1109 700 9.3%
20:00-21:00 48 7 4 28 3 0 716 56 93 28 983 606 8.0%
21:00-22:00 27 1 3 11 3 0 430 46 32 14 567 353 4.7%
22:00-23:00 10 0 0 2 2 0 132 11 0 0 157 97 1.3%
TOTAL 1085 124 83 424 38 0 7124 568 1424 493 11363 7533 100.0%
9.3%
ANNAPURNA MANDIRLOCATION
DIRECTION
8-Jul-11
KET TO MHOW NAKA
DATE
TIME CAR MINI BUS BUS LCV TRUCKSMULTI AXLE TRUKS2WS AUTO P CYCLE MAGIC TOTALpcu total PEAK
7:00-8:00 37 6 5 17 1 0 136 43 98 26 369 265 3.6%
8:00-9:00 96 9 6 15 1 0 250 19 127 29 552 372 5.0%
9:00-10:00 121 15 7 17 2 0 560 19 105 23 869 558 7.5%
10:00-11:00 106 13 7 49 3 0 565 36 118 30 927 637 8.6%
11:00-12:00 115 11 6 47 1 0 652 64 104 29 1029 697 9.4%
12:00-13:00 76 7 4 36 1 0 661 59 92 32 968 623 8.4%
13:00-14:00 73 8 3 28 3 0 493 50 66 29 753 505 6.8%
14:00-15:00 66 8 4 16 2 0 412 59 65 29 661 441 5.9%
15:00-16:00 69 7 6 15 2 0 494 61 53 29 736 485 6.5%
16:00-17:00 75 5 3 16 4 0 493 50 118 29 793 498 6.7%
17:00-18:00 83 7 5 15 1 0 535 48 96 24 814 510 6.9%
18:00-19:00 79 4 6 15 1 0 520 46 99 34 804 506 6.8%
19:00-20:00 82 5 6 22 3 0 469 44 125 26 782 503 6.8%
20:00-21:00 48 7 5 54 1 0 361 42 98 31 647 468 6.3%
21:00-22:00 32 1 5 25 2 0 197 19 35 24 340 255 3.4%
22:00-23:00 13 0 0 8 0 0 90 23 0 0 134 97 1.3%
TOTAL 1171 113 78 395 28 0 6888 682 1399 424 11178 7421 100.0%
9.4%
LOCATION ANNAPURNA MANDIR
DIRECTION
8-Jul-11
MHOW NAKA TO KET

4
Traffic pre feasibility study for Indore metro (Appendix)
TABLE 2C
TABLE 2D
TABLE 3A
passenger count
DIRECTION KET TO MHOW NAKA
TIME CAR 2WS MINI BUS BUS AUTO P CYCLE MAGIC TOTAL PEAK
7:00-8:00 43 147 75 120 47 17 180 629 2.88%
8:00-9:00 119 249 120 135 72 39 165 899 4.12%
9:00-10:00 140 477 151 152 89 75 270 1354 6.21%
10:00-11:00 133 620 60 100 55 97 135 1201 5.51%
11:00-12:00 117 705 75 113 66 145 323 1543 7.08%
12:00-13:00 87 618 82 120 35 133 465 1539 7.06%
13:00-14:00 101 429 110 113 27 127 329 1235 5.66%
14:00-15:00 100 423 93 180 26 125 233 1180 5.41%
15:00-16:00 101 738 93 100 35 112 233 1412 6.48%
16:00-17:00 239 828 113 173 51 129 195 1728 7.92%
17:00-18:00 276 927 138 90 48 102 165 1746 8.01%
18:00-19:00 279 1019 179 160 103 107 323 2169 9.95%
19:00-20:00 173 1275 210 40 130 121 209 2159 9.90%
20:00-21:00 93 1199 88 80 103 93 233 1888 8.66%
21:00-22:00 51 610 11 45 71 32 88 907 4.16%
22:00-23:00 20 180 0 0 17 0 0 217 0.99%
2072 10443 1597 1720 974 1454 3545 21806 100.00%
passenger count
DIRECTION MHOW NAKA TO KET
TIME CAR 2WS MINI BUS BUS AUTO P CYCLE MAGIC TOTAL PEAK
7:00-8:00 63 190 75 100 60 101 144 734 3.51%
8:00-9:00 207 364 135 135 35 130 193 1200 5.74%
9:00-10:00 251 828 180 163 33 105 164 1724 8.25%
10:00-11:00 197 881 146 128 66 127 225 1770 8.47%
11:00-12:00 221 969 138 120 119 104 218 1888 9.03%
12:00-13:00 137 896 88 90 84 92 247 1633 7.81%
13:00-14:00 103 700 107 60 78 66 232 1347 6.44%
14:00-15:00 99 580 93 90 115 71 218 1266 6.06%
15:00-16:00 126 704 79 135 107 59 232 1441 6.89%
16:00-17:00 135 686 63 60 78 118 224 1364 6.53%
17:00-18:00 157 772 88 100 87 96 195 1495 7.15%
18:00-19:00 167 804 50 130 77 102 298 1627 7.78%
19:00-20:00 185 690 63 120 69 128 217 1472 7.04%
20:00-21:00 87 514 88 100 69 98 202 1157 5.54%
21:00-22:00 55 266 11 88 30 35 135 619 2.96%
22:00-23:00 21 117 0 0 29 0 0 167 0.80%
2211 9962 1401 1619 1135 1432 3143 20904 100.00%
DATE
TIME CAR MINI BUS BUS LCV TRUCKSMULTI AXLE
TRUKS2WS AUTO P CYCLE MAGIC TOTAL
pcu total PEAK
7:00-8:00 34 30 9 54 36 7 417 56 183 36 862 703 4.6%
8:00-9:00 51 34 23 70 24 2 511 50 334 21 1120 815 5.3%
9:00-10:00 60 42 23 116 46 8 788 80 563 32 1758 1270 8.2%
10:00-11:00 87 62 32 109 30 0 960 116 591 21 2008 1380 8.9%
11:00-12:00 92 66 30 89 63 6 902 112 459 29 1848 1397 9.1%
12:00-13:00 125 30 23 102 31 0 820 132 215 28 1506 1165 7.5%
13:00-14:00 141 39 20 143 30 6 662 65 120 22 1248 1104 7.2%
14:00-15:00 72 23 19 107 23 3 550 60 143 28 1028 858 5.6%
15:00-16:00 107 25 30 91 22 3 479 50 122 29 958 837 5.4%
16:00-17:00 144 61 49 90 55 7 467 66 184 27 1150 1115 7.2%
17:00-18:00 131 25 23 126 40 5 542 61 141 24 1118 1018 6.6%
18:00-19:00 158 37 10 103 43 4 759 117 160 27 1418 1164 7.5%
19:00-20:00 175 32 11 105 26 0 765 124 136 22 1396 1112 7.2%
20:00-21:00 119 36 13 114 36 4 541 76 83 24 1046 953 6.2%
21:00-22:00 79 3 1 24 13 4 251 39 24 14 452 373 2.4%
22:00-23:00 29 0 0 13 16 3 86 16 0 0 163 173 1.1%
TOTAL 1604 545 316 1456 534 62 9500 1220 3458 384 19079 15438 100.0%
PEAK 9.1%
BAN GANGA LOCATION
DIRECTION
7-Jul-11
BAN GANGA TO GANESH DHAM COLONY
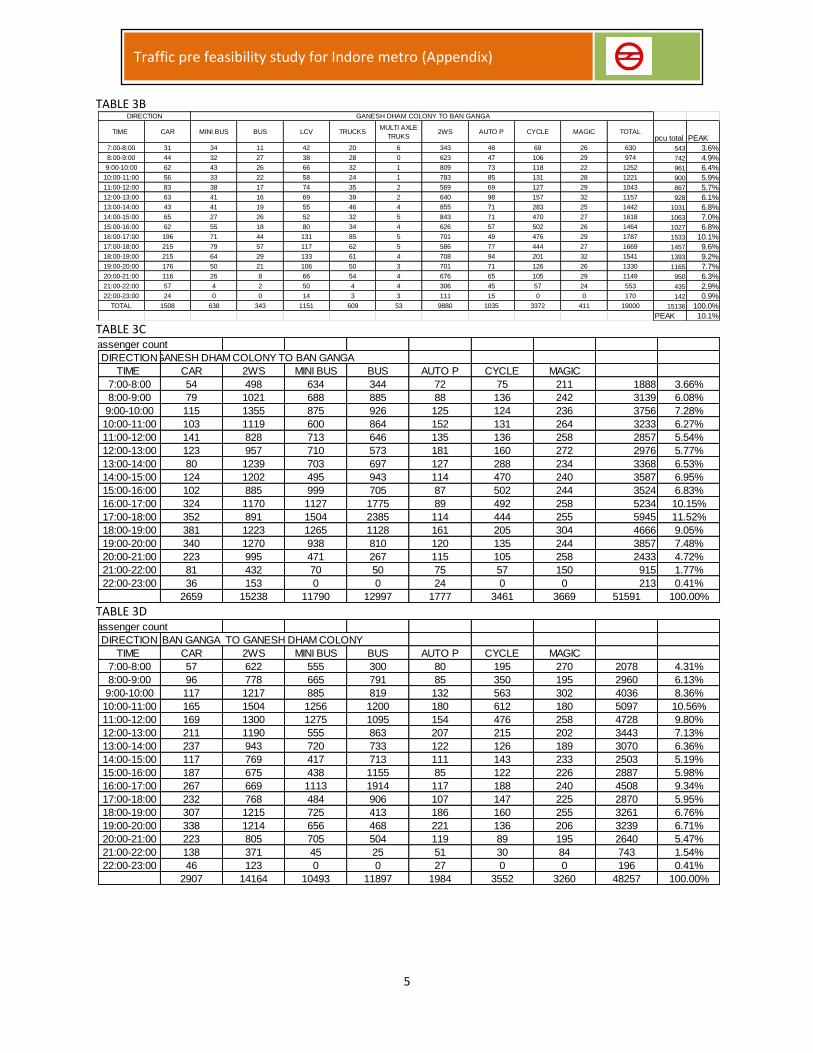
5
Traffic pre feasibility study for Indore metro (Appendix)
TABLE 3B
TABLE 3C
TABLE 3D
TIME CAR MINI BUS BUS LCV TRUCKSMULTI AXLE
TRUKS2WS AUTO P CYCLE MAGIC TOTAL
pcu total PEAK
7:00-8:00 31 34 11 42 20 6 343 48 69 26 630 543 3.6%
8:00-9:00 44 32 27 38 28 0 623 47 106 29 974 742 4.9%
9:00-10:00 62 43 26 66 32 1 809 73 118 22 1252 961 6.4%
10:00-11:00 56 33 22 58 24 1 783 85 131 28 1221 900 5.9%
11:00-12:00 83 38 17 74 35 2 569 69 127 29 1043 867 5.7%
12:00-13:00 63 41 16 69 39 2 640 98 157 32 1157 928 6.1%
13:00-14:00 43 41 19 55 46 4 855 71 283 25 1442 1031 6.8%
14:00-15:00 65 27 26 52 32 5 843 71 470 27 1618 1063 7.0%
15:00-16:00 62 55 18 80 34 4 626 57 502 26 1464 1027 6.8%
16:00-17:00 196 71 44 131 85 5 701 49 476 29 1787 1533 10.1%
17:00-18:00 215 79 57 117 62 5 586 77 444 27 1669 1457 9.6%
18:00-19:00 215 64 29 133 61 4 708 94 201 32 1541 1393 9.2%
19:00-20:00 176 50 21 106 50 3 701 71 126 26 1330 1165 7.7%
20:00-21:00 116 26 8 66 54 4 676 65 105 29 1149 950 6.3%
21:00-22:00 57 4 2 50 4 4 306 45 57 24 553 435 2.9%
22:00-23:00 24 0 0 14 3 3 111 15 0 0 170 142 0.9%
TOTAL 1508 638 343 1151 609 53 9880 1035 3372 411 19000 15136 100.0%
PEAK 10.1%
DIRECTION GANESH DHAM COLONY TO BAN GANGA
passenger count
DIRECTION GANESH DHAM COLONY TO BAN GANGA
TIME CAR 2WS MINI BUS BUS AUTO P CYCLE MAGIC
7:00-8:00 54 498 634 344 72 75 211 1888 3.66%
8:00-9:00 79 1021 688 885 88 136 242 3139 6.08%
9:00-10:00 115 1355 875 926 125 124 236 3756 7.28%
10:00-11:00 103 1119 600 864 152 131 264 3233 6.27%
11:00-12:00 141 828 713 646 135 136 258 2857 5.54%
12:00-13:00 123 957 710 573 181 160 272 2976 5.77%
13:00-14:00 80 1239 703 697 127 288 234 3368 6.53%
14:00-15:00 124 1202 495 943 114 470 240 3587 6.95%
15:00-16:00 102 885 999 705 87 502 244 3524 6.83%
16:00-17:00 324 1170 1127 1775 89 492 258 5234 10.15%
17:00-18:00 352 891 1504 2385 114 444 255 5945 11.52%
18:00-19:00 381 1223 1265 1128 161 205 304 4666 9.05%
19:00-20:00 340 1270 938 810 120 135 244 3857 7.48%
20:00-21:00 223 995 471 267 115 105 258 2433 4.72%
21:00-22:00 81 432 70 50 75 57 150 915 1.77%
22:00-23:00 36 153 0 0 24 0 0 213 0.41%
2659 15238 11790 12997 1777 3461 3669 51591 100.00%
passenger count
DIRECTION BAN GANGA TO GANESH DHAM COLONY
TIME CAR 2WS MINI BUS BUS AUTO P CYCLE MAGIC
7:00-8:00 57 622 555 300 80 195 270 2078 4.31%
8:00-9:00 96 778 665 791 85 350 195 2960 6.13%
9:00-10:00 117 1217 885 819 132 563 302 4036 8.36%
10:00-11:00 165 1504 1256 1200 180 612 180 5097 10.56%
11:00-12:00 169 1300 1275 1095 154 476 258 4728 9.80%
12:00-13:00 211 1190 555 863 207 215 202 3443 7.13%
13:00-14:00 237 943 720 733 122 126 189 3070 6.36%
14:00-15:00 117 769 417 713 111 143 233 2503 5.19%
15:00-16:00 187 675 438 1155 85 122 226 2887 5.98%
16:00-17:00 267 669 1113 1914 117 188 240 4508 9.34%
17:00-18:00 232 768 484 906 107 147 225 2870 5.95%
18:00-19:00 307 1215 725 413 186 160 255 3261 6.76%
19:00-20:00 338 1214 656 468 221 136 206 3239 6.71%
20:00-21:00 223 805 705 504 119 89 195 2640 5.47%
21:00-22:00 138 371 45 25 51 30 84 743 1.54%
22:00-23:00 46 123 0 0 27 0 0 196 0.41%
2907 14164 10493 11897 1984 3552 3260 48257 100.00%
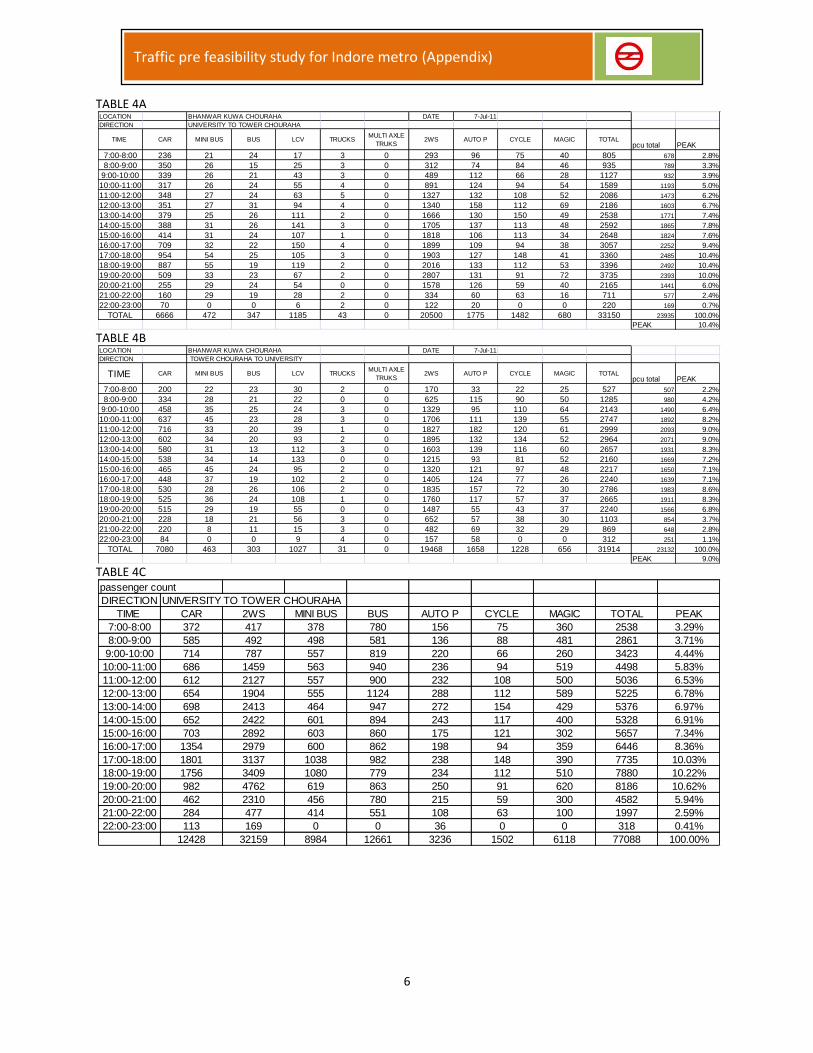
6
Traffic pre feasibility study for Indore metro (Appendix)
TABLE 4A
TABLE 4B
TABLE 4C
LOCATION BHANWAR KUWA CHOURAHA DATE 7-Jul-11
DIRECTION UNIVERSITY TO TOWER CHOURAHA
TIME CAR MINI BUS BUS LCV TRUCKSMULTI AXLE
TRUKS2WS AUTO P CYCLE MAGIC TOTAL
pcu total PEAK
7:00-8:00 236 21 24 17 3 0 293 96 75 40 805 678 2.8%
8:00-9:00 350 26 15 25 3 0 312 74 84 46 935 789 3.3%
9:00-10:00 339 26 21 43 3 0 489 112 66 28 1127 932 3.9%
10:00-11:00 317 26 24 55 4 0 891 124 94 54 1589 1193 5.0%
11:00-12:00 348 27 24 63 5 0 1327 132 108 52 2086 1473 6.2%
12:00-13:00 351 27 31 94 4 0 1340 158 112 69 2186 1603 6.7%
13:00-14:00 379 25 26 111 2 0 1666 130 150 49 2538 1771 7.4%
14:00-15:00 388 31 26 141 3 0 1705 137 113 48 2592 1865 7.8%
15:00-16:00 414 31 24 107 1 0 1818 106 113 34 2648 1824 7.6%
16:00-17:00 709 32 22 150 4 0 1899 109 94 38 3057 2252 9.4%
17:00-18:00 954 54 25 105 3 0 1903 127 148 41 3360 2485 10.4%
18:00-19:00 887 55 19 119 2 0 2016 133 112 53 3396 2492 10.4%
19:00-20:00 509 33 23 67 2 0 2807 131 91 72 3735 2393 10.0%
20:00-21:00 255 29 24 54 0 0 1578 126 59 40 2165 1441 6.0%
21:00-22:00 160 29 19 28 2 0 334 60 63 16 711 577 2.4%
22:00-23:00 70 0 0 6 2 0 122 20 0 0 220 169 0.7%
TOTAL 6666 472 347 1185 43 0 20500 1775 1482 680 33150 23935 100.0%
PEAK 10.4%
LOCATION BHANWAR KUWA CHOURAHA DATE 7-Jul-11
DIRECTION TOWER CHOURAHA TO UNIVERSITY
TIME CAR MINI BUS BUS LCV TRUCKSMULTI AXLE
TRUKS2WS AUTO P CYCLE MAGIC TOTAL
pcu total PEAK
7:00-8:00 200 22 23 30 2 0 170 33 22 25 527 507 2.2%
8:00-9:00 334 28 21 22 0 0 625 115 90 50 1285 980 4.2%
9:00-10:00 458 35 25 24 3 0 1329 95 110 64 2143 1490 6.4%
10:00-11:00 637 45 23 28 3 0 1706 111 139 55 2747 1892 8.2%
11:00-12:00 716 33 20 39 1 0 1827 182 120 61 2999 2093 9.0%
12:00-13:00 602 34 20 93 2 0 1895 132 134 52 2964 2071 9.0%
13:00-14:00 580 31 13 112 3 0 1603 139 116 60 2657 1931 8.3%
14:00-15:00 538 34 14 133 0 0 1215 93 81 52 2160 1669 7.2%
15:00-16:00 465 45 24 95 2 0 1320 121 97 48 2217 1650 7.1%
16:00-17:00 448 37 19 102 2 0 1405 124 77 26 2240 1639 7.1%
17:00-18:00 530 28 26 106 2 0 1835 157 72 30 2786 1983 8.6%
18:00-19:00 525 36 24 108 1 0 1760 117 57 37 2665 1911 8.3%
19:00-20:00 515 29 19 55 0 0 1487 55 43 37 2240 1566 6.8%
20:00-21:00 228 18 21 56 3 0 652 57 38 30 1103 854 3.7%
21:00-22:00 220 8 11 15 3 0 482 69 32 29 869 648 2.8%
22:00-23:00 84 0 0 9 4 0 157 58 0 0 312 251 1.1%
TOTAL 7080 463 303 1027 31 0 19468 1658 1228 656 31914 23132 100.0%
PEAK 9.0%
passenger count
DIRECTION UNIVERSITY TO TOWER CHOURAHA
TIME CAR 2WS MINI BUS BUS AUTO P CYCLE MAGIC TOTAL PEAK
7:00-8:00 372 417 378 780 156 75 360 2538 3.29%
8:00-9:00 585 492 498 581 136 88 481 2861 3.71%
9:00-10:00 714 787 557 819 220 66 260 3423 4.44%
10:00-11:00 686 1459 563 940 236 94 519 4498 5.83%
11:00-12:00 612 2127 557 900 232 108 500 5036 6.53%
12:00-13:00 654 1904 555 1124 288 112 589 5225 6.78%
13:00-14:00 698 2413 464 947 272 154 429 5376 6.97%
14:00-15:00 652 2422 601 894 243 117 400 5328 6.91%
15:00-16:00 703 2892 603 860 175 121 302 5657 7.34%
16:00-17:00 1354 2979 600 862 198 94 359 6446 8.36%
17:00-18:00 1801 3137 1038 982 238 148 390 7735 10.03%
18:00-19:00 1756 3409 1080 779 234 112 510 7880 10.22%
19:00-20:00 982 4762 619 863 250 91 620 8186 10.62%
20:00-21:00 462 2310 456 780 215 59 300 4582 5.94%
21:00-22:00 284 477 414 551 108 63 100 1997 2.59%
22:00-23:00 113 169 0 0 36 0 0 318 0.41%
12428 32159 8984 12661 3236 1502 6118 77088 100.00%

7
Traffic pre feasibility study for Indore metro (Appendix)
TABLE 4D
TABLE 5A
TABLE 5B
passenger count
DIRECTION TOWER CHOURAHA TO UNIVERSITY
TIME CAR 2WS MINI BUS BUS AUTO P CYCLE MAGIC TOTAL PEAK
7:00-8:00 360 257 385 759 161 26 229 2177 2.83%
8:00-9:00 624 963 540 777 136 94 479 3613 4.69%
9:00-10:00 920 2157 656 979 227 114 260 5314 6.90%
10:00-11:00 1194 2730 1031 939 243 143 529 6809 8.84%
11:00-12:00 1205 2764 722 780 174 120 508 6273 8.14%
12:00-13:00 1053 2771 701 760 284 134 580 6283 8.15%
13:00-14:00 1092 2693 576 471 282 116 420 5650 7.33%
14:00-15:00 1056 2112 659 473 251 85 400 5034 6.53%
15:00-16:00 914 2488 880 860 294 97 320 5853 7.60%
16:00-17:00 808 2447 719 741 140 77 316 5248 6.81%
17:00-18:00 1016 2996 540 975 334 72 356 6290 8.16%
18:00-19:00 1096 3369 740 920 173 61 514 6873 8.92%
19:00-20:00 978 2965 518 779 258 43 637 6179 8.02%
20:00-21:00 392 1136 306 683 314 42 281 3153 4.09%
21:00-22:00 356 743 100 312 223 32 104 1870 2.43%
22:00-23:00 120 233 0 0 73 0 0 427 0.55%
13184 32825 9073 11207 3567 1256 5933 77046 100.00%
LOCATION G.D.COLLEGE DATE 7-Jul-11
DIRECTION MHOW NAKA TO COLLECTORATE
TIME CAR MINI BUS BUS LCV TRUCKS
MULTI
AXLE
TRUKS
2WS AUTO P CYCLE MAGIC TOTAL pcu total PEAK
7:00-8:00 237 26 42 26 9 0 597 258 99 22 1316 1071 3.3%
8:00-9:00 597 62 50 27 10 0 1265 127 133 53 2324 1755 5.4%
9:00-10:00 800 51 58 60 15 0 1780 245 113 63 3185 2422 7.4%
10:00-11:00 1112 61 82 37 20 0 1550 212 121 48 3243 2617 8.0%
11:00-12:00 896 58 42 57 18 0 2000 195 111 62 3439 2550 7.8%
12:00-13:00 653 50 35 24 10 0 1950 236 159 64 3181 2221 6.8%
13:00-14:00 707 52 46 27 18 0 2180 167 146 69 3412 2382 7.3%
14:00-15:00 600 58 28 53 11 0 1880 163 160 49 3002 2101 6.4%
15:00-16:00 629 67 49 100 19 0 2210 255 206 56 3591 2593 8.0%
16:00-17:00 530 58 47 78 18 0 2070 338 147 57 3343 2423 7.4%
17:00-18:00 600 75 63 90 14 0 2030 280 179 54 3385 2500 7.7%
18:00-19:00 790 55 85 76 26 0 1605 246 123 41 3047 2445 7.5%
19:00-20:00 620 53 38 51 16 0 1600 188 119 55 2740 2027 6.2%
20:00-21:00 540 61 28 54 10 0 1670 262 126 33 2784 2011 6.2%
21:00-22:00 356 21 7 22 3 0 985 159 93 28 1674 1168 3.6%
22:00-23:00 119 0 0 6 2 0 289 8 33 0 457 300 0.9%
TOTAL 9786 808 700 788 219 0 25661 3339 2068 754 44123 32587 100.0%
PEAK 8.0%
LOCATION G.D.COLLEGE DATE 7-Jul-11
DIRECTION COLLECTORATE TO MHOW NAKA
TIME CAR MINI BUS BUS LCV TRUCKS
MULTI
AXLE
TRUKS
2WS AUTO P CYCLE MAGIC TOTAL
pcu total PEAK
7:00-8:00 292 60 20 20 11 0 570 88 91 30 1182 938 2.8%
8:00-9:00 470 52 45 43 16 0 660 225 152 39 1702 1439 4.2%
9:00-10:00 721 60 59 64 19 0 1250 233 163 61 2630 2116 6.2%
10:00-11:00 786 70 60 87 21 0 1928 283 159 53 3447 2630 7.7%
11:00-12:00 973 52 59 67 22 0 1990 273 153 55 3644 2772 8.2%
12:00-13:00 831 48 63 61 29 0 1613 295 190 53 3183 2487 7.3%
13:00-14:00 610 43 35 61 23 0 1343 236 119 59 2529 1959 5.8%
14:00-15:00 770 47 18 63 9 0 1880 245 150 60 3242 2333 6.9%
15:00-16:00 745 52 34 56 14 0 1750 229 160 60 3100 2279 6.7%
16:00-17:00 915 45 57 86 40 0 1710 233 160 62 3308 2620 7.7%
17:00-18:00 1085 55 57 60 15 0 1940 238 139 65 3654 2794 8.2%
18:00-19:00 1085 58 64 56 17 0 2018 260 178 65 3801 2888 8.5%
19:00-20:00 915 55 69 51 26 0 1986 313 107 66 3588 2757 8.1%
20:00-21:00 678 45 36 64 14 0 1999 285 151 43 3315 2383 7.0%
21:00-22:00 235 48 12 17 6 0 1127 295 115 25 1880 1310 3.9%
22:00-23:00 56 0 0 6 3 0 256 55 0 0 376 260 0.8%
TOTAL 11167 790 688 862 285 0 24020 3786 2187 796 44581 33965 100.0%
PEAK 8.5%
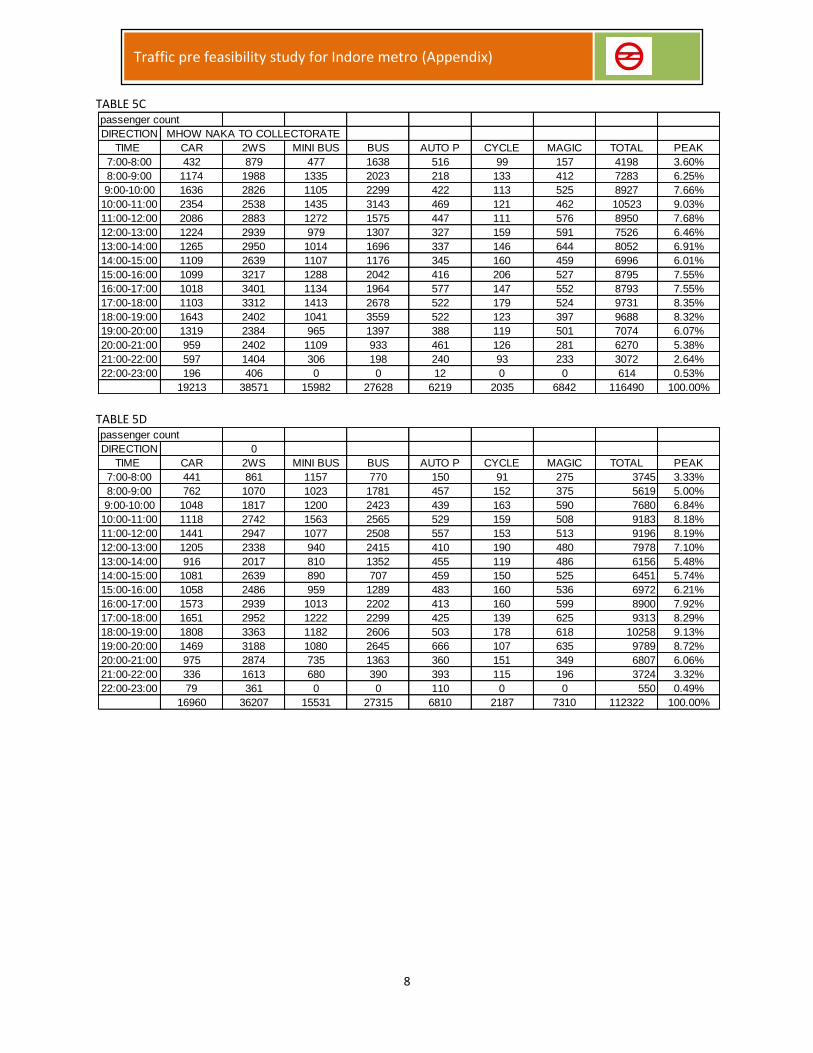
8
Traffic pre feasibility study for Indore metro (Appendix)
TABLE 5C
TABLE 5D
passenger count
DIRECTION MHOW NAKA TO COLLECTORATE
TIME CAR 2WS MINI BUS BUS AUTO P CYCLE MAGIC TOTAL PEAK
7:00-8:00 432 879 477 1638 516 99 157 4198 3.60%
8:00-9:00 1174 1988 1335 2023 218 133 412 7283 6.25%
9:00-10:00 1636 2826 1105 2299 422 113 525 8927 7.66%
10:00-11:00 2354 2538 1435 3143 469 121 462 10523 9.03%
11:00-12:00 2086 2883 1272 1575 447 111 576 8950 7.68%
12:00-13:00 1224 2939 979 1307 327 159 591 7526 6.46%
13:00-14:00 1265 2950 1014 1696 337 146 644 8052 6.91%
14:00-15:00 1109 2639 1107 1176 345 160 459 6996 6.01%
15:00-16:00 1099 3217 1288 2042 416 206 527 8795 7.55%
16:00-17:00 1018 3401 1134 1964 577 147 552 8793 7.55%
17:00-18:00 1103 3312 1413 2678 522 179 524 9731 8.35%
18:00-19:00 1643 2402 1041 3559 522 123 397 9688 8.32%
19:00-20:00 1319 2384 965 1397 388 119 501 7074 6.07%
20:00-21:00 959 2402 1109 933 461 126 281 6270 5.38%
21:00-22:00 597 1404 306 198 240 93 233 3072 2.64%
22:00-23:00 196 406 0 0 12 0 0 614 0.53%
19213 38571 15982 27628 6219 2035 6842 116490 100.00%
passenger count
DIRECTION 0
TIME CAR 2WS MINI BUS BUS AUTO P CYCLE MAGIC TOTAL PEAK
7:00-8:00 441 861 1157 770 150 91 275 3745 3.33%
8:00-9:00 762 1070 1023 1781 457 152 375 5619 5.00%
9:00-10:00 1048 1817 1200 2423 439 163 590 7680 6.84%
10:00-11:00 1118 2742 1563 2565 529 159 508 9183 8.18%
11:00-12:00 1441 2947 1077 2508 557 153 513 9196 8.19%
12:00-13:00 1205 2338 940 2415 410 190 480 7978 7.10%
13:00-14:00 916 2017 810 1352 455 119 486 6156 5.48%
14:00-15:00 1081 2639 890 707 459 150 525 6451 5.74%
15:00-16:00 1058 2486 959 1289 483 160 536 6972 6.21%
16:00-17:00 1573 2939 1013 2202 413 160 599 8900 7.92%
17:00-18:00 1651 2952 1222 2299 425 139 625 9313 8.29%
18:00-19:00 1808 3363 1182 2606 503 178 618 10258 9.13%
19:00-20:00 1469 3188 1080 2645 666 107 635 9789 8.72%
20:00-21:00 975 2874 735 1363 360 151 349 6807 6.06%
21:00-22:00 336 1613 680 390 393 115 196 3724 3.32%
22:00-23:00 79 361 0 0 110 0 0 550 0.49%
16960 36207 15531 27315 6810 2187 7310 112322 100.00%
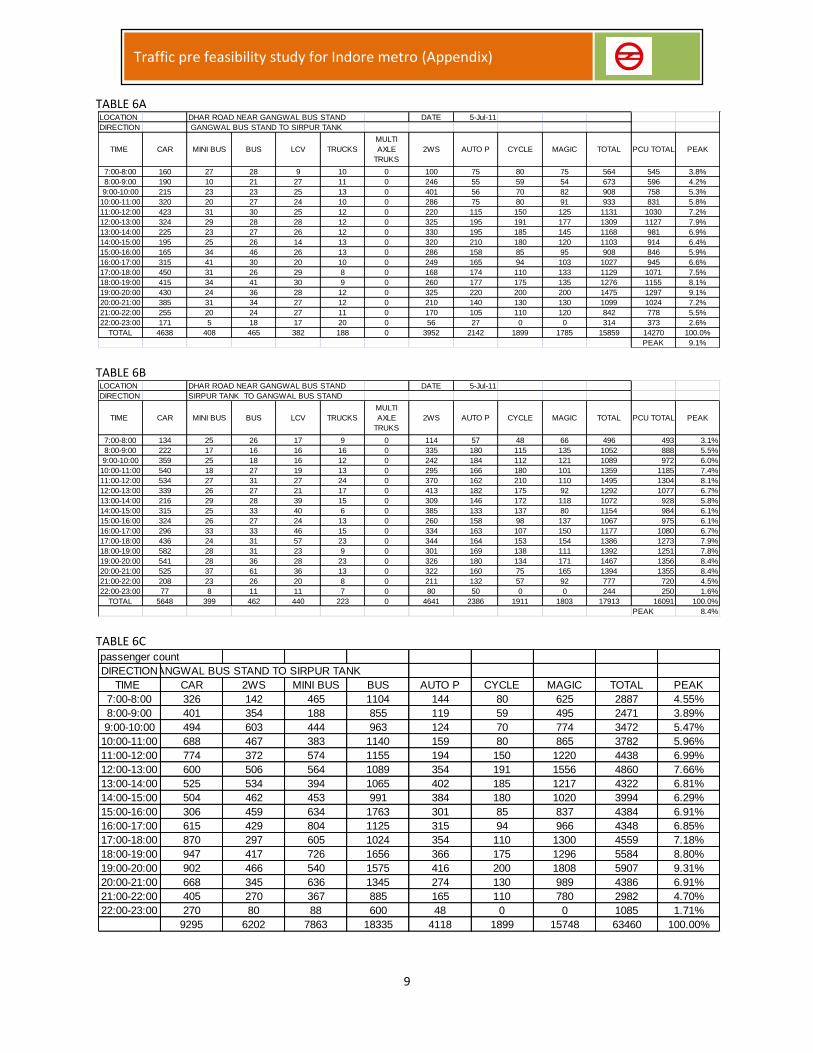
9
Traffic pre feasibility study for Indore metro (Appendix)
TABLE 6A
TABLE 6B
TABLE 6C
LOCATION DHAR ROAD NEAR GANGWAL BUS STAND DATE 5-Jul-11
DIRECTION GANGWAL BUS STAND TO SIRPUR TANK
TIME CAR MINI BUS BUS LCV TRUCKS
MULTI
AXLE
TRUKS
2WS AUTO P CYCLE MAGIC TOTAL PCU TOTAL PEAK
7:00-8:00 160 27 28 9 10 0 100 75 80 75 564 545 3.8%
8:00-9:00 190 10 21 27 11 0 246 55 59 54 673 596 4.2%
9:00-10:00 215 23 23 25 13 0 401 56 70 82 908 758 5.3%
10:00-11:00 320 20 27 24 10 0 286 75 80 91 933 831 5.8%
11:00-12:00 423 31 30 25 12 0 220 115 150 125 1131 1030 7.2%
12:00-13:00 324 29 28 28 12 0 325 195 191 177 1309 1127 7.9%
13:00-14:00 225 23 27 26 12 0 330 195 185 145 1168 981 6.9%
14:00-15:00 195 25 26 14 13 0 320 210 180 120 1103 914 6.4%
15:00-16:00 165 34 46 26 13 0 286 158 85 95 908 846 5.9%
16:00-17:00 315 41 30 20 10 0 249 165 94 103 1027 945 6.6%
17:00-18:00 450 31 26 29 8 0 168 174 110 133 1129 1071 7.5%
18:00-19:00 415 34 41 30 9 0 260 177 175 135 1276 1155 8.1%
19:00-20:00 430 24 36 28 12 0 325 220 200 200 1475 1297 9.1%
20:00-21:00 385 31 34 27 12 0 210 140 130 130 1099 1024 7.2%
21:00-22:00 255 20 24 27 11 0 170 105 110 120 842 778 5.5%
22:00-23:00 171 5 18 17 20 0 56 27 0 0 314 373 2.6%
TOTAL 4638 408 465 382 188 0 3952 2142 1899 1785 15859 14270 100.0%
PEAK 9.1%
LOCATION DHAR ROAD NEAR GANGWAL BUS STAND DATE 5-Jul-11
DIRECTION SIRPUR TANK TO GANGWAL BUS STAND
TIME CAR MINI BUS BUS LCV TRUCKS
MULTI
AXLE
TRUKS
2WS AUTO P CYCLE MAGIC TOTAL PCU TOTAL PEAK
7:00-8:00 134 25 26 17 9 0 114 57 48 66 496 493 3.1%
8:00-9:00 222 17 16 16 16 0 335 180 115 135 1052 888 5.5%
9:00-10:00 359 25 18 16 12 0 242 184 112 121 1089 972 6.0%
10:00-11:00 540 18 27 19 13 0 295 166 180 101 1359 1185 7.4%
11:00-12:00 534 27 31 27 24 0 370 162 210 110 1495 1304 8.1%
12:00-13:00 339 26 27 21 17 0 413 182 175 92 1292 1077 6.7%
13:00-14:00 216 29 28 39 15 0 309 146 172 118 1072 928 5.8%
14:00-15:00 315 25 33 40 6 0 385 133 137 80 1154 984 6.1%
15:00-16:00 324 26 27 24 13 0 260 158 98 137 1067 975 6.1%
16:00-17:00 296 33 33 46 15 0 334 163 107 150 1177 1080 6.7%
17:00-18:00 436 24 31 57 23 0 344 164 153 154 1386 1273 7.9%
18:00-19:00 582 28 31 23 9 0 301 169 138 111 1392 1251 7.8%
19:00-20:00 541 28 36 28 23 0 326 180 134 171 1467 1356 8.4%
20:00-21:00 525 37 61 36 13 0 322 160 75 165 1394 1355 8.4%
21:00-22:00 208 23 26 20 8 0 211 132 57 92 777 720 4.5%
22:00-23:00 77 8 11 11 7 0 80 50 0 0 244 250 1.6%
TOTAL 5648 399 462 440 223 0 4641 2386 1911 1803 17913 16091 100.0%
PEAK 8.4%
passenger count
DIRECTION GANGWAL BUS STAND TO SIRPUR TANK
TIME CAR 2WS MINI BUS BUS AUTO P CYCLE MAGIC TOTAL PEAK
7:00-8:00 326 142 465 1104 144 80 625 2887 4.55%
8:00-9:00 401 354 188 855 119 59 495 2471 3.89%
9:00-10:00 494 603 444 963 124 70 774 3472 5.47%
10:00-11:00 688 467 383 1140 159 80 865 3782 5.96%
11:00-12:00 774 372 574 1155 194 150 1220 4438 6.99%
12:00-13:00 600 506 564 1089 354 191 1556 4860 7.66%
13:00-14:00 525 534 394 1065 402 185 1217 4322 6.81%
14:00-15:00 504 462 453 991 384 180 1020 3994 6.29%
15:00-16:00 306 459 634 1763 301 85 837 4384 6.91%
16:00-17:00 615 429 804 1125 315 94 966 4348 6.85%
17:00-18:00 870 297 605 1024 354 110 1300 4559 7.18%
18:00-19:00 947 417 726 1656 366 175 1296 5584 8.80%
19:00-20:00 902 466 540 1575 416 200 1808 5907 9.31%
20:00-21:00 668 345 636 1345 274 130 989 4386 6.91%
21:00-22:00 405 270 367 885 165 110 780 2982 4.70%
22:00-23:00 270 80 88 600 48 0 0 1085 1.71%
9295 6202 7863 18335 4118 1899 15748 63460 100.00%

10
Traffic pre feasibility study for Indore metro (Appendix)
TABLE 6D
TABLE 7A
TABLE 7B
passenger count
DIRECTIONSIRPUR TANK TO GANGWAL BUS STAND
TIME CAR 2WS MINI BUS BUS AUTO P CYCLE MAGIC TOTAL PEAK
7:00-8:00 276 173 479 947 98 48 563 2584 3.81%
8:00-9:00 488 517 340 620 372 115 1203 3654 5.38%
9:00-10:00 798 409 563 702 400 112 1180 4163 6.13%
10:00-11:00 1260 506 396 1061 344 180 970 4717 6.95%
11:00-12:00 1044 619 521 1182 316 210 998 4890 7.20%
12:00-13:00 626 674 498 1041 356 175 900 4270 6.29%
13:00-14:00 408 467 518 1040 284 172 1119 4008 5.90%
14:00-15:00 687 614 458 1258 258 137 700 4112 6.05%
15:00-16:00 620 416 501 1157 292 98 1170 4254 6.26%
16:00-17:00 580 569 639 1299 334 107 1306 4834 7.12%
17:00-18:00 800 540 500 1351 352 153 1458 5153 7.59%
18:00-19:00 1256 495 600 1259 314 138 1048 5110 7.53%
19:00-20:00 1202 537 580 1580 336 134 1593 5962 8.78%
20:00-21:00 982 491 678 2420 256 75 1454 6355 9.36%
21:00-22:00 380 315 437 984 196 57 660 3029 4.46%
22:00-23:00 135 112 120 367 79 0 0 813 1.20%
11540 7452 7829 18269 4586 1911 16321 67909 100.00%
LOCATION JAWAHAR ROAD NEAR GURUDAWAR DATE 4-Jul-11
DIRECTION MAL GANJ TO NANDA LAL CHOURAHA
TIME CAR MINI BUS BUS LCV TRUCKS
MULTI
AXLE
TRUKS
2WS AUTO P CYCLE MAGIC TOTAL PCU TOTAL PEAK
7:00-8:00 85 9 20 25 0 0 271 207 159 249 1025 842 3.8%
8:00-9:00 190 32 10 26 0 0 289 214 66 255 1082 950 4.3%
9:00-10:00 305 56 34 89 0 0 298 188 103 185 1258 1208 5.5%
10:00-11:00 330 40 48 72 0 0 692 262 187 215 1846 1539 6.9%
11:00-12:00 345 22 44 47 0 0 716 230 211 225 1840 1465 6.6%
12:00-13:00 415 50 39 94 0 0 678 212 199 204 1891 1596 7.2%
13:00-14:00 535 22 22 37 0 0 720 272 262 276 2146 1691 7.6%
14:00-15:00 490 35 42 60 6 0 602 415 430 395 2475 2038 9.2%
15:00-16:00 430 45 50 90 8 0 590 400 395 388 2396 2040 9.2%
16:00-17:00 395 10 22 28 0 0 515 255 246 280 1751 1395 6.3%
17:00-18:00 515 7 20 21 0 0 518 260 279 258 1878 1487 6.7%
18:00-19:00 420 0 13 31 1 0 932 190 216 155 1958 1400 6.3%
19:00-20:00 475 2 17 22 4 0 1000 245 230 266 2261 1663 7.5%
20:00-21:00 510 3 7 31 6 0 1204 240 215 195 2411 1720 7.8%
21:00-22:00 215 6 6 26 2 0 553 120 135 90 1153 828 3.7%
22:00-23:00 83 4 11 32 5 0 108 34 0 0 277 284 1.3%
TOTAL 5738 343 405 731 32 0 9686 3744 3333 3636 27648 22146 100.0%
PEAK 9.2%
LOCATION JAWAHAR ROAD NEAR GURUDAWAR DATE 4-Jul-11
DIRECTION NAND LAL CHOURAHA TO MAL GANJ
TIME CAR MINI BUS BUS LCV TRUCKS
MULTI
AXLE
TRUKS
2WS AUTO P CYCLE MAGIC TOTAL PCU TOTAL PEAK
7:00-8:00 170 20 21 52 5 0 211 136 76 100 791 738 3.4%
8:00-9:00 194 39 42 46 5 0 353 150 140 148 1117 985 4.5%
9:00-10:00 244 28 35 48 4 0 457 188 159 126 1289 1076 4.9%
10:00-11:00 416 30 27 62 3 0 653 210 189 153 1743 1413 6.4%
11:00-12:00 456 24 28 75 0 0 690 255 236 208 1972 1598 7.3%
12:00-13:00 451 25 29 47 8 0 570 266 180 199 1775 1488 6.8%
13:00-14:00 375 24 28 61 4 0 595 272 201 223 1783 1474 6.7%
14:00-15:00 297 21 25 62 3 0 461 220 210 243 1542 1287 5.9%
15:00-16:00 269 24 25 48 3 0 531 330 257 205 1692 1358 6.2%
16:00-17:00 307 13 23 75 2 0 735 297 188 232 1872 1499 6.8%
17:00-18:00 477 27 21 100 3 0 1083 310 225 282 2528 1987 9.1%
18:00-19:00 464 20 23 65 0 0 1107 146 167 143 2135 1579 7.2%
19:00-20:00 468 11 28 75 1 0 1157 313 240 280 2573 1958 8.9%
20:00-21:00 373 3 31 80 1 0 1110 364 263 335 2560 1959 8.9%
21:00-22:00 270 3 8 105 0 0 549 213 160 223 1531 1268 5.8%
22:00-23:00 122 1 0 28 0 0 123 29 0 0 303 270 1.2%
TOTAL 5353 313 394 1029 42 0 10385 3699 2891 3100 27206 21937 100.0%
PEAK 9.1%

11
Traffic pre feasibility study for Indore metro (Appendix)
TABLE 7C
TABLE 7D
passenger count
DIRECTION MAL GANJ TO NANDA LAL CHOURAHA
TIME CAR 2WS MINI BUS BUS AUTO P CYCLE MAGIC TOTAL PEAK
7:00-8:00 198 391 153 740 323 159 1992 3955 4.37%
8:00-9:00 516 473 622 395 376 66 2325 4773 5.27%
9:00-10:00 740 491 1080 1254 300 103 1850 5818 6.43%
10:00-11:00 723 1146 725 1800 448 187 2329 7359 8.13%
11:00-12:00 781 1082 422 1603 321 211 2156 6576 7.27%
12:00-13:00 741 969 1000 1393 357 199 1879 6538 7.22%
13:00-14:00 1007 1012 422 833 476 262 2300 6311 6.97%
14:00-15:00 1112 932 735 1645 845 430 3456 9156 10.12%
15:00-16:00 866 979 863 2042 715 395 3418 9278 10.25%
16:00-17:00 676 810 183 814 468 246 2567 5764 6.37%
17:00-18:00 1013 853 146 800 461 279 2228 5780 6.39%
18:00-19:00 923 1589 0 533 359 216 1439 5059 5.59%
19:00-20:00 954 1455 44 692 393 230 2602 6371 7.04%
20:00-21:00 850 1701 45 220 410 215 1693 5134 5.67%
21:00-22:00 348 759 66 165 172 135 660 2305 2.55%
22:00-23:00 134 139 0 0 54 0 0 327 0.36%
11582 14781 6505 14928 6478 3333 32895 90503 100.00%
passenger count
DIRECTION MALGANJ TO NAND LAL CHOURAHA
TIME CAR 2WS MINI BUS BUS AUTO P CYCLE MAGIC TOTAL PEAK
7:00-8:00 389 331 367 798 246 76 833 3039 3.52%
8:00-9:00 549 579 756 1680 293 140 1480 5477 6.34%
9:00-10:00 764 753 560 1378 340 159 1221 5175 5.99%
10:00-11:00 1015 1088 583 1069 336 189 1530 5810 6.73%
11:00-12:00 1209 1013 500 1158 456 236 2015 6587 7.62%
12:00-13:00 876 941 469 1144 563 180 1658 5830 6.75%
13:00-14:00 624 937 460 1064 561 201 1825 5672 6.57%
14:00-15:00 487 670 381 888 537 210 2363 5535 6.41%
15:00-16:00 473 791 513 885 535 257 1990 5444 6.30%
16:00-17:00 558 1080 282 863 801 188 2076 5847 6.77%
17:00-18:00 999 1746 540 798 595 225 2484 7387 8.55%
18:00-19:00 1114 1814 0 882 245 167 1337 5559 6.43%
19:00-20:00 972 1928 242 1120 515 240 2557 7573 8.77%
20:00-21:00 670 1632 66 1163 662 263 2857 7313 8.46%
21:00-22:00 484 781 56 260 305 160 1673 3719 4.30%
22:00-23:00 207 159 11 0 48 0 0 426 0.49%
11388 16245 5784 15149 7040 2891 27897 86393 100.00%
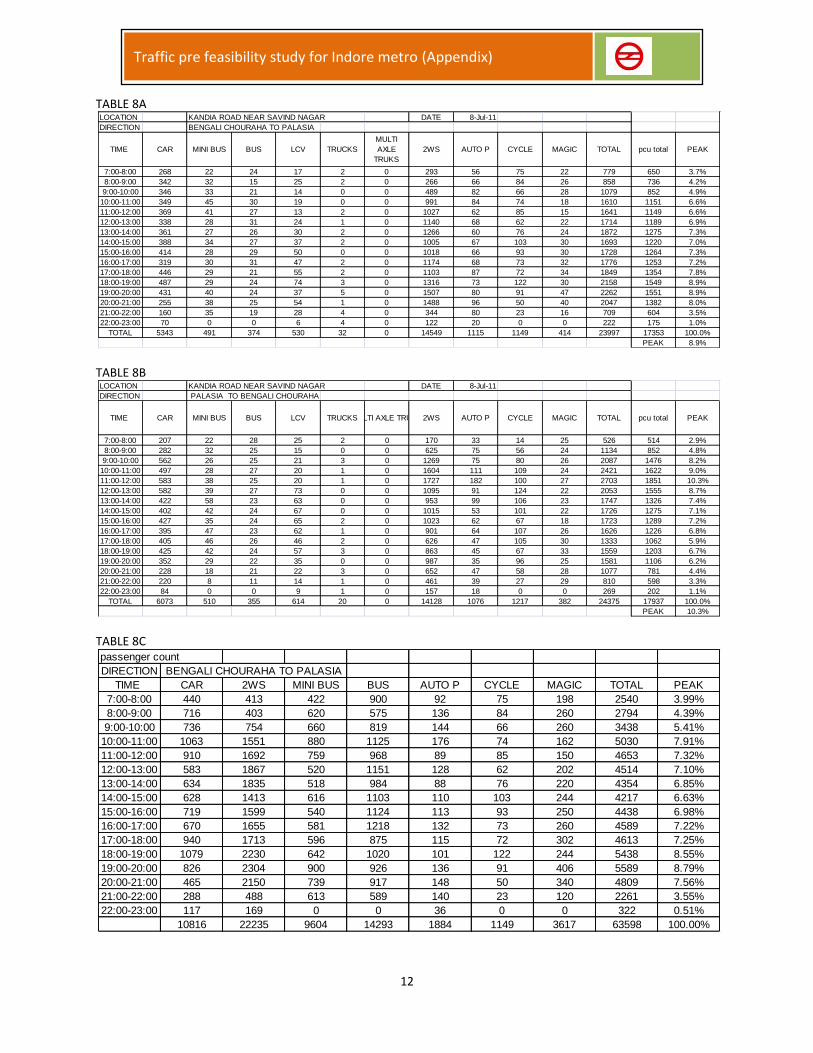
12
Traffic pre feasibility study for Indore metro (Appendix)
TABLE 8A
TABLE 8B
TABLE 8C
LOCATION KANDIA ROAD NEAR SAVIND NAGAR DATE 8-Jul-11
DIRECTION BENGALI CHOURAHA TO PALASIA
TIME CAR MINI BUS BUS LCV TRUCKS
MULTI
AXLE
TRUKS
2WS AUTO P CYCLE MAGIC TOTAL pcu total PEAK
7:00-8:00 268 22 24 17 2 0 293 56 75 22 779 650 3.7%
8:00-9:00 342 32 15 25 2 0 266 66 84 26 858 736 4.2%
9:00-10:00 346 33 21 14 0 0 489 82 66 28 1079 852 4.9%
10:00-11:00 349 45 30 19 0 0 991 84 74 18 1610 1151 6.6%
11:00-12:00 369 41 27 13 2 0 1027 62 85 15 1641 1149 6.6%
12:00-13:00 338 28 31 24 1 0 1140 68 62 22 1714 1189 6.9%
13:00-14:00 361 27 26 30 2 0 1266 60 76 24 1872 1275 7.3%
14:00-15:00 388 34 27 37 2 0 1005 67 103 30 1693 1220 7.0%
15:00-16:00 414 28 29 50 0 0 1018 66 93 30 1728 1264 7.3%
16:00-17:00 319 30 31 47 2 0 1174 68 73 32 1776 1253 7.2%
17:00-18:00 446 29 21 55 2 0 1103 87 72 34 1849 1354 7.8%
18:00-19:00 487 29 24 74 3 0 1316 73 122 30 2158 1549 8.9%
19:00-20:00 431 40 24 37 5 0 1507 80 91 47 2262 1551 8.9%
20:00-21:00 255 38 25 54 1 0 1488 96 50 40 2047 1382 8.0%
21:00-22:00 160 35 19 28 4 0 344 80 23 16 709 604 3.5%
22:00-23:00 70 0 0 6 4 0 122 20 0 0 222 175 1.0%
TOTAL 5343 491 374 530 32 0 14549 1115 1149 414 23997 17353 100.0%
PEAK 8.9%
LOCATION KANDIA ROAD NEAR SAVIND NAGAR DATE 8-Jul-11
DIRECTION PALASIA TO BENGALI CHOURAHA
TIME CAR MINI BUS BUS LCV TRUCKSMULTI AXLE TRUKS2WS AUTO P CYCLE MAGIC TOTAL pcu total PEAK
7:00-8:00 207 22 28 25 2 0 170 33 14 25 526 514 2.9%
8:00-9:00 282 32 25 15 0 0 625 75 56 24 1134 852 4.8%
9:00-10:00 562 26 25 21 3 0 1269 75 80 26 2087 1476 8.2%
10:00-11:00 497 28 27 20 1 0 1604 111 109 24 2421 1622 9.0%
11:00-12:00 583 38 25 20 1 0 1727 182 100 27 2703 1851 10.3%
12:00-13:00 582 39 27 73 0 0 1095 91 124 22 2053 1555 8.7%
13:00-14:00 422 58 23 63 0 0 953 99 106 23 1747 1326 7.4%
14:00-15:00 402 42 24 67 0 0 1015 53 101 22 1726 1275 7.1%
15:00-16:00 427 35 24 65 2 0 1023 62 67 18 1723 1289 7.2%
16:00-17:00 395 47 23 62 1 0 901 64 107 26 1626 1226 6.8%
17:00-18:00 405 46 26 46 2 0 626 47 105 30 1333 1062 5.9%
18:00-19:00 425 42 24 57 3 0 863 45 67 33 1559 1203 6.7%
19:00-20:00 352 29 22 35 0 0 987 35 96 25 1581 1106 6.2%
20:00-21:00 228 18 21 22 3 0 652 47 58 28 1077 781 4.4%
21:00-22:00 220 8 11 14 1 0 461 39 27 29 810 598 3.3%
22:00-23:00 84 0 0 9 1 0 157 18 0 0 269 202 1.1%
TOTAL 6073 510 355 614 20 0 14128 1076 1217 382 24375 17937 100.0%
PEAK 10.3%
passenger count
DIRECTION BENGALI CHOURAHA TO PALASIA
TIME CAR 2WS MINI BUS BUS AUTO P CYCLE MAGIC TOTAL PEAK
7:00-8:00 440 413 422 900 92 75 198 2540 3.99%
8:00-9:00 716 403 620 575 136 84 260 2794 4.39%
9:00-10:00 736 754 660 819 144 66 260 3438 5.41%
10:00-11:00 1063 1551 880 1125 176 74 162 5030 7.91%
11:00-12:00 910 1692 759 968 89 85 150 4653 7.32%
12:00-13:00 583 1867 520 1151 128 62 202 4514 7.10%
13:00-14:00 634 1835 518 984 88 76 220 4354 6.85%
14:00-15:00 628 1413 616 1103 110 103 244 4217 6.63%
15:00-16:00 719 1599 540 1124 113 93 250 4438 6.98%
16:00-17:00 670 1655 581 1218 132 73 260 4589 7.22%
17:00-18:00 940 1713 596 875 115 72 302 4613 7.25%
18:00-19:00 1079 2230 642 1020 101 122 244 5438 8.55%
19:00-20:00 826 2304 900 926 136 91 406 5589 8.79%
20:00-21:00 465 2150 739 917 148 50 340 4809 7.56%
21:00-22:00 288 488 613 589 140 23 120 2261 3.55%
22:00-23:00 117 169 0 0 36 0 0 322 0.51%
10816 22235 9604 14293 1884 1149 3617 63598 100.00%
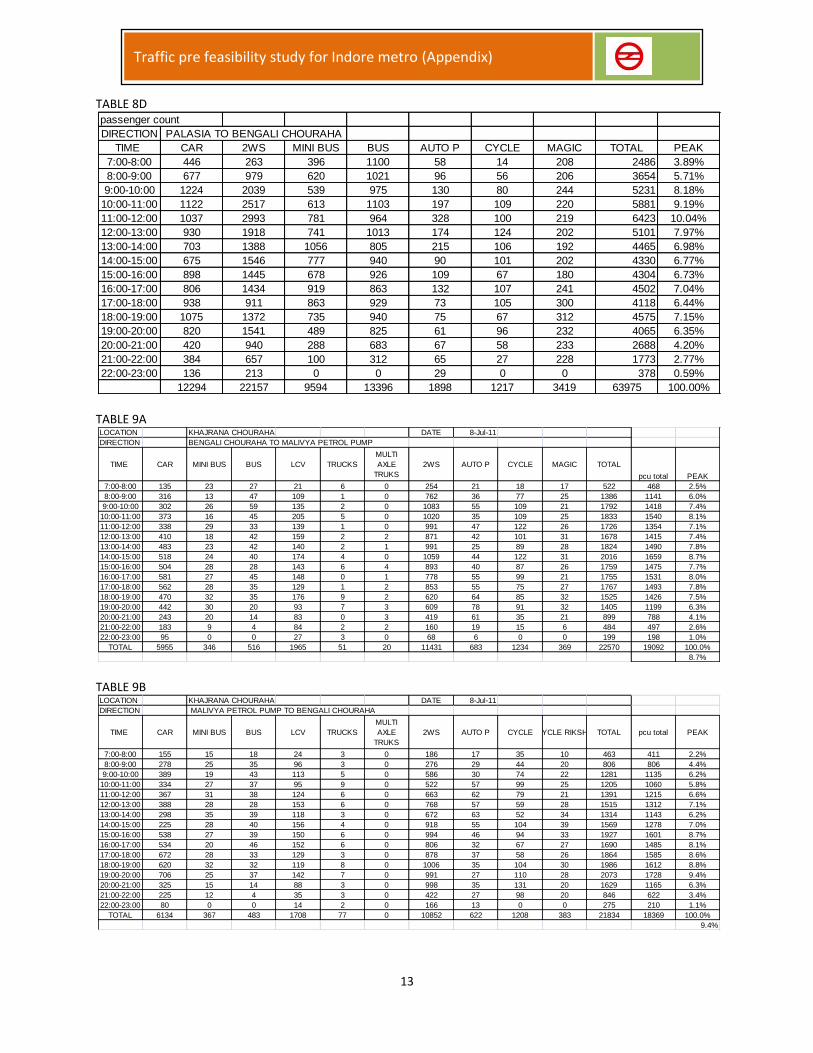
13
Traffic pre feasibility study for Indore metro (Appendix)
TABLE 8D
TABLE 9A
TABLE 9B
passenger count
DIRECTION PALASIA TO BENGALI CHOURAHA
TIME CAR 2WS MINI BUS BUS AUTO P CYCLE MAGIC TOTAL PEAK
7:00-8:00 446 263 396 1100 58 14 208 2486 3.89%
8:00-9:00 677 979 620 1021 96 56 206 3654 5.71%
9:00-10:00 1224 2039 539 975 130 80 244 5231 8.18%
10:00-11:00 1122 2517 613 1103 197 109 220 5881 9.19%
11:00-12:00 1037 2993 781 964 328 100 219 6423 10.04%
12:00-13:00 930 1918 741 1013 174 124 202 5101 7.97%
13:00-14:00 703 1388 1056 805 215 106 192 4465 6.98%
14:00-15:00 675 1546 777 940 90 101 202 4330 6.77%
15:00-16:00 898 1445 678 926 109 67 180 4304 6.73%
16:00-17:00 806 1434 919 863 132 107 241 4502 7.04%
17:00-18:00 938 911 863 929 73 105 300 4118 6.44%
18:00-19:00 1075 1372 735 940 75 67 312 4575 7.15%
19:00-20:00 820 1541 489 825 61 96 232 4065 6.35%
20:00-21:00 420 940 288 683 67 58 233 2688 4.20%
21:00-22:00 384 657 100 312 65 27 228 1773 2.77%
22:00-23:00 136 213 0 0 29 0 0 378 0.59%
12294 22157 9594 13396 1898 1217 3419 63975 100.00%
LOCATION KHAJRANA CHOURAHA DATE 8-Jul-11
DIRECTION BENGALI CHOURAHA TO MALIVYA PETROL PUMP
TIME CAR MINI BUS BUS LCV TRUCKS
MULTI
AXLE
TRUKS
2WS AUTO P CYCLE MAGIC TOTAL
pcu total PEAK
7:00-8:00 135 23 27 21 6 0 254 21 18 17 522 468 2.5%
8:00-9:00 316 13 47 109 1 0 762 36 77 25 1386 1141 6.0%
9:00-10:00 302 26 59 135 2 0 1083 55 109 21 1792 1418 7.4%
10:00-11:00 373 16 45 205 5 0 1020 35 109 25 1833 1540 8.1%
11:00-12:00 338 29 33 139 1 0 991 47 122 26 1726 1354 7.1%
12:00-13:00 410 18 42 159 2 2 871 42 101 31 1678 1415 7.4%
13:00-14:00 483 23 42 140 2 1 991 25 89 28 1824 1490 7.8%
14:00-15:00 518 24 40 174 4 0 1059 44 122 31 2016 1659 8.7%
15:00-16:00 504 28 28 143 6 4 893 40 87 26 1759 1475 7.7%
16:00-17:00 581 27 45 148 0 1 778 55 99 21 1755 1531 8.0%
17:00-18:00 562 28 35 129 1 2 853 55 75 27 1767 1493 7.8%
18:00-19:00 470 32 35 176 9 2 620 64 85 32 1525 1426 7.5%
19:00-20:00 442 30 20 93 7 3 609 78 91 32 1405 1199 6.3%
20:00-21:00 243 20 14 83 0 3 419 61 35 21 899 788 4.1%
21:00-22:00 183 9 4 84 2 2 160 19 15 6 484 497 2.6%
22:00-23:00 95 0 0 27 3 0 68 6 0 0 199 198 1.0%
TOTAL 5955 346 516 1965 51 20 11431 683 1234 369 22570 19092 100.0%
8.7%
LOCATION KHAJRANA CHOURAHA DATE 8-Jul-11
DIRECTION MALIVYA PETROL PUMP TO BENGALI CHOURAHA
TIME CAR MINI BUS BUS LCV TRUCKS
MULTI
AXLE
TRUKS
2WS AUTO P CYCLE CYCLE RIKSHA TOTAL pcu total PEAK
7:00-8:00 155 15 18 24 3 0 186 17 35 10 463 411 2.2%
8:00-9:00 278 25 35 96 3 0 276 29 44 20 806 806 4.4%
9:00-10:00 389 19 43 113 5 0 586 30 74 22 1281 1135 6.2%
10:00-11:00 334 27 37 95 9 0 522 57 99 25 1205 1060 5.8%
11:00-12:00 367 31 38 124 6 0 663 62 79 21 1391 1215 6.6%
12:00-13:00 388 28 28 153 6 0 768 57 59 28 1515 1312 7.1%
13:00-14:00 298 35 39 118 3 0 672 63 52 34 1314 1143 6.2%
14:00-15:00 225 28 40 156 4 0 918 55 104 39 1569 1278 7.0%
15:00-16:00 538 27 39 150 6 0 994 46 94 33 1927 1601 8.7%
16:00-17:00 534 20 46 152 6 0 806 32 67 27 1690 1485 8.1%
17:00-18:00 672 28 33 129 3 0 878 37 58 26 1864 1585 8.6%
18:00-19:00 620 32 32 119 8 0 1006 35 104 30 1986 1612 8.8%
19:00-20:00 706 25 37 142 7 0 991 27 110 28 2073 1728 9.4%
20:00-21:00 325 15 14 88 3 0 998 35 131 20 1629 1165 6.3%
21:00-22:00 225 12 4 35 3 0 422 27 98 20 846 622 3.4%
22:00-23:00 80 0 0 14 2 0 166 13 0 0 275 210 1.1%
TOTAL 6134 367 483 1708 77 0 10852 622 1208 383 21834 18369 100.0%
9.4%
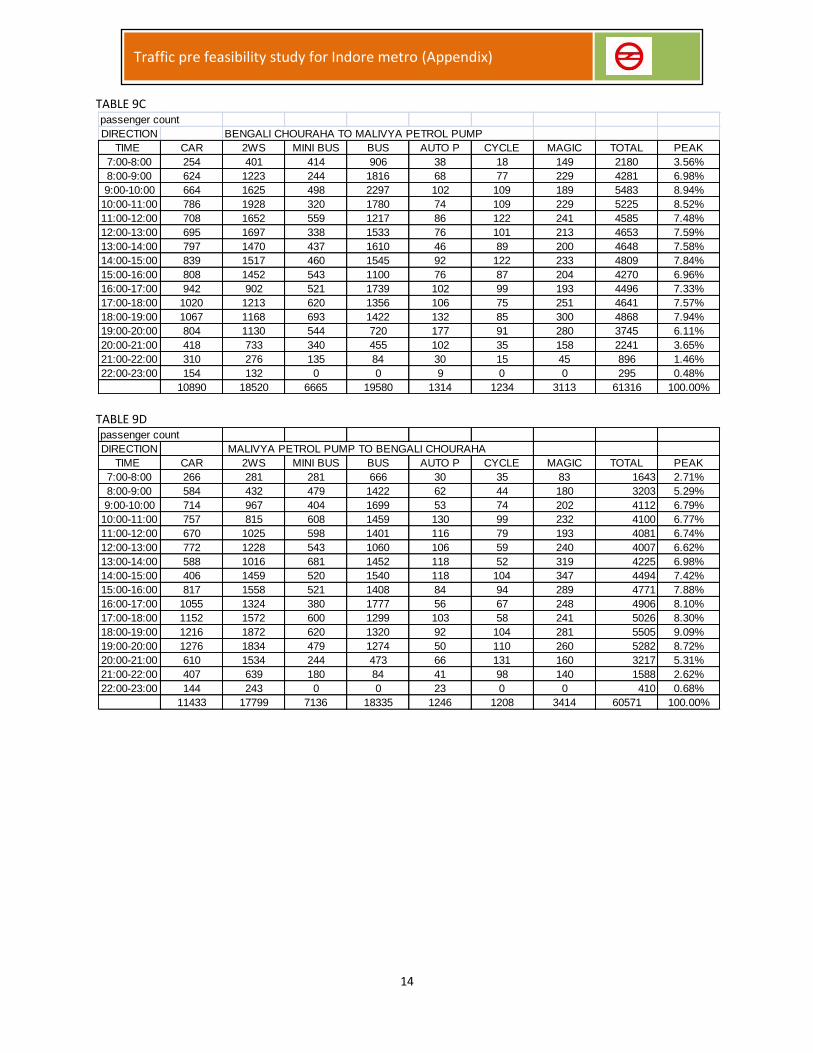
14
Traffic pre feasibility study for Indore metro (Appendix)
TABLE 9C
TABLE 9D
passenger count
DIRECTION BENGALI CHOURAHA TO MALIVYA PETROL PUMP
TIME CAR 2WS MINI BUS BUS AUTO P CYCLE MAGIC TOTAL PEAK
7:00-8:00 254 401 414 906 38 18 149 2180 3.56%
8:00-9:00 624 1223 244 1816 68 77 229 4281 6.98%
9:00-10:00 664 1625 498 2297 102 109 189 5483 8.94%
10:00-11:00 786 1928 320 1780 74 109 229 5225 8.52%
11:00-12:00 708 1652 559 1217 86 122 241 4585 7.48%
12:00-13:00 695 1697 338 1533 76 101 213 4653 7.59%
13:00-14:00 797 1470 437 1610 46 89 200 4648 7.58%
14:00-15:00 839 1517 460 1545 92 122 233 4809 7.84%
15:00-16:00 808 1452 543 1100 76 87 204 4270 6.96%
16:00-17:00 942 902 521 1739 102 99 193 4496 7.33%
17:00-18:00 1020 1213 620 1356 106 75 251 4641 7.57%
18:00-19:00 1067 1168 693 1422 132 85 300 4868 7.94%
19:00-20:00 804 1130 544 720 177 91 280 3745 6.11%
20:00-21:00 418 733 340 455 102 35 158 2241 3.65%
21:00-22:00 310 276 135 84 30 15 45 896 1.46%
22:00-23:00 154 132 0 0 9 0 0 295 0.48%
10890 18520 6665 19580 1314 1234 3113 61316 100.00%
passenger count
DIRECTION MALIVYA PETROL PUMP TO BENGALI CHOURAHA
TIME CAR 2WS MINI BUS BUS AUTO P CYCLE MAGIC TOTAL PEAK
7:00-8:00 266 281 281 666 30 35 83 1643 2.71%
8:00-9:00 584 432 479 1422 62 44 180 3203 5.29%
9:00-10:00 714 967 404 1699 53 74 202 4112 6.79%
10:00-11:00 757 815 608 1459 130 99 232 4100 6.77%
11:00-12:00 670 1025 598 1401 116 79 193 4081 6.74%
12:00-13:00 772 1228 543 1060 106 59 240 4007 6.62%
13:00-14:00 588 1016 681 1452 118 52 319 4225 6.98%
14:00-15:00 406 1459 520 1540 118 104 347 4494 7.42%
15:00-16:00 817 1558 521 1408 84 94 289 4771 7.88%
16:00-17:00 1055 1324 380 1777 56 67 248 4906 8.10%
17:00-18:00 1152 1572 600 1299 103 58 241 5026 8.30%
18:00-19:00 1216 1872 620 1320 92 104 281 5505 9.09%
19:00-20:00 1276 1834 479 1274 50 110 260 5282 8.72%
20:00-21:00 610 1534 244 473 66 131 160 3217 5.31%
21:00-22:00 407 639 180 84 41 98 140 1588 2.62%
22:00-23:00 144 243 0 0 23 0 0 410 0.68%
11433 17799 7136 18335 1246 1208 3414 60571 100.00%

15
Traffic pre feasibility study for Indore metro (Appendix)
TABLE 10A
TABLE 10B
TABLE 10C
LOCATION M.G ROAD NEAR INDRA BHAWAN DATE 5-Jul-11
DIRECTION SHASTRI BRIDGE TO PALASIA CHOURAHA
TIME CAR MINI BUS BUS LCV TRUCKS
MULTI
AXLE
TRUKS
2WS AUTO P CYCLE MAGIC TOTAL pcu total PEAK
7:00-8:00 122 9 24 13 0 0 134 32 31 11 376 342 1.0%
8:00-9:00 386 6 23 3 2 0 655 57 59 30 1221 898 2.6%
9:00-10:00 380 4 8 3 0 0 1350 64 68 75 1952 1248 3.6%
10:00-11:00 710 6 11 1 3 0 1600 66 39 71 2507 1707 4.9%
11:00-12:00 1165 5 16 0 2 0 1800 59 30 61 3138 2248 6.4%
12:00-13:00 1605 14 27 11 5 0 2390 111 117 81 4361 3156 9.0%
13:00-14:00 1215 21 32 16 3 0 1110 62 99 92 2650 2109 6.0%
14:00-15:00 1293 21 48 10 3 0 1300 79 86 84 2924 2315 6.6%
15:00-16:00 1530 16 51 13 8 0 1700 100 103 117 3638 2832 8.1%
16:00-17:00 2730 10 26 4 2 0 2275 155 105 138 5445 4289 12.3%
17:00-18:00 2015 7 34 9 2 1 2024 115 121 147 4475 3452 9.9%
18:00-19:00 1515 8 31 5 0 0 1240 112 146 73 3130 2468 7.1%
19:00-20:00 2325 14 40 8 1 8 855 102 97 152 3602 3207 9.2%
20:00-21:00 2170 6 49 2 1 0 860 103 66 122 3379 2985 8.6%
21:00-22:00 685 4 10 0 0 0 705 82 66 70 1622 1242 3.6%
22:00-23:00 236 0 0 0 0 0 282 25 0 0 543 402 1.2%
TOTAL 20082 151 430 98 32 9 20280 1324 1233 1324 44963 34902 100.0%
PEAK 12.3%
LOCATION M.G ROAD NEAR INDRA BHAWAN DATE 5-Jul-11
DIRECTION PALASIA CHOURAHA TO SHASTRI BRIDGE
TIME CAR MINI BUS BUS LCV TRUCKS
MULTI
AXLE
TRUKS
2WS AUTO P CYCLE MAGIC TOTAL pcu total PEAK
7:00-8:00 182 0 13 37 0 0 140 77 65 60 574 517 1.5%
8:00-9:00 425 0 30 8 2 0 215 56 142 66 944 798 2.4%
9:00-10:00 1130 7 30 7 3 0 1375 110 130 90 2882 2169 6.4%
10:00-11:00 990 16 37 7 1 0 2210 100 155 104 3620 2484 7.3%
11:00-12:00 1445 20 51 17 0 0 1760 115 105 105 3618 2771 8.2%
12:00-13:00 1500 12 26 6 0 0 2255 115 80 97 4091 2961 8.7%
13:00-14:00 1770 20 45 3 3 0 2110 107 54 90 4202 3197 9.4%
14:00-15:00 1665 16 48 3 0 0 1795 105 63 91 3786 2929 8.6%
15:00-16:00 1485 16 43 0 0 0 1380 100 61 88 3173 2515 7.4%
16:00-17:00 1615 16 38 0 0 0 1900 127 57 87 3840 2917 8.6%
17:00-18:00 2005 10 23 0 0 0 1910 120 63 118 4249 3291 9.7%
18:00-19:00 1765 11 31 6 0 0 1665 120 52 98 3748 2939 8.7%
19:00-20:00 1306 7 21 6 0 0 1630 100 55 110 3235 2424 7.2%
20:00-21:00 563 4 22 0 0 0 680 60 34 59 1422 1094 3.2%
21:00-22:00 256 3 18 0 0 0 485 75 17 28 882 657 1.9%
22:00-23:00 96 0 0 0 0 0 184 21 0 0 301 209 0.6%
TOTAL 18198 158 476 100 9 0 21694 1508 1133 1291 44567 33872 100.0%
PEAK 9.7%
passenger count
DIRECTION SHASTRI BRIDGE TO PALASIA CHOURAHA
TIME CAR 2WS MINI BUS BUS AUTO P CYCLE MAGIC TOTAL PEAK
7:00-8:00 236 197 158 860 68 31 92 1641 1.50%
8:00-9:00 796 1040 120 936 130 59 279 3360 3.06%
9:00-10:00 1092 2199 88 340 152 68 708 4647 4.24%
10:00-11:00 1991 2672 135 458 149 39 689 6132 5.59%
11:00-12:00 2019 3084 88 600 110 30 529 6458 5.89%
12:00-13:00 3051 3676 263 964 229 117 709 9008 8.21%
13:00-14:00 3387 1888 378 1100 132 99 820 7804 7.12%
14:00-15:00 3753 2111 368 1820 146 86 760 9043 8.25%
15:00-16:00 3186 2544 300 2017 168 103 1069 9387 8.56%
16:00-17:00 4838 4049 167 947 282 105 1177 11565 10.54%
17:00-18:00 3538 3429 123 1296 270 121 1329 10105 9.21%
18:00-19:00 3174 2078 160 1223 208 146 710 7698 7.02%
19:00-20:00 5690 1427 263 1440 177 97 1303 10396 9.48%
20:00-21:00 3851 1398 66 1695 168 66 1017 8260 7.53%
21:00-22:00 1177 1087 44 283 144 66 525 3326 3.03%
22:00-23:00 396 415 0 0 36 0 0 847 0.77%
42174 33293 2718 15980 2566 1233 11714 109679 100.00%
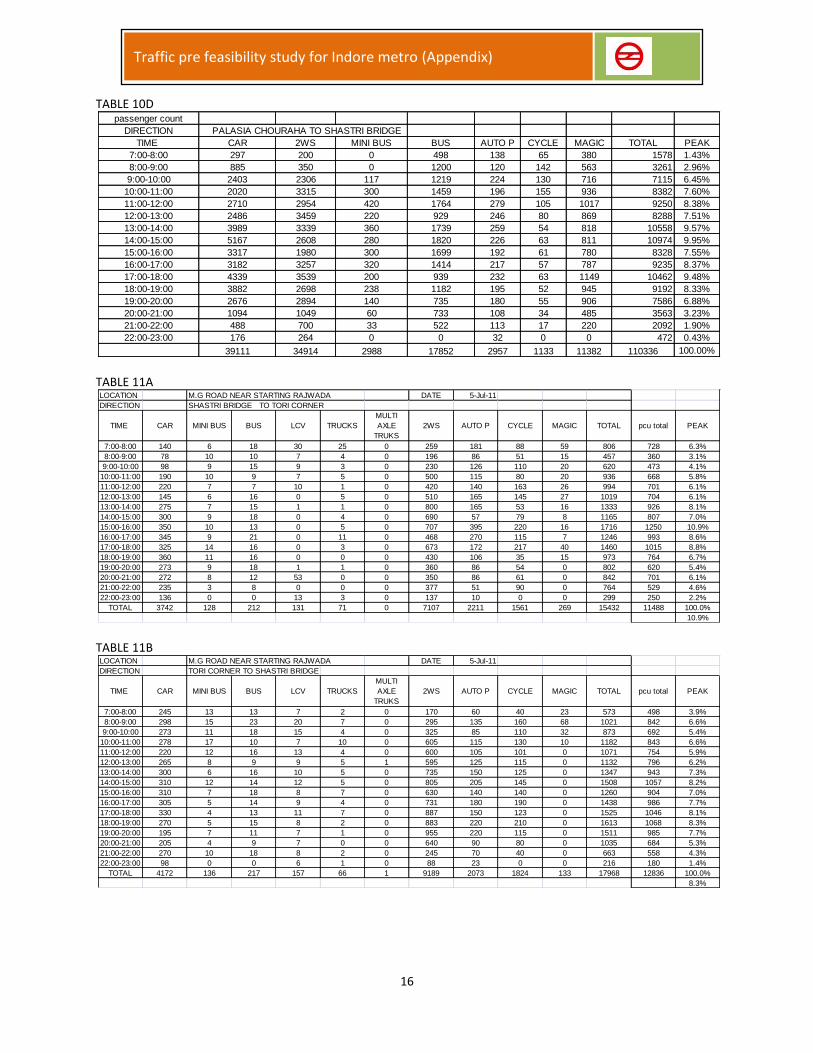
16
Traffic pre feasibility study for Indore metro (Appendix)
TABLE 10D
TABLE 11A
TABLE 11B
passenger count
DIRECTION PALASIA CHOURAHA TO SHASTRI BRIDGE
TIME CAR 2WS MINI BUS BUS AUTO P CYCLE MAGIC TOTAL PEAK
7:00-8:00 297 200 0 498 138 65 380 1578 1.43%
8:00-9:00 885 350 0 1200 120 142 563 3261 2.96%
9:00-10:00 2403 2306 117 1219 224 130 716 7115 6.45%
10:00-11:00 2020 3315 300 1459 196 155 936 8382 7.60%
11:00-12:00 2710 2954 420 1764 279 105 1017 9250 8.38%
12:00-13:00 2486 3459 220 929 246 80 869 8288 7.51%
13:00-14:00 3989 3339 360 1739 259 54 818 10558 9.57%
14:00-15:00 5167 2608 280 1820 226 63 811 10974 9.95%
15:00-16:00 3317 1980 300 1699 192 61 780 8328 7.55%
16:00-17:00 3182 3257 320 1414 217 57 787 9235 8.37%
17:00-18:00 4339 3539 200 939 232 63 1149 10462 9.48%
18:00-19:00 3882 2698 238 1182 195 52 945 9192 8.33%
19:00-20:00 2676 2894 140 735 180 55 906 7586 6.88%
20:00-21:00 1094 1049 60 733 108 34 485 3563 3.23%
21:00-22:00 488 700 33 522 113 17 220 2092 1.90%
22:00-23:00 176 264 0 0 32 0 0 472 0.43%
39111 34914 2988 17852 2957 1133 11382 110336 100.00%
LOCATION M.G ROAD NEAR STARTING RAJWADA DATE 5-Jul-11
DIRECTION SHASTRI BRIDGE TO TORI CORNER
TIME CAR MINI BUS BUS LCV TRUCKS
MULTI
AXLE
TRUKS
2WS AUTO P CYCLE MAGIC TOTAL pcu total PEAK
7:00-8:00 140 6 18 30 25 0 259 181 88 59 806 728 6.3%
8:00-9:00 78 10 10 7 4 0 196 86 51 15 457 360 3.1%
9:00-10:00 98 9 15 9 3 0 230 126 110 20 620 473 4.1%
10:00-11:00 190 10 9 7 5 0 500 115 80 20 936 668 5.8%
11:00-12:00 220 7 7 10 1 0 420 140 163 26 994 701 6.1%
12:00-13:00 145 6 16 0 5 0 510 165 145 27 1019 704 6.1%
13:00-14:00 275 7 15 1 1 0 800 165 53 16 1333 926 8.1%
14:00-15:00 300 9 18 0 4 0 690 57 79 8 1165 807 7.0%
15:00-16:00 350 10 13 0 5 0 707 395 220 16 1716 1250 10.9%
16:00-17:00 345 9 21 0 11 0 468 270 115 7 1246 993 8.6%
17:00-18:00 325 14 16 0 3 0 673 172 217 40 1460 1015 8.8%
18:00-19:00 360 11 16 0 0 0 430 106 35 15 973 764 6.7%
19:00-20:00 273 9 18 1 1 0 360 86 54 0 802 620 5.4%
20:00-21:00 272 8 12 53 0 0 350 86 61 0 842 701 6.1%
21:00-22:00 235 3 8 0 0 0 377 51 90 0 764 529 4.6%
22:00-23:00 136 0 0 13 3 0 137 10 0 0 299 250 2.2%
TOTAL 3742 128 212 131 71 0 7107 2211 1561 269 15432 11488 100.0%
10.9%
LOCATION M.G ROAD NEAR STARTING RAJWADA DATE 5-Jul-11
DIRECTION TORI CORNER TO SHASTRI BRIDGE
TIME CAR MINI BUS BUS LCV TRUCKS
MULTI
AXLE
TRUKS
2WS AUTO P CYCLE MAGIC TOTAL pcu total PEAK
7:00-8:00 245 13 13 7 2 0 170 60 40 23 573 498 3.9%
8:00-9:00 298 15 23 20 7 0 295 135 160 68 1021 842 6.6%
9:00-10:00 273 11 18 15 4 0 325 85 110 32 873 692 5.4%
10:00-11:00 278 17 10 7 10 0 605 115 130 10 1182 843 6.6%
11:00-12:00 220 12 16 13 4 0 600 105 101 0 1071 754 5.9%
12:00-13:00 265 8 9 9 5 1 595 125 115 0 1132 796 6.2%
13:00-14:00 300 6 16 10 5 0 735 150 125 0 1347 943 7.3%
14:00-15:00 310 12 14 12 5 0 805 205 145 0 1508 1057 8.2%
15:00-16:00 310 7 18 8 7 0 630 140 140 0 1260 904 7.0%
16:00-17:00 305 5 14 9 4 0 731 180 190 0 1438 986 7.7%
17:00-18:00 330 4 13 11 7 0 887 150 123 0 1525 1046 8.1%
18:00-19:00 270 5 15 8 2 0 883 220 210 0 1613 1068 8.3%
19:00-20:00 195 7 11 7 1 0 955 220 115 0 1511 985 7.7%
20:00-21:00 205 4 9 7 0 0 640 90 80 0 1035 684 5.3%
21:00-22:00 270 10 18 8 2 0 245 70 40 0 663 558 4.3%
22:00-23:00 98 0 0 6 1 0 88 23 0 0 216 180 1.4%
TOTAL 4172 136 217 157 66 1 9189 2073 1824 133 17968 12836 100.0%
8.3%

17
Traffic pre feasibility study for Indore metro (Appendix)
TABLE 11C
TABLE 11D
passenger count
DIRECTION SHASTRI BRIDGE TO TORI CORNER
TIME CAR 2WS MINI BUS BUS AUTO P CYCLE MAGIC TOTAL PEAK
7:00-8:00 243 371 105 518 290 88 421 2035 5.71%
8:00-9:00 176 312 183 317 123 51 131 1293 3.63%
9:00-10:00 239 383 169 506 236 110 180 1823 5.11%
10:00-11:00 396 812 183 338 193 80 180 2182 6.12%
11:00-12:00 392 660 123 245 264 163 186 2032 5.70%
12:00-13:00 274 831 90 520 309 145 152 2321 6.51%
13:00-14:00 457 1237 117 506 300 53 120 2790 7.82%
14:00-15:00 672 1011 158 684 102 79 80 2785 7.81%
15:00-16:00 616 1069 183 477 834 220 120 3518 9.87%
16:00-17:00 722 752 158 777 490 115 70 3084 8.65%
17:00-18:00 618 1107 263 620 324 217 360 3509 9.84%
18:00-19:00 832 727 202 592 196 35 131 2715 7.61%
19:00-20:00 625 616 158 570 143 54 0 2166 6.07%
20:00-21:00 476 519 100 340 139 61 0 1635 4.59%
21:00-22:00 398 553 36 180 77 90 0 1334 3.74%
22:00-23:00 224 196 0 0 17 0 0 436 1.22%
7359 11156 2226 7189 4035 1561 2132 35657 100.00%
passenger count
DIRECTION TORI CORNER TO SHASTRI BRIDGE
TIME CAR 2WS MINI BUS BUS AUTO P CYCLE MAGIC TOTAL PEAK
7:00-8:00 416 251 114 455 112 40 173 1560 3.95%
8:00-9:00 664 477 275 897 282 160 631 3386 8.56%
9:00-10:00 614 534 413 698 154 110 300 2822 7.14%
10:00-11:00 596 1034 234 383 193 130 83 2653 6.71%
11:00-12:00 472 1000 140 580 182 101 0 2475 6.26%
12:00-13:00 490 913 180 300 226 115 0 2224 5.63%
13:00-14:00 536 1056 150 540 239 125 0 2646 6.69%
14:00-15:00 608 1259 140 508 317 145 0 2977 7.53%
15:00-16:00 568 1035 193 648 264 140 0 2848 7.20%
16:00-17:00 582 1044 88 537 346 190 0 2786 7.05%
17:00-18:00 712 1400 300 504 235 123 0 3274 8.28%
18:00-19:00 596 1442 92 555 466 210 0 3362 8.50%
19:00-20:00 398 1439 123 367 372 115 0 2813 7.12%
20:00-21:00 414 949 100 259 164 80 0 1966 4.97%
21:00-22:00 469 359 40 396 109 40 0 1412 3.57%
22:00-23:00 165 124 0 0 38 0 0 327 0.83%
8299 14317 2579 7625 3699 1824 1187 39530 100.00%
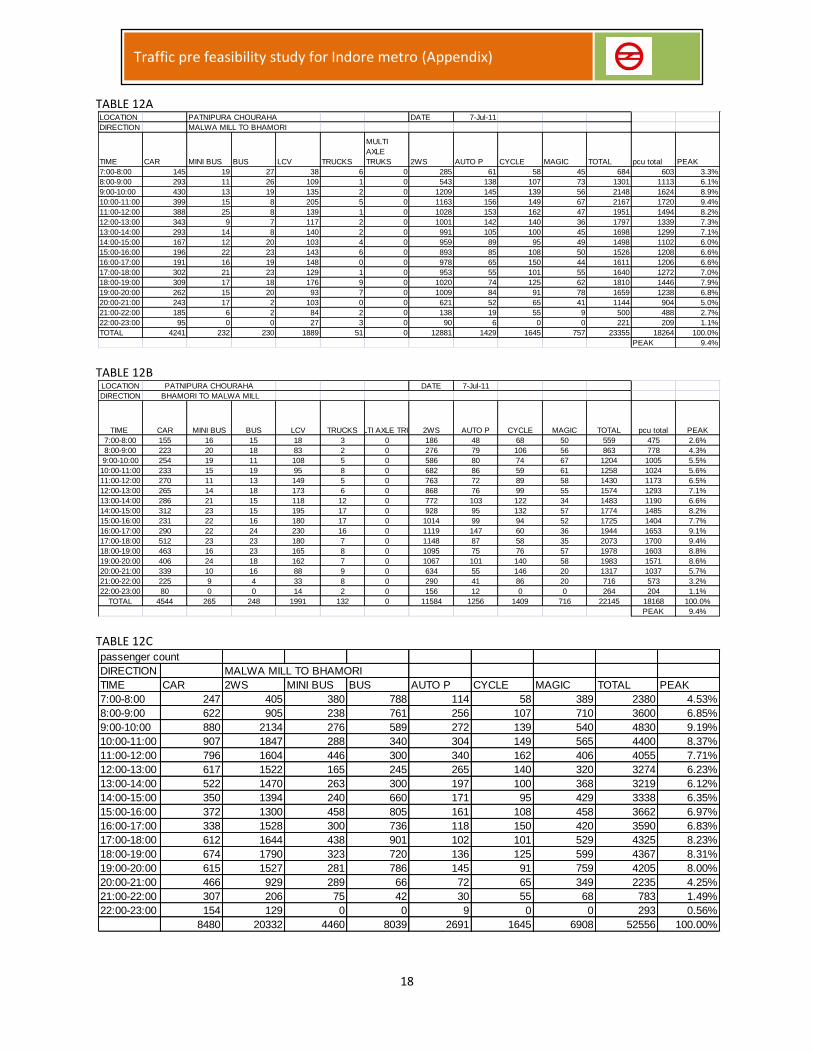
18
Traffic pre feasibility study for Indore metro (Appendix)
TABLE 12A
TABLE 12B
TABLE 12C
LOCATION PATNIPURA CHOURAHA DATE 7-Jul-11
DIRECTION MALWA MILL TO BHAMORI
TIME CAR MINI BUS BUS LCV TRUCKS
MULTI
AXLE
TRUKS 2WS AUTO P CYCLE MAGIC TOTAL pcu total PEAK
7:00-8:00 145 19 27 38 6 0 285 61 58 45 684 603 3.3%
8:00-9:00 293 11 26 109 1 0 543 138 107 73 1301 1113 6.1%
9:00-10:00 430 13 19 135 2 0 1209 145 139 56 2148 1624 8.9%
10:00-11:00 399 15 8 205 5 0 1163 156 149 67 2167 1720 9.4%
11:00-12:00 388 25 8 139 1 0 1028 153 162 47 1951 1494 8.2%
12:00-13:00 343 9 7 117 2 0 1001 142 140 36 1797 1339 7.3%
13:00-14:00 293 14 8 140 2 0 991 105 100 45 1698 1299 7.1%
14:00-15:00 167 12 20 103 4 0 959 89 95 49 1498 1102 6.0%
15:00-16:00 196 22 23 143 6 0 893 85 108 50 1526 1208 6.6%
16:00-17:00 191 16 19 148 0 0 978 65 150 44 1611 1206 6.6%
17:00-18:00 302 21 23 129 1 0 953 55 101 55 1640 1272 7.0%
18:00-19:00 309 17 18 176 9 0 1020 74 125 62 1810 1446 7.9%
19:00-20:00 262 15 20 93 7 0 1009 84 91 78 1659 1238 6.8%
20:00-21:00 243 17 2 103 0 0 621 52 65 41 1144 904 5.0%
21:00-22:00 185 6 2 84 2 0 138 19 55 9 500 488 2.7%
22:00-23:00 95 0 0 27 3 0 90 6 0 0 221 209 1.1%
TOTAL 4241 232 230 1889 51 0 12881 1429 1645 757 23355 18264 100.0%
PEAK 9.4%
LOCATION PATNIPURA CHOURAHA DATE 7-Jul-11
DIRECTION BHAMORI TO MALWA MILL
TIME CAR MINI BUS BUS LCV TRUCKSMULTI AXLE TRUKS2WS AUTO P CYCLE MAGIC TOTAL pcu total PEAK
7:00-8:00 155 16 15 18 3 0 186 48 68 50 559 475 2.6%
8:00-9:00 223 20 18 83 2 0 276 79 106 56 863 778 4.3%
9:00-10:00 254 19 11 108 5 0 586 80 74 67 1204 1005 5.5%
10:00-11:00 233 15 19 95 8 0 682 86 59 61 1258 1024 5.6%
11:00-12:00 270 11 13 149 5 0 763 72 89 58 1430 1173 6.5%
12:00-13:00 265 14 18 173 6 0 868 76 99 55 1574 1293 7.1%
13:00-14:00 286 21 15 118 12 0 772 103 122 34 1483 1190 6.6%
14:00-15:00 312 23 15 195 17 0 928 95 132 57 1774 1485 8.2%
15:00-16:00 231 22 16 180 17 0 1014 99 94 52 1725 1404 7.7%
16:00-17:00 290 22 24 230 16 0 1119 147 60 36 1944 1653 9.1%
17:00-18:00 512 23 23 180 7 0 1148 87 58 35 2073 1700 9.4%
18:00-19:00 463 16 23 165 8 0 1095 75 76 57 1978 1603 8.8%
19:00-20:00 406 24 18 162 7 0 1067 101 140 58 1983 1571 8.6%
20:00-21:00 339 10 16 88 9 0 634 55 146 20 1317 1037 5.7%
21:00-22:00 225 9 4 33 8 0 290 41 86 20 716 573 3.2%
22:00-23:00 80 0 0 14 2 0 156 12 0 0 264 204 1.1%
TOTAL 4544 265 248 1991 132 0 11584 1256 1409 716 22145 18168 100.0%
PEAK 9.4%
passenger count
DIRECTION MALWA MILL TO BHAMORI
TIME CAR 2WS MINI BUS BUS AUTO P CYCLE MAGIC TOTAL PEAK
7:00-8:00 247 405 380 788 114 58 389 2380 4.53%
8:00-9:00 622 905 238 761 256 107 710 3600 6.85%
9:00-10:00 880 2134 276 589 272 139 540 4830 9.19%
10:00-11:00 907 1847 288 340 304 149 565 4400 8.37%
11:00-12:00 796 1604 446 300 340 162 406 4055 7.71%
12:00-13:00 617 1522 165 245 265 140 320 3274 6.23%
13:00-14:00 522 1470 263 300 197 100 368 3219 6.12%
14:00-15:00 350 1394 240 660 171 95 429 3338 6.35%
15:00-16:00 372 1300 458 805 161 108 458 3662 6.97%
16:00-17:00 338 1528 300 736 118 150 420 3590 6.83%
17:00-18:00 612 1644 438 901 102 101 529 4325 8.23%
18:00-19:00 674 1790 323 720 136 125 599 4367 8.31%
19:00-20:00 615 1527 281 786 145 91 759 4205 8.00%
20:00-21:00 466 929 289 66 72 65 349 2235 4.25%
21:00-22:00 307 206 75 42 30 55 68 783 1.49%
22:00-23:00 154 129 0 0 9 0 0 293 0.56%
8480 20332 4460 8039 2691 1645 6908 52556 100.00%

19
Traffic pre feasibility study for Indore metro (Appendix)
TABLE 12D
TABLE 13A
TABLE 13B
passenger count
DIRECTION BHAMORI TO MALWA MILL
TIME CAR 2WS MINI BUS BUS AUTO P CYCLE MAGIC TOTAL PEAK
7:00-8:00 330 293 280 581 88 68 472 2112 4.07%
8:00-9:00 498 500 380 738 154 106 540 2916 5.62%
9:00-10:00 591 995 380 422 152 74 607 3221 6.21%
10:00-11:00 494 1189 319 741 152 59 569 3522 6.79%
11:00-12:00 473 1314 238 504 148 89 559 3325 6.41%
12:00-13:00 498 1432 263 684 112 99 487 3574 6.89%
13:00-14:00 516 1229 399 563 198 122 283 3310 6.38%
14:00-15:00 512 1392 441 581 165 132 468 3692 7.11%
15:00-16:00 414 1438 424 624 190 94 440 3624 6.98%
16:00-17:00 548 1613 403 900 200 60 320 4044 7.79%
17:00-18:00 952 1615 411 901 182 58 331 4449 8.57%
18:00-19:00 986 1855 340 936 138 76 550 4881 9.40%
19:00-20:00 856 1738 500 702 198 140 513 4647 8.95%
20:00-21:00 626 1035 213 520 106 146 163 2808 5.41%
21:00-22:00 391 453 135 84 74 86 160 1382 2.66%
22:00-23:00 136 240 0 0 20 0 0 396 0.76%
8820 18329 5125 9481 2275 1409 6462 51902 100.00%
LOCATION RACE COURSE ROAD NEAR IDA DATE 8-Jul-11
DIRECTION Y.N. ROAD TO A.B.ROAD
TIME CAR MINI BUS BUS LCV TRUCKS
MULTI
AXLE
TRUKS
2WS AUTO P CYCLE CYCLE RIKSHA TOTAL
pcu total PEAK
7:00-8:00 383 19 11 17 0 0 760 42 59 0 1291 914 2.8%
8:00-9:00 444 11 11 66 0 0 1497 206 78 0 2313 1600 4.8%
9:00-10:00 557 13 9 64 0 0 1710 284 87 0 2724 1895 5.7%
10:00-11:00 1129 15 11 61 0 0 2175 223 123 0 3737 2652 8.0%
11:00-12:00 1060 25 12 51 2 0 2415 159 52 0 3776 2619 7.9%
12:00-13:00 985 9 10 28 0 0 2500 195 85 0 3812 2553 7.7%
13:00-14:00 853 14 8 68 1 0 2045 137 48 0 3174 2208 6.7%
14:00-15:00 943 12 10 27 0 0 2035 118 58 0 3203 2195 6.6%
15:00-16:00 1064 22 8 64 0 0 1675 143 60 0 3036 2245 6.8%
16:00-17:00 1100 16 8 55 0 0 1630 240 65 0 3114 2330 7.0%
17:00-18:00 1308 21 9 52 0 0 2325 171 77 0 3963 2825 8.5%
18:00-19:00 1427 17 9 52 0 0 2020 134 61 0 3720 2743 8.3%
19:00-20:00 1250 15 12 53 0 0 2135 101 61 0 3627 2597 7.9%
20:00-21:00 838 17 9 92 3 0 1615 68 47 0 2689 1970 6.0%
21:00-22:00 630 6 7 60 2 0 984 84 40 0 1813 1372 4.1%
22:00-23:00 150 0 0 20 0 0 304 18 7 0 499 362 1.1%
TOTAL 14121 232 144 830 8 0 27825 2323 1008 0 46491 33081 100.0%
PEAK 8.5%
LOCATION RACE COURSE ROAD NEAR IDA DATE 8-Jul-11
DIRECTION A.B.ROAD TO Y.N.ROAD
TIME CAR MINI BUS BUS LCV TRUCKS
MULTI
AXLE
TRUKS
2WS AUTO P CYCLE CYCLE RIKSHA TOTAL pcu total PEAK
7:00-8:00 329 16 11 41 0 0 608 202 65 0 1272 990 3.1%
8:00-9:00 667 20 10 21 0 0 1088 144 62 0 2012 1472 4.6%
9:00-10:00 1057 19 11 38 0 0 1294 165 78 0 2662 2027 6.3%
10:00-11:00 1417 15 10 26 0 0 2356 192 101 0 4117 2920 9.1%
11:00-12:00 1081 11 8 36 0 0 3005 248 140 0 4529 2986 9.3%
12:00-13:00 947 14 9 58 0 0 3069 171 93 0 4361 2843 8.8%
13:00-14:00 834 21 8 57 4 0 2665 190 63 0 3842 2555 7.9%
14:00-15:00 910 23 11 85 0 0 1125 121 58 0 2333 1845 5.7%
15:00-16:00 958 22 8 63 0 0 1186 130 68 0 2435 1882 5.8%
16:00-17:00 904 22 8 59 1 0 1340 73 53 0 2460 1838 5.7%
17:00-18:00 1120 23 10 55 0 0 1935 278 58 0 3479 2554 7.9%
18:00-19:00 1154 16 9 60 0 0 2209 80 57 0 3585 2524 7.8%
19:00-20:00 920 24 10 47 0 0 1885 170 64 0 3120 2209 6.9%
20:00-21:00 748 10 9 19 3 0 1865 251 43 0 2948 2030 6.3%
21:00-22:00 275 9 4 20 0 0 1255 137 36 0 1736 1115 3.5%
22:00-23:00 127 0 0 16 3 0 375 43 0 0 564 399 1.2%
TOTAL 13448 265 136 701 11 0 27260 2595 1039 0 45455 32188 100.0%
PEAK 9.3%
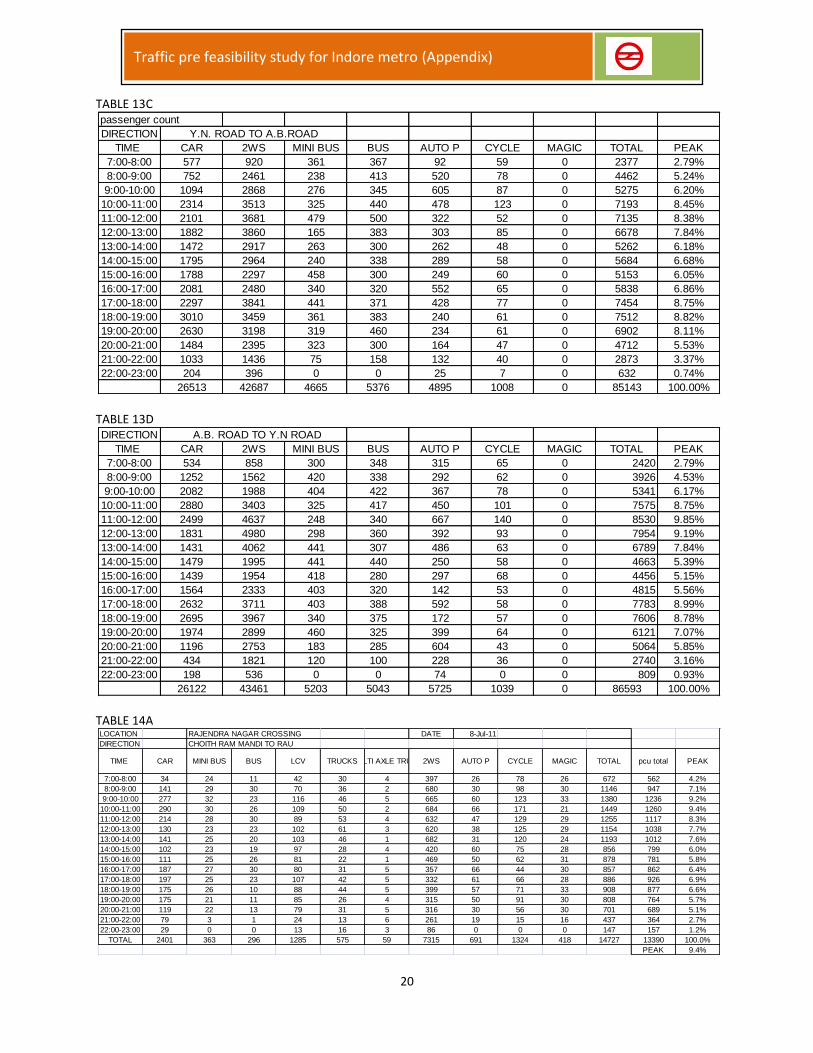
20
Traffic pre feasibility study for Indore metro (Appendix)
TABLE 13C
TABLE 13D
TABLE 14A
passenger count
DIRECTION Y.N. ROAD TO A.B.ROAD
TIME CAR 2WS MINI BUS BUS AUTO P CYCLE MAGIC TOTAL PEAK
7:00-8:00 577 920 361 367 92 59 0 2377 2.79%
8:00-9:00 752 2461 238 413 520 78 0 4462 5.24%
9:00-10:00 1094 2868 276 345 605 87 0 5275 6.20%
10:00-11:00 2314 3513 325 440 478 123 0 7193 8.45%
11:00-12:00 2101 3681 479 500 322 52 0 7135 8.38%
12:00-13:00 1882 3860 165 383 303 85 0 6678 7.84%
13:00-14:00 1472 2917 263 300 262 48 0 5262 6.18%
14:00-15:00 1795 2964 240 338 289 58 0 5684 6.68%
15:00-16:00 1788 2297 458 300 249 60 0 5153 6.05%
16:00-17:00 2081 2480 340 320 552 65 0 5838 6.86%
17:00-18:00 2297 3841 441 371 428 77 0 7454 8.75%
18:00-19:00 3010 3459 361 383 240 61 0 7512 8.82%
19:00-20:00 2630 3198 319 460 234 61 0 6902 8.11%
20:00-21:00 1484 2395 323 300 164 47 0 4712 5.53%
21:00-22:00 1033 1436 75 158 132 40 0 2873 3.37%
22:00-23:00 204 396 0 0 25 7 0 632 0.74%
26513 42687 4665 5376 4895 1008 0 85143 100.00%
DIRECTION A.B. ROAD TO Y.N ROAD
TIME CAR 2WS MINI BUS BUS AUTO P CYCLE MAGIC TOTAL PEAK
7:00-8:00 534 858 300 348 315 65 0 2420 2.79%
8:00-9:00 1252 1562 420 338 292 62 0 3926 4.53%
9:00-10:00 2082 1988 404 422 367 78 0 5341 6.17%
10:00-11:00 2880 3403 325 417 450 101 0 7575 8.75%
11:00-12:00 2499 4637 248 340 667 140 0 8530 9.85%
12:00-13:00 1831 4980 298 360 392 93 0 7954 9.19%
13:00-14:00 1431 4062 441 307 486 63 0 6789 7.84%
14:00-15:00 1479 1995 441 440 250 58 0 4663 5.39%
15:00-16:00 1439 1954 418 280 297 68 0 4456 5.15%
16:00-17:00 1564 2333 403 320 142 53 0 4815 5.56%
17:00-18:00 2632 3711 403 388 592 58 0 7783 8.99%
18:00-19:00 2695 3967 340 375 172 57 0 7606 8.78%
19:00-20:00 1974 2899 460 325 399 64 0 6121 7.07%
20:00-21:00 1196 2753 183 285 604 43 0 5064 5.85%
21:00-22:00 434 1821 120 100 228 36 0 2740 3.16%
22:00-23:00 198 536 0 0 74 0 0 809 0.93%
26122 43461 5203 5043 5725 1039 0 86593 100.00%
LOCATION RAJENDRA NAGAR CROSSING DATE 8-Jul-11
DIRECTION CHOITH RAM MANDI TO RAU
TIME CAR MINI BUS BUS LCV TRUCKSMULTI AXLE TRUKS2WS AUTO P CYCLE MAGIC TOTAL pcu total PEAK
7:00-8:00 34 24 11 42 30 4 397 26 78 26 672 562 4.2%
8:00-9:00 141 29 30 70 36 2 680 30 98 30 1146 947 7.1%
9:00-10:00 277 32 23 116 46 5 665 60 123 33 1380 1236 9.2%
10:00-11:00 290 30 26 109 50 2 684 66 171 21 1449 1260 9.4%
11:00-12:00 214 28 30 89 53 4 632 47 129 29 1255 1117 8.3%
12:00-13:00 130 23 23 102 61 3 620 38 125 29 1154 1038 7.7%
13:00-14:00 141 25 20 103 46 1 682 31 120 24 1193 1012 7.6%
14:00-15:00 102 23 19 97 28 4 420 60 75 28 856 799 6.0%
15:00-16:00 111 25 26 81 22 1 469 50 62 31 878 781 5.8%
16:00-17:00 187 27 30 80 31 5 357 66 44 30 857 862 6.4%
17:00-18:00 197 25 23 107 42 5 332 61 66 28 886 926 6.9%
18:00-19:00 175 26 10 88 44 5 399 57 71 33 908 877 6.6%
19:00-20:00 175 21 11 85 26 4 315 50 91 30 808 764 5.7%
20:00-21:00 119 22 13 79 31 5 316 30 56 30 701 689 5.1%
21:00-22:00 79 3 1 24 13 6 261 19 15 16 437 364 2.7%
22:00-23:00 29 0 0 13 16 3 86 0 0 0 147 157 1.2%
TOTAL 2401 363 296 1285 575 59 7315 691 1324 418 14727 13390 100.0%
PEAK 9.4%
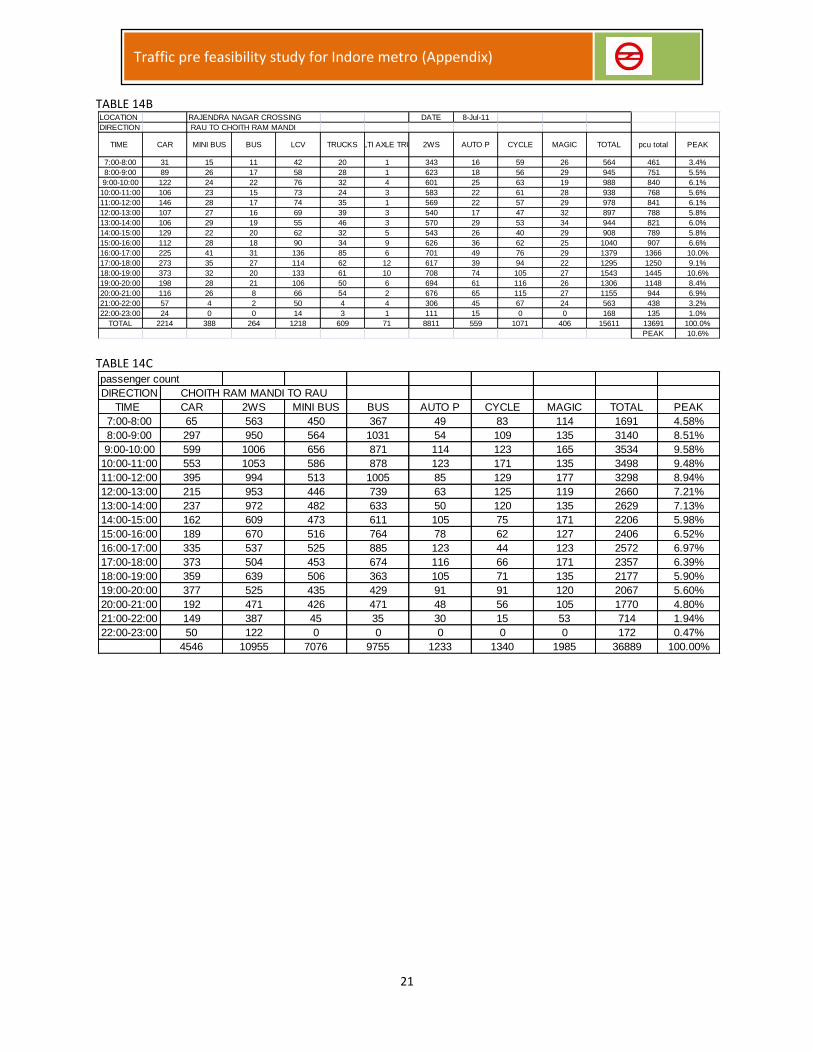
21
Traffic pre feasibility study for Indore metro (Appendix)
TABLE 14B
TABLE 14C
LOCATION RAJENDRA NAGAR CROSSING DATE 8-Jul-11
DIRECTION RAU TO CHOITH RAM MANDI
TIME CAR MINI BUS BUS LCV TRUCKSMULTI AXLE TRUKS2WS AUTO P CYCLE MAGIC TOTAL pcu total PEAK
7:00-8:00 31 15 11 42 20 1 343 16 59 26 564 461 3.4%
8:00-9:00 89 26 17 58 28 1 623 18 56 29 945 751 5.5%
9:00-10:00 122 24 22 76 32 4 601 25 63 19 988 840 6.1%
10:00-11:00 106 23 15 73 24 3 583 22 61 28 938 768 5.6%
11:00-12:00 146 28 17 74 35 1 569 22 57 29 978 841 6.1%
12:00-13:00 107 27 16 69 39 3 540 17 47 32 897 788 5.8%
13:00-14:00 106 29 19 55 46 3 570 29 53 34 944 821 6.0%
14:00-15:00 129 22 20 62 32 5 543 26 40 29 908 789 5.8%
15:00-16:00 112 28 18 90 34 9 626 36 62 25 1040 907 6.6%
16:00-17:00 225 41 31 136 85 6 701 49 76 29 1379 1366 10.0%
17:00-18:00 273 35 27 114 62 12 617 39 94 22 1295 1250 9.1%
18:00-19:00 373 32 20 133 61 10 708 74 105 27 1543 1445 10.6%
19:00-20:00 198 28 21 106 50 6 694 61 116 26 1306 1148 8.4%
20:00-21:00 116 26 8 66 54 2 676 65 115 27 1155 944 6.9%
21:00-22:00 57 4 2 50 4 4 306 45 67 24 563 438 3.2%
22:00-23:00 24 0 0 14 3 1 111 15 0 0 168 135 1.0%
TOTAL 2214 388 264 1218 609 71 8811 559 1071 406 15611 13691 100.0%
PEAK 10.6%
passenger count
DIRECTION CHOITH RAM MANDI TO RAU
TIME CAR 2WS MINI BUS BUS AUTO P CYCLE MAGIC TOTAL PEAK
7:00-8:00 65 563 450 367 49 83 114 1691 4.58%
8:00-9:00 297 950 564 1031 54 109 135 3140 8.51%
9:00-10:00 599 1006 656 871 114 123 165 3534 9.58%
10:00-11:00 553 1053 586 878 123 171 135 3498 9.48%
11:00-12:00 395 994 513 1005 85 129 177 3298 8.94%
12:00-13:00 215 953 446 739 63 125 119 2660 7.21%
13:00-14:00 237 972 482 633 50 120 135 2629 7.13%
14:00-15:00 162 609 473 611 105 75 171 2206 5.98%
15:00-16:00 189 670 516 764 78 62 127 2406 6.52%
16:00-17:00 335 537 525 885 123 44 123 2572 6.97%
17:00-18:00 373 504 453 674 116 66 171 2357 6.39%
18:00-19:00 359 639 506 363 105 71 135 2177 5.90%
19:00-20:00 377 525 435 429 91 91 120 2067 5.60%
20:00-21:00 192 471 426 471 48 56 105 1770 4.80%
21:00-22:00 149 387 45 35 30 15 53 714 1.94%
22:00-23:00 50 122 0 0 0 0 0 172 0.47%
4546 10955 7076 9755 1233 1340 1985 36889 100.00%
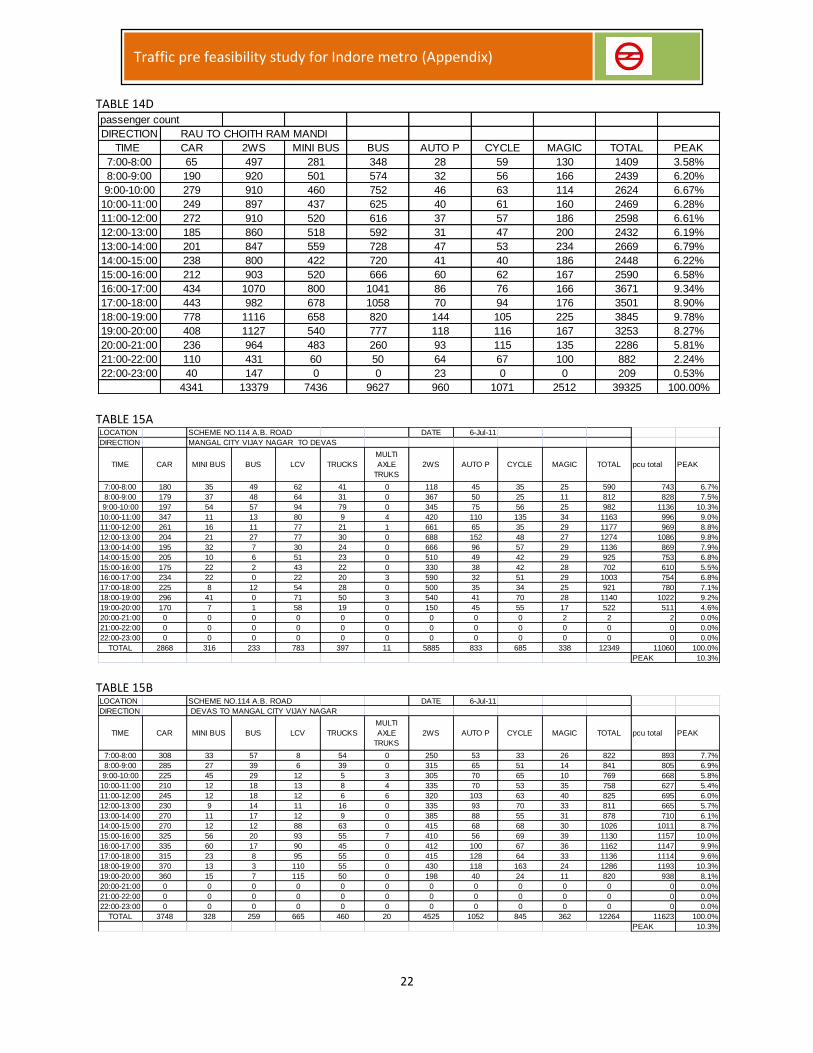
22
Traffic pre feasibility study for Indore metro (Appendix)
TABLE 14D
TABLE 15A
TABLE 15B
passenger count
DIRECTION RAU TO CHOITH RAM MANDI
TIME CAR 2WS MINI BUS BUS AUTO P CYCLE MAGIC TOTAL PEAK
7:00-8:00 65 497 281 348 28 59 130 1409 3.58%
8:00-9:00 190 920 501 574 32 56 166 2439 6.20%
9:00-10:00 279 910 460 752 46 63 114 2624 6.67%
10:00-11:00 249 897 437 625 40 61 160 2469 6.28%
11:00-12:00 272 910 520 616 37 57 186 2598 6.61%
12:00-13:00 185 860 518 592 31 47 200 2432 6.19%
13:00-14:00 201 847 559 728 47 53 234 2669 6.79%
14:00-15:00 238 800 422 720 41 40 186 2448 6.22%
15:00-16:00 212 903 520 666 60 62 167 2590 6.58%
16:00-17:00 434 1070 800 1041 86 76 166 3671 9.34%
17:00-18:00 443 982 678 1058 70 94 176 3501 8.90%
18:00-19:00 778 1116 658 820 144 105 225 3845 9.78%
19:00-20:00 408 1127 540 777 118 116 167 3253 8.27%
20:00-21:00 236 964 483 260 93 115 135 2286 5.81%
21:00-22:00 110 431 60 50 64 67 100 882 2.24%
22:00-23:00 40 147 0 0 23 0 0 209 0.53%
4341 13379 7436 9627 960 1071 2512 39325 100.00%
LOCATION SCHEME NO.114 A.B. ROAD DATE 6-Jul-11
DIRECTION MANGAL CITY VIJAY NAGAR TO DEVAS
TIME CAR MINI BUS BUS LCV TRUCKS
MULTI
AXLE
TRUKS
2WS AUTO P CYCLE MAGIC TOTAL pcu total PEAK
7:00-8:00 180 35 49 62 41 0 118 45 35 25 590 743 6.7%
8:00-9:00 179 37 48 64 31 0 367 50 25 11 812 828 7.5%
9:00-10:00 197 54 57 94 79 0 345 75 56 25 982 1136 10.3%
10:00-11:00 347 11 13 80 9 4 420 110 135 34 1163 996 9.0%
11:00-12:00 261 16 11 77 21 1 661 65 35 29 1177 969 8.8%
12:00-13:00 204 21 27 77 30 0 688 152 48 27 1274 1086 9.8%
13:00-14:00 195 32 7 30 24 0 666 96 57 29 1136 869 7.9%
14:00-15:00 205 10 6 51 23 0 510 49 42 29 925 753 6.8%
15:00-16:00 175 22 2 43 22 0 330 38 42 28 702 610 5.5%
16:00-17:00 234 22 0 22 20 3 590 32 51 29 1003 754 6.8%
17:00-18:00 225 8 12 54 28 0 500 35 34 25 921 780 7.1%
18:00-19:00 296 41 0 71 50 3 540 41 70 28 1140 1022 9.2%
19:00-20:00 170 7 1 58 19 0 150 45 55 17 522 511 4.6%
20:00-21:00 0 0 0 0 0 0 0 0 0 2 2 2 0.0%
21:00-22:00 0 0 0 0 0 0 0 0 0 0 0 0 0.0%
22:00-23:00 0 0 0 0 0 0 0 0 0 0 0 0 0.0%
TOTAL 2868 316 233 783 397 11 5885 833 685 338 12349 11060 100.0%
PEAK 10.3%
LOCATION SCHEME NO.114 A.B. ROAD DATE 6-Jul-11
DIRECTION DEVAS TO MANGAL CITY VIJAY NAGAR
TIME CAR MINI BUS BUS LCV TRUCKS
MULTI
AXLE
TRUKS
2WS AUTO P CYCLE MAGIC TOTAL pcu total PEAK
7:00-8:00 308 33 57 8 54 0 250 53 33 26 822 893 7.7%
8:00-9:00 285 27 39 6 39 0 315 65 51 14 841 805 6.9%
9:00-10:00 225 45 29 12 5 3 305 70 65 10 769 668 5.8%
10:00-11:00 210 12 18 13 8 4 335 70 53 35 758 627 5.4%
11:00-12:00 245 12 18 12 6 6 320 103 63 40 825 695 6.0%
12:00-13:00 230 9 14 11 16 0 335 93 70 33 811 665 5.7%
13:00-14:00 270 11 17 12 9 0 385 88 55 31 878 710 6.1%
14:00-15:00 270 12 12 88 63 0 415 68 68 30 1026 1011 8.7%
15:00-16:00 325 56 20 93 55 7 410 56 69 39 1130 1157 10.0%
16:00-17:00 335 60 17 90 45 0 412 100 67 36 1162 1147 9.9%
17:00-18:00 315 23 8 95 55 0 415 128 64 33 1136 1114 9.6%
18:00-19:00 370 13 3 110 55 0 430 118 163 24 1286 1193 10.3%
19:00-20:00 360 15 7 115 50 0 198 40 24 11 820 938 8.1%
20:00-21:00 0 0 0 0 0 0 0 0 0 0 0 0 0.0%
21:00-22:00 0 0 0 0 0 0 0 0 0 0 0 0 0.0%
22:00-23:00 0 0 0 0 0 0 0 0 0 0 0 0 0.0%
TOTAL 3748 328 259 665 460 20 4525 1052 845 362 12264 11623 100.0%
PEAK 10.3%
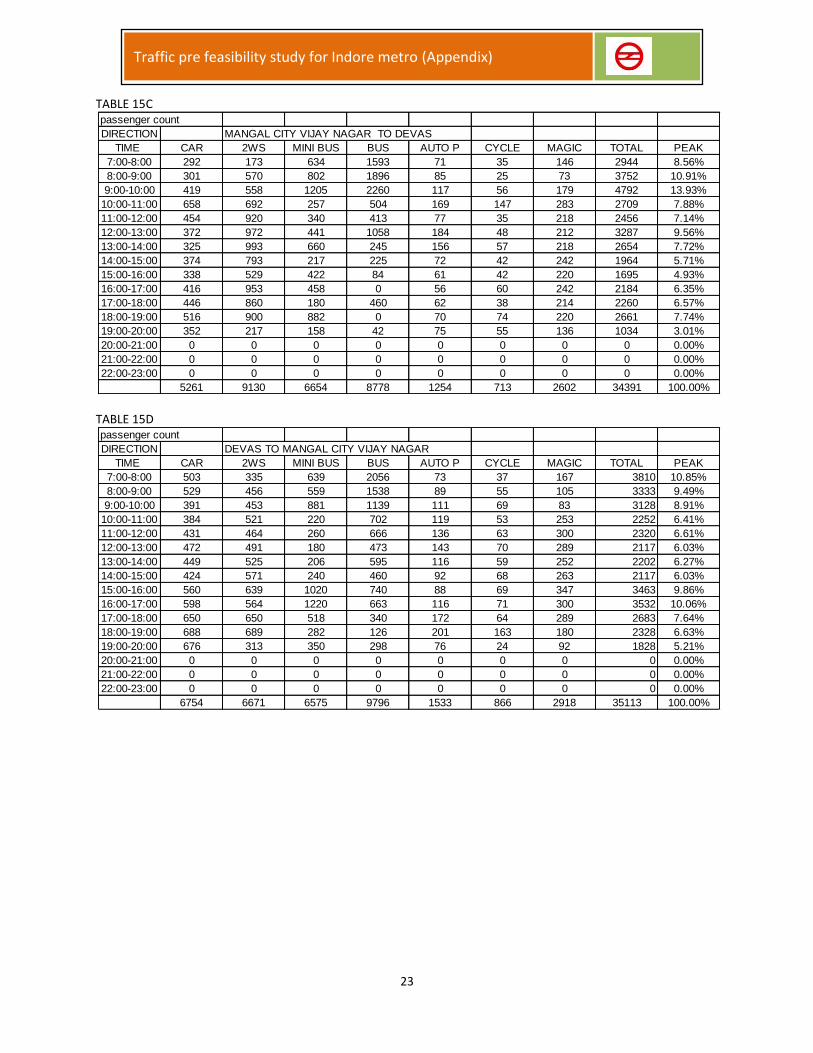
23
Traffic pre feasibility study for Indore metro (Appendix)
TABLE 15C
TABLE 15D
passenger count
DIRECTION MANGAL CITY VIJAY NAGAR TO DEVAS
TIME CAR 2WS MINI BUS BUS AUTO P CYCLE MAGIC TOTAL PEAK
7:00-8:00 292 173 634 1593 71 35 146 2944 8.56%
8:00-9:00 301 570 802 1896 85 25 73 3752 10.91%
9:00-10:00 419 558 1205 2260 117 56 179 4792 13.93%
10:00-11:00 658 692 257 504 169 147 283 2709 7.88%
11:00-12:00 454 920 340 413 77 35 218 2456 7.14%
12:00-13:00 372 972 441 1058 184 48 212 3287 9.56%
13:00-14:00 325 993 660 245 156 57 218 2654 7.72%
14:00-15:00 374 793 217 225 72 42 242 1964 5.71%
15:00-16:00 338 529 422 84 61 42 220 1695 4.93%
16:00-17:00 416 953 458 0 56 60 242 2184 6.35%
17:00-18:00 446 860 180 460 62 38 214 2260 6.57%
18:00-19:00 516 900 882 0 70 74 220 2661 7.74%
19:00-20:00 352 217 158 42 75 55 136 1034 3.01%
20:00-21:00 0 0 0 0 0 0 0 0 0.00%
21:00-22:00 0 0 0 0 0 0 0 0 0.00%
22:00-23:00 0 0 0 0 0 0 0 0 0.00%
5261 9130 6654 8778 1254 713 2602 34391 100.00%
passenger count
DIRECTION DEVAS TO MANGAL CITY VIJAY NAGAR
TIME CAR 2WS MINI BUS BUS AUTO P CYCLE MAGIC TOTAL PEAK
7:00-8:00 503 335 639 2056 73 37 167 3810 10.85%
8:00-9:00 529 456 559 1538 89 55 105 3333 9.49%
9:00-10:00 391 453 881 1139 111 69 83 3128 8.91%
10:00-11:00 384 521 220 702 119 53 253 2252 6.41%
11:00-12:00 431 464 260 666 136 63 300 2320 6.61%
12:00-13:00 472 491 180 473 143 70 289 2117 6.03%
13:00-14:00 449 525 206 595 116 59 252 2202 6.27%
14:00-15:00 424 571 240 460 92 68 263 2117 6.03%
15:00-16:00 560 639 1020 740 88 69 347 3463 9.86%
16:00-17:00 598 564 1220 663 116 71 300 3532 10.06%
17:00-18:00 650 650 518 340 172 64 289 2683 7.64%
18:00-19:00 688 689 282 126 201 163 180 2328 6.63%
19:00-20:00 676 313 350 298 76 24 92 1828 5.21%
20:00-21:00 0 0 0 0 0 0 0 0 0.00%
21:00-22:00 0 0 0 0 0 0 0 0 0.00%
22:00-23:00 0 0 0 0 0 0 0 0 0.00%
6754 6671 6575 9796 1533 866 2918 35113 100.00%
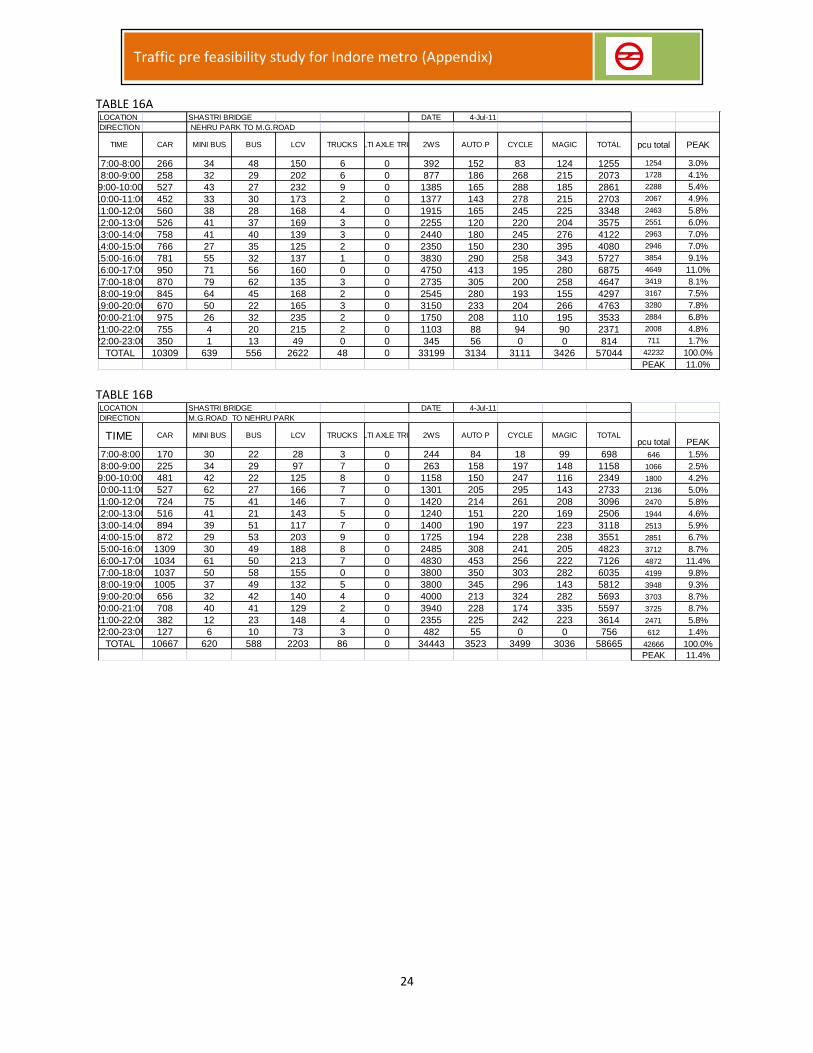
24
Traffic pre feasibility study for Indore metro (Appendix)
TABLE 16A
TABLE 16B
LOCATION SHASTRI BRIDGE DATE 4-Jul-11
DIRECTION NEHRU PARK TO M.G.ROAD
TIME CAR MINI BUS BUS LCV TRUCKSMULTI AXLE TRUKS2WS AUTO P CYCLE MAGIC TOTAL pcu total PEAK
7:00-8:00 266 34 48 150 6 0 392 152 83 124 1255 1254 3.0%
8:00-9:00 258 32 29 202 6 0 877 186 268 215 2073 1728 4.1%
9:00-10:00 527 43 27 232 9 0 1385 165 288 185 2861 2288 5.4%
10:00-11:00 452 33 30 173 2 0 1377 143 278 215 2703 2067 4.9%
11:00-12:00 560 38 28 168 4 0 1915 165 245 225 3348 2463 5.8%
12:00-13:00 526 41 37 169 3 0 2255 120 220 204 3575 2551 6.0%
13:00-14:00 758 41 40 139 3 0 2440 180 245 276 4122 2963 7.0%
14:00-15:00 766 27 35 125 2 0 2350 150 230 395 4080 2946 7.0%
15:00-16:00 781 55 32 137 1 0 3830 290 258 343 5727 3854 9.1%
16:00-17:00 950 71 56 160 0 0 4750 413 195 280 6875 4649 11.0%
17:00-18:00 870 79 62 135 3 0 2735 305 200 258 4647 3419 8.1%
18:00-19:00 845 64 45 168 2 0 2545 280 193 155 4297 3167 7.5%
19:00-20:00 670 50 22 165 3 0 3150 233 204 266 4763 3280 7.8%
20:00-21:00 975 26 32 235 2 0 1750 208 110 195 3533 2884 6.8%
21:00-22:00 755 4 20 215 2 0 1103 88 94 90 2371 2008 4.8%
22:00-23:00 350 1 13 49 0 0 345 56 0 0 814 711 1.7%
TOTAL 10309 639 556 2622 48 0 33199 3134 3111 3426 57044 42232 100.0%
PEAK 11.0%
LOCATION SHASTRI BRIDGE DATE 4-Jul-11
DIRECTION M.G.ROAD TO NEHRU PARK
TIME CAR MINI BUS BUS LCV TRUCKSMULTI AXLE TRUKS2WS AUTO P CYCLE MAGIC TOTALpcu total PEAK
7:00-8:00 170 30 22 28 3 0 244 84 18 99 698 646 1.5%
8:00-9:00 225 34 29 97 7 0 263 158 197 148 1158 1066 2.5%
9:00-10:00 481 42 22 125 8 0 1158 150 247 116 2349 1800 4.2%
10:00-11:00 527 62 27 166 7 0 1301 205 295 143 2733 2136 5.0%
11:00-12:00 724 75 41 146 7 0 1420 214 261 208 3096 2470 5.8%
12:00-13:00 516 41 21 143 5 0 1240 151 220 169 2506 1944 4.6%
13:00-14:00 894 39 51 117 7 0 1400 190 197 223 3118 2513 5.9%
14:00-15:00 872 29 53 203 9 0 1725 194 228 238 3551 2851 6.7%
15:00-16:00 1309 30 49 188 8 0 2485 308 241 205 4823 3712 8.7%
16:00-17:00 1034 61 50 213 7 0 4830 453 256 222 7126 4872 11.4%
17:00-18:00 1037 50 58 155 0 0 3800 350 303 282 6035 4199 9.8%
18:00-19:00 1005 37 49 132 5 0 3800 345 296 143 5812 3948 9.3%
19:00-20:00 656 32 42 140 4 0 4000 213 324 282 5693 3703 8.7%
20:00-21:00 708 40 41 129 2 0 3940 228 174 335 5597 3725 8.7%
21:00-22:00 382 12 23 148 4 0 2355 225 242 223 3614 2471 5.8%
22:00-23:00 127 6 10 73 3 0 482 55 0 0 756 612 1.4%
TOTAL 10667 620 588 2203 86 0 34443 3523 3499 3036 58665 42666 100.0%
PEAK 11.4%
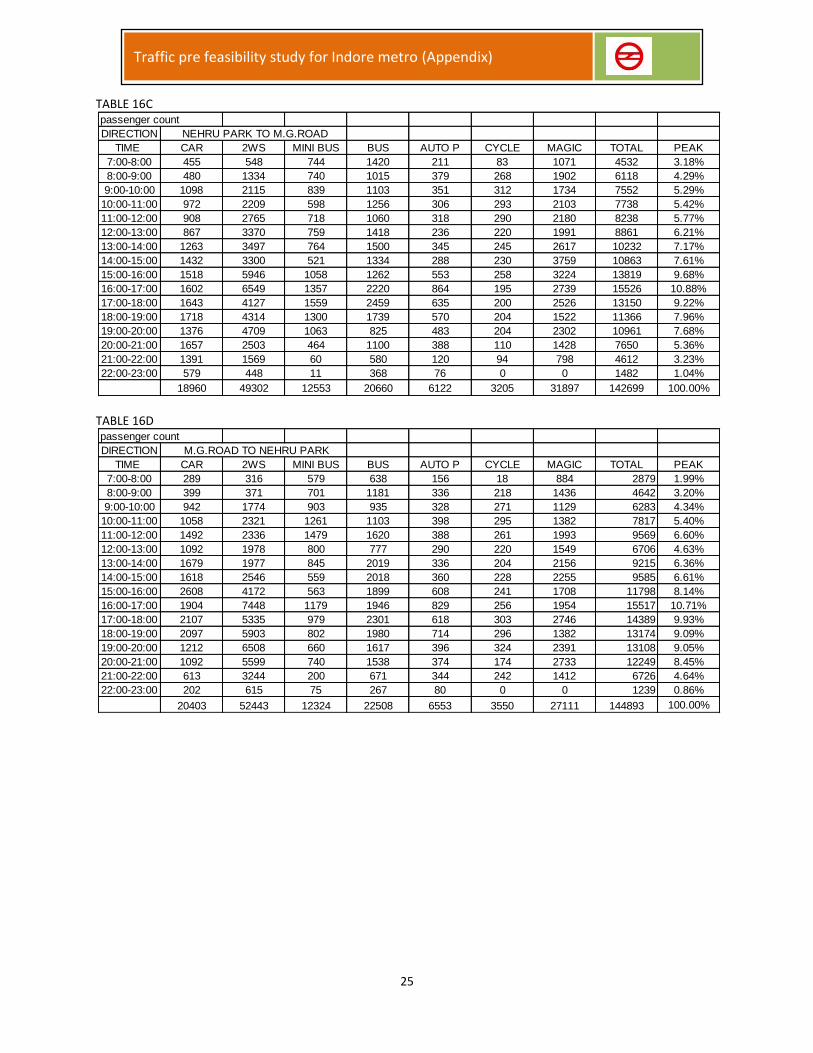
25
Traffic pre feasibility study for Indore metro (Appendix)
TABLE 16C
TABLE 16D
passenger count
DIRECTION NEHRU PARK TO M.G.ROAD
TIME CAR 2WS MINI BUS BUS AUTO P CYCLE MAGIC TOTAL PEAK
7:00-8:00 455 548 744 1420 211 83 1071 4532 3.18%
8:00-9:00 480 1334 740 1015 379 268 1902 6118 4.29%
9:00-10:00 1098 2115 839 1103 351 312 1734 7552 5.29%
10:00-11:00 972 2209 598 1256 306 293 2103 7738 5.42%
11:00-12:00 908 2765 718 1060 318 290 2180 8238 5.77%
12:00-13:00 867 3370 759 1418 236 220 1991 8861 6.21%
13:00-14:00 1263 3497 764 1500 345 245 2617 10232 7.17%
14:00-15:00 1432 3300 521 1334 288 230 3759 10863 7.61%
15:00-16:00 1518 5946 1058 1262 553 258 3224 13819 9.68%
16:00-17:00 1602 6549 1357 2220 864 195 2739 15526 10.88%
17:00-18:00 1643 4127 1559 2459 635 200 2526 13150 9.22%
18:00-19:00 1718 4314 1300 1739 570 204 1522 11366 7.96%
19:00-20:00 1376 4709 1063 825 483 204 2302 10961 7.68%
20:00-21:00 1657 2503 464 1100 388 110 1428 7650 5.36%
21:00-22:00 1391 1569 60 580 120 94 798 4612 3.23%
22:00-23:00 579 448 11 368 76 0 0 1482 1.04%
18960 49302 12553 20660 6122 3205 31897 142699 100.00%
passenger count
DIRECTION M.G.ROAD TO NEHRU PARK
TIME CAR 2WS MINI BUS BUS AUTO P CYCLE MAGIC TOTAL PEAK
7:00-8:00 289 316 579 638 156 18 884 2879 1.99%
8:00-9:00 399 371 701 1181 336 218 1436 4642 3.20%
9:00-10:00 942 1774 903 935 328 271 1129 6283 4.34%
10:00-11:00 1058 2321 1261 1103 398 295 1382 7817 5.40%
11:00-12:00 1492 2336 1479 1620 388 261 1993 9569 6.60%
12:00-13:00 1092 1978 800 777 290 220 1549 6706 4.63%
13:00-14:00 1679 1977 845 2019 336 204 2156 9215 6.36%
14:00-15:00 1618 2546 559 2018 360 228 2255 9585 6.61%
15:00-16:00 2608 4172 563 1899 608 241 1708 11798 8.14%
16:00-17:00 1904 7448 1179 1946 829 256 1954 15517 10.71%
17:00-18:00 2107 5335 979 2301 618 303 2746 14389 9.93%
18:00-19:00 2097 5903 802 1980 714 296 1382 13174 9.09%
19:00-20:00 1212 6508 660 1617 396 324 2391 13108 9.05%
20:00-21:00 1092 5599 740 1538 374 174 2733 12249 8.45%
21:00-22:00 613 3244 200 671 344 242 1412 6726 4.64%
22:00-23:00 202 615 75 267 80 0 0 1239 0.86%
20403 52443 12324 22508 6553 3550 27111 144893 100.00%
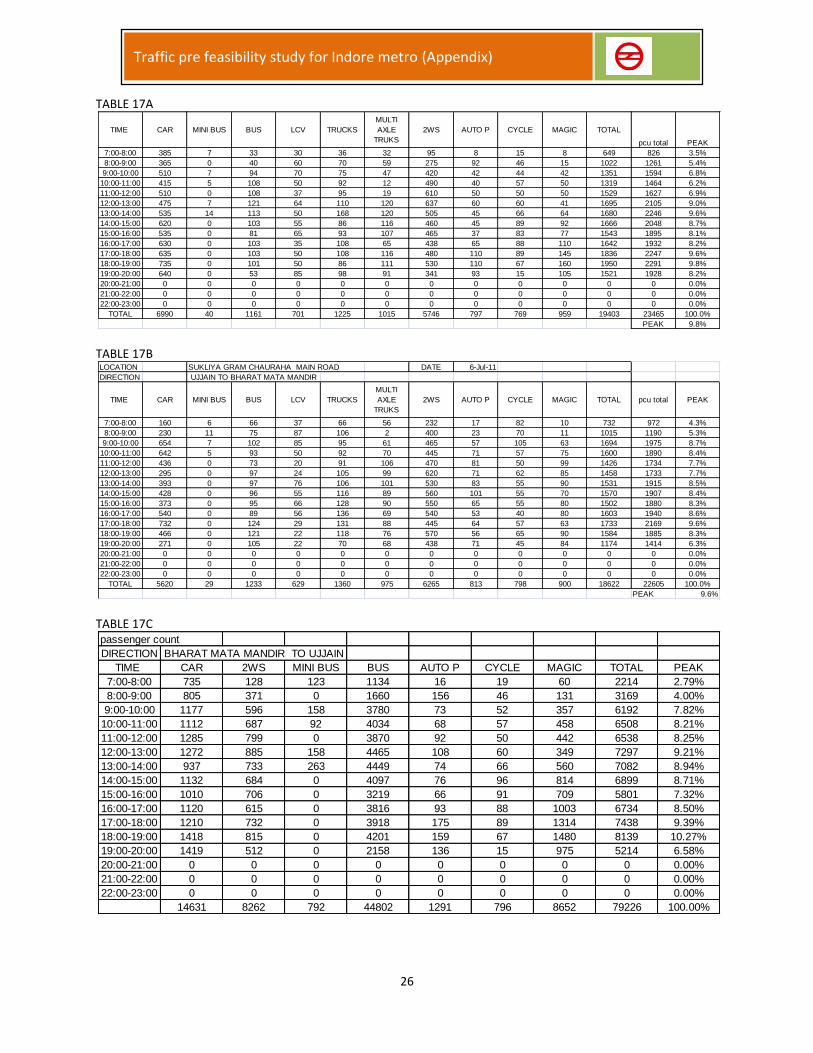
26
Traffic pre feasibility study for Indore metro (Appendix)
TABLE 17A
TABLE 17B
TABLE 17C
TIME CAR MINI BUS BUS LCV TRUCKS
MULTI
AXLE
TRUKS
2WS AUTO P CYCLE MAGIC TOTAL
pcu total PEAK
7:00-8:00 385 7 33 30 36 32 95 8 15 8 649 826 3.5%
8:00-9:00 365 0 40 60 70 59 275 92 46 15 1022 1261 5.4%
9:00-10:00 510 7 94 70 75 47 420 42 44 42 1351 1594 6.8%
10:00-11:00 415 5 108 50 92 12 490 40 57 50 1319 1464 6.2%
11:00-12:00 510 0 108 37 95 19 610 50 50 50 1529 1627 6.9%
12:00-13:00 475 7 121 64 110 120 637 60 60 41 1695 2105 9.0%
13:00-14:00 535 14 113 50 168 120 505 45 66 64 1680 2246 9.6%
14:00-15:00 620 0 103 55 86 116 460 45 89 92 1666 2048 8.7%
15:00-16:00 535 0 81 65 93 107 465 37 83 77 1543 1895 8.1%
16:00-17:00 630 0 103 35 108 65 438 65 88 110 1642 1932 8.2%
17:00-18:00 635 0 103 50 108 116 480 110 89 145 1836 2247 9.6%
18:00-19:00 735 0 101 50 86 111 530 110 67 160 1950 2291 9.8%
19:00-20:00 640 0 53 85 98 91 341 93 15 105 1521 1928 8.2%
20:00-21:00 0 0 0 0 0 0 0 0 0 0 0 0 0.0%
21:00-22:00 0 0 0 0 0 0 0 0 0 0 0 0 0.0%
22:00-23:00 0 0 0 0 0 0 0 0 0 0 0 0 0.0%
TOTAL 6990 40 1161 701 1225 1015 5746 797 769 959 19403 23465 100.0%
PEAK 9.8%
LOCATION SUKLIYA GRAM CHAURAHA MAIN ROAD DATE 6-Jul-11
DIRECTION UJJAIN TO BHARAT MATA MANDIR
TIME CAR MINI BUS BUS LCV TRUCKS
MULTI
AXLE
TRUKS
2WS AUTO P CYCLE MAGIC TOTAL pcu total PEAK
7:00-8:00 160 6 66 37 66 56 232 17 82 10 732 972 4.3%
8:00-9:00 230 11 75 87 106 2 400 23 70 11 1015 1190 5.3%
9:00-10:00 654 7 102 85 95 61 465 57 105 63 1694 1975 8.7%
10:00-11:00 642 5 93 50 92 70 445 71 57 75 1600 1890 8.4%
11:00-12:00 436 0 73 20 91 106 470 81 50 99 1426 1734 7.7%
12:00-13:00 295 0 97 24 105 99 620 71 62 85 1458 1733 7.7%
13:00-14:00 393 0 97 76 106 101 530 83 55 90 1531 1915 8.5%
14:00-15:00 428 0 96 55 116 89 560 101 55 70 1570 1907 8.4%
15:00-16:00 373 0 95 66 128 90 550 65 55 80 1502 1880 8.3%
16:00-17:00 540 0 89 56 136 69 540 53 40 80 1603 1940 8.6%
17:00-18:00 732 0 124 29 131 88 445 64 57 63 1733 2169 9.6%
18:00-19:00 466 0 121 22 118 76 570 56 65 90 1584 1885 8.3%
19:00-20:00 271 0 105 22 70 68 438 71 45 84 1174 1414 6.3%
20:00-21:00 0 0 0 0 0 0 0 0 0 0 0 0 0.0%
21:00-22:00 0 0 0 0 0 0 0 0 0 0 0 0 0.0%
22:00-23:00 0 0 0 0 0 0 0 0 0 0 0 0 0.0%
TOTAL 5620 29 1233 629 1360 975 6265 813 798 900 18622 22605 100.0%
PEAK 9.6%
passenger count
DIRECTION BHARAT MATA MANDIR TO UJJAIN
TIME CAR 2WS MINI BUS BUS AUTO P CYCLE MAGIC TOTAL PEAK
7:00-8:00 735 128 123 1134 16 19 60 2214 2.79%
8:00-9:00 805 371 0 1660 156 46 131 3169 4.00%
9:00-10:00 1177 596 158 3780 73 52 357 6192 7.82%
10:00-11:00 1112 687 92 4034 68 57 458 6508 8.21%
11:00-12:00 1285 799 0 3870 92 50 442 6538 8.25%
12:00-13:00 1272 885 158 4465 108 60 349 7297 9.21%
13:00-14:00 937 733 263 4449 74 66 560 7082 8.94%
14:00-15:00 1132 684 0 4097 76 96 814 6899 8.71%
15:00-16:00 1010 706 0 3219 66 91 709 5801 7.32%
16:00-17:00 1120 615 0 3816 93 88 1003 6734 8.50%
17:00-18:00 1210 732 0 3918 175 89 1314 7438 9.39%
18:00-19:00 1418 815 0 4201 159 67 1480 8139 10.27%
19:00-20:00 1419 512 0 2158 136 15 975 5214 6.58%
20:00-21:00 0 0 0 0 0 0 0 0 0.00%
21:00-22:00 0 0 0 0 0 0 0 0 0.00%
22:00-23:00 0 0 0 0 0 0 0 0 0.00%
14631 8262 792 44802 1291 796 8652 79226 100.00%
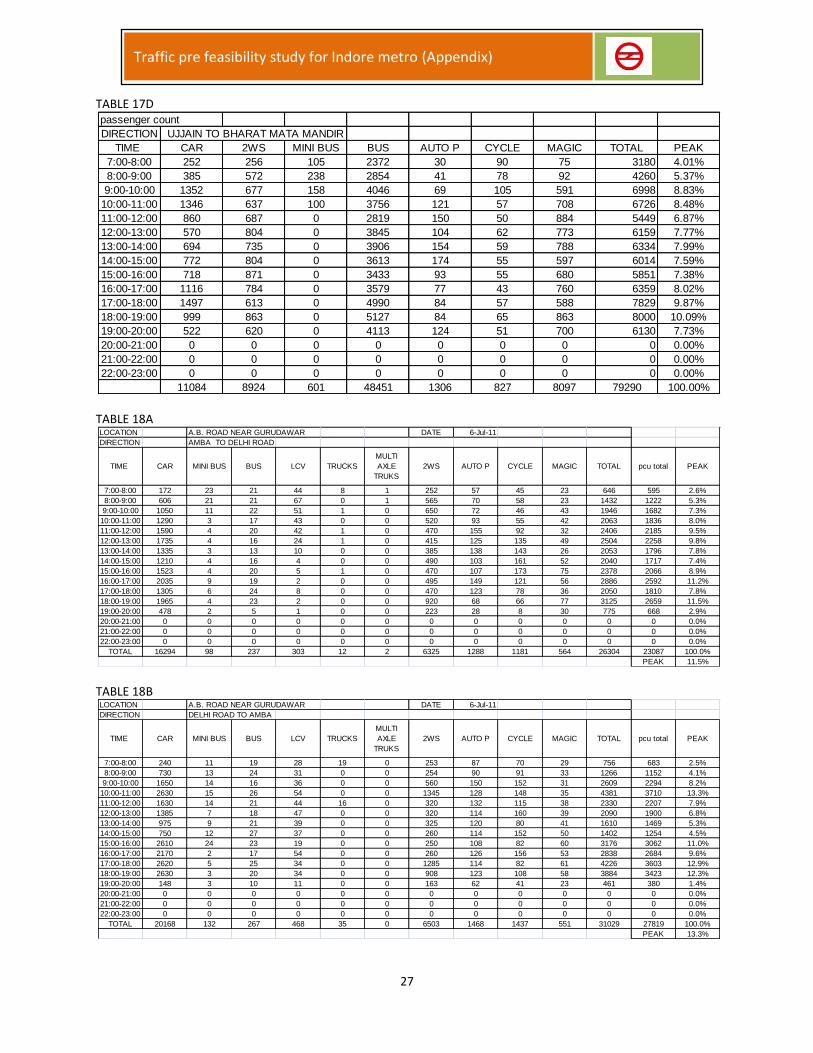
27
Traffic pre feasibility study for Indore metro (Appendix)
TABLE 17D
TABLE 18A
TABLE 18B
passenger count
DIRECTION UJJAIN TO BHARAT MATA MANDIR
TIME CAR 2WS MINI BUS BUS AUTO P CYCLE MAGIC TOTAL PEAK
7:00-8:00 252 256 105 2372 30 90 75 3180 4.01%
8:00-9:00 385 572 238 2854 41 78 92 4260 5.37%
9:00-10:00 1352 677 158 4046 69 105 591 6998 8.83%
10:00-11:00 1346 637 100 3756 121 57 708 6726 8.48%
11:00-12:00 860 687 0 2819 150 50 884 5449 6.87%
12:00-13:00 570 804 0 3845 104 62 773 6159 7.77%
13:00-14:00 694 735 0 3906 154 59 788 6334 7.99%
14:00-15:00 772 804 0 3613 174 55 597 6014 7.59%
15:00-16:00 718 871 0 3433 93 55 680 5851 7.38%
16:00-17:00 1116 784 0 3579 77 43 760 6359 8.02%
17:00-18:00 1497 613 0 4990 84 57 588 7829 9.87%
18:00-19:00 999 863 0 5127 84 65 863 8000 10.09%
19:00-20:00 522 620 0 4113 124 51 700 6130 7.73%
20:00-21:00 0 0 0 0 0 0 0 0 0.00%
21:00-22:00 0 0 0 0 0 0 0 0 0.00%
22:00-23:00 0 0 0 0 0 0 0 0 0.00%
11084 8924 601 48451 1306 827 8097 79290 100.00%
LOCATION A.B. ROAD NEAR GURUDAWAR DATE 6-Jul-11
DIRECTION AMBA TO DELHI ROAD
TIME CAR MINI BUS BUS LCV TRUCKS
MULTI
AXLE
TRUKS
2WS AUTO P CYCLE MAGIC TOTAL pcu total PEAK
7:00-8:00 172 23 21 44 8 1 252 57 45 23 646 595 2.6%
8:00-9:00 606 21 21 67 0 1 565 70 58 23 1432 1222 5.3%
9:00-10:00 1050 11 22 51 1 0 650 72 46 43 1946 1682 7.3%
10:00-11:00 1290 3 17 43 0 0 520 93 55 42 2063 1836 8.0%
11:00-12:00 1590 4 20 42 1 0 470 155 92 32 2406 2185 9.5%
12:00-13:00 1735 4 16 24 1 0 415 125 135 49 2504 2258 9.8%
13:00-14:00 1335 3 13 10 0 0 385 138 143 26 2053 1796 7.8%
14:00-15:00 1210 4 16 4 0 0 490 103 161 52 2040 1717 7.4%
15:00-16:00 1523 4 20 5 1 0 470 107 173 75 2378 2066 8.9%
16:00-17:00 2035 9 19 2 0 0 495 149 121 56 2886 2592 11.2%
17:00-18:00 1305 6 24 8 0 0 470 123 78 36 2050 1810 7.8%
18:00-19:00 1965 4 23 2 0 0 920 68 66 77 3125 2659 11.5%
19:00-20:00 478 2 5 1 0 0 223 28 8 30 775 668 2.9%
20:00-21:00 0 0 0 0 0 0 0 0 0 0 0 0 0.0%
21:00-22:00 0 0 0 0 0 0 0 0 0 0 0 0 0.0%
22:00-23:00 0 0 0 0 0 0 0 0 0 0 0 0 0.0%
TOTAL 16294 98 237 303 12 2 6325 1288 1181 564 26304 23087 100.0%
PEAK 11.5%
LOCATION A.B. ROAD NEAR GURUDAWAR DATE 6-Jul-11
DIRECTION DELHI ROAD TO AMBA
TIME CAR MINI BUS BUS LCV TRUCKS
MULTI
AXLE
TRUKS
2WS AUTO P CYCLE MAGIC TOTAL pcu total PEAK
7:00-8:00 240 11 19 28 19 0 253 87 70 29 756 683 2.5%
8:00-9:00 730 13 24 31 0 0 254 90 91 33 1266 1152 4.1%
9:00-10:00 1650 14 16 36 0 0 560 150 152 31 2609 2294 8.2%
10:00-11:00 2630 15 26 54 0 0 1345 128 148 35 4381 3710 13.3%
11:00-12:00 1630 14 21 44 16 0 320 132 115 38 2330 2207 7.9%
12:00-13:00 1385 7 18 47 0 0 320 114 160 39 2090 1900 6.8%
13:00-14:00 975 9 21 39 0 0 325 120 80 41 1610 1469 5.3%
14:00-15:00 750 12 27 37 0 0 260 114 152 50 1402 1254 4.5%
15:00-16:00 2610 24 23 19 0 0 250 108 82 60 3176 3062 11.0%
16:00-17:00 2170 2 17 54 0 0 260 126 156 53 2838 2684 9.6%
17:00-18:00 2620 5 25 34 0 0 1285 114 82 61 4226 3603 12.9%
18:00-19:00 2630 3 20 34 0 0 908 123 108 58 3884 3423 12.3%
19:00-20:00 148 3 10 11 0 0 163 62 41 23 461 380 1.4%
20:00-21:00 0 0 0 0 0 0 0 0 0 0 0 0 0.0%
21:00-22:00 0 0 0 0 0 0 0 0 0 0 0 0 0.0%
22:00-23:00 0 0 0 0 0 0 0 0 0 0 0 0 0.0%
TOTAL 20168 132 267 468 35 0 6503 1468 1437 551 31029 27819 100.0%
PEAK 13.3%
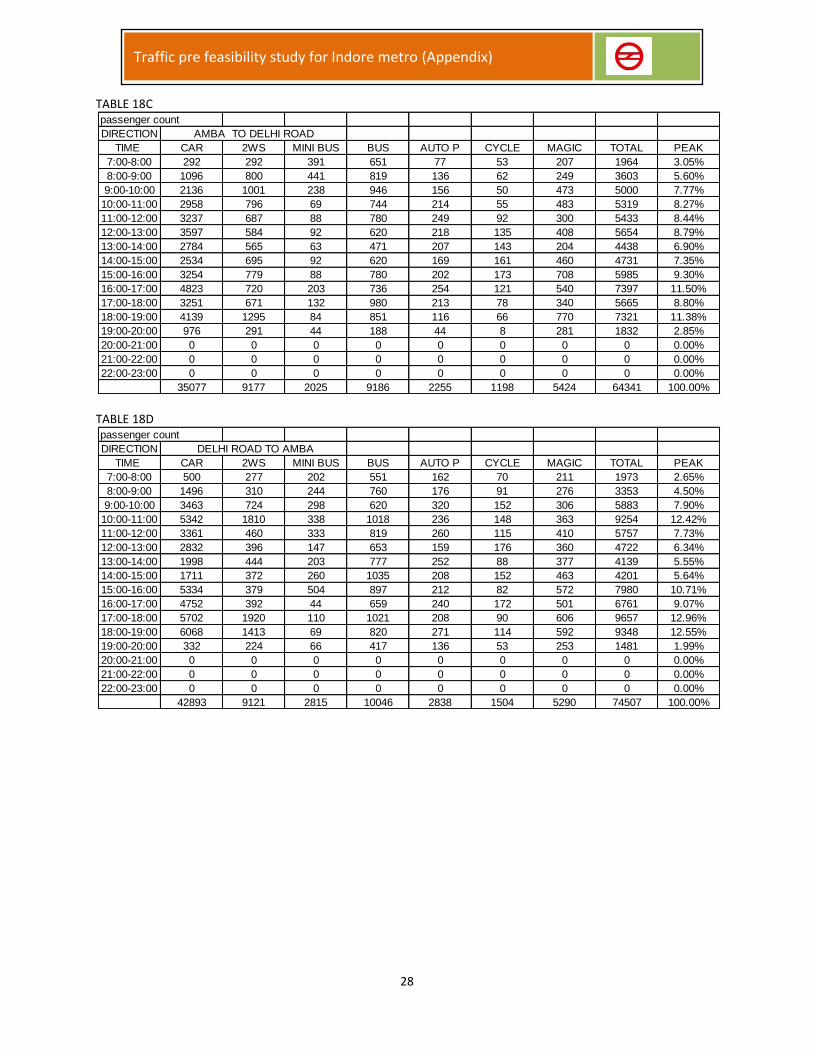
28
Traffic pre feasibility study for Indore metro (Appendix)
TABLE 18C
TABLE 18D
passenger count
DIRECTION AMBA TO DELHI ROAD
TIME CAR 2WS MINI BUS BUS AUTO P CYCLE MAGIC TOTAL PEAK
7:00-8:00 292 292 391 651 77 53 207 1964 3.05%
8:00-9:00 1096 800 441 819 136 62 249 3603 5.60%
9:00-10:00 2136 1001 238 946 156 50 473 5000 7.77%
10:00-11:00 2958 796 69 744 214 55 483 5319 8.27%
11:00-12:00 3237 687 88 780 249 92 300 5433 8.44%
12:00-13:00 3597 584 92 620 218 135 408 5654 8.79%
13:00-14:00 2784 565 63 471 207 143 204 4438 6.90%
14:00-15:00 2534 695 92 620 169 161 460 4731 7.35%
15:00-16:00 3254 779 88 780 202 173 708 5985 9.30%
16:00-17:00 4823 720 203 736 254 121 540 7397 11.50%
17:00-18:00 3251 671 132 980 213 78 340 5665 8.80%
18:00-19:00 4139 1295 84 851 116 66 770 7321 11.38%
19:00-20:00 976 291 44 188 44 8 281 1832 2.85%
20:00-21:00 0 0 0 0 0 0 0 0 0.00%
21:00-22:00 0 0 0 0 0 0 0 0 0.00%
22:00-23:00 0 0 0 0 0 0 0 0 0.00%
35077 9177 2025 9186 2255 1198 5424 64341 100.00%
passenger count
DIRECTION DELHI ROAD TO AMBA
TIME CAR 2WS MINI BUS BUS AUTO P CYCLE MAGIC TOTAL PEAK
7:00-8:00 500 277 202 551 162 70 211 1973 2.65%
8:00-9:00 1496 310 244 760 176 91 276 3353 4.50%
9:00-10:00 3463 724 298 620 320 152 306 5883 7.90%
10:00-11:00 5342 1810 338 1018 236 148 363 9254 12.42%
11:00-12:00 3361 460 333 819 260 115 410 5757 7.73%
12:00-13:00 2832 396 147 653 159 176 360 4722 6.34%
13:00-14:00 1998 444 203 777 252 88 377 4139 5.55%
14:00-15:00 1711 372 260 1035 208 152 463 4201 5.64%
15:00-16:00 5334 379 504 897 212 82 572 7980 10.71%
16:00-17:00 4752 392 44 659 240 172 501 6761 9.07%
17:00-18:00 5702 1920 110 1021 208 90 606 9657 12.96%
18:00-19:00 6068 1413 69 820 271 114 592 9348 12.55%
19:00-20:00 332 224 66 417 136 53 253 1481 1.99%
20:00-21:00 0 0 0 0 0 0 0 0 0.00%
21:00-22:00 0 0 0 0 0 0 0 0 0.00%
22:00-23:00 0 0 0 0 0 0 0 0 0.00%
42893 9121 2815 10046 2838 1504 5290 74507 100.00%

29
Traffic pre feasibility study for Indore metro (Appendix)
TABLE 19A
TABLE 19B
TABLE 19C
LOCATION TORI CORNER DATE 5-Jul-11
DIRECTION RAJWADA TO AIRPORT
TIME CAR MINI BUS BUS LCV TRUCKS
MULTI
AXLE
TRUKS
2WS AUTO P CYCLE MAGIC TOTAL pcu total PEAK
7:00-8:00 95 2 3 87 0 0 250 97 77 2 613 529 4.5%
8:00-9:00 77 7 8 52 0 0 325 92 89 2 652 497 4.2%
9:00-10:00 105 8 10 72 0 0 329 125 55 1 705 595 5.0%
10:00-11:00 170 7 5 109 0 0 570 125 66 2 1054 845 7.1%
11:00-12:00 125 3 3 90 0 0 770 340 135 7 1473 1094 9.2%
12:00-13:00 145 5 6 122 0 0 835 255 68 1 1437 1107 9.4%
13:00-14:00 160 4 4 136 0 0 427 210 45 8 994 894 7.6%
14:00-15:00 120 4 6 116 0 0 480 262 32 5 1025 891 7.5%
15:00-16:00 115 3 5 115 0 0 438 240 40 4 960 838 7.1%
16:00-17:00 95 4 6 107 0 0 390 290 95 8 995 854 7.2%
17:00-18:00 125 1 2 149 0 0 650 357 120 9 1413 1160 9.8%
18:00-19:00 135 2 2 162 0 0 475 250 85 3 1114 986 8.3%
19:00-20:00 160 1 0 137 0 0 165 85 30 1 579 614 5.2%
20:00-21:00 122 1 2 119 0 0 165 117 15 2 543 573 4.8%
21:00-22:00 65 0 0 35 0 0 110 61 3 2 276 254 2.1%
22:00-23:00 38 0 0 14 0 0 65 11 0 0 128 110 0.9%
TOTAL 1852 52 62 1622 0 0 6444 2917 955 57 13961 11840 100.0%
PEAK 9.8%
LOCATION TORI CORNER DATE 5-Jul-11
DIRECTION AIRPORT TO RAJWADA
TIME CAR MINI BUS BUS LCV TRUCKS
MULTI
AXLE
TRUKS
2WS AUTO P CYCLE MAGIC TOTAL pcu total PEAK
7:00-8:00 85 4 16 110 0 0 390 240 73 1 919 811 6.8%
8:00-9:00 132 3 10 71 0 0 223 151 82 1 673 594 5.0%
9:00-10:00 119 2 4 93 0 0 388 213 90 3 912 758 6.4%
10:00-11:00 101 7 1 110 0 0 805 188 62 5 1279 950 8.0%
11:00-12:00 104 2 6 201 0 0 730 165 116 4 1328 1096 9.2%
12:00-13:00 89 2 2 226 0 0 515 153 75 5 1067 989 8.3%
13:00-14:00 66 1 6 158 0 0 620 146 90 8 1095 892 7.5%
14:00-15:00 68 2 6 121 0 0 560 155 75 8 995 796 6.7%
15:00-16:00 96 1 5 107 0 0 580 205 75 7 1076 851 7.1%
16:00-17:00 103 2 5 140 0 0 690 185 70 4 1199 956 8.0%
17:00-18:00 125 5 3 130 0 0 640 235 73 3 1214 982 8.2%
18:00-19:00 136 6 1 108 0 0 350 172 79 3 855 740 6.2%
19:00-20:00 124 6 2 75 0 0 185 106 43 5 546 506 4.2%
20:00-21:00 114 2 3 59 0 0 300 102 48 4 632 514 4.3%
21:00-22:00 83 0 0 42 0 0 145 138 21 0 429 384 3.2%
22:00-23:00 29 0 0 11 0 0 46 39 0 0 125 113 0.9%
TOTAL 1574 45 70 1762 0 0 7167 2593 1072 61 14344 11932 100.0%
PEAK 9.2%
passenger count
DIRECTION RAJWADA TO AIRPORT
TIME CAR 2WS MINI BUS BUS AUTO P CYCLE MAGIC TOTAL PEAK
7:00-8:00 169 335 24 63 132 77 12 812 3.89%
8:00-9:00 158 485 88 180 131 96 10 1148 5.50%
9:00-10:00 222 503 120 183 232 55 6 1322 6.33%
10:00-11:00 328 855 88 113 179 66 14 1642 7.86%
11:00-12:00 238 1147 36 90 530 135 53 2229 10.67%
12:00-13:00 231 1222 75 135 332 68 7 2070 9.91%
13:00-14:00 252 600 48 84 401 45 60 1490 7.13%
14:00-15:00 196 692 48 135 409 36 38 1553 7.44%
15:00-16:00 171 615 36 100 422 40 28 1411 6.76%
16:00-17:00 186 569 48 180 381 95 60 1519 7.27%
17:00-18:00 191 954 12 55 652 120 72 2057 9.85%
18:00-19:00 274 737 24 60 477 85 27 1683 8.06%
19:00-20:00 292 242 12 0 134 30 8 717 3.43%
20:00-21:00 201 237 12 42 214 15 12 733 3.51%
21:00-22:00 92 153 0 0 84 3 14 346 1.66%
22:00-23:00 53 81 0 0 18 0 0 153 0.73%
3255 9427 670 1420 4727 966 420 20885 100.00%
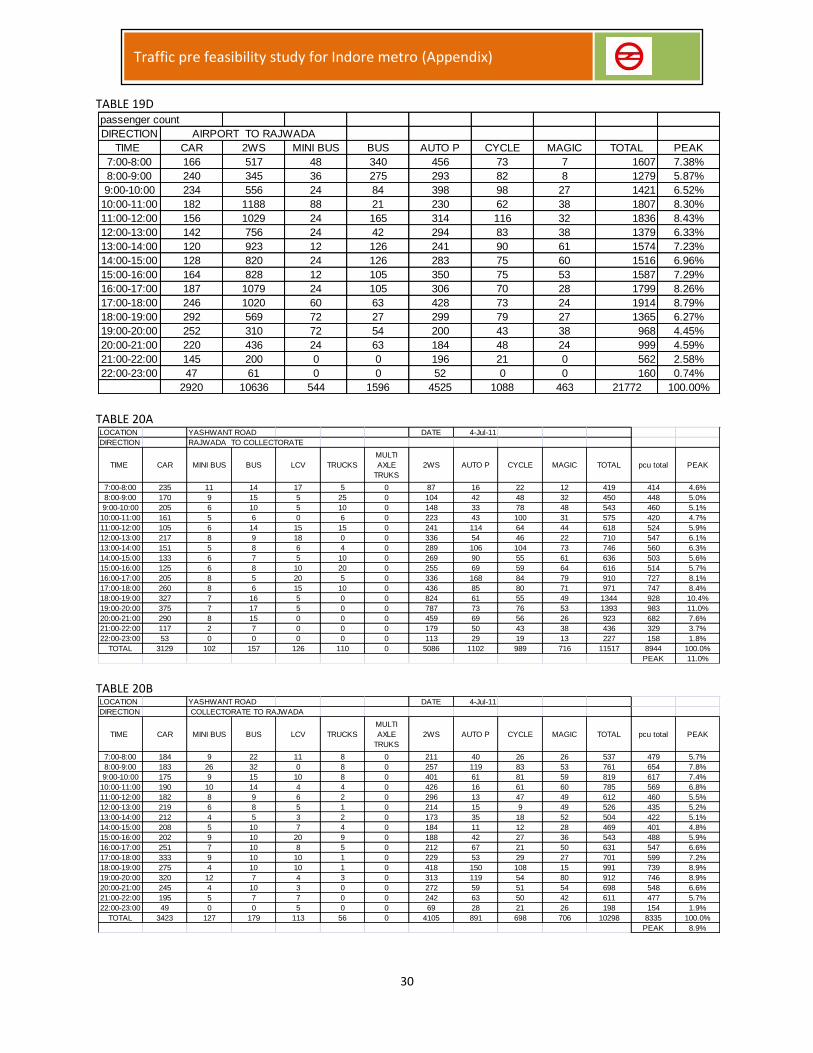
30
Traffic pre feasibility study for Indore metro (Appendix)
TABLE 19D
TABLE 20A
TABLE 20B
passenger count
DIRECTION AIRPORT TO RAJWADA
TIME CAR 2WS MINI BUS BUS AUTO P CYCLE MAGIC TOTAL PEAK
7:00-8:00 166 517 48 340 456 73 7 1607 7.38%
8:00-9:00 240 345 36 275 293 82 8 1279 5.87%
9:00-10:00 234 556 24 84 398 98 27 1421 6.52%
10:00-11:00 182 1188 88 21 230 62 38 1807 8.30%
11:00-12:00 156 1029 24 165 314 116 32 1836 8.43%
12:00-13:00 142 756 24 42 294 83 38 1379 6.33%
13:00-14:00 120 923 12 126 241 90 61 1574 7.23%
14:00-15:00 128 820 24 126 283 75 60 1516 6.96%
15:00-16:00 164 828 12 105 350 75 53 1587 7.29%
16:00-17:00 187 1079 24 105 306 70 28 1799 8.26%
17:00-18:00 246 1020 60 63 428 73 24 1914 8.79%
18:00-19:00 292 569 72 27 299 79 27 1365 6.27%
19:00-20:00 252 310 72 54 200 43 38 968 4.45%
20:00-21:00 220 436 24 63 184 48 24 999 4.59%
21:00-22:00 145 200 0 0 196 21 0 562 2.58%
22:00-23:00 47 61 0 0 52 0 0 160 0.74%
2920 10636 544 1596 4525 1088 463 21772 100.00%
LOCATION YASHWANT ROAD DATE 4-Jul-11
DIRECTION RAJWADA TO COLLECTORATE
TIME CAR MINI BUS BUS LCV TRUCKS
MULTI
AXLE
TRUKS
2WS AUTO P CYCLE MAGIC TOTAL pcu total PEAK
7:00-8:00 235 11 14 17 5 0 87 16 22 12 419 414 4.6%
8:00-9:00 170 9 15 5 25 0 104 42 48 32 450 448 5.0%
9:00-10:00 205 6 10 5 10 0 148 33 78 48 543 460 5.1%
10:00-11:00 161 5 6 0 6 0 223 43 100 31 575 420 4.7%
11:00-12:00 105 6 14 15 15 0 241 114 64 44 618 524 5.9%
12:00-13:00 217 8 9 18 0 0 336 54 46 22 710 547 6.1%
13:00-14:00 151 5 8 6 4 0 289 106 104 73 746 560 6.3%
14:00-15:00 133 6 7 5 10 0 269 90 55 61 636 503 5.6%
15:00-16:00 125 6 8 10 20 0 255 69 59 64 616 514 5.7%
16:00-17:00 205 8 5 20 5 0 336 168 84 79 910 727 8.1%
17:00-18:00 260 8 6 15 10 0 436 85 80 71 971 747 8.4%
18:00-19:00 327 7 16 5 0 0 824 61 55 49 1344 928 10.4%
19:00-20:00 375 7 17 5 0 0 787 73 76 53 1393 983 11.0%
20:00-21:00 290 8 15 0 0 0 459 69 56 26 923 682 7.6%
21:00-22:00 117 2 7 0 0 0 179 50 43 38 436 329 3.7%
22:00-23:00 53 0 0 0 0 0 113 29 19 13 227 158 1.8%
TOTAL 3129 102 157 126 110 0 5086 1102 989 716 11517 8944 100.0%
PEAK 11.0%
LOCATION YASHWANT ROAD DATE 4-Jul-11
DIRECTION COLLECTORATE TO RAJWADA
TIME CAR MINI BUS BUS LCV TRUCKS
MULTI
AXLE
TRUKS
2WS AUTO P CYCLE MAGIC TOTAL pcu total PEAK
7:00-8:00 184 9 22 11 8 0 211 40 26 26 537 479 5.7%
8:00-9:00 183 26 32 0 8 0 257 119 83 53 761 654 7.8%
9:00-10:00 175 9 15 10 8 0 401 61 81 59 819 617 7.4%
10:00-11:00 190 10 14 4 4 0 426 16 61 60 785 569 6.8%
11:00-12:00 182 8 9 6 2 0 296 13 47 49 612 460 5.5%
12:00-13:00 219 6 8 5 1 0 214 15 9 49 526 435 5.2%
13:00-14:00 212 4 5 3 2 0 173 35 18 52 504 422 5.1%
14:00-15:00 208 5 10 7 4 0 184 11 12 28 469 401 4.8%
15:00-16:00 202 9 10 20 9 0 188 42 27 36 543 488 5.9%
16:00-17:00 251 7 10 8 5 0 212 67 21 50 631 547 6.6%
17:00-18:00 333 9 10 10 1 0 229 53 29 27 701 599 7.2%
18:00-19:00 275 4 10 10 1 0 418 150 108 15 991 739 8.9%
19:00-20:00 320 12 7 4 3 0 313 119 54 80 912 746 8.9%
20:00-21:00 245 4 10 3 0 0 272 59 51 54 698 548 6.6%
21:00-22:00 195 5 7 7 0 0 242 63 50 42 611 477 5.7%
22:00-23:00 49 0 0 5 0 0 69 28 21 26 198 154 1.9%
TOTAL 3423 127 179 113 56 0 4105 891 698 706 10298 8335 100.0%
PEAK 8.9%

31
Traffic pre feasibility study for Indore metro (Appendix)
TABLE 20C
TABLE 20D
passenger count
DIRECTION RAJWADA TO COLLECTORATE
TIME CAR 2WS MINI BUS BUS AUTO P CYCLE MAGIC TOTAL PEAK
7:00-8:00 431 107 202 438 24 22 100 1323 4.31%
8:00-9:00 391 144 169 525 89 52 280 1650 5.37%
9:00-10:00 527 212 120 363 78 78 440 1817 5.92%
10:00-11:00 463 361 113 225 110 107 291 1668 5.43%
11:00-12:00 229 406 120 543 247 72 380 1997 6.50%
12:00-13:00 494 540 180 345 87 46 183 1876 6.11%
13:00-14:00 278 454 100 300 152 104 629 2017 6.56%
14:00-15:00 246 397 135 263 135 63 529 1769 5.76%
15:00-16:00 214 368 120 320 101 59 560 1743 5.67%
16:00-17:00 378 476 180 188 313 84 707 2326 7.57%
17:00-18:00 492 636 180 240 150 80 689 2467 8.03%
18:00-19:00 626 1229 152 620 85 55 470 3237 10.54%
19:00-20:00 730 1117 140 701 105 80 448 3322 10.81%
20:00-21:00 489 648 140 500 97 56 223 2153 7.01%
21:00-22:00 176 235 22 193 67 43 274 1009 3.28%
22:00-23:00 72 144 0 0 37 19 81 354 1.15%
6236 7474 2072 5761 1879 1020 6284 30726 100.00%
passenger count
DIRECTION COLLECTORATE TO RAJWADA
TIME CAR 2WS MINI BUS BUS AUTO P CYCLE MAGIC TOTAL PEAK
7:00-8:00 252 280 203 678 72 30 186 1701 5.61%
8:00-9:00 289 373 539 1100 144 91 469 3004 9.92%
9:00-10:00 354 632 180 581 111 92 569 2519 8.31%
10:00-11:00 412 706 183 546 28 61 580 2516 8.31%
11:00-12:00 360 532 180 315 26 51 470 1934 6.38%
12:00-13:00 381 376 120 300 27 9 429 1642 5.42%
13:00-14:00 356 291 88 175 57 18 500 1485 4.90%
14:00-15:00 412 284 113 350 22 12 260 1453 4.79%
15:00-16:00 392 280 195 338 80 31 340 1655 5.46%
16:00-17:00 482 324 140 350 121 21 458 1897 6.26%
17:00-18:00 702 359 195 367 94 29 251 1997 6.59%
18:00-19:00 631 679 88 363 274 121 131 2286 7.55%
19:00-20:00 620 487 260 298 207 54 680 2606 8.60%
20:00-21:00 450 392 80 338 97 51 450 1857 6.13%
21:00-22:00 305 345 75 210 88 50 315 1388 4.58%
22:00-23:00 72 84 0 0 36 0 167 359 1.19%
6469 6426 2638 6307 1483 721 6254 30298 100.00%
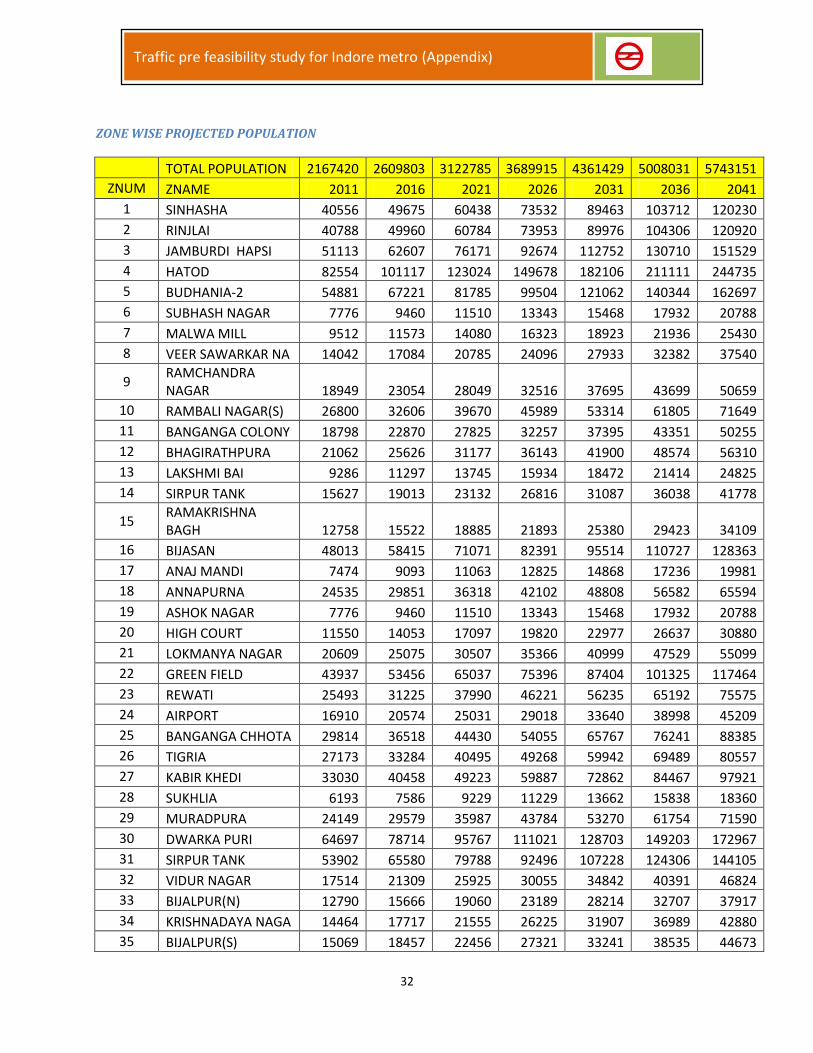
32
Traffic pre feasibility study for Indore metro (Appendix)
ZONE WISE PROJECTED POPULATION
TOTAL POPULATION 2167420 2609803 3122785 3689915 4361429 5008031 5743151
ZNUM ZNAME 2011 2016 2021 2026 2031 2036 2041
1 SINHASHA 40556 49675 60438 73532 89463 103712 120230
2 RINJLAI 40788 49960 60784 73953 89976 104306 120920
3 JAMBURDI HAPSI 51113 62607 76171 92674 112752 130710 151529
4 HATOD 82554 101117 123024 149678 182106 211111 244735
5 BUDHANIA-2 54881 67221 81785 99504 121062 140344 162697
6 SUBHASH NAGAR 7776 9460 11510 13343 15468 17932 20788
7 MALWA MILL 9512 11573 14080 16323 18923 21936 25430
8 VEER SAWARKAR NA 14042 17084 20785 24096 27933 32382 37540
9 RAMCHANDRA NAGAR 18949 23054 28049 32516 37695 43699 50659
10 RAMBALI NAGAR(S) 26800 32606 39670 45989 53314 61805 71649
11 BANGANGA COLONY 18798 22870 27825 32257 37395 43351 50255
12 BHAGIRATHPURA 21062 25626 31177 36143 41900 48574 56310
13 LAKSHMI BAI 9286 11297 13745 15934 18472 21414 24825
14 SIRPUR TANK 15627 19013 23132 26816 31087 36038 41778
15 RAMAKRISHNA BAGH 12758 15522 18885 21893 25380 29423 34109
16 BIJASAN 48013 58415 71071 82391 95514 110727 128363
17 ANAJ MANDI 7474 9093 11063 12825 14868 17236 19981
18 ANNAPURNA 24535 29851 36318 42102 48808 56582 65594
19 ASHOK NAGAR 7776 9460 11510 13343 15468 17932 20788
20 HIGH COURT 11550 14053 17097 19820 22977 26637 30880
21 LOKMANYA NAGAR 20609 25075 30507 35366 40999 47529 55099
22 GREEN FIELD 43937 53456 65037 75396 87404 101325 117464
23 REWATI 25493 31225 37990 46221 56235 65192 75575
24 AIRPORT 16910 20574 25031 29018 33640 38998 45209
25 BANGANGA CHHOTA 29814 36518 44430 54055 65767 76241 88385
26 TIGRIA 27173 33284 40495 49268 59942 69489 80557
27 KABIR KHEDI 33030 40458 49223 59887 72862 84467 97921
28 SUKHLIA 6193 7586 9229 11229 13662 15838 18360
29 MURADPURA 24149 29579 35987 43784 53270 61754 71590
30 DWARKA PURI 64697 78714 95767 111021 128703 149203 172967
31 SIRPUR TANK 53902 65580 79788 92496 107228 124306 144105
32 VIDUR NAGAR 17514 21309 25925 30055 34842 40391 46824
33 BIJALPUR(N) 12790 15666 19060 23189 28214 32707 37917
34 KRISHNADAYA NAGA 14464 17717 21555 26225 31907 36989 42880
35 BIJALPUR(S) 15069 18457 22456 27321 33241 38535 44673
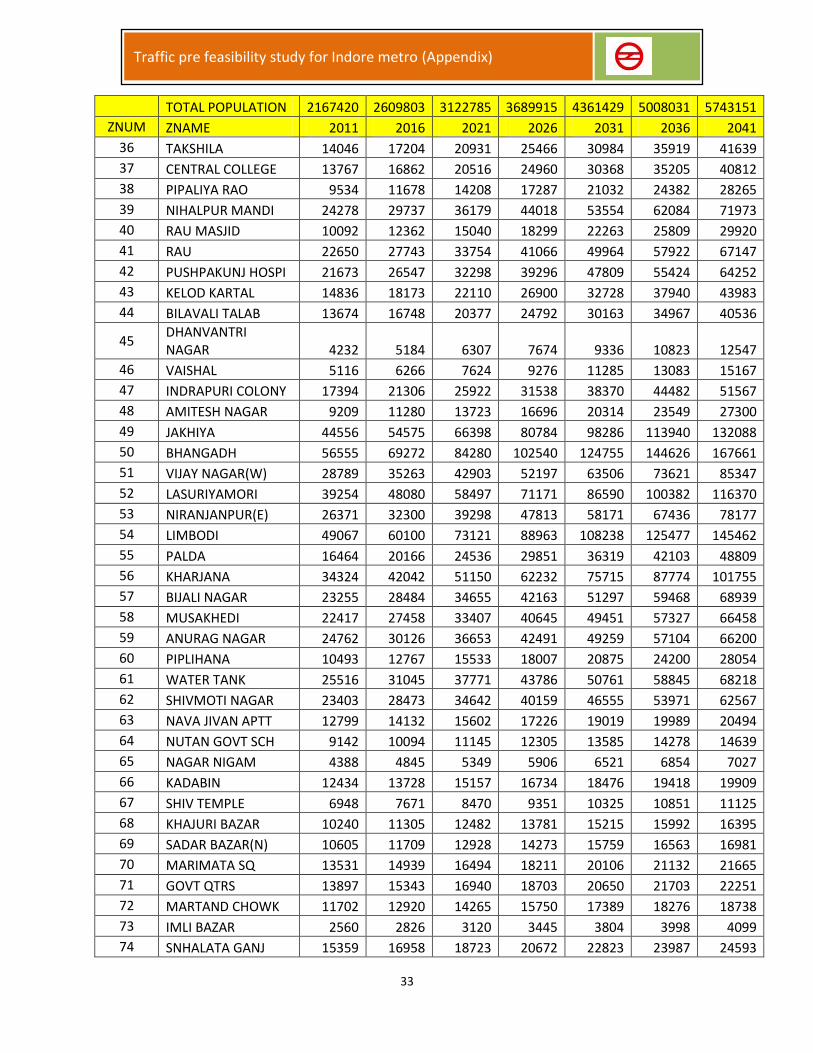
33
Traffic pre feasibility study for Indore metro (Appendix)
TOTAL POPULATION 2167420 2609803 3122785 3689915 4361429 5008031 5743151
ZNUM ZNAME 2011 2016 2021 2026 2031 2036 2041
36 TAKSHILA 14046 17204 20931 25466 30984 35919 41639
37 CENTRAL COLLEGE 13767 16862 20516 24960 30368 35205 40812
38 PIPALIYA RAO 9534 11678 14208 17287 21032 24382 28265
39 NIHALPUR MANDI 24278 29737 36179 44018 53554 62084 71973
40 RAU MASJID 10092 12362 15040 18299 22263 25809 29920
41 RAU 22650 27743 33754 41066 49964 57922 67147
42 PUSHPAKUNJ HOSPI 21673 26547 32298 39296 47809 55424 64252
43 KELOD KARTAL 14836 18173 22110 26900 32728 37940 43983
44 BILAVALI TALAB 13674 16748 20377 24792 30163 34967 40536
45 DHANVANTRI NAGAR 4232 5184 6307 7674 9336 10823 12547
46 VAISHAL 5116 6266 7624 9276 11285 13083 15167
47 INDRAPURI COLONY 17394 21306 25922 31538 38370 44482 51567
48 AMITESH NAGAR 9209 11280 13723 16696 20314 23549 27300
49 JAKHIYA 44556 54575 66398 80784 98286 113940 132088
50 BHANGADH 56555 69272 84280 102540 124755 144626 167661
51 VIJAY NAGAR(W) 28789 35263 42903 52197 63506 73621 85347
52 LASURIYAMORI 39254 48080 58497 71171 86590 100382 116370
53 NIRANJANPUR(E) 26371 32300 39298 47813 58171 67436 78177
54 LIMBODI 49067 60100 73121 88963 108238 125477 145462
55 PALDA 16464 20166 24536 29851 36319 42103 48809
56 KHARJANA 34324 42042 51150 62232 75715 87774 101755
57 BIJALI NAGAR 23255 28484 34655 42163 51297 59468 68939
58 MUSAKHEDI 22417 27458 33407 40645 49451 57327 66458
59 ANURAG NAGAR 24762 30126 36653 42491 49259 57104 66200
60 PIPLIHANA 10493 12767 15533 18007 20875 24200 28054
61 WATER TANK 25516 31045 37771 43786 50761 58845 68218
62 SHIVMOTI NAGAR 23403 28473 34642 40159 46555 53971 62567
63 NAVA JIVAN APTT 12799 14132 15602 17226 19019 19989 20494
64 NUTAN GOVT SCH 9142 10094 11145 12305 13585 14278 14639
65 NAGAR NIGAM 4388 4845 5349 5906 6521 6854 7027
66 KADABIN 12434 13728 15157 16734 18476 19418 19909
67 SHIV TEMPLE 6948 7671 8470 9351 10325 10851 11125
68 KHAJURI BAZAR 10240 11305 12482 13781 15215 15992 16395
69 SADAR BAZAR(N) 10605 11709 12928 14273 15759 16563 16981
70 MARIMATA SQ 13531 14939 16494 18211 20106 21132 21665
71 GOVT QTRS 13897 15343 16940 18703 20650 21703 22251
72 MARTAND CHOWK 11702 12920 14265 15750 17389 18276 18738
73 IMLI BAZAR 2560 2826 3120 3445 3804 3998 4099
74 SNHALATA GANJ 15359 16958 18723 20672 22823 23987 24593
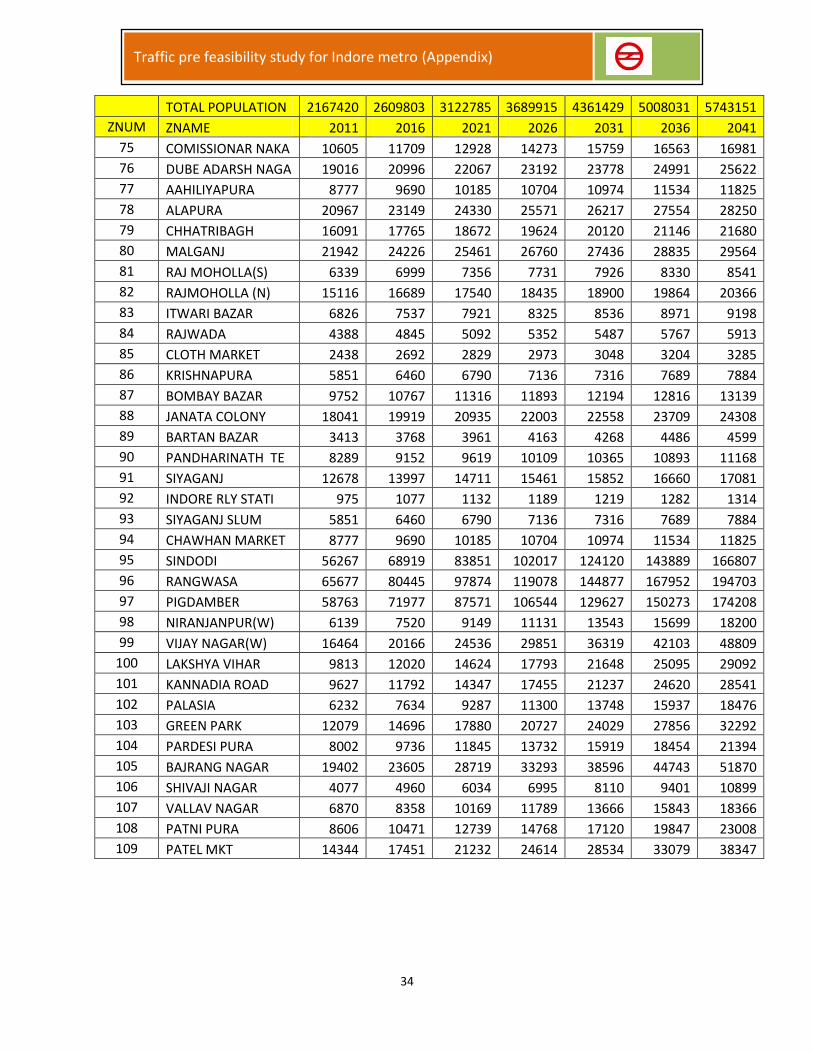
34
Traffic pre feasibility study for Indore metro (Appendix)
TOTAL POPULATION 2167420 2609803 3122785 3689915 4361429 5008031 5743151
ZNUM ZNAME 2011 2016 2021 2026 2031 2036 2041
75 COMISSIONAR NAKA 10605 11709 12928 14273 15759 16563 16981
76 DUBE ADARSH NAGA 19016 20996 22067 23192 23778 24991 25622
77 AAHILIYAPURA 8777 9690 10185 10704 10974 11534 11825
78 ALAPURA 20967 23149 24330 25571 26217 27554 28250
79 CHHATRIBAGH 16091 17765 18672 19624 20120 21146 21680
80 MALGANJ 21942 24226 25461 26760 27436 28835 29564
81 RAJ MOHOLLA(S) 6339 6999 7356 7731 7926 8330 8541
82 RAJMOHOLLA (N) 15116 16689 17540 18435 18900 19864 20366
83 ITWARI BAZAR 6826 7537 7921 8325 8536 8971 9198
84 RAJWADA 4388 4845 5092 5352 5487 5767 5913
85 CLOTH MARKET 2438 2692 2829 2973 3048 3204 3285
86 KRISHNAPURA 5851 6460 6790 7136 7316 7689 7884
87 BOMBAY BAZAR 9752 10767 11316 11893 12194 12816 13139
88 JANATA COLONY 18041 19919 20935 22003 22558 23709 24308
89 BARTAN BAZAR 3413 3768 3961 4163 4268 4486 4599
90 PANDHARINATH TE 8289 9152 9619 10109 10365 10893 11168
91 SIYAGANJ 12678 13997 14711 15461 15852 16660 17081
92 INDORE RLY STATI 975 1077 1132 1189 1219 1282 1314
93 SIYAGANJ SLUM 5851 6460 6790 7136 7316 7689 7884
94 CHAWHAN MARKET 8777 9690 10185 10704 10974 11534 11825
95 SINDODI 56267 68919 83851 102017 124120 143889 166807
96 RANGWASA 65677 80445 97874 119078 144877 167952 194703
97 PIGDAMBER 58763 71977 87571 106544 129627 150273 174208
98 NIRANJANPUR(W) 6139 7520 9149 11131 13543 15699 18200
99 VIJAY NAGAR(W) 16464 20166 24536 29851 36319 42103 48809
100 LAKSHYA VIHAR 9813 12020 14624 17793 21648 25095 29092
101 KANNADIA ROAD 9627 11792 14347 17455 21237 24620 28541
102 PALASIA 6232 7634 9287 11300 13748 15937 18476
103 GREEN PARK 12079 14696 17880 20727 24029 27856 32292
104 PARDESI PURA 8002 9736 11845 13732 15919 18454 21394
105 BAJRANG NAGAR 19402 23605 28719 33293 38596 44743 51870
106 SHIVAJI NAGAR 4077 4960 6034 6995 8110 9401 10899
107 VALLAV NAGAR 6870 8358 10169 11789 13666 15843 18366
108 PATNI PURA 8606 10471 12739 14768 17120 19847 23008
109 PATEL MKT 14344 17451 21232 24614 28534 33079 38347
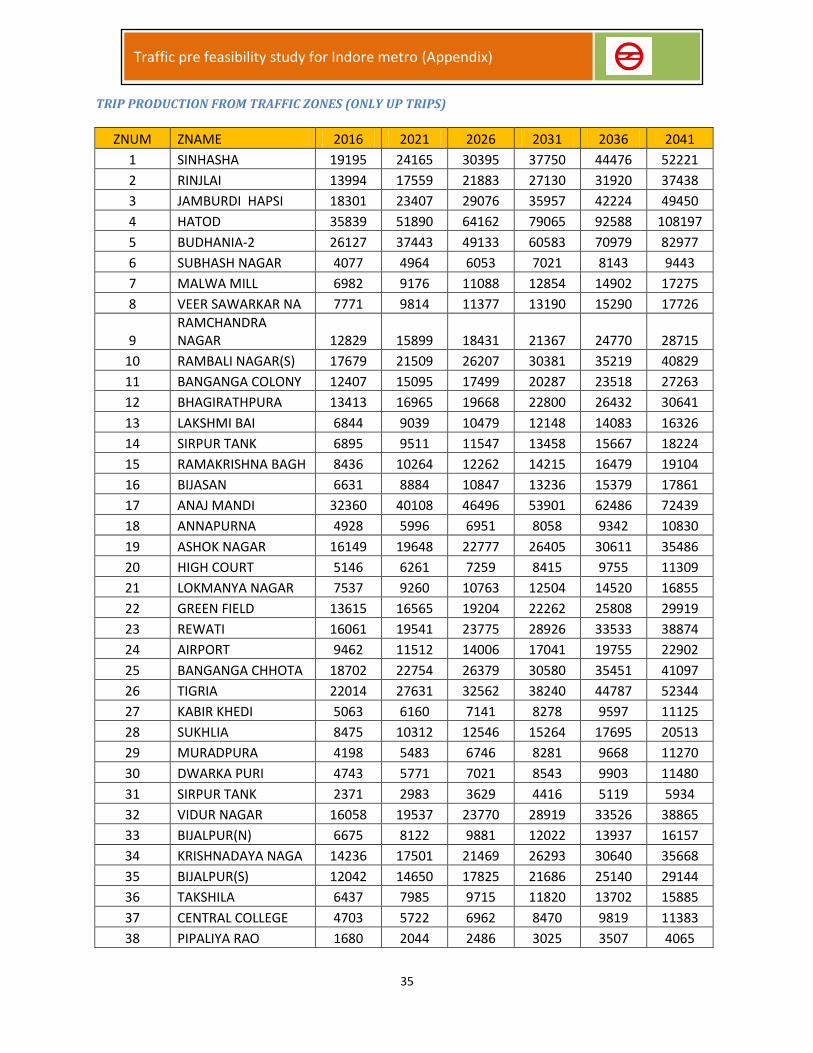
35
Traffic pre feasibility study for Indore metro (Appendix)
TRIP PRODUCTION FROM TRAFFIC ZONES (ONLY UP TRIPS)
ZNUM ZNAME 2016 2021 2026 2031 2036 2041
1 SINHASHA 19195 24165 30395 37750 44476 52221
2 RINJLAI 13994 17559 21883 27130 31920 37438
3 JAMBURDI HAPSI 18301 23407 29076 35957 42224 49450
4 HATOD 35839 51890 64162 79065 92588 108197
5 BUDHANIA-2 26127 37443 49133 60583 70979 82977
6 SUBHASH NAGAR 4077 4964 6053 7021 8143 9443
7 MALWA MILL 6982 9176 11088 12854 14902 17275
8 VEER SAWARKAR NA 7771 9814 11377 13190 15290 17726
9 RAMCHANDRA NAGAR 12829 15899 18431 21367 24770 28715
10 RAMBALI NAGAR(S) 17679 21509 26207 30381 35219 40829
11 BANGANGA COLONY 12407 15095 17499 20287 23518 27263
12 BHAGIRATHPURA 13413 16965 19668 22800 26432 30641
13 LAKSHMI BAI 6844 9039 10479 12148 14083 16326
14 SIRPUR TANK 6895 9511 11547 13458 15667 18224
15 RAMAKRISHNA BAGH 8436 10264 12262 14215 16479 19104
16 BIJASAN 6631 8884 10847 13236 15379 17861
17 ANAJ MANDI 32360 40108 46496 53901 62486 72439
18 ANNAPURNA 4928 5996 6951 8058 9342 10830
19 ASHOK NAGAR 16149 19648 22777 26405 30611 35486
20 HIGH COURT 5146 6261 7259 8415 9755 11309
21 LOKMANYA NAGAR 7537 9260 10763 12504 14520 16855
22 GREEN FIELD 13615 16565 19204 22262 25808 29919
23 REWATI 16061 19541 23775 28926 33533 38874
24 AIRPORT 9462 11512 14006 17041 19755 22902
25 BANGANGA CHHOTA 18702 22754 26379 30580 35451 41097
26 TIGRIA 22014 27631 32562 38240 44787 52344
27 KABIR KHEDI 5063 6160 7141 8278 9597 11125
28 SUKHLIA 8475 10312 12546 15264 17695 20513
29 MURADPURA 4198 5483 6746 8281 9668 11270
30 DWARKA PURI 4743 5771 7021 8543 9903 11480
31 SIRPUR TANK 2371 2983 3629 4416 5119 5934
32 VIDUR NAGAR 16058 19537 23770 28919 33526 38865
33 BIJALPUR(N) 6675 8122 9881 12022 13937 16157
34 KRISHNADAYA NAGA 14236 17501 21469 26293 30640 35668
35 BIJALPUR(S) 12042 14650 17825 21686 25140 29144
36 TAKSHILA 6437 7985 9715 11820 13702 15885
37 CENTRAL COLLEGE 4703 5722 6962 8470 9819 11383
38 PIPALIYA RAO 1680 2044 2486 3025 3507 4065
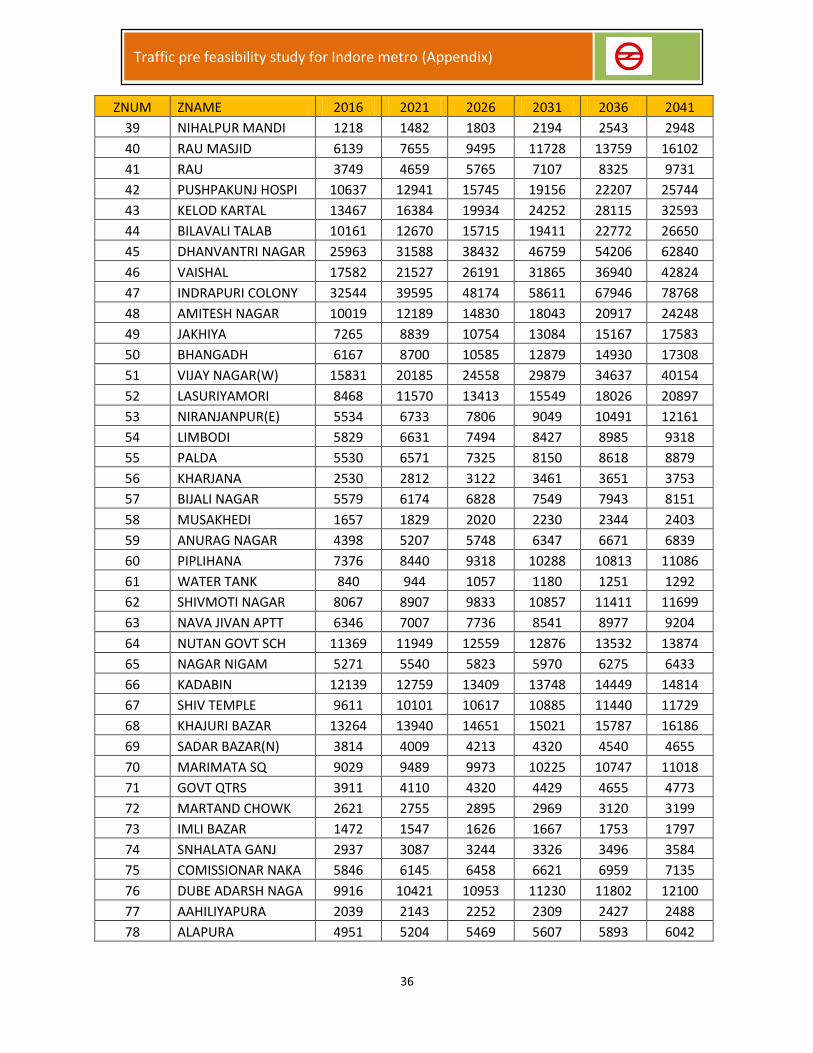
36
Traffic pre feasibility study for Indore metro (Appendix)
ZNUM ZNAME 2016 2021 2026 2031 2036 2041
39 NIHALPUR MANDI 1218 1482 1803 2194 2543 2948
40 RAU MASJID 6139 7655 9495 11728 13759 16102
41 RAU 3749 4659 5765 7107 8325 9731
42 PUSHPAKUNJ HOSPI 10637 12941 15745 19156 22207 25744
43 KELOD KARTAL 13467 16384 19934 24252 28115 32593
44 BILAVALI TALAB 10161 12670 15715 19411 22772 26650
45 DHANVANTRI NAGAR 25963 31588 38432 46759 54206 62840
46 VAISHAL 17582 21527 26191 31865 36940 42824
47 INDRAPURI COLONY 32544 39595 48174 58611 67946 78768
48 AMITESH NAGAR 10019 12189 14830 18043 20917 24248
49 JAKHIYA 7265 8839 10754 13084 15167 17583
50 BHANGADH 6167 8700 10585 12879 14930 17308
51 VIJAY NAGAR(W) 15831 20185 24558 29879 34637 40154
52 LASURIYAMORI 8468 11570 13413 15549 18026 20897
53 NIRANJANPUR(E) 5534 6733 7806 9049 10491 12161
54 LIMBODI 5829 6631 7494 8427 8985 9318
55 PALDA 5530 6571 7325 8150 8618 8879
56 KHARJANA 2530 2812 3122 3461 3651 3753
57 BIJALI NAGAR 5579 6174 6828 7549 7943 8151
58 MUSAKHEDI 1657 1829 2020 2230 2344 2403
59 ANURAG NAGAR 4398 5207 5748 6347 6671 6839
60 PIPLIHANA 7376 8440 9318 10288 10813 11086
61 WATER TANK 840 944 1057 1180 1251 1292
62 SHIVMOTI NAGAR 8067 8907 9833 10857 11411 11699
63 NAVA JIVAN APTT 6346 7007 7736 8541 8977 9204
64 NUTAN GOVT SCH 11369 11949 12559 12876 13532 13874
65 NAGAR NIGAM 5271 5540 5823 5970 6275 6433
66 KADABIN 12139 12759 13409 13748 14449 14814
67 SHIV TEMPLE 9611 10101 10617 10885 11440 11729
68 KHAJURI BAZAR 13264 13940 14651 15021 15787 16186
69 SADAR BAZAR(N) 3814 4009 4213 4320 4540 4655
70 MARIMATA SQ 9029 9489 9973 10225 10747 11018
71 GOVT QTRS 3911 4110 4320 4429 4655 4773
72 MARTAND CHOWK 2621 2755 2895 2969 3120 3199
73 IMLI BAZAR 1472 1547 1626 1667 1753 1797
74 SNHALATA GANJ 2937 3087 3244 3326 3496 3584
75 COMISSIONAR NAKA 5846 6145 6458 6621 6959 7135
76 DUBE ADARSH NAGA 9916 10421 10953 11230 11802 12100
77 AAHILIYAPURA 2039 2143 2252 2309 2427 2488
78 ALAPURA 4951 5204 5469 5607 5893 6042
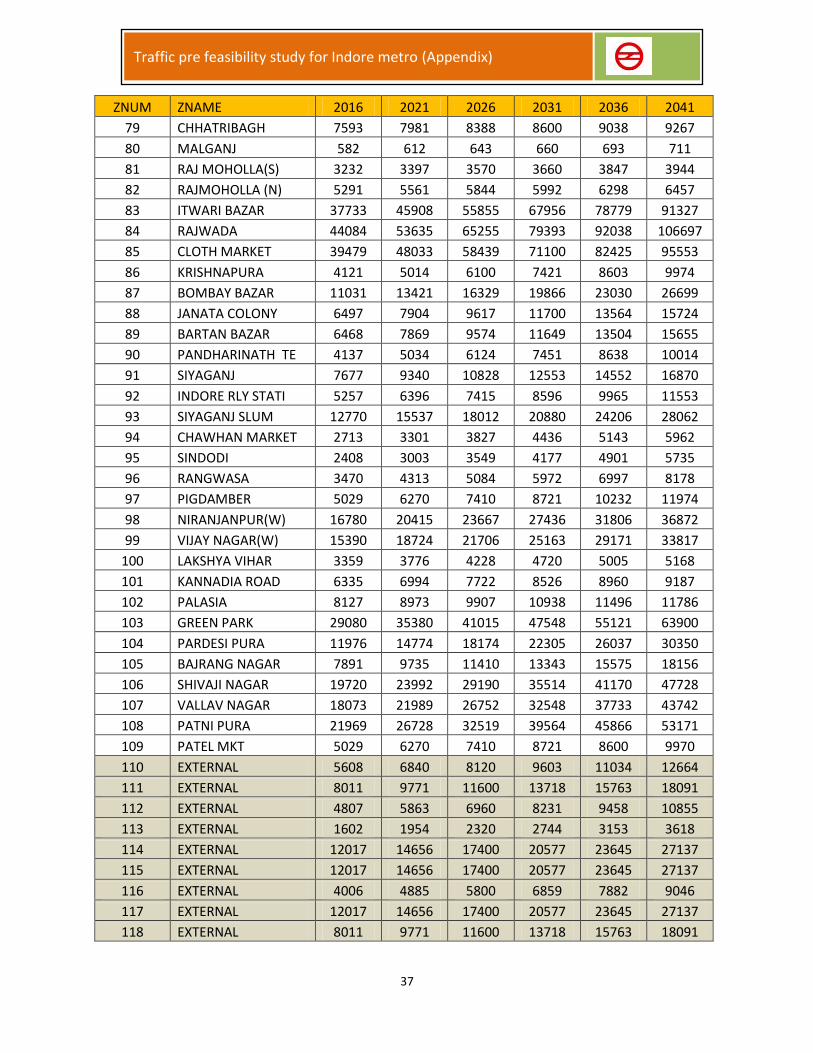
37
Traffic pre feasibility study for Indore metro (Appendix)
ZNUM ZNAME 2016 2021 2026 2031 2036 2041
79 CHHATRIBAGH 7593 7981 8388 8600 9038 9267
80 MALGANJ 582 612 643 660 693 711
81 RAJ MOHOLLA(S) 3232 3397 3570 3660 3847 3944
82 RAJMOHOLLA (N) 5291 5561 5844 5992 6298 6457
83 ITWARI BAZAR 37733 45908 55855 67956 78779 91327
84 RAJWADA 44084 53635 65255 79393 92038 106697
85 CLOTH MARKET 39479 48033 58439 71100 82425 95553
86 KRISHNAPURA 4121 5014 6100 7421 8603 9974
87 BOMBAY BAZAR 11031 13421 16329 19866 23030 26699
88 JANATA COLONY 6497 7904 9617 11700 13564 15724
89 BARTAN BAZAR 6468 7869 9574 11649 13504 15655
90 PANDHARINATH TE 4137 5034 6124 7451 8638 10014
91 SIYAGANJ 7677 9340 10828 12553 14552 16870
92 INDORE RLY STATI 5257 6396 7415 8596 9965 11553
93 SIYAGANJ SLUM 12770 15537 18012 20880 24206 28062
94 CHAWHAN MARKET 2713 3301 3827 4436 5143 5962
95 SINDODI 2408 3003 3549 4177 4901 5735
96 RANGWASA 3470 4313 5084 5972 6997 8178
97 PIGDAMBER 5029 6270 7410 8721 10232 11974
98 NIRANJANPUR(W) 16780 20415 23667 27436 31806 36872
99 VIJAY NAGAR(W) 15390 18724 21706 25163 29171 33817
100 LAKSHYA VIHAR 3359 3776 4228 4720 5005 5168
101 KANNADIA ROAD 6335 6994 7722 8526 8960 9187
102 PALASIA 8127 8973 9907 10938 11496 11786
103 GREEN PARK 29080 35380 41015 47548 55121 63900
104 PARDESI PURA 11976 14774 18174 22305 26037 30350
105 BAJRANG NAGAR 7891 9735 11410 13343 15575 18156
106 SHIVAJI NAGAR 19720 23992 29190 35514 41170 47728
107 VALLAV NAGAR 18073 21989 26752 32548 37733 43742
108 PATNI PURA 21969 26728 32519 39564 45866 53171
109 PATEL MKT 5029 6270 7410 8721 8600 9970
110 EXTERNAL 5608 6840 8120 9603 11034 12664
111 EXTERNAL 8011 9771 11600 13718 15763 18091
112 EXTERNAL 4807 5863 6960 8231 9458 10855
113 EXTERNAL 1602 1954 2320 2744 3153 3618
114 EXTERNAL 12017 14656 17400 20577 23645 27137
115 EXTERNAL 12017 14656 17400 20577 23645 27137
116 EXTERNAL 4006 4885 5800 6859 7882 9046
117 EXTERNAL 12017 14656 17400 20577 23645 27137
118 EXTERNAL 8011 9771 11600 13718 15763 18091
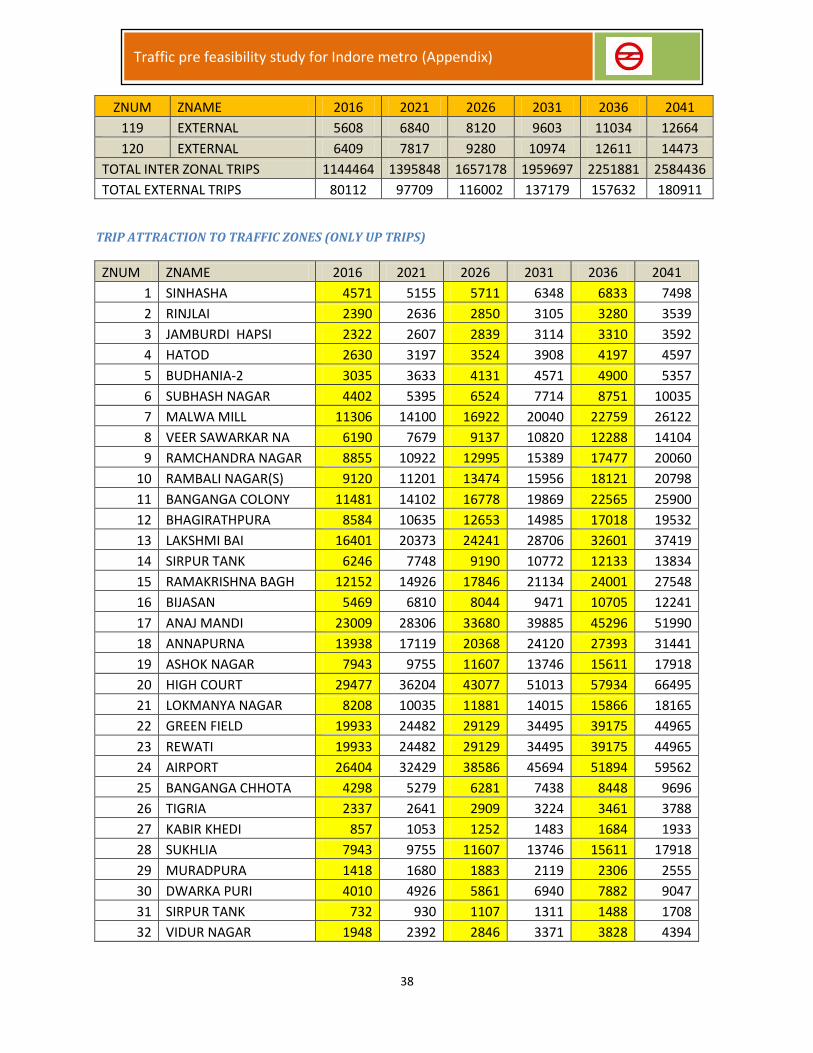
38
Traffic pre feasibility study for Indore metro (Appendix)
ZNUM ZNAME 2016 2021 2026 2031 2036 2041
119 EXTERNAL 5608 6840 8120 9603 11034 12664
120 EXTERNAL 6409 7817 9280 10974 12611 14473
TOTAL INTER ZONAL TRIPS 1144464 1395848 1657178 1959697 2251881 2584436
TOTAL EXTERNAL TRIPS 80112 97709 116002 137179 157632 180911
TRIP ATTRACTION TO TRAFFIC ZONES (ONLY UP TRIPS)
ZNUM ZNAME 2016 2021 2026 2031 2036 2041
1 SINHASHA 4571 5155 5711 6348 6833 7498
2 RINJLAI 2390 2636 2850 3105 3280 3539
3 JAMBURDI HAPSI 2322 2607 2839 3114 3310 3592
4 HATOD 2630 3197 3524 3908 4197 4597
5 BUDHANIA-2 3035 3633 4131 4571 4900 5357
6 SUBHASH NAGAR 4402 5395 6524 7714 8751 10035
7 MALWA MILL 11306 14100 16922 20040 22759 26122
8 VEER SAWARKAR NA 6190 7679 9137 10820 12288 14104
9 RAMCHANDRA NAGAR 8855 10922 12995 15389 17477 20060
10 RAMBALI NAGAR(S) 9120 11201 13474 15956 18121 20798
11 BANGANGA COLONY 11481 14102 16778 19869 22565 25900
12 BHAGIRATHPURA 8584 10635 12653 14985 17018 19532
13 LAKSHMI BAI 16401 20373 24241 28706 32601 37419
14 SIRPUR TANK 6246 7748 9190 10772 12133 13834
15 RAMAKRISHNA BAGH 12152 14926 17846 21134 24001 27548
16 BIJASAN 5469 6810 8044 9471 10705 12241
17 ANAJ MANDI 23009 28306 33680 39885 45296 51990
18 ANNAPURNA 13938 17119 20368 24120 27393 31441
19 ASHOK NAGAR 7943 9755 11607 13746 15611 17918
20 HIGH COURT 29477 36204 43077 51013 57934 66495
21 LOKMANYA NAGAR 8208 10035 11881 14015 15866 18165
22 GREEN FIELD 19933 24482 29129 34495 39175 44965
23 REWATI 19933 24482 29129 34495 39175 44965
24 AIRPORT 26404 32429 38586 45694 51894 59562
25 BANGANGA CHHOTA 4298 5279 6281 7438 8448 9696
26 TIGRIA 2337 2641 2909 3224 3461 3788
27 KABIR KHEDI 857 1053 1252 1483 1684 1933
28 SUKHLIA 7943 9755 11607 13746 15611 17918
29 MURADPURA 1418 1680 1883 2119 2306 2555
30 DWARKA PURI 4010 4926 5861 6940 7882 9047
31 SIRPUR TANK 732 930 1107 1311 1488 1708
32 VIDUR NAGAR 1948 2392 2846 3371 3828 4394
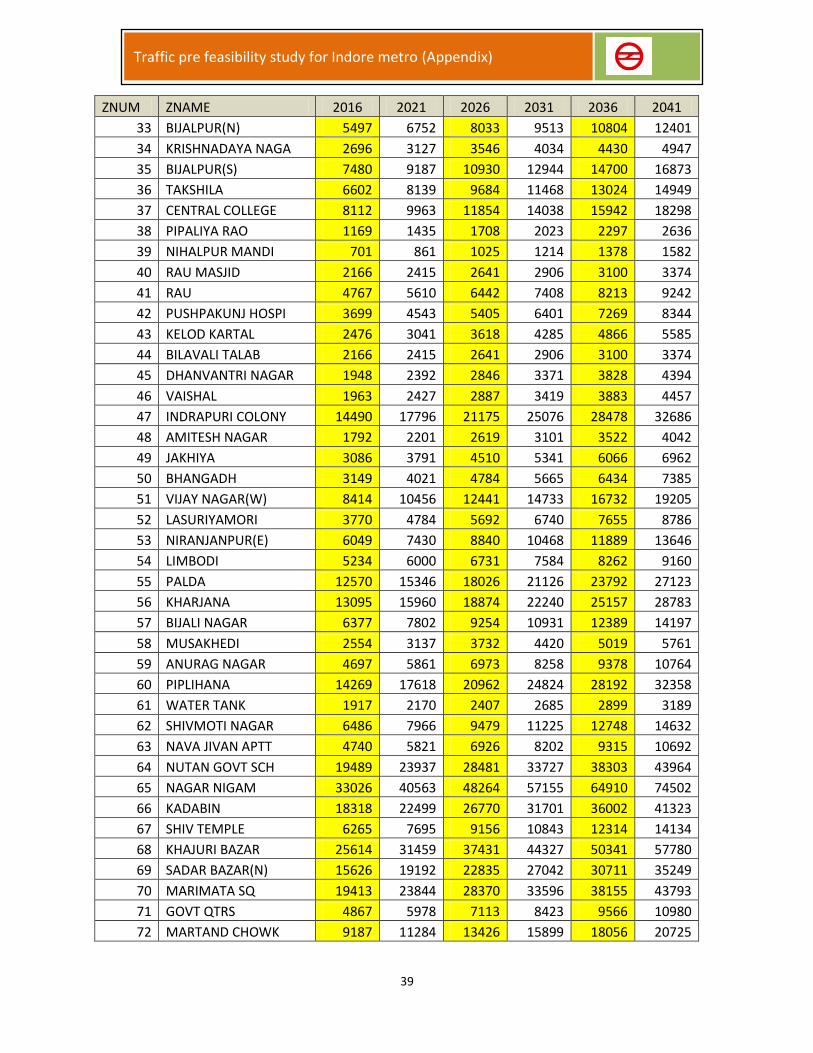
39
Traffic pre feasibility study for Indore metro (Appendix)
ZNUM ZNAME 2016 2021 2026 2031 2036 2041
33 BIJALPUR(N) 5497 6752 8033 9513 10804 12401
34 KRISHNADAYA NAGA 2696 3127 3546 4034 4430 4947
35 BIJALPUR(S) 7480 9187 10930 12944 14700 16873
36 TAKSHILA 6602 8139 9684 11468 13024 14949
37 CENTRAL COLLEGE 8112 9963 11854 14038 15942 18298
38 PIPALIYA RAO 1169 1435 1708 2023 2297 2636
39 NIHALPUR MANDI 701 861 1025 1214 1378 1582
40 RAU MASJID 2166 2415 2641 2906 3100 3374
41 RAU 4767 5610 6442 7408 8213 9242
42 PUSHPAKUNJ HOSPI 3699 4543 5405 6401 7269 8344
43 KELOD KARTAL 2476 3041 3618 4285 4866 5585
44 BILAVALI TALAB 2166 2415 2641 2906 3100 3374
45 DHANVANTRI NAGAR 1948 2392 2846 3371 3828 4394
46 VAISHAL 1963 2427 2887 3419 3883 4457
47 INDRAPURI COLONY 14490 17796 21175 25076 28478 32686
48 AMITESH NAGAR 1792 2201 2619 3101 3522 4042
49 JAKHIYA 3086 3791 4510 5341 6066 6962
50 BHANGADH 3149 4021 4784 5665 6434 7385
51 VIJAY NAGAR(W) 8414 10456 12441 14733 16732 19205
52 LASURIYAMORI 3770 4784 5692 6740 7655 8786
53 NIRANJANPUR(E) 6049 7430 8840 10468 11889 13646
54 LIMBODI 5234 6000 6731 7584 8262 9160
55 PALDA 12570 15346 18026 21126 23792 27123
56 KHARJANA 13095 15960 18874 22240 25157 28783
57 BIJALI NAGAR 6377 7802 9254 10931 12389 14197
58 MUSAKHEDI 2554 3137 3732 4420 5019 5761
59 ANURAG NAGAR 4697 5861 6973 8258 9378 10764
60 PIPLIHANA 14269 17618 20962 24824 28192 32358
61 WATER TANK 1917 2170 2407 2685 2899 3189
62 SHIVMOTI NAGAR 6486 7966 9479 11225 12748 14632
63 NAVA JIVAN APTT 4740 5821 6926 8202 9315 10692
64 NUTAN GOVT SCH 19489 23937 28481 33727 38303 43964
65 NAGAR NIGAM 33026 40563 48264 57155 64910 74502
66 KADABIN 18318 22499 26770 31701 36002 41323
67 SHIV TEMPLE 6265 7695 9156 10843 12314 14134
68 KHAJURI BAZAR 25614 31459 37431 44327 50341 57780
69 SADAR BAZAR(N) 15626 19192 22835 27042 30711 35249
70 MARIMATA SQ 19413 23844 28370 33596 38155 43793
71 GOVT QTRS 4867 5978 7113 8423 9566 10980
72 MARTAND CHOWK 9187 11284 13426 15899 18056 20725
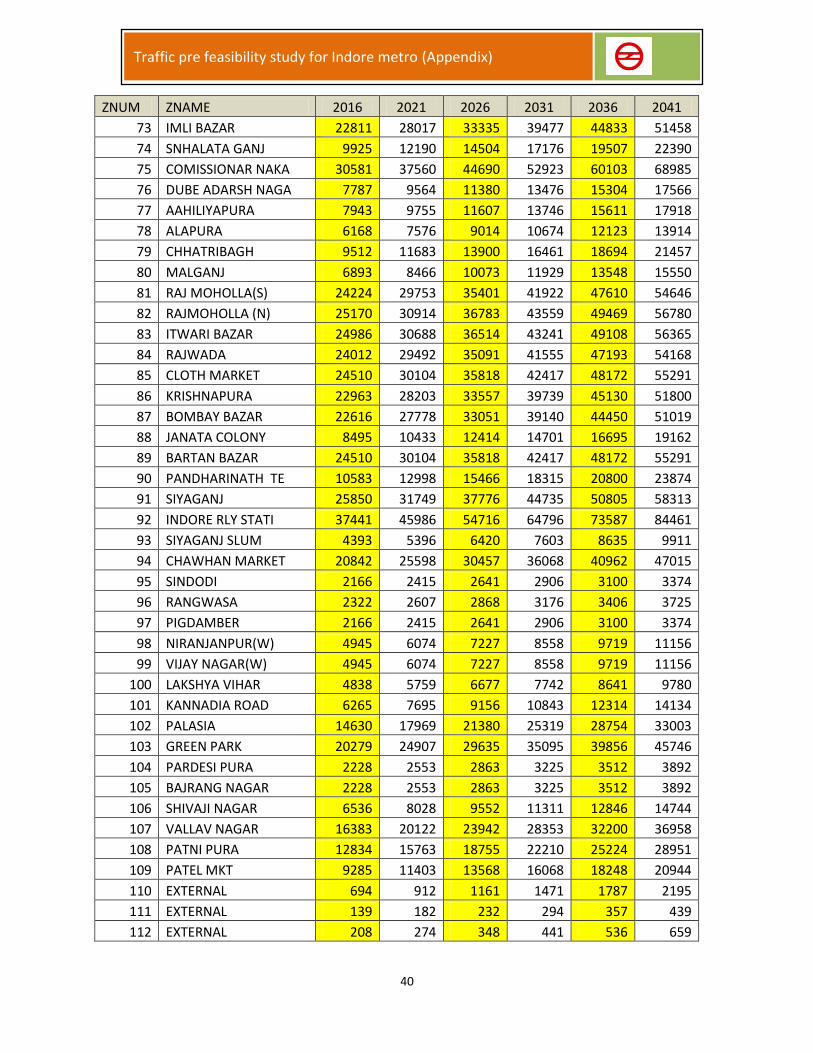
40
Traffic pre feasibility study for Indore metro (Appendix)
ZNUM ZNAME 2016 2021 2026 2031 2036 2041
73 IMLI BAZAR 22811 28017 33335 39477 44833 51458
74 SNHALATA GANJ 9925 12190 14504 17176 19507 22390
75 COMISSIONAR NAKA 30581 37560 44690 52923 60103 68985
76 DUBE ADARSH NAGA 7787 9564 11380 13476 15304 17566
77 AAHILIYAPURA 7943 9755 11607 13746 15611 17918
78 ALAPURA 6168 7576 9014 10674 12123 13914
79 CHHATRIBAGH 9512 11683 13900 16461 18694 21457
80 MALGANJ 6893 8466 10073 11929 13548 15550
81 RAJ MOHOLLA(S) 24224 29753 35401 41922 47610 54646
82 RAJMOHOLLA (N) 25170 30914 36783 43559 49469 56780
83 ITWARI BAZAR 24986 30688 36514 43241 49108 56365
84 RAJWADA 24012 29492 35091 41555 47193 54168
85 CLOTH MARKET 24510 30104 35818 42417 48172 55291
86 KRISHNAPURA 22963 28203 33557 39739 45130 51800
87 BOMBAY BAZAR 22616 27778 33051 39140 44450 51019
88 JANATA COLONY 8495 10433 12414 14701 16695 19162
89 BARTAN BAZAR 24510 30104 35818 42417 48172 55291
90 PANDHARINATH TE 10583 12998 15466 18315 20800 23874
91 SIYAGANJ 25850 31749 37776 44735 50805 58313
92 INDORE RLY STATI 37441 45986 54716 64796 73587 84461
93 SIYAGANJ SLUM 4393 5396 6420 7603 8635 9911
94 CHAWHAN MARKET 20842 25598 30457 36068 40962 47015
95 SINDODI 2166 2415 2641 2906 3100 3374
96 RANGWASA 2322 2607 2868 3176 3406 3725
97 PIGDAMBER 2166 2415 2641 2906 3100 3374
98 NIRANJANPUR(W) 4945 6074 7227 8558 9719 11156
99 VIJAY NAGAR(W) 4945 6074 7227 8558 9719 11156
100 LAKSHYA VIHAR 4838 5759 6677 7742 8641 9780
101 KANNADIA ROAD 6265 7695 9156 10843 12314 14134
102 PALASIA 14630 17969 21380 25319 28754 33003
103 GREEN PARK 20279 24907 29635 35095 39856 45746
104 PARDESI PURA 2228 2553 2863 3225 3512 3892
105 BAJRANG NAGAR 2228 2553 2863 3225 3512 3892
106 SHIVAJI NAGAR 6536 8028 9552 11311 12846 14744
107 VALLAV NAGAR 16383 20122 23942 28353 32200 36958
108 PATNI PURA 12834 15763 18755 22210 25224 28951
109 PATEL MKT 9285 11403 13568 16068 18248 20944
110 EXTERNAL 694 912 1161 1471 1787 2195
111 EXTERNAL 139 182 232 294 357 439
112 EXTERNAL 208 274 348 441 536 659
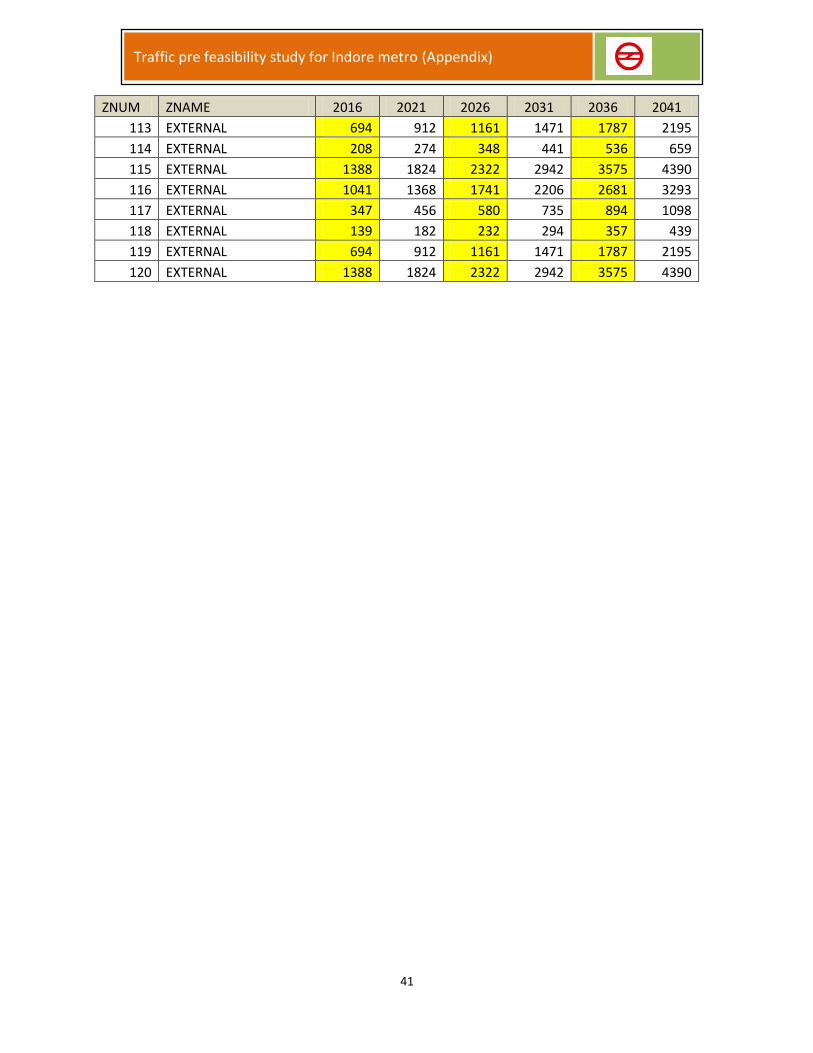
41
Traffic pre feasibility study for Indore metro (Appendix)
ZNUM ZNAME 2016 2021 2026 2031 2036 2041
113 EXTERNAL 694 912 1161 1471 1787 2195
114 EXTERNAL 208 274 348 441 536 659
115 EXTERNAL 1388 1824 2322 2942 3575 4390
116 EXTERNAL 1041 1368 1741 2206 2681 3293
117 EXTERNAL 347 456 580 735 894 1098
118 EXTERNAL 139 182 232 294 357 439
119 EXTERNAL 694 912 1161 1471 1787 2195
120 EXTERNAL 1388 1824 2322 2942 3575 4390


