

Traffic, paths and dwell time By Olivier Delangre [email protected].
38
-
Upload
lesley-may -
Category
Documents
-
view
216 -
download
1
Transcript of Traffic, paths and dwell time By Olivier Delangre [email protected].

Why ?• Action needed !
• Complement/challenge intuition/experience
• Improve understanding of sales numbers
• Validate efficiency of remodeling
• Understand promotion effectiveness
• Match in-store communication with traffic

Easy for online retailers...
No longer “Mission Impossibl
e” for “brick & mortar”
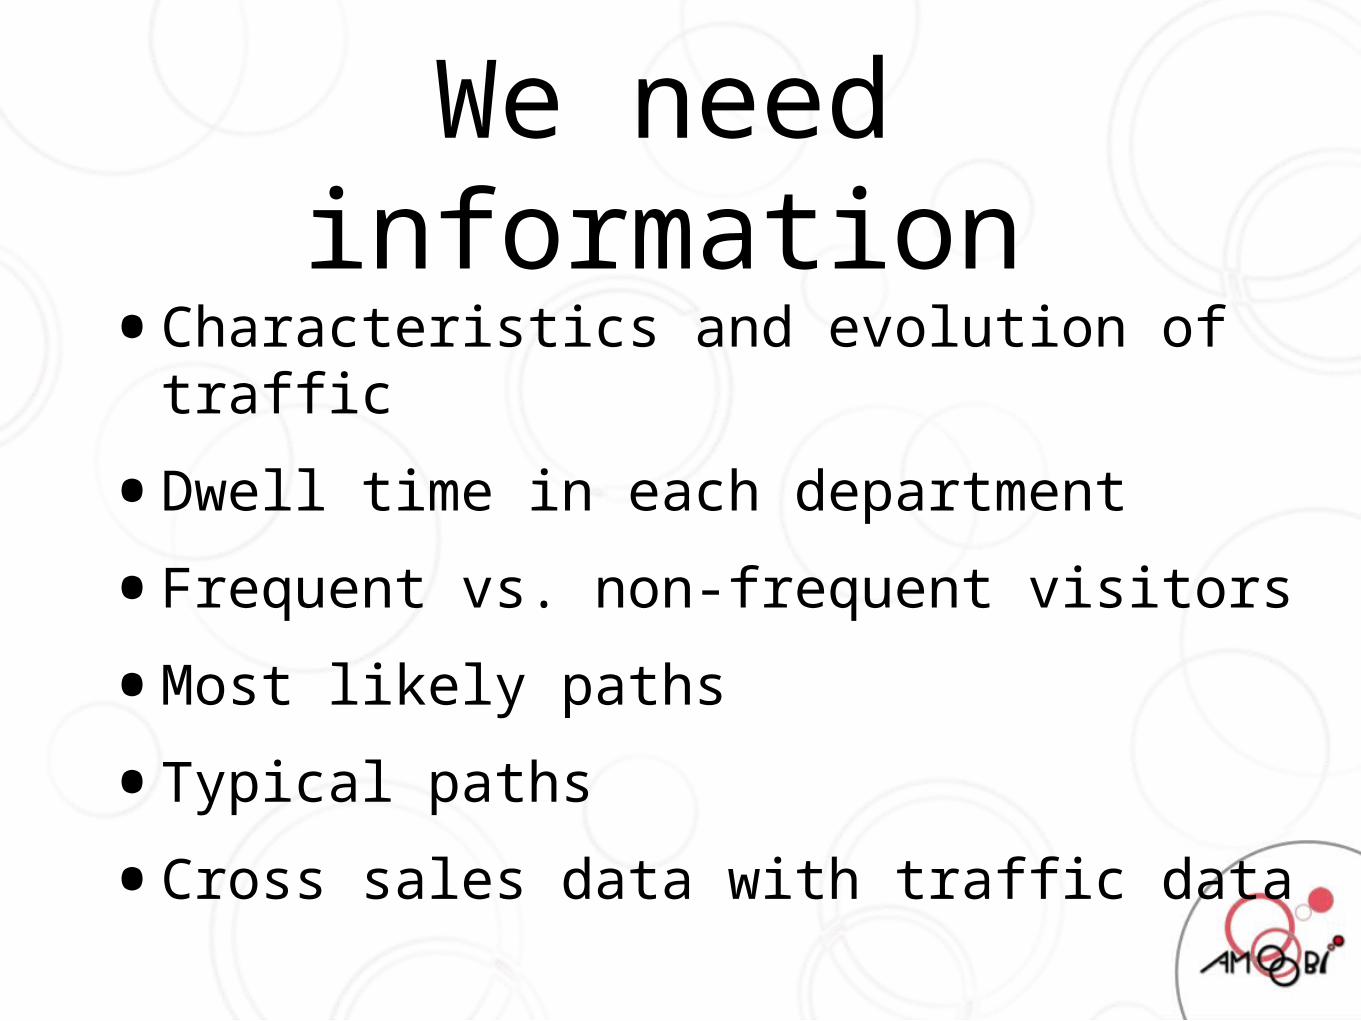
We need information
• Characteristics and evolution of traffic
• Dwell time in each department
• Frequent vs. non-frequent visitors
• Most likely paths
• Typical paths
• Cross sales data with traffic data

Specs for new technology
• Provide actionable insights vs. masses of data
• Sampling, not counting• Transparent for shoppers• Fairness, no privacy issues• Affordable and scalable• Autonomous, no IT integration• Easy install, relocation
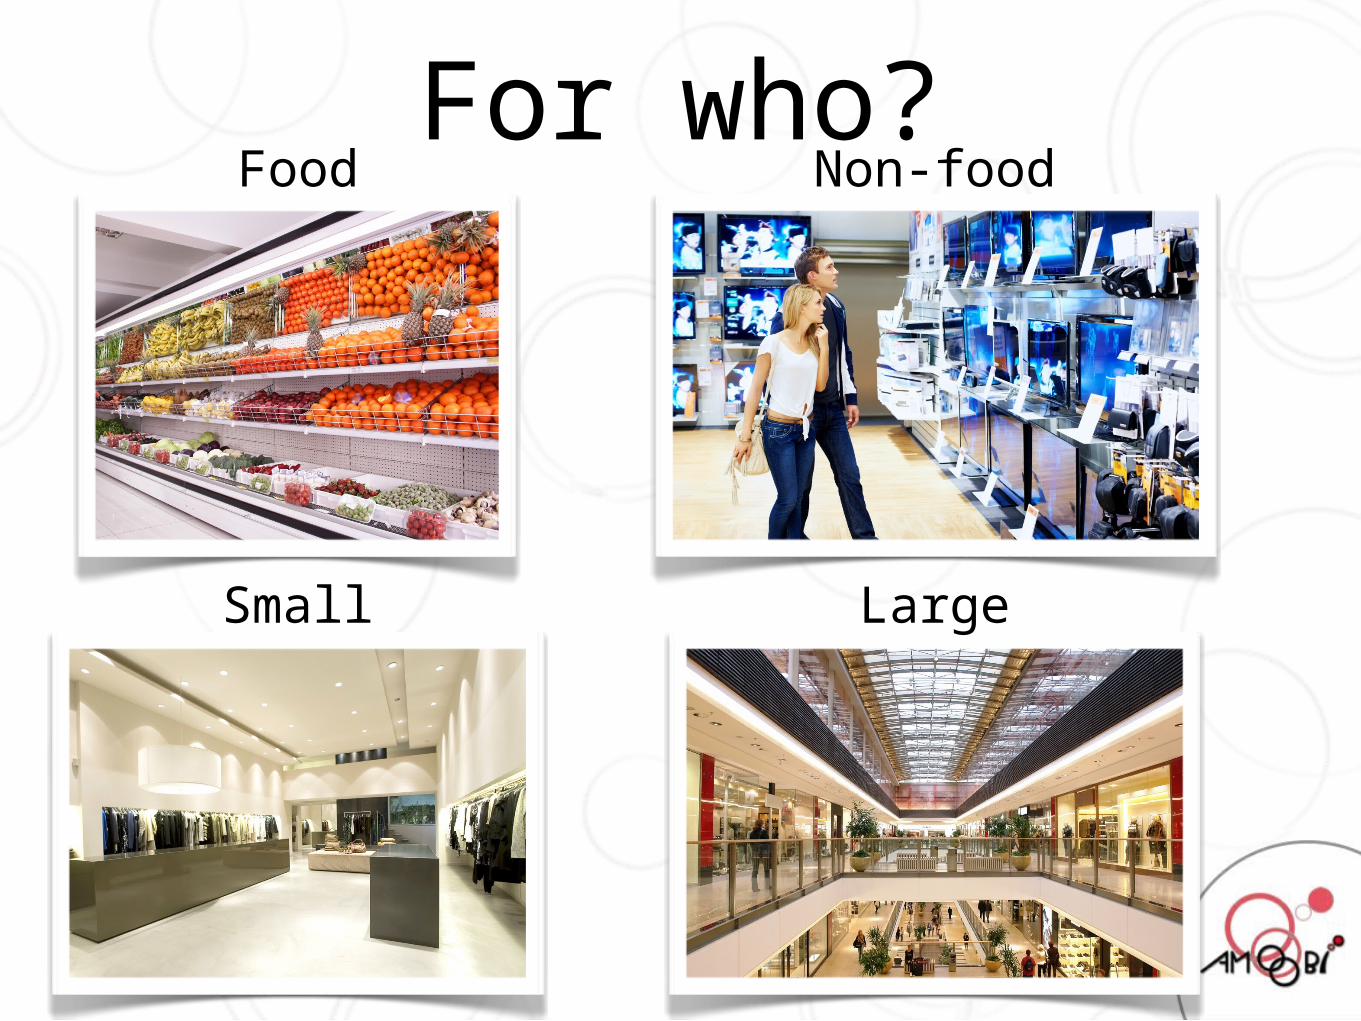
For who?Food Non-food
Small Large

Let’s illustrate
1. Remodeling

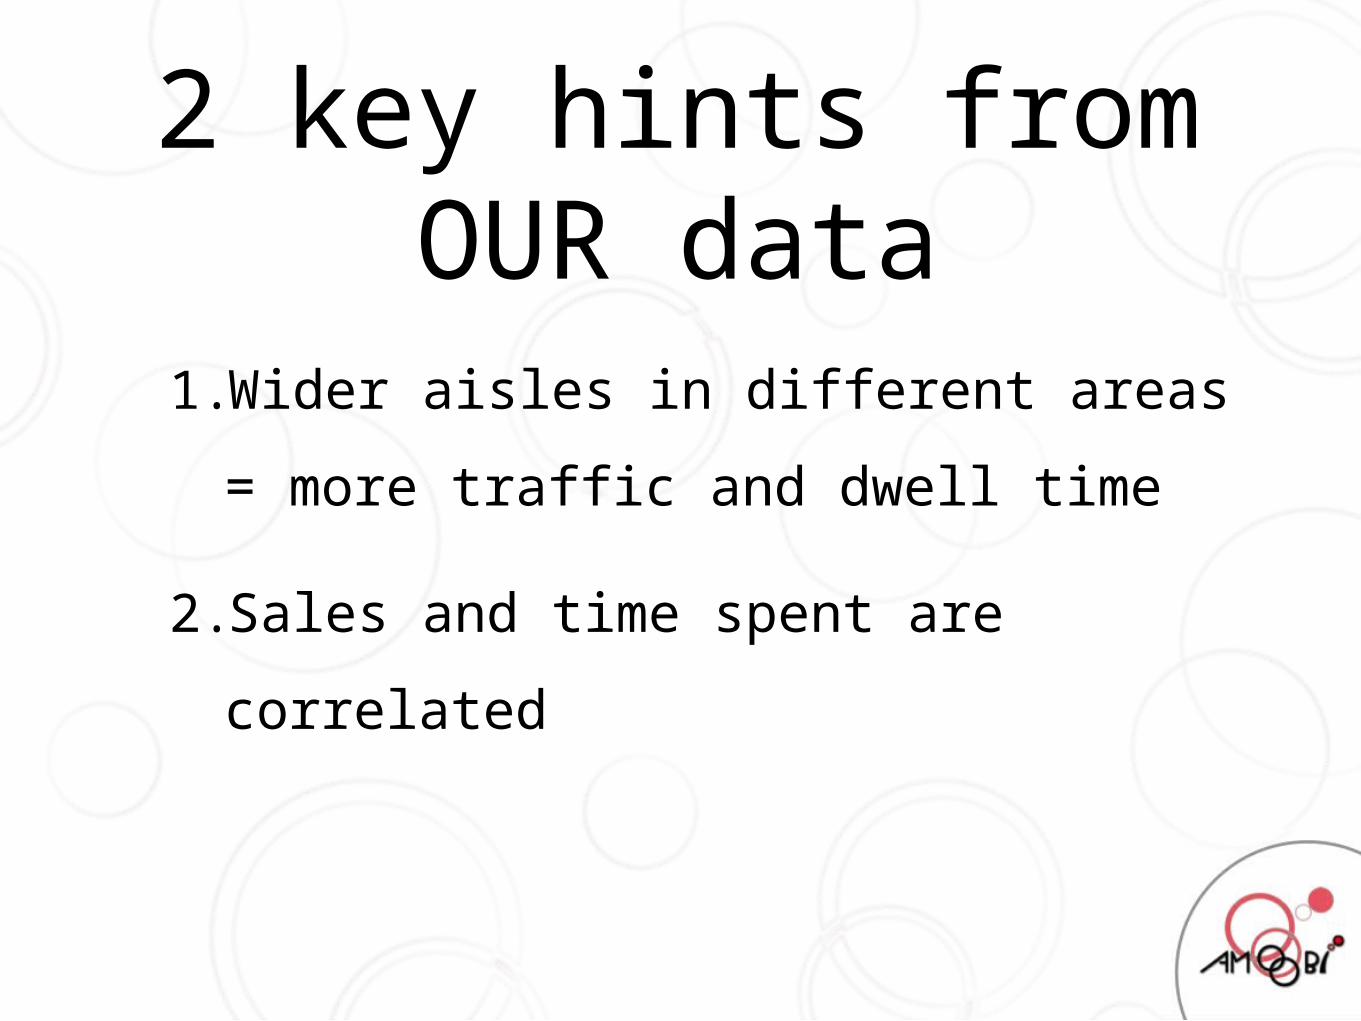
2 key hints from OUR data
1.Wider aisles in different areas =
more traffic and dwell time
2.Sales and time spent are correlated
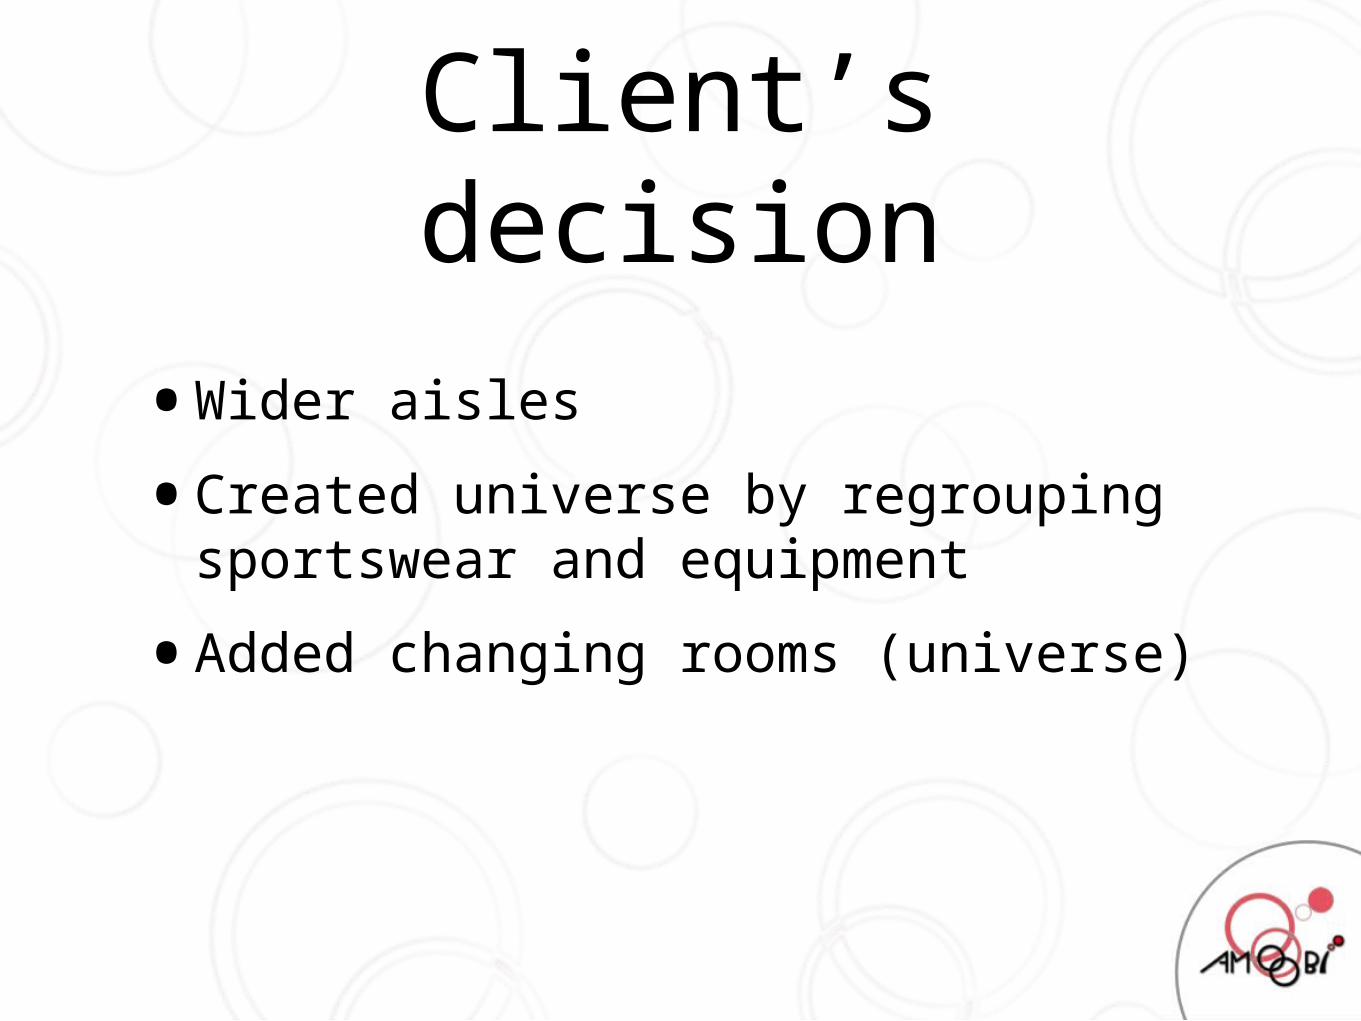
Client’s decision
•Wider aisles
•Created universe by regrouping sportswear and equipment
•Added changing rooms (universe)


2. A supermarket
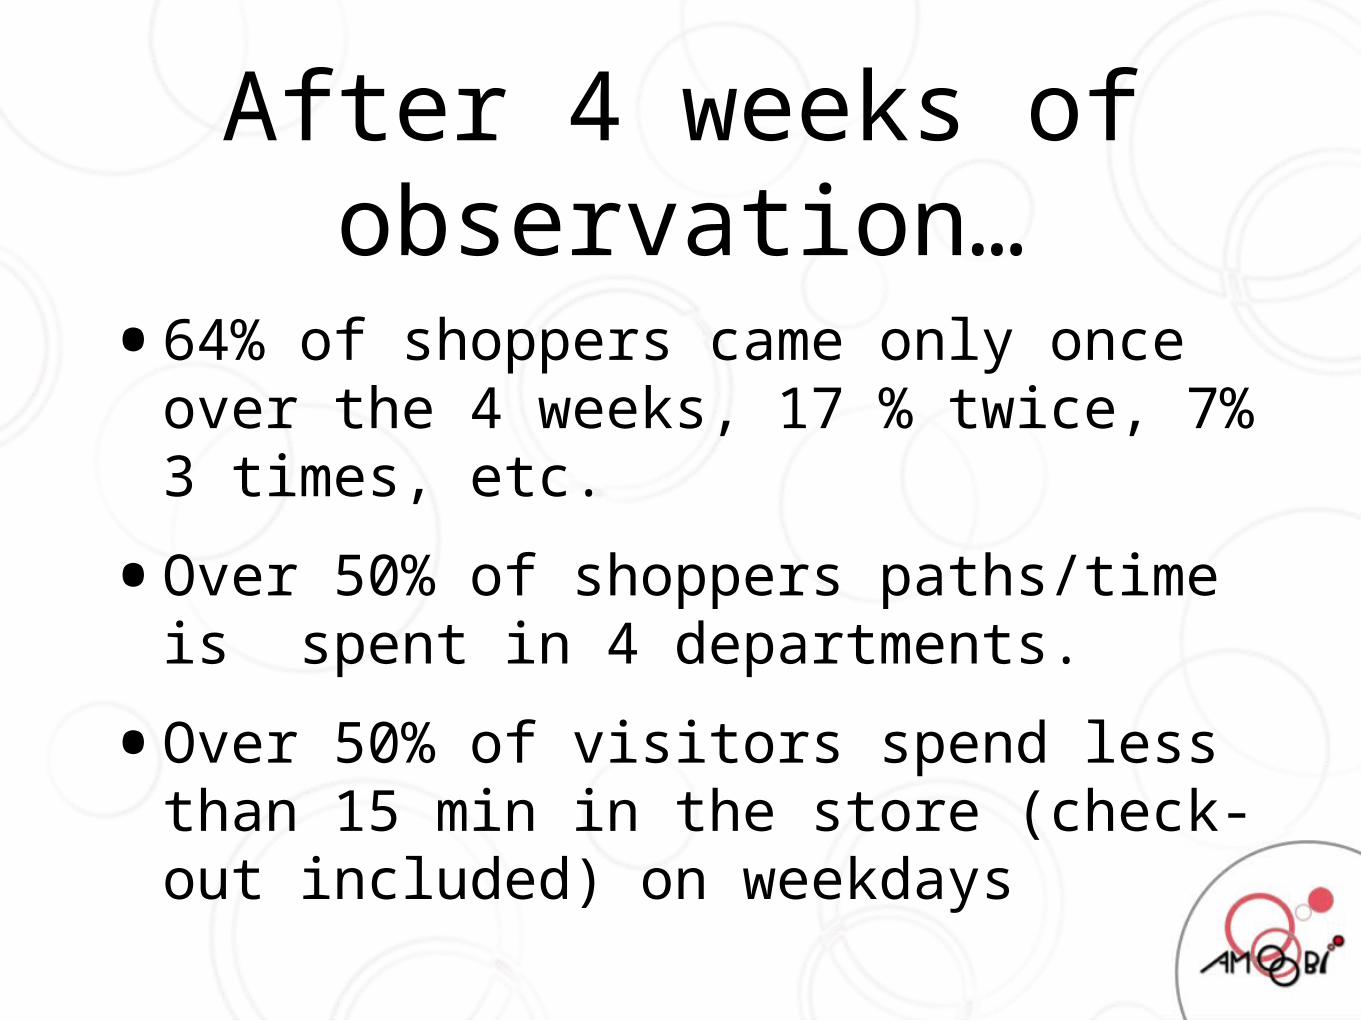
After 4 weeks of observation…
•64% of shoppers came only once over the 4 weeks, 17 % twice, 7% 3 times, etc.
•Over 50% of shoppers paths/time is spent in 4 departments.
•Over 50% of visitors spend less than 15 min in the store (check-out included) on weekdays

3. Another remodeling


Turnover
Clients (purchased
something in this department)
Basket
-2,1%
-19,4%
+21%

Visitors (people who entered the department)
Conversion rate
(Clients/visitors)
Dwell time intra
department
+11,2%
+26,6%
+1,4%
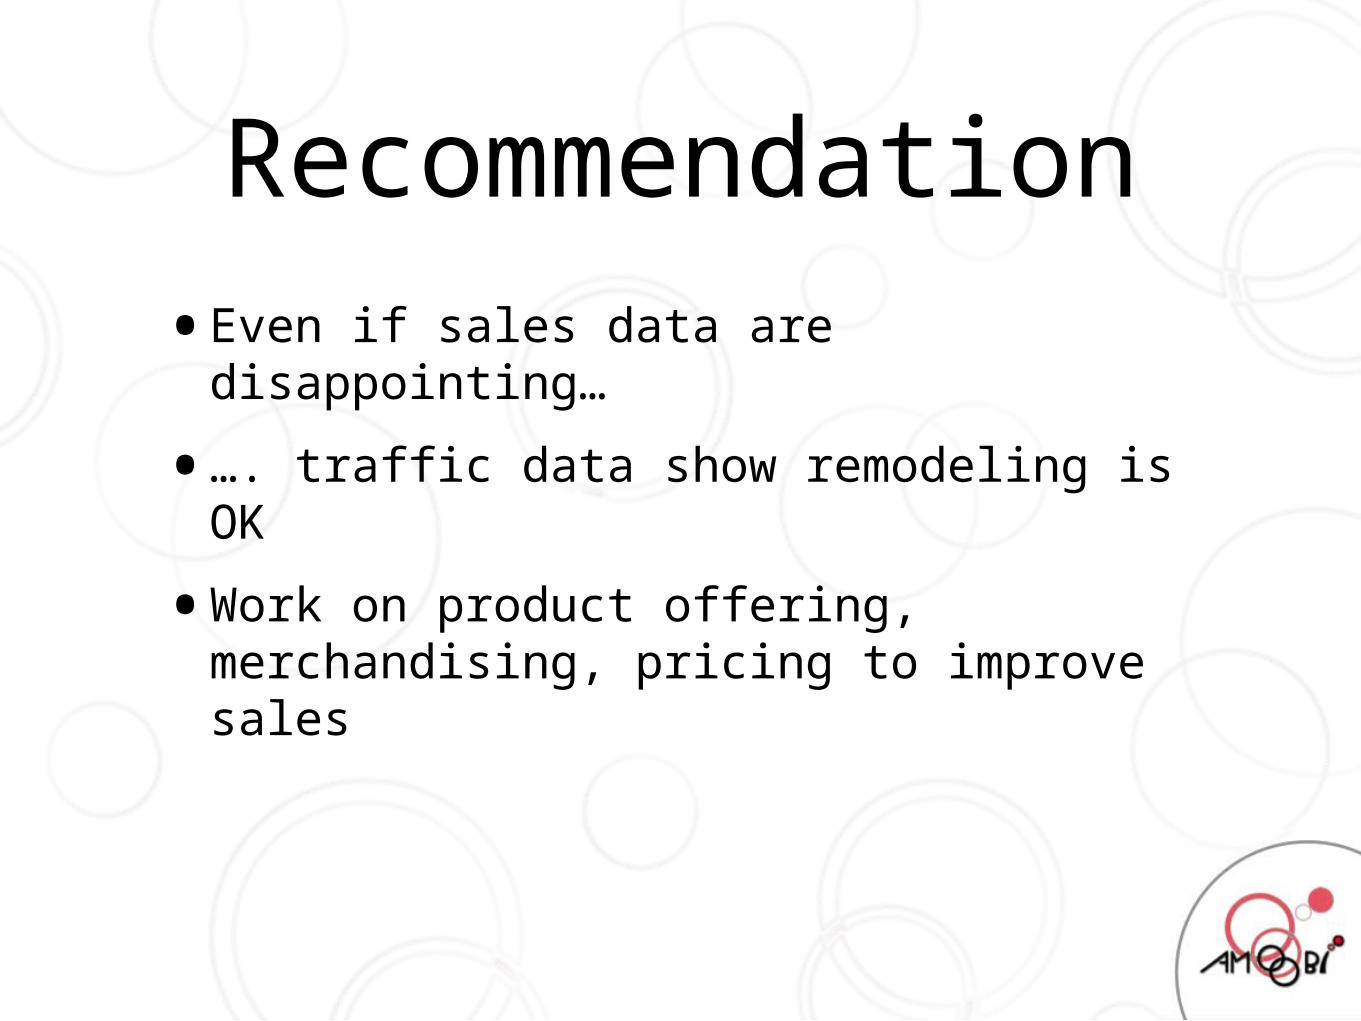
Recommendation
•Even if sales data are disappointing…
•…. traffic data show remodeling is OK
•Work on product offering, merchandising, pricing to improve sales
4. Impact of promotions


Exposure
+27%

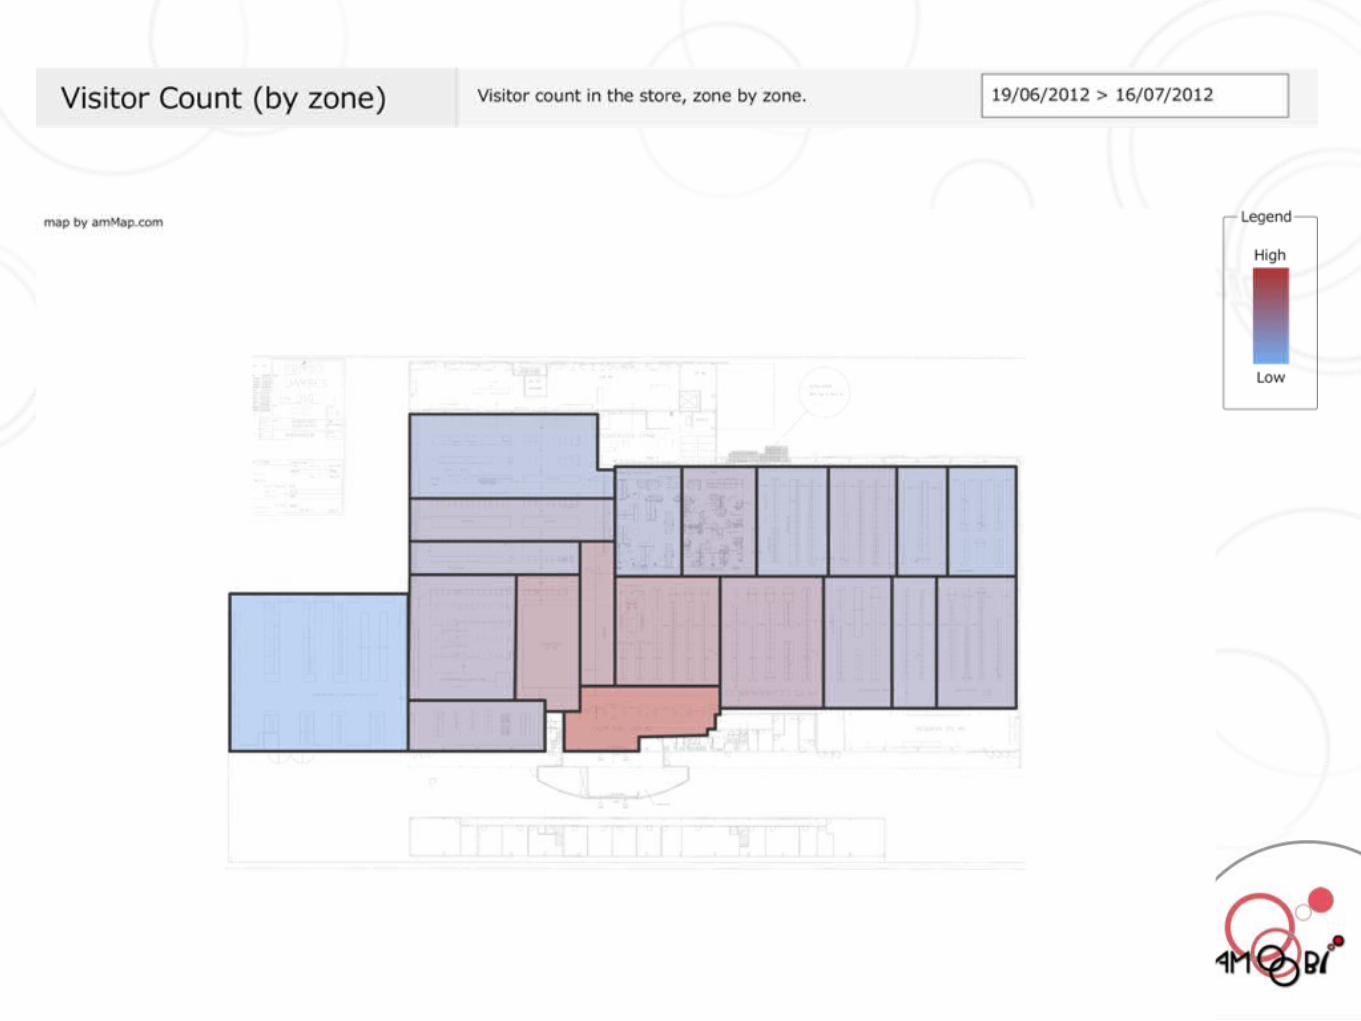
5. Going beyond “numbers”

“Typical” paths

Qualified traffic
Contributionto
turnover
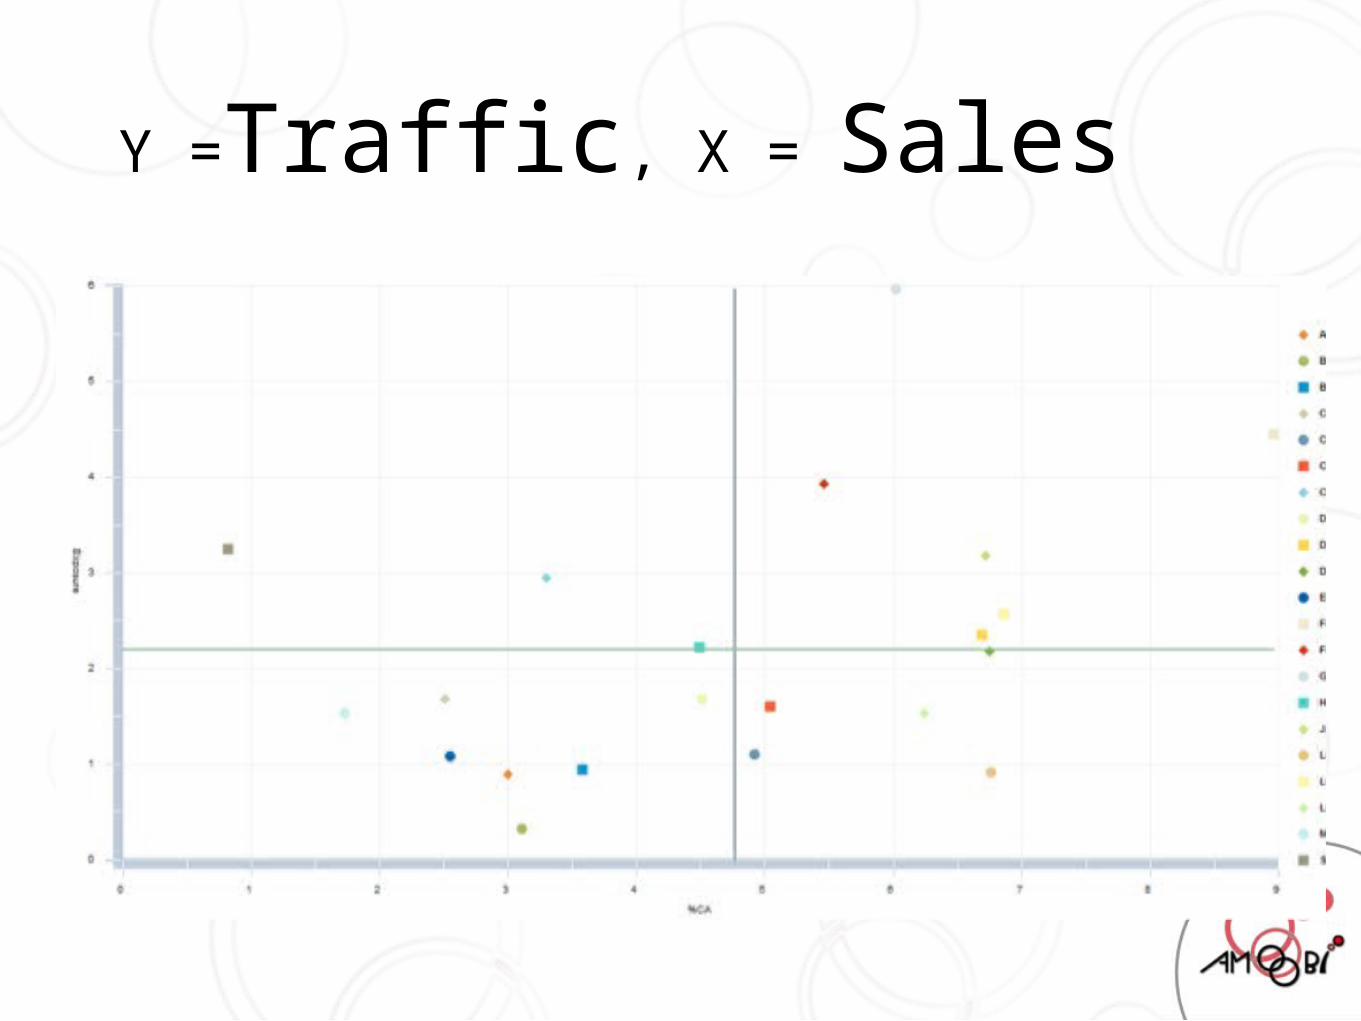
Y =Traffic, X = Sales

Focus on comparisons and evolution !
•Compare shops
•Compare shop over time
•Cross with sales data

OK, now, how does it work ?


Real time analytical tool

Want to know more?
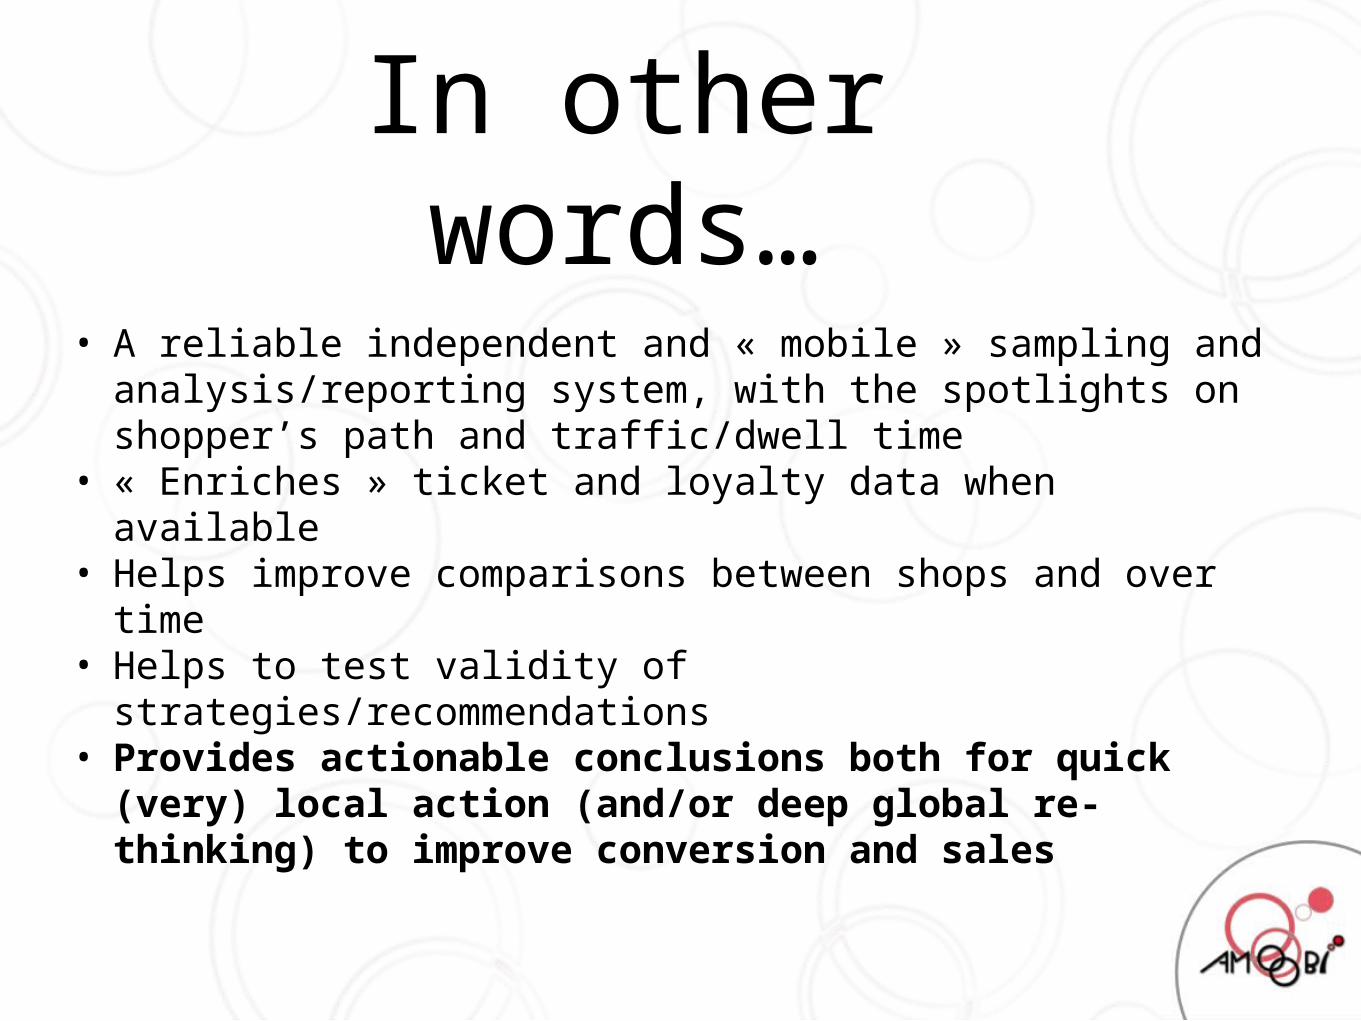
In other words…
• A reliable independent and « mobile » sampling and analysis/reporting system, with the spotlights on shopper’s path and traffic/dwell time
• « Enriches » ticket and loyalty data when available• Helps improve comparisons between shops and
over time• Helps to test validity of
strategies/recommendations• Provides actionable conclusions both for
quick (very) local action (and/or deep global re-thinking) to improve conversion and sales

• Maze of failsafe wirelessly interconnected detectors collect data
• Permanent wireless transfer to (nodes and) servers « in the cloud » via 3G
• Data treatment by proprietary SW• Authorized access to results via login
& PW, secured site, Internet• Permanent remote monitoring of
every installed component, « on the fly » replacement if fault
• No connection to Client’s ITC
Technically…