
Traffic-Engineering-Applications-Ebook
53
Miovision E-book Traffic Engineering Applications for Data Collection
Transcript of Traffic-Engineering-Applications-Ebook

Miovision E-book
Traffic Engineering Applications for Data Collection

1
In this E-BookThis E-book is meant to illustrate how Miovision’s Traffic Data Solution fits in with your Traffic Engineering Projects. The book includes:
1. Foundation for Successful Engineering Projects
2. Data for Signal Timing and Corridor Progression
3. Data for Traffic Impact Studies
4. Data Collection Technology Comparison
5. Integrating with Miovision
About MiovisionMiovision Technologies is an industry-leader in providing accurate, quality, and timely data for transportation professionals everywhere.
Since 2005, Miovision has grown to nearly 100 employees across two offices in Kitchener, Ontario, Canada and Köln, Germany. Our products and services are used by over 400 customers in over 30 countries worldwide.
Traffic Data Collection with MiovisionFor those who Outsource:Traffic Data On Demand »
For those with In-House teams:Scout Video Collection Units »

2
Four I’s of Good Traffic Data
Integrity. Data that is timely, accurate, complete and verifiable.
Information. Data integrity, along with transportation engineering expertise, leads to better and more accurate assumptions.
Intelligence. Further expertise, knowledge, and other tools allow for the intelligent use of Information. This is the basic building block of sound engineering judgment.
Informed Action. Well assembled and supported Intelligence leads to informed action by decision makers.
Implications of Bad Traffic Data
Poor Execution. With bad data, engineering and infrastructure projects have a weak base to start from - resulting in projects that exceed timelines, budgets and compromise results.
Compromised Results. Poorly executed projects lead to lower than anticipated Level-of-Service (for example); and ultimately affect the Engineering Firm’s reputation.
eg. Signal Timing Plan: Under-reported volume can lead to shorter signal phases, and create long queues. Over-reported volumes result can result in increased delay for certain movements.
Complaints & Problems. Traffic delays, accidents, and overall driver frustration will persist soon after project completion.
Good Data: Foundation for Engineering Projects

3
Example: BRAC North VirginiaHeadline News:$1 Billion BRAC mistake: Traffic upends plans for 6,400-person facility - Federal Times, October 2010
The Defense Base Closure and Realignment Commission (BRAC), is directed at closing excess military facilities and reducing overall expenditures. In 2005, this process would move about 6,400 workers from the Pentagon to the new Department of Defense Headquarters at the Mark Center in Alexandria, Virginia.
Once the $1 billion facility was constructed, heavy traffic congestion was immediate. It was later determined that faulty traffic data was used and the location did not have the infrastructure or transit to support this influx of people. It was selected as it was the lowest bid.
What was the damage?• Only 1,000 parking spaces were built for
nearly 6,400 personnel.• Lack of supporting infrastructure and no
access to nearby Metro or Rail stations.• Level-of-Service was severely compromised on
6 major intersections in Alexandria.• An additional $100 million are going towards
improvements ($20M DoD; $80M VDOT).

4
Although Traffic Data Collection is often a fraction of an overall Engineering Project, it can impact the entire project and results.
Importance of Data Accuracy
InaccurateData
DECREAsEDLevel-of-Service
DECREAsEDDriver Satisfaction
INCREAsEDCosts & Investments
INCREAsEDTime & Effort
DECREAsEDDriver Satisfaction

5
Importance of Data IntegrityTimely. Simply applying a growth factor to historical data can severely reduce accuracy, especially with other factors such as economic downturn, or increased commercial development.
Accurate. Accurate data is the foundation for all Engineering Projects. Without a solid foundation, project recommendations, execution, and outcomes will falter.
Complete. Having complete data helps draw a more accurate picture of project requirements. For example, vehicle classifications & pedestrian data offer a complete picture of an intersection.
Verifiable. How will you know your traffic data is accurate? Having the ability to review data abnormalities provides supporting evidence to recommendations and piece-of-mind.
“ ”Decisions about major public investments to the sum of hundreds of thousands of dollars are predicated on data.
Tom Springer, AICP, CEPQk4 Engineering

6
Webinar Poll: Checking Data Accuracy
““ ”
”
We use tubes to collect data between intersections to ensure accuracy.
We review data for anomalies and try to determine the cause. (eg. collisions, construction, poor weather).
How often do you check data accuracy?
How do you check data accuracy?
50
40
Never/Barely Ever
Annually Monthly Every Project
30
20
10
0
Num
ber
of R
espo
nde
nts
(N=
74)
Frequency of Data Checks

7
Miovision Video Accuracy: Validated
Traffic Counting at Roundabouts Using Video Technology: A Practitioner’s View
Our customers Ting Wei and Jeromy Grenard of American Structurepoint requested to Miovision that they do an accuracy test on Miovision’s equipment due to the increasing amount of roundabouts in Indiana.
We sent them the equipment which allowed them to test Miovision’s data collection solution alongside a manual counter counting from video. The results show that Miovision was over 96% accurate across two different roundabouts in Indiana.
Miovision shown to be 96% and 96.1% accurate at AM Peak and PM Peak periods respectively.

8
Webinar Poll: Types of ProjectsWhich Engineering Projects do you collect traffic data for most often?
60
AADT/Vo
lum
e stu
dies
Other
safet
y
Corrid
or s
tudi
es
Origin
-Des
tinat
ion
Capac
ity A
nalys
is
Traf
fic Im
pact
stu
dies
Trav
el Ti
me
Calib
ratio
n
signa
l Tim
ing
War
rant
Ana
lysis
Retai
l Pro
jects
40
50
30
20
10
0
Num
ber
of R
espo
nde
nts
(check all that apply)

Data for Signal Timing

10
What to improve?
Project Scoping
What to collect?
DataCollection
What to optimize?
Model Development & Optimization
What to measure?
Evaluation
What totest?
Policy Confirmation
Implement
What to monitor?
Assessment/Reporting
PerformanceMeasurement
signal TimingQ
uest
ions
&
Obj
ecti
ves
Exec
utio
n
Although Data Collection is a small piece of the overall Signal Timing puzzle, it has a direct impact on every Question & Objective.

11
Webinar Poll: Classification schemes
25
0-9 10-49 50-99 100-199 200-499 500-999 1000+
20
15
10
5
0
Num
ber
of R
espo
nde
nts
Number of signals in Jurisdiction
The chart below indicates the number of traffic signals in each respondent’s jurisdiction.
The majority falls between 50-999 total signals, which represent about 78% of respondents.
(N=
75)

12
signal Timing: What to Improve
The main reasons for a Signal Timing project are a symptom of delay:• Improve two-way progression, performance at
intersecting arterials;• And in turn, reduce fuel consumption,
emissions, travel time and driver complaintsBy addressing these areas, we’re hoping to improve Level-of-Service.
Common Goal:
Reduce Delay at Peak Periods
LEss sPENTon Gasoline
REDUCEDCarbon Emissions
FEWERFrustrated Drivers

13
signal Timing: What to Collect
Cities are now becoming increasingly multi-modal and drivers share the roads with other users.
Collecting data and improving service is a balanced evaluation of the trade-offs between priority of all users’ needs.
sPECIAL UsERs?
BIkEs?
TRANsIT?HEAVy TRUCks?
VEHICLE CLAss?

14
Classifications: Our CustomersMiovision decided to take a look at the last 45,000 Intersection Count studies that our customers have conducted with Scout VCUs or with Traffic Data On Demand.
Below are the Top 5 Classification scheme options our customers have used:
1. Pedestrian, Car, Truck2. Pedestrian, Car3. Car, Medium Truck, Heavy Truck4. Pedestrian, Car, Pedal Bike (Road), Truck5. Car
sPECIAL UsERs?
BIkEs?
TRANsIT?HEAVy TRUCks?
VEHICLE CLAss?
Pedestrian Options65% of studies
Bike (Pedal/Road) 57% of studies
15
Project Scoping
DataCollection
Model Development & Optimization
Evaluation Policy Confirmation
Implement
Assessment/Reporting
PerformanceMeasurement
signal Timing Data CollectionEx
ecut
ion
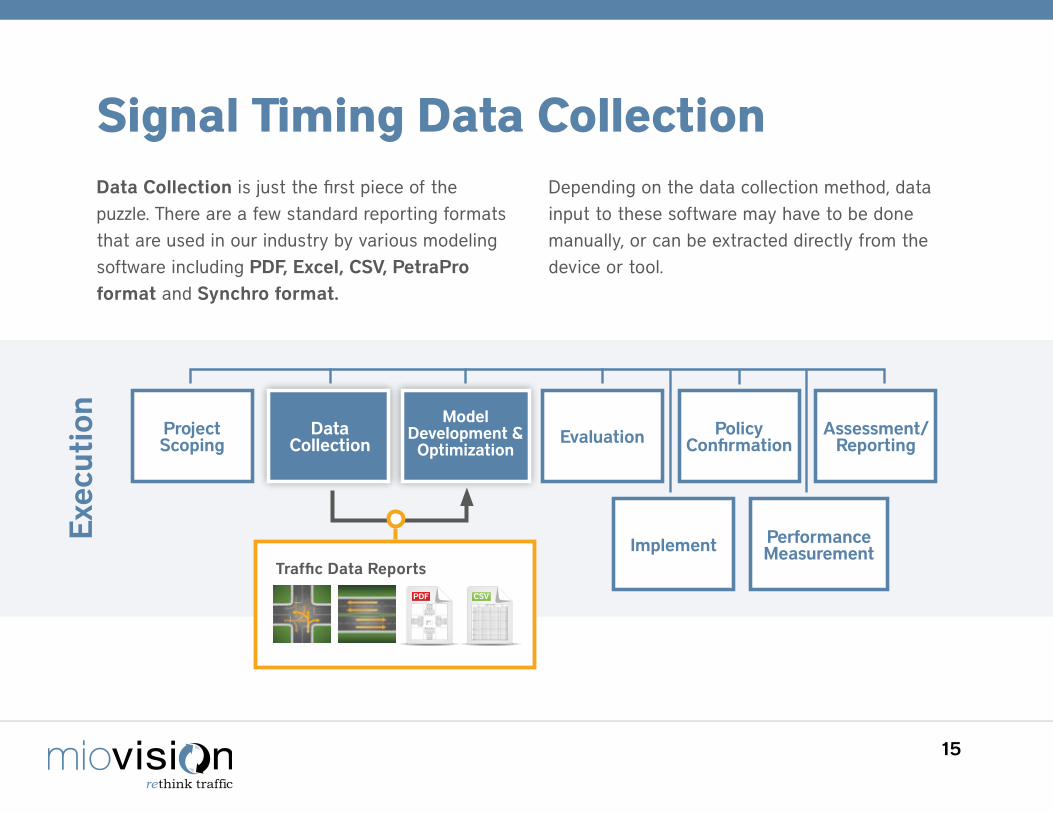
Data Collection is just the first piece of the puzzle. There are a few standard reporting formats that are used in our industry by various modeling software including PDF, Excel, CSV, PetraPro format and Synchro format.
Depending on the data collection method, data input to these software may have to be done manually, or can be extracted directly from the device or tool.
Traffic Data Reports
CSVPDF

Data for Corridor Progression

17
Webinar Poll: Data Collection for CorridorsWhen collecting data for corridors, the best-case scenario is to collect same-day data. This will ensure consistency, and typically eliminate the need for day-over-day data balancing. However, due to a lack of resources or equipment, this is usually difficult.
To determine how webinar attendees get around this challenge, we gathered input on how they collect data for large corridor projects, and which simulation software they use.
50
40
Large TeamSame-day
Med. Team Multiple Days
small Team Numerous
Days
Other
30
20
10
0
Num
ber
of R
espo
nde
nts
Data Collection for Corridors
simulation software Used
**Other responses included: • SIDRA (6%); PTV Vissim/Vistro (8%);
CORSIM (5%); Other (5%)• N=88
77%of respondents
use Synchro
(N=
80
)
18
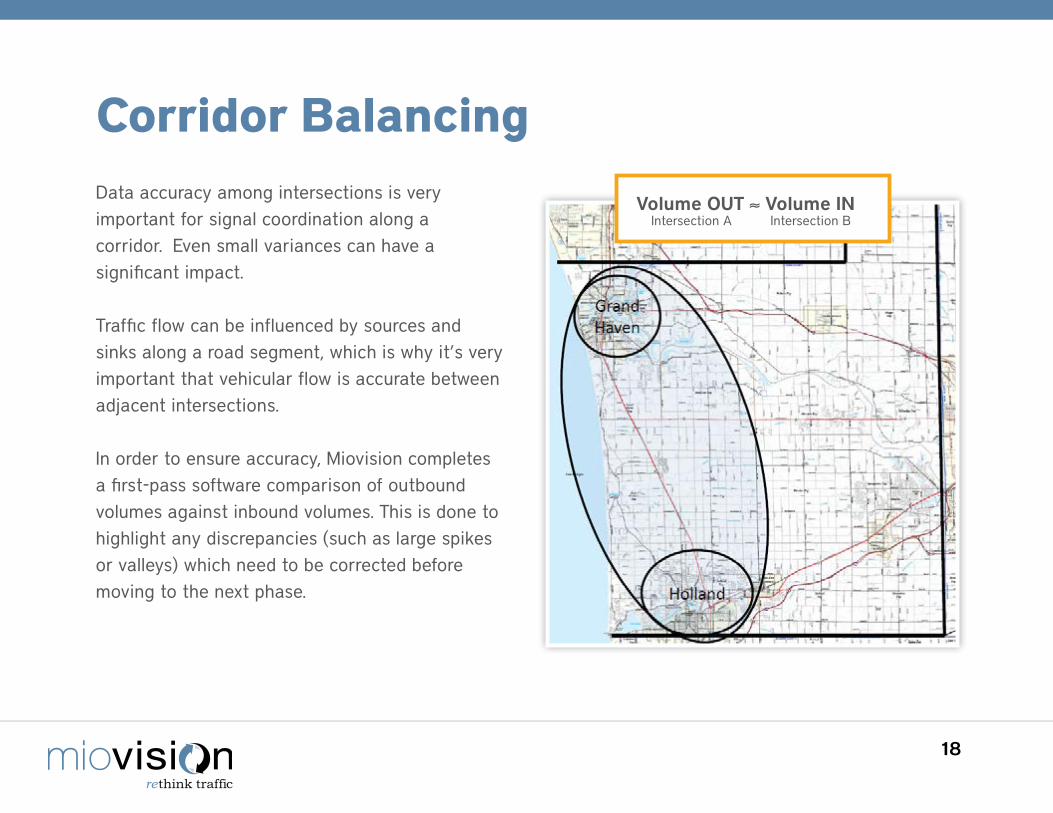
Corridor BalancingData accuracy among intersections is very important for signal coordination along a corridor. Even small variances can have a significant impact.
Traffic flow can be influenced by sources and sinks along a road segment, which is why it’s very important that vehicular flow is accurate between adjacent intersections.
In order to ensure accuracy, Miovision completes a first-pass software comparison of outbound volumes against inbound volumes. This is done to highlight any discrepancies (such as large spikes or valleys) which need to be corrected before moving to the next phase.
Volume OUT ≈ Volume INIntersection A Intersection B

19
Michigan Large scale signal Optimization
Below is a customer case study for URS which will illustrate Miovision’s impact on data collection projects and corridor studies. URS used Miovision and manual methods to collect traffic data for their Western Ottawa Michigan large-scale signal retiming project.
The objectives of the project were in-line with the objectives of many other signal re-timing projects across the country.
Reduce Travel Times, Fuel Consumptionand Emissions
Improve Transportation Safety and Mobility without Added Capital Investment
standardize Traffic Signal Operating Parameters; Pedestrian Crossing Clearance Times Total Population: 264,000

20
Project Requirements: URs
Data Collection
8hr Intersection Counts at 122 intersectionsThree classifications:
1. Passenger Vehicles2. Heavy Vehicles3. Pedestrians
Time Frame8 weeks on T/W/ThAvoid Spring Break weekAvoid Tulip Time Festival week
Method
Manual Counts42 intersectionsOne full-time; four part-time technicians
Miovision Counts80 intersectionsOne technician15 video collection units
URS did a side-by-side effort and accuracy analysis of Miovision vs. Manual Counting as pre-work into a larger investment into Miovision’s technology and both URS and Miovision are happy with the results.
URS chose to count 42 intersections manually with one full-time and four part-time technicians, and counted the remaining 80 with Miovision using one technician and 15 video collection units.
21
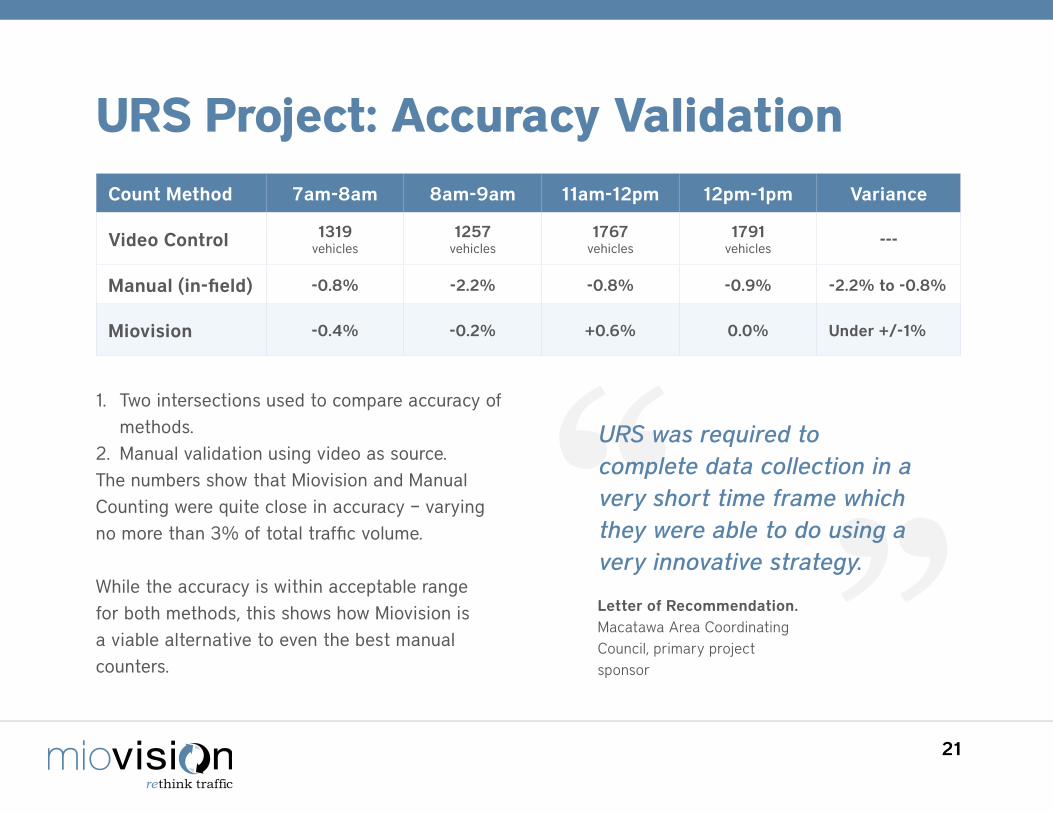
URs Project: Accuracy ValidationCount Method 7am-8am 8am-9am 11am-12pm 12pm-1pm Variance
Video Control 1319vehicles
1257vehicles
1767vehicles
1791vehicles
---
Manual (in-field) -0.8% -2.2% -0.8% -0.9% -2.2% to -0.8%
Miovision -0.4% -0.2% +0.6% 0.0% Under +/-1%
1. Two intersections used to compare accuracy of methods.
2. Manual validation using video as source.The numbers show that Miovision and Manual Counting were quite close in accuracy – varying no more than 3% of total traffic volume.
While the accuracy is within acceptable range for both methods, this shows how Miovision is a viable alternative to even the best manual counters.
“ ”URS was required to complete data collection in a very short time frame which they were able to do using a very innovative strategy.
Letter of Recommendation. Macatawa Area Coordinating Council, primary project sponsor

22
Manual Data Collection
Data Collection 1.5 staff x 8hr = 12hrs
Travel 2hrs
Total 14hrs/intersections
Savings ---
Cost $580
Cost Savings ---
URs Project: Effort Comparison (8hr day)
Once accuracy was determined, URS compared the costs and effort required for deploying a team of technicians, vs. sending one technician with video collection units.
The difference, as illustrated below, is significant, with the Miovision data collection required11.5 hours less than using a manual method.
Miovision Data Collection
1/2hr equipment deployment
2hrs
2.5hrs/intersections
-11.5hrs
$270
$310

23
URs Project: Big Results
Big Results
311,000 hoursReduction in Annual
Delay Time
10% Reductionin Vehicle Collisions
$5 millionin Annual savings
12.5 to 1Benefit-to-Cost Ratio

24
Industry Validation: Albeck Gerken
Another customer,Albeck Gerken in Florida, has also done a direct comparison of using Miovision vs. Traditional methods. They found us to be over 96% accurate across two sites tested.
Jeff Gerken explains in the white paper (available for download]) that Miovision is easy to deploy and the video recording is a great tool for auditing traffic conditions.
Count MethodTest Case #1
Total Entering VolumeTest Case #2
Total Entering Volume
Control (Manual from Video) 7,364 4,412
Miovision 7,157 4,590
Accuracy 97.2% Accurate 96% Accurate
“ ”The additional benefits of easy deployment, reduced requirements for trained staff, and the unique aspect of an audit trail make Miovision a viable alternative to traditional manual turning movement counting.
Jeff Gerken, PE, PTOEAlbeck Gerken.Accuracy Comparison of Non-‐Intrusive, Automated Traffic Volume Counting Equipment

Data for Traffic Impact Study (TIS)
26
What to improve?
Project Scoping
What to collect?
DataCollection
What to optimize?
Model Development & Optimization
What to measure?
Evaluation
What totest?
Policy Confirmation
Implement
What to monitor?
Assessment/Reporting
PerformanceMeasurement
Traffic Impact studiesQ
uest
ions
&
Obj
ecti
ves
Exec
utio
n
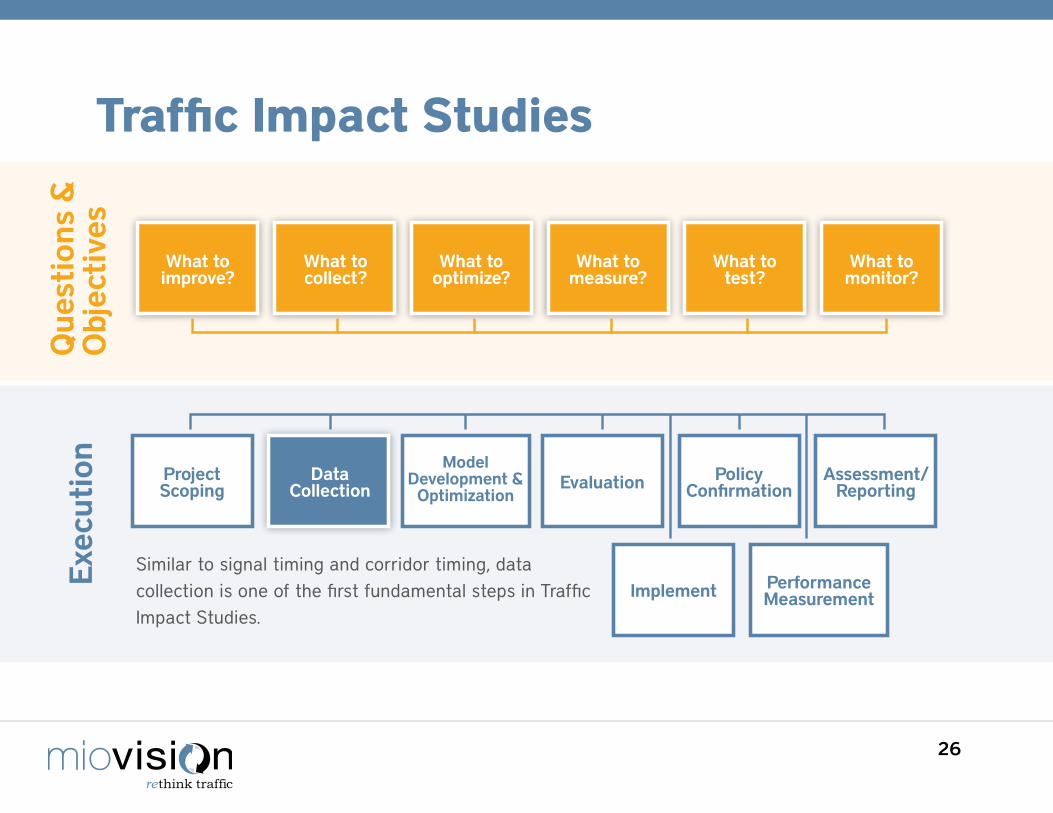
Similar to signal timing and corridor timing, data collection is one of the first fundamental steps in Traffic Impact Studies.

27
TIs: What to Improve
“““
““
”””
””
What’s the time horizon?
Am I making a recommendation?
How does the system currently function?
What’s the land use? Who are the users?
How will I present info to non-technical
decision makers?
Engineers have to exercise their engineering judgment when doing Traffic Impact Studies including asking questions like:

28
Engineers must also ask questions like:• When are the peaks? Is there shift work?• Is it a CBD, Urban, Suburban, Rural project?• What type of development is proposed?• Who are the users? Where are they coming
from? How are they traveling? Where are they going when they leave?
TIs: What to Collect
Rural? Suburban? Urban? CBD?
Volumes Multi-modal
Trip Distr.
Geom-etry
Trip Gen.
Monday Tuesday
Friday
Wednesday
Saturday
Mid-dayPeak
Thursday
AM, Noon, PM Peaks
Sunday

29
TIs: What to OptimizeFor a common project like redevelopment of an industrial block into a new mixed-use commercial and office space, an Engineer must consider more than just the immediate surroundings.
Development proposal?Rezoning?Master Planning?User Needs?Time Horizon?

30
TIs: Ideal Video-Based Volume & Class Locations
Major Arterials
Unsafe Deployments
Freeways and Highways
On/Off Ramps
Queuing Traffic
Video technologies also have a distinct advantage over road tubes in the following conditions: High speed roadways, on and off ramps, queuing traffic or areas that are
susceptible to consistent stop-and-go traffic, undivided arterials and any areas that are dangerous for roadway deployment or expensive.

31
TIs: 24hr Intersection & segment Count
Engineering firms can utilize either in-house or outsourced solutions to collect arterial volumes and intersection counts for traffic impact studies.
Collecting a 24-hour TMC with segment volumes is a time and cost effective method for collecting this data. Receive an intersection report for peak hours during the 24 hour time period along with an export for each arterial volume, totaling five reports. Vehicle classification including bicycle, pedestrian and transit are available.
CSV JCD
JAMAR
PDF PPD
JAMAR
JCD
TES UTDF
Lane
CSV
UTDFVolume
CSVXLS
4 Leg
XLS
8 Leg
One Intersection Count +Four (4) ADT Counts

32
24hr Intersection & segment Volume Count
Manual method includes laying road tubes or using numetrics which are both highly intrusive. Data accuracy cannot be verified and it provides four 24-hour volume and classification reports.
To collect data with a video solution, you can either collect this data in-house using the appropriate hardware or outsourcing it to a vendor that utilizes video hardware.
Video is a non-intrusive data collection method that provides a video record, which can be utilized for quality assurance. With Miovision, users would receive a 24-hour intersection report which you can extract peak-hour information along with four volume reports, all with vehicle classifications. Plus a video recording that can be reviewed and provide additional insight in the intersection.
Manual Methods
Method 4-8 tubes
Safety Intrusive
Accuracy Unknown - No check.
Data Reports Delivered4 x 24hr volume +
classification
Video System
In-house data collectionOR Outsourcing
Non-Intrusive
Video record
4 x 24hr volume + class1 x 24hr Intersection Count

33
24hr Intersection & segment Volume Count
Manual Methods
Single Road Tube Deployment $150-$250
# at Each Intersection 4
6hr Peak HoursIntersection Count
$390 ($65/hr)
24 hr Intersection Count N/A
Classifications
Final Cost $990 - $1,390
Above is a rough cost breakdown of tube deployment versus using a video data collection solution such as Miovision for a 24-hour intersection and segment volume count.
In the end, by using a video solution like Miovision’s, Engineers can get more data for similar or less cost - including longer studies and more robust classifications.
(1) Costs are calcualted on a Miovision per credit rate of $0.90. (2) Cost does not include the cost to own or rent Miovision hardware.
In-House Outsource
N/A N/A
N/A N/A
N/A N/A
$540 $1,512
$5401,2 $1,5121

Data Collection Technology Comparison

35
Tech Comparison: AlburyCity
Steve Swann from AlburyCity tested Miovision’s Video Collection Unit in a Central Business District which experienced high volumes and delay at lunchtime that got progressively worse over the week.
For the intersection counts, Steve tested Miovision against volumes from the already-installed SCATS system, and a manual counter, counting from video.
For the mid-block counts, Steve tested Miovision against tubes, SCATS and a manual counter.
Steve found Miovision to be very accurate, and safer than tubes. He also mention that SCATS was useful for providing phase and cycle information at signals.
Tubes SCATS Miovision
Intersection --- 95.6% 97.5%
Mid-block 90.7% 92% 99%
Data Accuracy Comparison
Above: Illustration of data collection hardware setup at major intersection.

36
Tech Comparison: Non-Intrusive Tech
Here are some results from a white paper written by SRF Consulting and Minnesota DOT which evaluated Non-Intrusive Technology for traffic data collection.
The white paper compared: • Piezos Sensors• Loop Detectors• AxelLight laser sensors• Canoga microloops and • Miovision Video Collection Unit (VCU)
FactorWavetrnoix Smart-
SensorGTT CanogaMicroloop
PEEK AxleLight TIRTL Miovision
Technology Radar Magnetometer Laser Infrared Video
Volume Error
LOS A-D <2.0% 2.5% 5.4% 3.8% <2.0%
LOS E-F 2 to 20% 2.5% N/A N/A <2.0%
Test Results summary
Above: Mid-block testing area setup by SRF consulting and Minnesota DOT.

Added Value of Video Technology

38
The City of Edmonton was tasked with updating their Transportation Master Plan to encourage multi-modal transportation and move away from drive-alone vehicles.
The Plan called for additional performance measurements to benchmark improvements, which included longer Turning Movement Counts; Trails, Paths and Walkway Counts; Arterial Classification counts; and Generational Counts in focus neighborhoods.
As the chart shows, Edmonton cut their costs in half using Miovision, allowing them to free-up budget while eliminating their backlog. The City of Edmonton continues to grow their count program with Miovision.
Peds, Bikes, and Transit: City of Edmonton
“”
Miovision certainly helped us achieve more with our count program. Less costs, longer count periods with a higher degree of accuracy have contributed to enhancing our data collection programs. Now if it can be seen, it is counted!
Brian Murphy,City of Edmonton
Miovision CountsManual Counts
$130,135
$50
0
$100
$150
$200
$250
$300 $281,076Trails, Pathways andWalkways
Generational Studies
Classification Counts
Intersection Counts
(00
0’s
)
Annual study Costs

39
Bicycle and Pedestrian information is used for planning and designing a solution which incorporates multi-modal transportation within a corridor, but this data is often overlooked in the planning process even though it is an important piece of a Complete Street project.
Miovision can provide real and accurate data on all modes of transportation along with a video record of existing pedestrian and bicycle activity which exists in the corridor. This video record often proves to be beneficial when presenting findings to their clients and the general public.
Peds, Bikes, and Transit: TERRA Engineering
“”
The Miovision Scouts have revolutionized how TERRA collects, views and analyzes traffic data. We get so much additional useful data from having the video about how vehicles, pedestrians and bicycles interact with one another at a particular location.
Chris Hutchinson, PE, PTOETERRA Engineering
Complete streets

40
Video records help communicate data, traffic, and any anomalies with other stakeholders who commonly are not engineers: such as councilors, government officials, and citizens. It also provides a historical record that can be reviewed at a later time.
One of our customers, Gordon Meth from the RBA Group, states that his organization greatly benefits from the video. They use it to win projects, for any kind of educational sessions or classes, and in public meetings for projects. The video and video stills are highly effective and provide more insight than reports and charts, especially for non-technical individuals.
Non-Technical Communication
“”
I’ve actually used the video tape during interviews to win projects, while teaching a class on teaching the fundamentals of saturation flow rate, and in public meetings on projects to show the dynamics of what’s going on in a way that is far, far more effective than any of the reports and charts I used to use.
Gordon Meth,The RBA Group

Integrating Miovision into your Business

42
Miovision’s Traffic Data solution
Scout Video Collection Unit Traffic Data On Demand
Miovision provides transportation professionals with an end-to-end data collection and management platform
Own or Rent Hardware; Deploy with in-house staff
Request Projects Online; we Deploy Scouts through our
Partner Network
Miovision Online Platform

43
In-House Data Collection: scout
1) Set-up ScoutSet-up the Scout Video Collection Unit and optional Power Pack in less than ten minutes at your desired study location.
2) Schedule RecordingSelect Traffic Data Type, date, time, and duration of your study(s). Pickup the Scout when your studies have finished recording.
3) Upload VideoOnce recorded, upload video from the Scout to the Miovision Platform for data processing.
DATA COLLECTION WITH THE SCOUT SySTEM
Simple to Transport.Simple to Use.Simple to Set-up.
95% accuracy

44
Outsource: Traffic Data On Demand
Control Quality.Control Timelines.Control Price.
1) Select Project LocationsRequest your traffic data by defining locations and schedule in a map-based project builder on the Miovision Platform.
2) Review & Print Project SummaryVerify all dates, times, locations and pricing on the printable Project Summary.
3) Submit ProjectSubmit to Miovision for fulfillment by our locally partnered traffic data firms.
DATA COLLECTION WITH TRAFFIC DATA ON DEMAND
Projects of any
Size on the same day

45
Outsourcing: Without MiovisionOutsourcing traffic data collection can be a very time consuming process. This process is actually comprised of numerous steps which I’ve broken down into these six time blocks.
All of these steps together average about 7.5 hours of coordination for data collection. This is basically one full day of work, but of course, when working with other people, their responses are not instantaneous. Firms might not reply to you in a timely manner or you might have an on-going case of phone tag.
Whatever the case, this average time of 7.5 hours, or even longer, can be put to better use.
Read RFP1)
2)
3)
4)
5)
6)
scope Data Collection Requirements
Contact DC Firms for Quotes/Times
Contact selected DC Firm
Review Collected Data
Aggregate Data into Reports

46
Outsourcing: Integrating MiovisionIncorporating Traffic Data On Demand into your data collection projects is fairly simple. Using an Online request process with standardized pricing and data turn around time allows you to effectively plan and budget you data collection. It’s also a more streamlined process.
Traffic Data On Demand eliminates numerous steps in coordination which will save about seven hours or 85% of your time.
The process is now reviewing and scoping the RFP and data collection requirements and submitting this request using Traffic Data On Demand.
Read RFP1)
2)
3)
scope Data Collection Requirements
submit Request on Traffic Data On Demand
NEW time to coordinate project: only 30 minutes

47
Miovision PlatformThe Miovision Platform is the backbone of the Traffic Data Solution that facilitates the management of all incoming traffic data, data reporting, project management, and the sharing of data and video.
Advanced ReportingExport reports in the following industry-standard formats: CSV, PDF, JCD, UTDF, PRN, TF2, PPD.
Project ModuleCreate projects and organize data, reports, and video to easily track projects and budgets.
GIS Map InterfacePlot study locations as you perform them for a geographical perspective on your projects.
Client Data SharingProfessionally share data, files and video recordings with clients through your branded portal.
File ManagementStore project files such as contracts, diagrams and traffic data from other sources into a consolidated traffic database.
Public PortalShare data, files and videos with the public on a publicly accessible branded portal linked from your own website.

48
Miovision Data+ PlatformHere is an example of a PDF report for an intersection count. It comes with the data set along with a peak hour data plot chart. Reports are available in PDF, CSV, XLS, Synchro Format and Petra Pro Format.
Our intersection counts have a proven accuracy rate of 95% or more. Many methods of data collection cannot prove their data accuracy or be audited. With Miovision, data goes through a quality assurance process which includes 15% of every video being reprocessed as a quality assurance check for accuracy. We also practice consistent internal data quality measures and often have external third-party study validation done by our customers and industry groups.
Video is also available for the customer to review any traffic anomalies or irregularities.
CSV JCD
JAMAR
PDF PPD
JAMAR
JCD
TES UTDF
Lane
CSVXLS
4 Leg
XLS
8 Leg

49
Miovision study DashboardIn the Study Dashboard all the information of the study, including the interactive map, a video snapshot of the intersection, and shows the directions of each approach.
Being able to view the video also has multiple benefits including checking for quality assurance, reviewing any kind of traffic anomalies or keeping it for a historical record. Many of Miovision’s customers use the video record for presentations and proposals as well.
Dashboard includes:
• Video snapshot with annotated directions• Interactive map of VCU location• Setup rating• Video playback• Reporting options• Time, date, & duration

50
Traffic Data Types & ClassificationsMiovision can collect for up to five different data types including intersection counts, road and highway volume, roundabout count, vehicle gap data and automated license plate recognition, and vehicle, bike and ped classifications.
Intersection CountA tally of all vehicular, bicycle and pedestrian movements at an intersection.
Road and Highway VolumeA count of vehicle and bicycle volume at a road segment.
Roundabout CountThe total sum of turning movements from origin to destination within a roundabout.
Vehicle Gap DataA measure of headway time between vehicles on a road facility.
License Plate DataA time-stamped capture of the license plate of each vehicle passing a location.

51
summaryData: Foundation for Engineering Applications Importance of high data accuracy• Accurate data is the foundation for
engineering applications. It’s important to use data with integrity and in order to have that, you need the ability to validate it.
Data collection for signal timing, corridor progression, traffic impact studies• There is now a trend for data collection to
incorporate all modes of transportation for any data projects including signal timing, corridor progression and traffic impact studies. This allows all of the road users, such as bikes and pedestrians, to be incorporated into any project plans.
Integrating with Miovision• Miovision provides users with accurate, timely
data using both in-house and outsourced options. Our solutions aim to make the best use of your resources, including time and money, so that you can concentrate on completing your projects rather than collecting data.

52
Resources
Talk to a specialist
Case Studies: http://miovision.com/case-studies-testimonials/White-papers: http://miovision.com/white-papers-research-reports/Miovision Blog: http://miovision.com/blog/
If you have any questions, comments, or feedback about this E-book, or if you would like more information about Miovision’s Traffic Data Solution, please follow the link.
Talk to a specialist (click here)