Traffic and Transport Assessment · transport study findings at various stages of Arcadis’...
84
Appendix G Traffic and Transport Assessment
Transcript of Traffic and Transport Assessment · transport study findings at various stages of Arcadis’...

Appendix G Traffic and Transport Assessment

EMPIRE BAY DRIVE AT THE SCENIC ROAD, KINCUMBER INTERSECTION UPGRADE
Traffic and Transport Assessment November 2017


Copyright © 2015 Arcadis. All rights reserved. arcadis.com
CONTACT
MUKIT RAHMAN Associate Technical Director, Transport
T 89079242 M 0411 526 995 E [email protected]
Arcadis Level 16, 580 George Street, Sydney, NSW 2000


v
ROADS AND MARITIME SERVICES (ROADS AND MARITIME) EMPIRE BAY DRIVE AT THE SCENIC ROAD, KINCUMBER INTERSECTION UPGRADE
Traffic and Transport Assessment
Author Roy Conrad, Mukit Rahman
Checker Kung Nigarnjanagool
Approver Mukit Rahman
This report has been prepared for Roads and Maritime in accordance with the terms and conditions of appointment for Empire Bay Drive at The Scenic Road, Kincumber intersection upgrade dated 27 April 2017. Arcadis Australia Pacific Pty Limited (Arcadis) (ABN 76 104 485 289) cannot accept any responsibility for any use of or reliance on the contents of this report by any third party.
© Roads and Maritime Services 2017
REVISIONS Revision Date Description Prepared
by Approved by
A Oct 17 Draft Report for internal review RC, MR
B 6 Nov 17 Draft Final for Clients Review and Comments
RC, MR MR
C 13 Nov 17 Draft Final Report RC, MR MR
D 22 Jan 18 Final Report incorporate Client Comments
KN, RC MR
V


vii
CONTENTS 1 INTRODUCTION ...................................................................................................................... 1 1.1 Study Purpose ..................................................................................................................... 1 1.2 Road Network ...................................................................................................................... 1 1.3 Study Scope and Objectives .............................................................................................. 3 1.4 The Proposal........................................................................................................................ 3 1.5 Study Approach ................................................................................................................... 5 1.6 Reference Traffic Data and Modelling ............................................................................... 6 1.7 Report Structure .................................................................................................................. 6
2 EXISTING TRAFFIC AND TRANSPORT CONDITIONS ......................................................... 7 2.1 Road Hierarchy .................................................................................................................... 7 2.2 Route and Speed Environment .......................................................................................... 8 2.3 Commuter Mode Share ....................................................................................................... 9 2.4 Work Trips Distribution .................................................................................................... 10 2.5 Public Transport ................................................................................................................ 11 2.6 Walking and Cycling ......................................................................................................... 14 2.7 Heavy Vehicles .................................................................................................................. 15
2.8 Crash Data ......................................................................................................................... 16
3 EXISTING ROAD NETWORK PERFORMANCE .................................................................. 21 3.1 Existing Network ............................................................................................................... 21 3.2 Traffic Surveys .................................................................................................................. 21
3.3 Traffic Results at Empire Bay Drive / The Scenic Road / Cochrone Street Intersection .................................................................................................................................................. 23
3.4 Origin Destination Patterns .............................................................................................. 29 3.5 Micro-simulation Traffic Modelling .................................................................................. 30 3.6 Existing Network Performance ........................................................................................ 31

viii
4 FUTURE TRAFFIC PERFORMANCE OF ONE LANE ROUNDABOUT (DO NOTHING) ..... 34 4.1 Future Traffic Growth ........................................................................................................ 34 4.2 Level of Service of One Lane Roundabout (Do nothing) ............................................... 35
5 FUTURE TRAFFIC PERFORMANCE OF TWO LANE ROUNDABOUT UPGRADE ............ 37 5.1 Impact on Other Travel Modes ......................................................................................... 40
6 CONCLUSIONS ..................................................................................................................... 42
Appendix Appendix A Existing 2016 and Future 2019, 2029, 2039 Turning Volumes (AM
and PM)
Appendix B VISSIM Model Development, Calibration and Validation for REF

Empire Bay Drive at The Scenic Road, Kincumber Intersection Upgrade– Traffic and Transport
Arcadis Australia Pacific Pty Limited (Arcadis) (ABN 76 104 485 289) 1 \\HC-AUS-NS-FS-01\jobs\AA009325\Empire Bay Drive (Extended) July 2017\D-REF Report\FINAL REPORT (RevD)\Empire Bay Drive - Traffic and
1 Introduction
1.1 Study Purpose The following document is a Traffic and Transport Assessment (hereafter referred to as ‘the Study’) of the proposed intersection upgrade of Empire Bay Drive, The Scenic Road and Cochrone Street at Kincumber (‘the study area’).
Roads and Maritime Services (Roads and Maritime) is planning to upgrade the intersection of Empire Bay Drive, The Scenic Road and Cochrone Street at Kincumber. It is proposed to upgrade the existing one lane roundabout to two lane roundabout.
Roads and Maritime commissioned Arcadis Australia Pacific (Arcadis) to undertake traffic modelling investigation on the proposed upgrade. A consultation process involving Roads and Maritime project team constituted an important element of the Study. This included presentation of traffic modelling outcomes to Roads and Maritime project team, and assist in design refinements. During the course of the Study, two technical reports were submitted to Roads and Maritime project team with respect to development of the traffic modelling. Feedback from Roads and Maritime project team was incorporated in the Study development and outcomes at various stages of Arcadis’ investigation.
This Traffic and Transport Assessment Report has been prepared to support the Review of Environment Factors (REF) for the proposed upgrade.
1.2 Road Network Empire Bay Drive is a critical link between the Central Coast suburbs of Woy Woy, Ettalong and Umina in the south and Terrigal, Kincumber and Erina in the north.
Empire Bay Drive is currently one lane in each direction and is a pinch point for the 25,000 motorists travelling each day between Kerta Road and Avoca Drive at Kincumber. The existing roundabout at Empire Bay Drive, The Scenic Road and Cochrone Street has one circulating lane. During peak hours, motorists are required to wait for long periods at the roundabout which has a substantial impact on traffic flow.
Figure 1-1 below shows the traffic and transport study area.

Empire Bay Drive at The Scenic Road, Kincumber Intersection Upgrade– Traffic and Transport
Arcadis Australia Pacific Pty Limited (Arcadis) (ABN 76 104 485 289) 2 \\HC-AUS-NS-FS-01\jobs\AA009325\Empire Bay Drive (Extended) July 2017\D-REF Report\FINAL REPORT (RevD)\Empire Bay Drive - Traffic and
Figure 1-1 Traffic and Transport Study Area

Empire Bay Drive at The Scenic Road, Kincumber Intersection Upgrade– Traffic and Transport
Arcadis Australia Pacific Pty Limited (Arcadis) (ABN 76 104 485 289) 3 \\HC-AUS-NS-FS-01\jobs\AA009325\Empire Bay Drive (Extended) July 2017\D-REF Report\FINAL REPORT (RevD)\Empire Bay Drive - Traffic and
1.3 Study Scope and Objectives The scope of the Study is to assess the performance of proposed two lane roundabout upgrade at Empire Bay Drive / The Scenic Road / Cochrone Street intersection from a traffic and transport point of view. A road based microsimulation traffic model was developed for the study area using VISSIM software (version 9). Arcadis supplemented this assessment with SIDRA modelling where required.
Key objectives of the traffic and transport assessment were to:
• Identify key traffic issues that affect the performance of Empire Bay Drive, The Scenic Road and Cochrone Street intersection
• Determine level of service of the proposed upgrade taking into account expected traffic growth at opening year (2019), 10 years after opening (2029) and 20 years after opening (2039). For modelling purpose, the Study assumes 2019 as the opening year of the upgraded two lane roundabout
• Prepare a Traffic and Transport Assessment Report to support the Review of Environment Factors (REF) of the proposal.
1.4 The Proposal The concept design of the proposed two lane roundabout upgrade includes the following features:
• Two through lanes in both directions on the Empire Bay Drive
• Shared through and right turning lanes from Empire Bay Drive onto The Scenic Road and Cochrone Street
• Shared through and left turning lanes from Empire Bay Drive onto The Scenic Road and Cochrone Street
• A dedicated right turning lane from The Scenic Road onto Empire Bay Drive
• Right turn out to be banned at Shipwrights Lane
• A new signalised pedestrian crossing on the Empire Bay Drive (at the current pedestrian refuge location about 85 meters north of Sundowner Avenue)
• Provision of on-road cycle facilities
• Shared pathway along Empire Bay Drive, The Scenic Road and Cochrone Street.
Figure 1-2 below shows the proposed upgrade graphically.

Empire Bay Drive at The Scenic Road, Kincumber Intersection Upgrade– Traffic and Transport
Arcadis Australia Pacific Pty Limited (Arcadis) (ABN 76 104 485 289) 4 \\HC-AUS-NS-FS-01\jobs\AA009325\Empire Bay Drive (Extended) July 2017\D-REF Report\FINAL REPORT (RevD)\Empire Bay Drive - Traffic and
Source: Roads and Maritime Services
Figure 1-2 Proposed Upgrades at the Empire Bay Drive / The Scenic Road / Cochrone Street Intersection

Empire Bay Drive at The Scenic Road, Kincumber Intersection Upgrade– Traffic and Transport
Arcadis Australia Pacific Pty Limited (Arcadis) (ABN 76 104 485 289) 5 \\HC-AUS-NS-FS-01\jobs\AA009325\Empire Bay Drive (Extended) July 2017\D-REF Report\FINAL REPORT (RevD)\Empire Bay Drive - Traffic and
1.5 Study Approach Arcadis developed a comprehensive study approach specifically to achieve key study objectives. It involved a 2016 traffic survey, traffic data analysis, development of a SIDRA model, development of a micro-simulation model using VISSIM software, calibration and validation of the VISSIM model, identification of network operational issues and assessment of upgrade proposal from traffic and transport grounds.
An extensive and collaborative consultation process involving Roads and Maritime project team constituted an important element of the Study. This included presentation of traffic modelling outcomes to Roads and Maritime.
During the course of the study, two technical reports were submitted to Roads and Maritime project team as follows:
• Empire Bay Drive / The Scenic Road / Cochrone Street Intersection – Traffic Modelling on a Dual Lane Roundabout Upgrade, Arcadis in June 2017
• Empire Bay Drive / The Scenic Road, Kincumber – Traffic Modelling, Update Concept Design at the Empire Bay Drive / The Scenic Road Intersection and Traffic Modelling, Arcadis September 2017.
Feedback from Roads and Maritime project team was incorporated into the traffic and transport study findings at various stages of Arcadis’ investigation.
Key steps in Arcadis’ traffic approach included the following:
1. Traffic data, surveys and analysis. Traffic survey was conducted in March 2016 by Roads and Maritime. This provided key input to base case model development, calibration and validation. Five types of data were collected: intersection turning movement counts, midblock traffic counts, queue length, origin-destination (OD) survey, and travel time survey.
2. Base case model development, calibration and validation. The existing base case VISSIM models for both core area and extended area were developed using the March 2016 counts. The Empire Bay Drive / The Scenic Road / Cochrone Street intersection (core area) VISSIM model was calibrated and validated for existing traffic condition as part of the traffic modelling works undertaken in June 2017. At that time core area calibrated / validated VISSIM model including future years VISSIM models were reviewed and signed-off by Roads and Maritime project team. For REF purpose, the core area VISSIM model network on the Empire Bay Drive was extended between Avoca Drive and Kerta Road including associated intersections. The extended VISSIM model is an update to the core area model. Both core and extended area base model’s calibration and validation were undertaken as per the Roads and Maritime’s Traffic Modelling Guidelines, V.1.0, February 2013. Since extended VISSIM model is an update from core area calibrated /validated model, extended VISSIM model has been also re-calibrated and re-validated for the existing traffic condition. This report documents the traffic modelling outcomes from extended VISSIM models.
3. Existing network performance assessment. Existing level of service at Empire Bay Drive / The Scenic Road / Cochrone Street intersection were assessed for both morning (AM) and afternoon (PM) peak traffic conditions.
4. Future base case model development. In agreement with Roads and Maritime project team, peak hour traffic growth between 2016 and 2039 was assumed to be 0.5 per cent per annum on Empire Bay Drive / The Scenic Road / Cochrone Street, one per cent per annum on Avoca Drive and 0.1 per cent per annum on all other roads (i.e. Sundowner Avenue, Shipwrights Lane and Kerta Road).

Empire Bay Drive at The Scenic Road, Kincumber Intersection Upgrade– Traffic and Transport
Arcadis Australia Pacific Pty Limited (Arcadis) (ABN 76 104 485 289) 6 \\HC-AUS-NS-FS-01\jobs\AA009325\Empire Bay Drive (Extended) July 2017\D-REF Report\FINAL REPORT (RevD)\Empire Bay Drive - Traffic and
The future year VISSIM models were developed for 2019 (opening year), 2029 (10 years after opening) and 2039 (20 years after opening) for morning and afternoon peak periods.
5. Assess future traffic performance for do nothing and with the proposal. This included modelling assessment for the following two cases:
• One lane roundabout at Empire Bay Drive / The Scenic Road / Cochrone Street intersection (do nothing)
• Two lane roundabout upgrade at Empire Bay Drive / The Scenic Road / Cochrone Street intersection (with proposal).
1.6 Reference Traffic Data and Modelling The March 2016 traffic survey data included origin-destination (OD) survey, intersection classified turning movement counts (car and heavy vehicles), midblock traffic count, travel time survey. Further traffic data was collected in April 2016 including intersection queue lengths at Avoca Drive / Empire Bay Drive and Empire Bay Drive / The Scenic Road / Cochrone Street intersections.
To assess intersection performance, SIDRA Network (version 7.0.7.6759) modelling software was used. For microsimulation modelling purpose VISSIM software (version 9) was used.
1.7 Report Structure The remainder of this report is structured as follows:
• Chapter 2 – Existing Traffic and Transport Conditions – provides the context of existing traffic conditions within the Empire Bay Drive / The Scenic Road / Cochrone Street Upgrade study area
• Chapter 3 – Existing Road Network Performance – establishes the existing network performance within the study area. Results from traffic surveys are summarised in this section
• Chapter 4 – Future Traffic Performance of One Lane Roundabout (Do Nothing) – establishes future traffic performance of one lane roundabout (do nothing condition) at Empire Bay Drive / The Scenic Road / Cochrone Street intersection
• Chapter 5 – Future Traffic Performance of Two Lane Roundabout Upgrade – establishes future traffic performance of the proposed two lane roundabout upgrade at Empire Bay Drive / The Scenic Road / Cochrone Street intersection
• Chapter 5 - Conclusions – provides a summary of key findings.

Empire Bay Drive at The Scenic Road, Kincumber Intersection Upgrade– Traffic and Transport
Arcadis Australia Pacific Pty Limited (Arcadis) (ABN 76 104 485 289) 7 \\HC-AUS-NS-FS-01\jobs\AA009325\Empire Bay Drive (Extended) July 2017\D-REF Report\FINAL REPORT (RevD)\Empire Bay Drive - Traffic and
2 Existing Traffic and Transport Conditions Existing traffic and transport conditions in the study area are described within this chapter. It provides the regional and local transport context within which the assessment has been undertaken.
2.1 Road Hierarchy MR349 Empire Bay Drive and MR504 Avoca Drive are classified as State Roads, The Scenic Road is a Regional Road (RR7779). Figure 2-1 shows the existing road hierarchy.
Figure 2-1 Road Hierarchy in the Study Area

Empire Bay Drive at The Scenic Road, Kincumber Intersection Upgrade– Traffic and Transport
Arcadis Australia Pacific Pty Limited (Arcadis) (ABN 76 104 485 289) 8 \\HC-AUS-NS-FS-01\jobs\AA009325\Empire Bay Drive (Extended) July 2017\D-REF Report\FINAL REPORT (RevD)\Empire Bay Drive - Traffic and
2.2 Route and Speed Environment Empire Bay Drive is a State road linking the Woy Woy peninsula to Avoca Drive at Kincumber. Empire Bay Drive is currently a two lane road (one lane in each direction) between Avoca Drive and Kerta Road.
The posted speed limit on Empire Bay Drive between Avoca Drive and Kerta Road is 60 kilometres per hour. The local roads speed limit on Cochrone Street is 50 kilometres per hour. The posted speed on The Scenic Road is 60 kilometres per hour. Figure 2-2 shows the posted speed limits in the vicinity of the study area.
Figure 2-2 Posted Speed Limits in the Study Area
Empire Bay Drive at The Scenic Road, Kincumber Intersection Upgrade– Traffic and Transport
Arcadis Australia Pacific Pty Limited (Arcadis) (ABN 76 104 485 289) 9 \\HC-AUS-NS-FS-01\jobs\AA009325\Empire Bay Drive (Extended) July 2017\D-REF Report\FINAL REPORT (RevD)\Empire Bay Drive - Traffic and
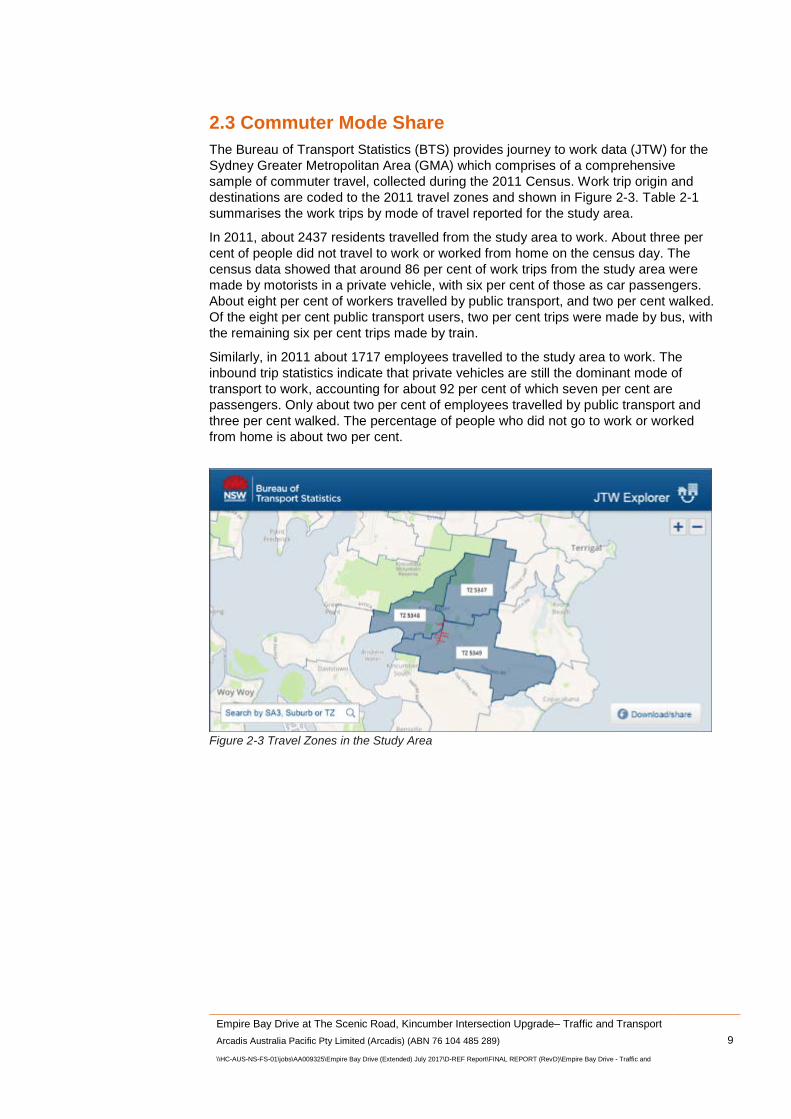
2.3 Commuter Mode Share The Bureau of Transport Statistics (BTS) provides journey to work data (JTW) for the Sydney Greater Metropolitan Area (GMA) which comprises of a comprehensive sample of commuter travel, collected during the 2011 Census. Work trip origin and destinations are coded to the 2011 travel zones and shown in Figure 2-3. Table 2-1 summarises the work trips by mode of travel reported for the study area.
In 2011, about 2437 residents travelled from the study area to work. About three per cent of people did not travel to work or worked from home on the census day. The census data showed that around 86 per cent of work trips from the study area were made by motorists in a private vehicle, with six per cent of those as car passengers. About eight per cent of workers travelled by public transport, and two per cent walked. Of the eight per cent public transport users, two per cent trips were made by bus, with the remaining six per cent trips made by train.
Similarly, in 2011 about 1717 employees travelled to the study area to work. The inbound trip statistics indicate that private vehicles are still the dominant mode of transport to work, accounting for about 92 per cent of which seven per cent are passengers. Only about two per cent of employees travelled by public transport and three per cent walked. The percentage of people who did not go to work or worked from home is about two per cent.
Figure 2-3 Travel Zones in the Study Area

Empire Bay Drive at The Scenic Road, Kincumber Intersection Upgrade– Traffic and Transport
Arcadis Australia Pacific Pty Limited (Arcadis) (ABN 76 104 485 289) 10 \\HC-AUS-NS-FS-01\jobs\AA009325\Empire Bay Drive (Extended) July 2017\D-REF Report\FINAL REPORT (RevD)\Empire Bay Drive - Traffic and
Table 2-1 Commuter Mode Share in Study Area (JTW, 2011)
Travel Mode Study Area as Home (Outbound trips)
% Trips as Home
Study Area as Workplace (Inbound trips)
% Trips as Workplace
Car Driver 1,961 80% 1,468 85%
Train 157 6% 6 0%
Car Passenger 137 6% 112 7%
Walked Only 52 2% 58 3%
Bus 42 2% 29 2%
Other 16 1% 11 1%
Worked at home/ Did not travel/ Not stated
72 3% 33 2%
Total 2,437 100% 1,717 100%
Selected travel zones (TZ): 5347, 5348, 5349
Data Source: 2011 Journey to Work Data.
2.4 Work Trips Distribution The JTW data was further analysed to understand the distribution of work trips to and from study area. Outbound work trip distribution made by private car (both as driver and as passenger) from the study area are summarised in Table 2-2. Inbound work trip distribution made by private car (both as driver and as passenger) to the study area are summarised in Table 2-3.
Gosford City Council merged with the Wyong Shire Council in May 2016. The combined Council is now known as the “Central Coast Council”. All reference to the Gosford City Council or Wyong Shire Council in relevant plans is in fact a reference to the Central Coast Council.
The results indicate the following work trip patterns:
• Outbound work trip distribution shows that substantial trips are made to old Gosford LGA (66 per cent). In addition to this, nine per cent of outbound trips travelled to old Wyong LGA.
• Inbound work trip distribution shows that substantial trips are made from old Gosford LGA (87 per cent). In addition to this, 11 per cent of inbound trips travelled from old Wyong LGA.
Table 2-2 Daily Car Trips from the Study Area (Outbound)
Geographic Area Number of car trips from study area (Outbound)
% Outbound trips from study area
Gosford 1385 66%
Wyong 189 9%
No fixed place of work 126 6%
Sydney Inner City 84 4%
Hornsby 63 3%
Chatswood - Lane Cove 42 2%
Empire Bay Drive at The Scenic Road, Kincumber Intersection Upgrade– Traffic and Transport
Arcadis Australia Pacific Pty Limited (Arcadis) (ABN 76 104 485 289) 11 \\HC-AUS-NS-FS-01\jobs\AA009325\Empire Bay Drive (Extended) July 2017\D-REF Report\FINAL REPORT (RevD)\Empire Bay Drive - Traffic and
Geographic Area Number of car trips from study area (Outbound)
% Outbound trips from study area
Newcastle 21 1%
Ku-ring-gai 21 1%
Ryde - Hunters Hill 21 1%
Auburn 21 1%
Other 168 8%
Total in Study Area 2,098 100% Data Source: 2011 Journey to Work Data.
Table 2-3 Daily Car Trips to the Study Area (Inbound)
Geographic Area Number of car trips to study area (Inbound)
% Inbound trips to study area
Gosford 1375 87%
Wyong 174 11%
Lake Macquarie - East 16 1%
Wagga Wagga 0 0%
Canada Bay 0 0%
Merrylands - Guildford 0 0%
Pennant Hills - Epping 0 0%
Coffs Harbour 0 0%
Kiama - Shellharbour 0 0%
Lake Macquarie - West 0 0%
Other 16 1%
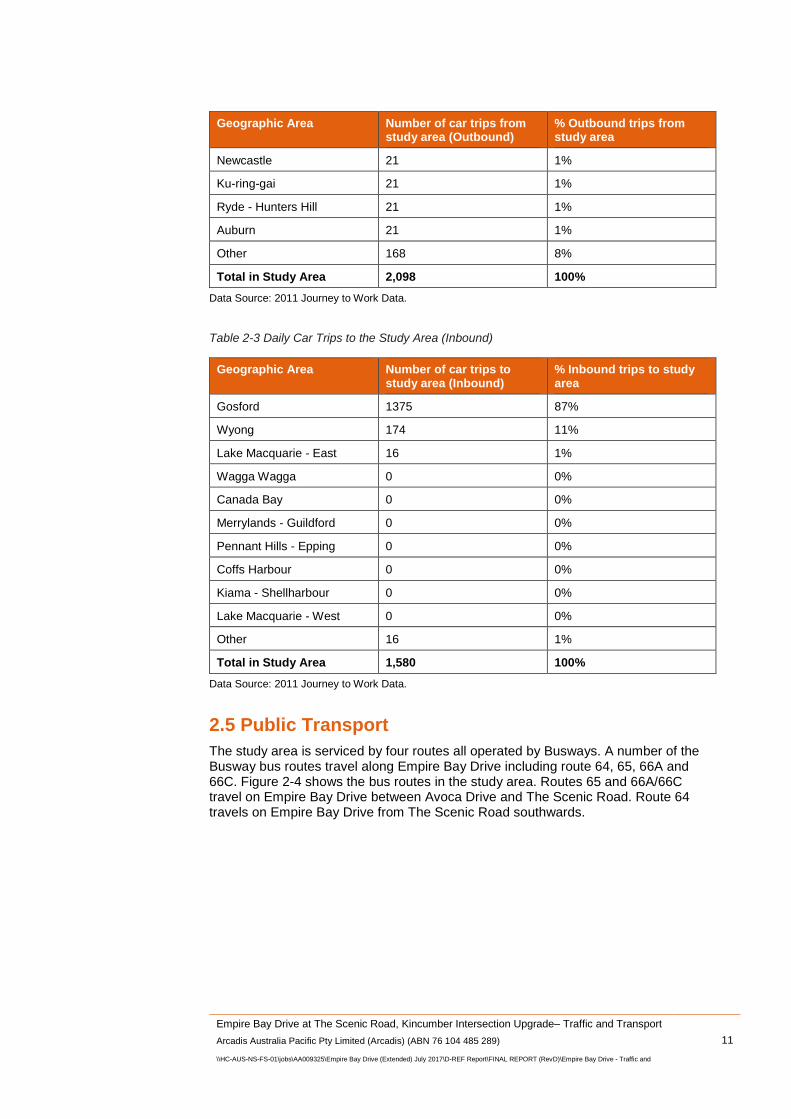
Total in Study Area 1,580 100% Data Source: 2011 Journey to Work Data.
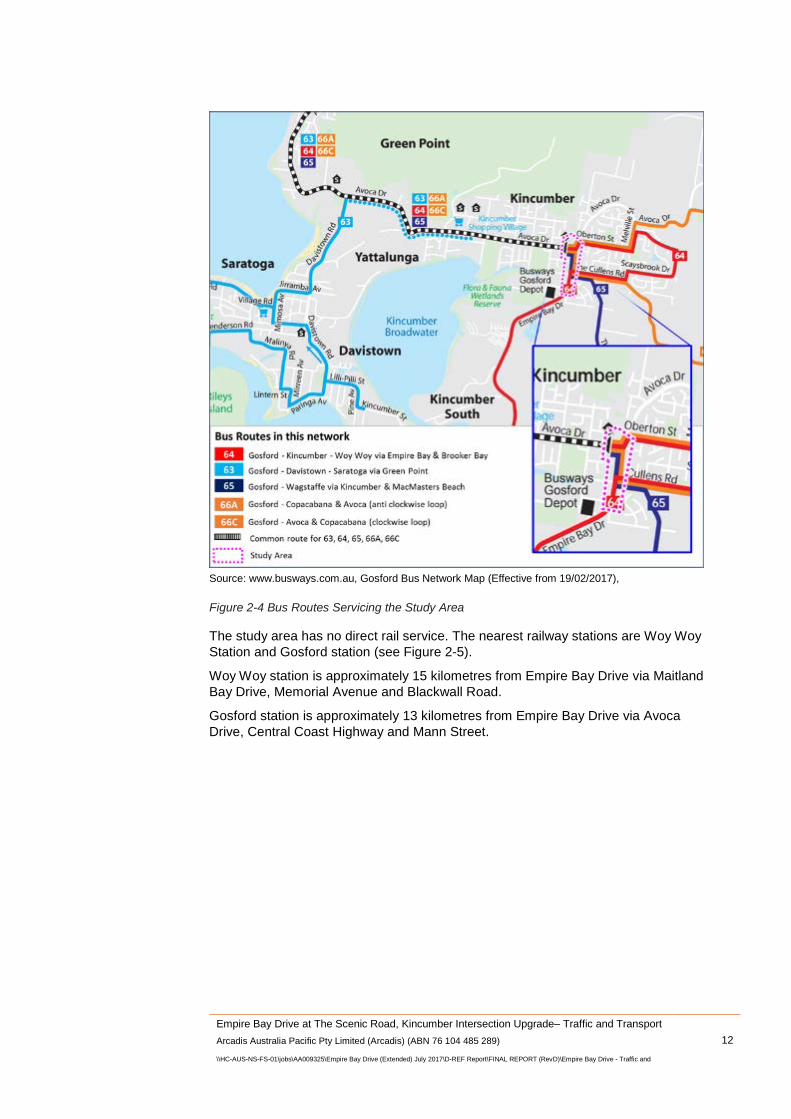
2.5 Public Transport The study area is serviced by four routes all operated by Busways. A number of the Busway bus routes travel along Empire Bay Drive including route 64, 65, 66A and 66C. Figure 2-4 shows the bus routes in the study area. Routes 65 and 66A/66C travel on Empire Bay Drive between Avoca Drive and The Scenic Road. Route 64 travels on Empire Bay Drive from The Scenic Road southwards.
Empire Bay Drive at The Scenic Road, Kincumber Intersection Upgrade– Traffic and Transport
Arcadis Australia Pacific Pty Limited (Arcadis) (ABN 76 104 485 289) 12 \\HC-AUS-NS-FS-01\jobs\AA009325\Empire Bay Drive (Extended) July 2017\D-REF Report\FINAL REPORT (RevD)\Empire Bay Drive - Traffic and
Source: www.busways.com.au, Gosford Bus Network Map (Effective from 19/02/2017),
Figure 2-4 Bus Routes Servicing the Study Area
The study area has no direct rail service. The nearest railway stations are Woy Woy Station and Gosford station (see Figure 2-5).
Woy Woy station is approximately 15 kilometres from Empire Bay Drive via Maitland Bay Drive, Memorial Avenue and Blackwall Road.
Gosford station is approximately 13 kilometres from Empire Bay Drive via Avoca Drive, Central Coast Highway and Mann Street.

Empire Bay Drive at The Scenic Road, Kincumber Intersection Upgrade– Traffic and Transport
Arcadis Australia Pacific Pty Limited (Arcadis) (ABN 76 104 485 289) 13 \\HC-AUS-NS-FS-01\jobs\AA009325\Empire Bay Drive (Extended) July 2017\D-REF Report\FINAL REPORT (RevD)\Empire Bay Drive - Traffic and
Figure 2-5 Train Stations Closest to the Study Area

Empire Bay Drive at The Scenic Road, Kincumber Intersection Upgrade– Traffic and Transport
Arcadis Australia Pacific Pty Limited (Arcadis) (ABN 76 104 485 289) 14 \\HC-AUS-NS-FS-01\jobs\AA009325\Empire Bay Drive (Extended) July 2017\D-REF Report\FINAL REPORT (RevD)\Empire Bay Drive - Traffic and
2.6 Walking and Cycling Empire Bay Drive between Avoca Drive and Kerta Road currently does not have dedicated on-road bike lanes.
Figure 2-6 shows the current cycle routes around the study area.
Source: Roads and Maritime Cycle Way Finder V3 (Last updated: 01/06/2017)
Figure 2-6 Existing Cycleway near the Study Area
Empire Bay Drive at The Scenic Road, Kincumber Intersection Upgrade– Traffic and Transport
Arcadis Australia Pacific Pty Limited (Arcadis) (ABN 76 104 485 289) 15 \\HC-AUS-NS-FS-01\jobs\AA009325\Empire Bay Drive (Extended) July 2017\D-REF Report\FINAL REPORT (RevD)\Empire Bay Drive - Traffic and
2.7 Heavy Vehicles
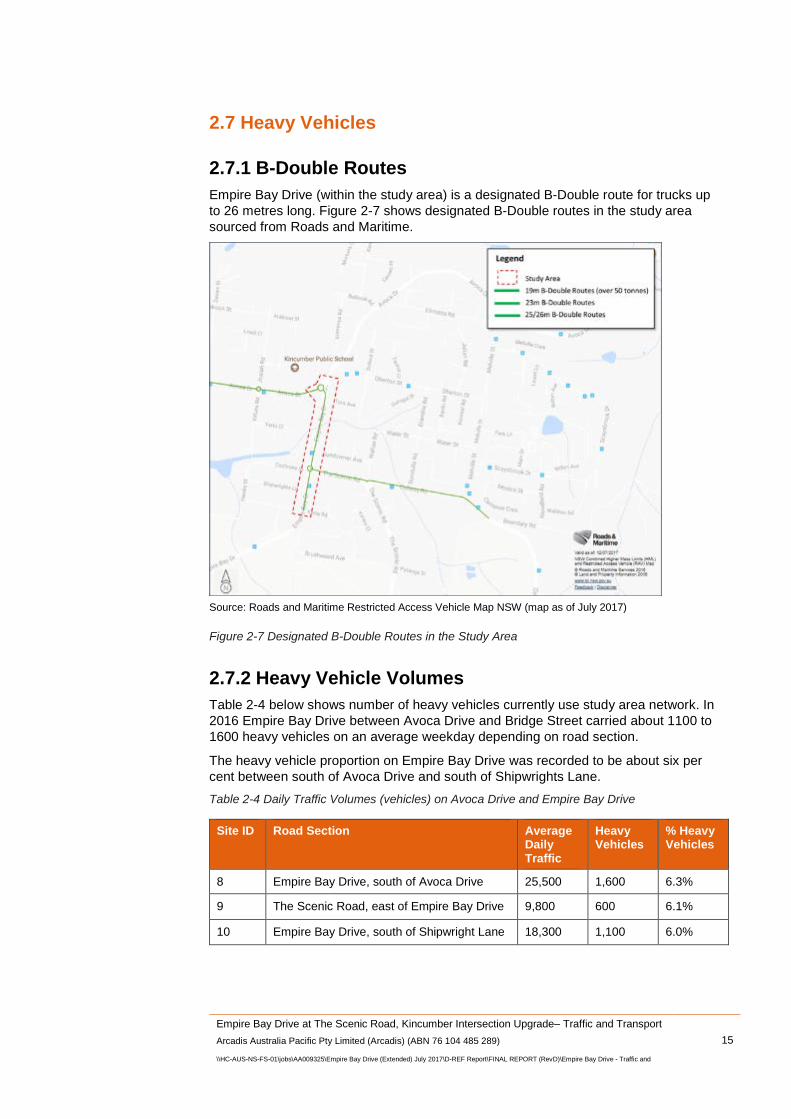
2.7.1 B-Double Routes Empire Bay Drive (within the study area) is a designated B-Double route for trucks up to 26 metres long. Figure 2-7 shows designated B-Double routes in the study area sourced from Roads and Maritime.
Source: Roads and Maritime Restricted Access Vehicle Map NSW (map as of July 2017)
Figure 2-7 Designated B-Double Routes in the Study Area
2.7.2 Heavy Vehicle Volumes Table 2-4 below shows number of heavy vehicles currently use study area network. In 2016 Empire Bay Drive between Avoca Drive and Bridge Street carried about 1100 to 1600 heavy vehicles on an average weekday depending on road section.
The heavy vehicle proportion on Empire Bay Drive was recorded to be about six per cent between south of Avoca Drive and south of Shipwrights Lane. Table 2-4 Daily Traffic Volumes (vehicles) on Avoca Drive and Empire Bay Drive
Site ID Road Section Average Daily Traffic
Heavy Vehicles
% Heavy Vehicles
8 Empire Bay Drive, south of Avoca Drive 25,500 1,600 6.3%
9 The Scenic Road, east of Empire Bay Drive 9,800 600 6.1%
10 Empire Bay Drive, south of Shipwright Lane 18,300 1,100 6.0%
Empire Bay Drive at The Scenic Road, Kincumber Intersection Upgrade– Traffic and Transport
Arcadis Australia Pacific Pty Limited (Arcadis) (ABN 76 104 485 289) 16 \\HC-AUS-NS-FS-01\jobs\AA009325\Empire Bay Drive (Extended) July 2017\D-REF Report\FINAL REPORT (RevD)\Empire Bay Drive - Traffic and
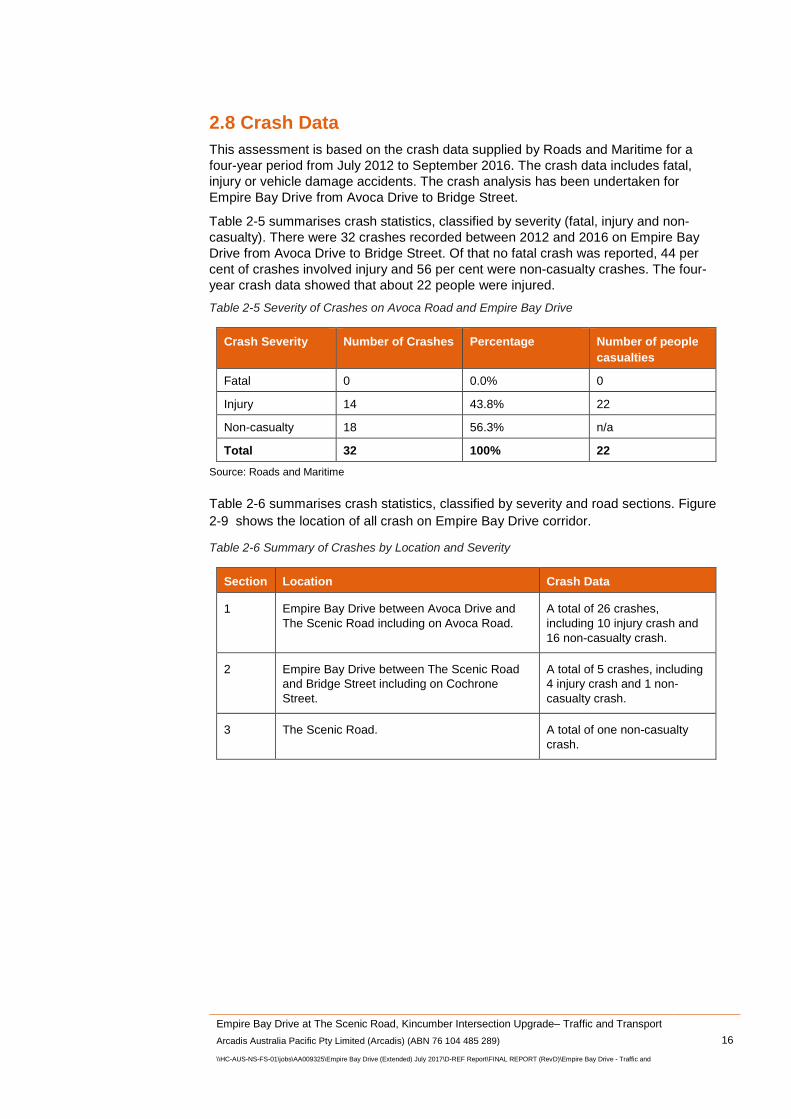
2.8 Crash Data This assessment is based on the crash data supplied by Roads and Maritime for a four-year period from July 2012 to September 2016. The crash data includes fatal, injury or vehicle damage accidents. The crash analysis has been undertaken for Empire Bay Drive from Avoca Drive to Bridge Street.
Table 2-5 summarises crash statistics, classified by severity (fatal, injury and non-casualty). There were 32 crashes recorded between 2012 and 2016 on Empire Bay Drive from Avoca Drive to Bridge Street. Of that no fatal crash was reported, 44 per cent of crashes involved injury and 56 per cent were non-casualty crashes. The four- year crash data showed that about 22 people were injured. Table 2-5 Severity of Crashes on Avoca Road and Empire Bay Drive
Crash Severity Number of Crashes Percentage Number of people casualties
Fatal 0 0.0% 0
Injury 14 43.8% 22
Non-casualty 18 56.3% n/a
Total 32 100% 22 Source: Roads and Maritime
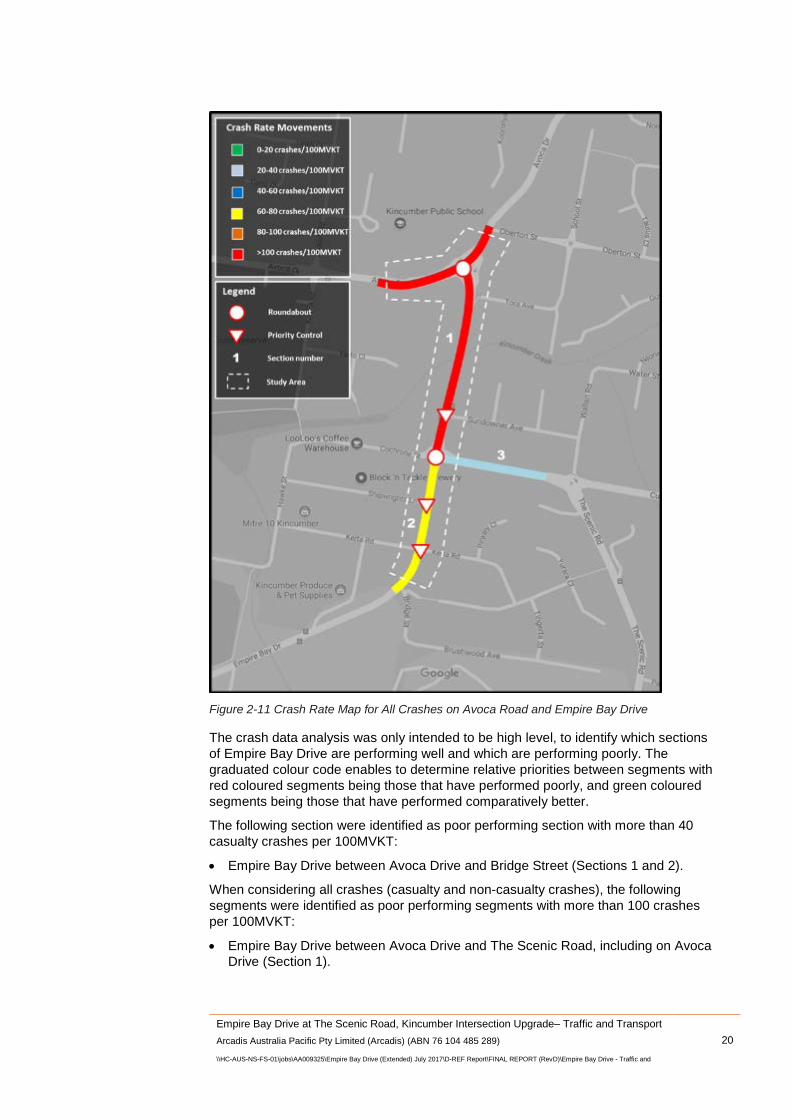
Table 2-6 summarises crash statistics, classified by severity and road sections. Figure 2-9 shows the location of all crash on Empire Bay Drive corridor.
Table 2-6 Summary of Crashes by Location and Severity
Section Location Crash Data
1 Empire Bay Drive between Avoca Drive and The Scenic Road including on Avoca Road.
A total of 26 crashes, including 10 injury crash and 16 non-casualty crash.
2 Empire Bay Drive between The Scenic Road and Bridge Street including on Cochrone Street.
A total of 5 crashes, including 4 injury crash and 1 non-casualty crash.
3 The Scenic Road. A total of one non-casualty crash.
Empire Bay Drive at The Scenic Road, Kincumber Intersection Upgrade– Traffic and Transport
Arcadis Australia Pacific Pty Limited (Arcadis) (ABN 76 104 485 289) 17 \\HC-AUS-NS-FS-01\jobs\AA009325\Empire Bay Drive (Extended) July 2017\D-REF Report\FINAL REPORT (RevD)\Empire Bay Drive - Traffic and
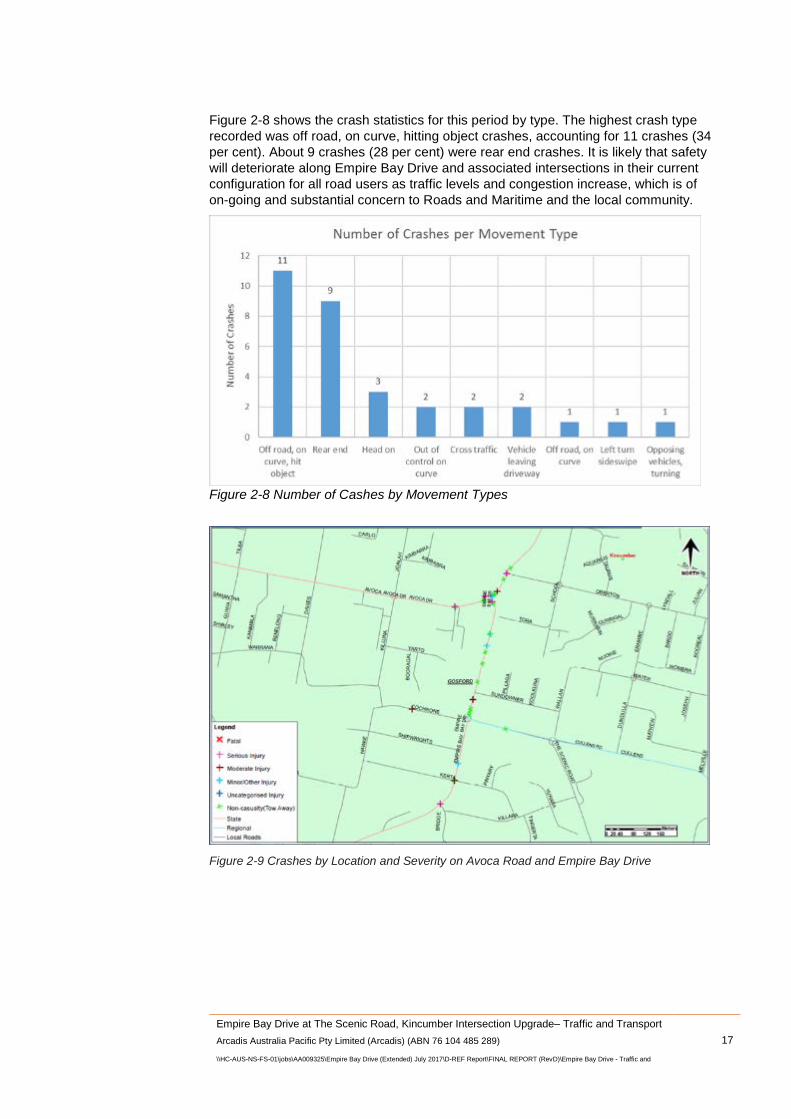
Figure 2-8 shows the crash statistics for this period by type. The highest crash type recorded was off road, on curve, hitting object crashes, accounting for 11 crashes (34 per cent). About 9 crashes (28 per cent) were rear end crashes. It is likely that safety will deteriorate along Empire Bay Drive and associated intersections in their current configuration for all road users as traffic levels and congestion increase, which is of on-going and substantial concern to Roads and Maritime and the local community.
Figure 2-8 Number of Cashes by Movement Types
Figure 2-9 Crashes by Location and Severity on Avoca Road and Empire Bay Drive

Empire Bay Drive at The Scenic Road, Kincumber Intersection Upgrade– Traffic and Transport
Arcadis Australia Pacific Pty Limited (Arcadis) (ABN 76 104 485 289) 18 \\HC-AUS-NS-FS-01\jobs\AA009325\Empire Bay Drive (Extended) July 2017\D-REF Report\FINAL REPORT (RevD)\Empire Bay Drive - Traffic and
2.8.1 Road Safety Performance The road safety performance for various sections of Empire Bay Drive from Avoca Road to Bridge Street were assessed using crash rates and casualty rates per 100 million-vehicle kilometres travelled (MVKT). The parameter vehicle-kilometre travelled (VKT) is an industry-accepted measure of crash exposure. In general, the more traffic that uses a road (traffic volume), and longer the trip length (kilometres travelled), the greater the exposure to crashes.
By normalising crash frequency by VKT (or MVKT), this also makes sections of the corridor more comparable. Without normalising the rates in this manner, the longer section and section with higher traffic volumes would tend to perform much worse than shorter, less trafficked section.
The three data inputs required for crash data analysis by MVKT are:
• Number of crashes
• Traffic volumes
• Segment lengths.
Crash rates mapping was prepared based on the above mentioned inputs. Casualty crash rates were categorised by bandwidths of 10 casualty crashes per 100MVKT. These were then mapped using a colour code. Crash rates were also categorised by bandwidths of 20 crashes per 100MVKT and were mapped using a similar colour code.
The crash rates maps are the primary outputs for road safety performance, and they are as shown in Figure 2-10 and Figure 2-11 below.

Empire Bay Drive at The Scenic Road, Kincumber Intersection Upgrade– Traffic and Transport
Arcadis Australia Pacific Pty Limited (Arcadis) (ABN 76 104 485 289) 19 \\HC-AUS-NS-FS-01\jobs\AA009325\Empire Bay Drive (Extended) July 2017\D-REF Report\FINAL REPORT (RevD)\Empire Bay Drive - Traffic and
Figure 2-10 Crash Rate Map for Casualty Crashes on Avoca Road and Empire Bay Drive
Empire Bay Drive at The Scenic Road, Kincumber Intersection Upgrade– Traffic and Transport
Arcadis Australia Pacific Pty Limited (Arcadis) (ABN 76 104 485 289) 20 \\HC-AUS-NS-FS-01\jobs\AA009325\Empire Bay Drive (Extended) July 2017\D-REF Report\FINAL REPORT (RevD)\Empire Bay Drive - Traffic and
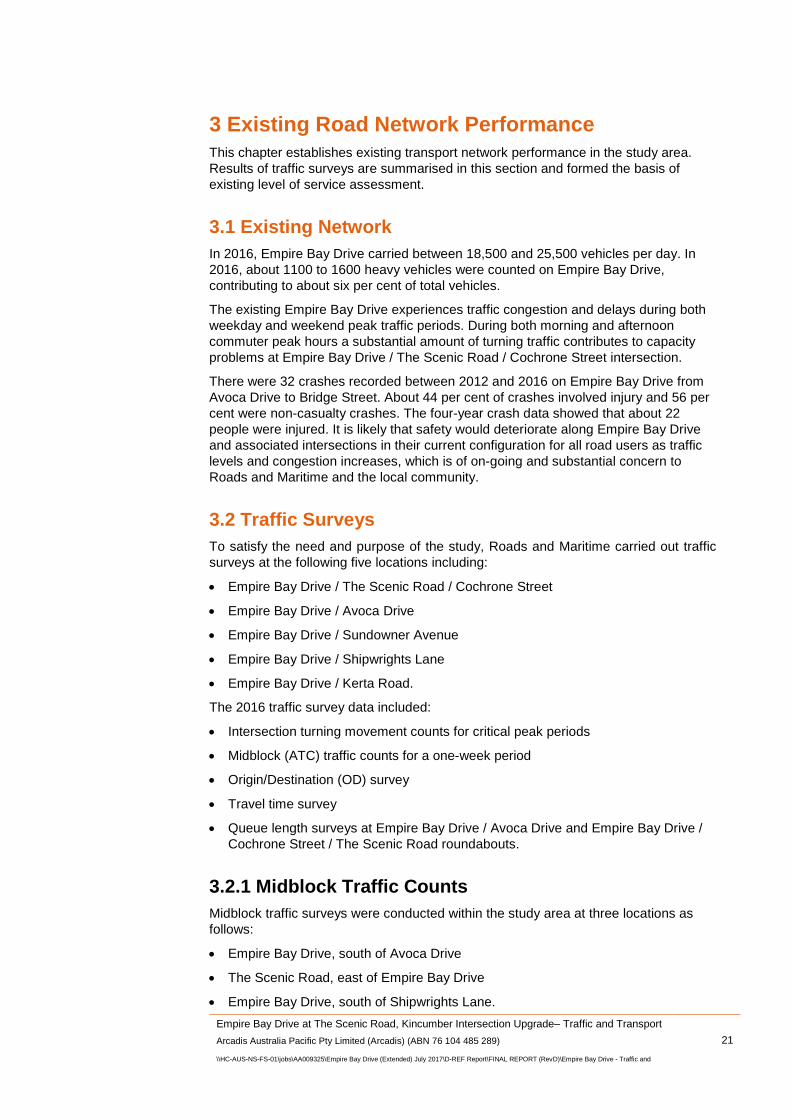
Figure 2-11 Crash Rate Map for All Crashes on Avoca Road and Empire Bay Drive
The crash data analysis was only intended to be high level, to identify which sections of Empire Bay Drive are performing well and which are performing poorly. The graduated colour code enables to determine relative priorities between segments with red coloured segments being those that have performed poorly, and green coloured segments being those that have performed comparatively better.
The following section were identified as poor performing section with more than 40 casualty crashes per 100MVKT:
• Empire Bay Drive between Avoca Drive and Bridge Street (Sections 1 and 2).
When considering all crashes (casualty and non-casualty crashes), the following segments were identified as poor performing segments with more than 100 crashes per 100MVKT:
• Empire Bay Drive between Avoca Drive and The Scenic Road, including on Avoca Drive (Section 1).
Empire Bay Drive at The Scenic Road, Kincumber Intersection Upgrade– Traffic and Transport
Arcadis Australia Pacific Pty Limited (Arcadis) (ABN 76 104 485 289) 21 \\HC-AUS-NS-FS-01\jobs\AA009325\Empire Bay Drive (Extended) July 2017\D-REF Report\FINAL REPORT (RevD)\Empire Bay Drive - Traffic and
3 Existing Road Network Performance This chapter establishes existing transport network performance in the study area. Results of traffic surveys are summarised in this section and formed the basis of existing level of service assessment.
3.1 Existing Network In 2016, Empire Bay Drive carried between 18,500 and 25,500 vehicles per day. In 2016, about 1100 to 1600 heavy vehicles were counted on Empire Bay Drive, contributing to about six per cent of total vehicles.
The existing Empire Bay Drive experiences traffic congestion and delays during both weekday and weekend peak traffic periods. During both morning and afternoon commuter peak hours a substantial amount of turning traffic contributes to capacity problems at Empire Bay Drive / The Scenic Road / Cochrone Street intersection.
There were 32 crashes recorded between 2012 and 2016 on Empire Bay Drive from Avoca Drive to Bridge Street. About 44 per cent of crashes involved injury and 56 per cent were non-casualty crashes. The four-year crash data showed that about 22 people were injured. It is likely that safety would deteriorate along Empire Bay Drive and associated intersections in their current configuration for all road users as traffic levels and congestion increases, which is of on-going and substantial concern to Roads and Maritime and the local community.
3.2 Traffic Surveys To satisfy the need and purpose of the study, Roads and Maritime carried out traffic surveys at the following five locations including:
• Empire Bay Drive / The Scenic Road / Cochrone Street
• Empire Bay Drive / Avoca Drive
• Empire Bay Drive / Sundowner Avenue
• Empire Bay Drive / Shipwrights Lane
• Empire Bay Drive / Kerta Road.
The 2016 traffic survey data included:
• Intersection turning movement counts for critical peak periods
• Midblock (ATC) traffic counts for a one-week period
• Origin/Destination (OD) survey
• Travel time survey
• Queue length surveys at Empire Bay Drive / Avoca Drive and Empire Bay Drive / Cochrone Street / The Scenic Road roundabouts.
3.2.1 Midblock Traffic Counts Midblock traffic surveys were conducted within the study area at three locations as follows:
• Empire Bay Drive, south of Avoca Drive
• The Scenic Road, east of Empire Bay Drive
• Empire Bay Drive, south of Shipwrights Lane.

Empire Bay Drive at The Scenic Road, Kincumber Intersection Upgrade– Traffic and Transport
Arcadis Australia Pacific Pty Limited (Arcadis) (ABN 76 104 485 289) 22 \\HC-AUS-NS-FS-01\jobs\AA009325\Empire Bay Drive (Extended) July 2017\D-REF Report\FINAL REPORT (RevD)\Empire Bay Drive - Traffic and
3.2.2 Intersection Counts and Queue Length Intersection turning movement counts (March 2016) and queue length surveys (April 2016) were conducted for morning (AM) peak (6am to 10am) and the afternoon (PM) peak (3pm to 7pm).
Figure 3-1 shows the survey locations for midblock counts, intersection counts, and OD surveys.
Figure 3-1 Survey Locations in Study Area
Empire Bay Drive at The Scenic Road, Kincumber Intersection Upgrade– Traffic and Transport
Arcadis Australia Pacific Pty Limited (Arcadis) (ABN 76 104 485 289) 23 \\HC-AUS-NS-FS-01\jobs\AA009325\Empire Bay Drive (Extended) July 2017\D-REF Report\FINAL REPORT (RevD)\Empire Bay Drive - Traffic and
3.2.3 Origin-destination (OD) Survey Origin-destination (OD) surveys (bi-directional) were undertaken in March (2016) for four key locations as shown in Figure 3-1. Locations are as follows:
• Avoca Drive, east of Empire Bay Drive
• Avoca Drive, west of Empire Bay Drive
• The Scenic Road, east of Empire Bay Drive
• Empire Bay Drive, south of Bridge Street.
3.2.4 Travel Time Survey Travel time survey was undertaken on Empire Bay Drive between Avoca Drive and Kerta Road in both northbound and southbound directions in March 2016. Travel time was observed for both morning and afternoon peak hours.
3.3 Traffic Results at Empire Bay Drive / The Scenic Road / Cochrone Street Intersection
The following section quantifies the current 2016 morning (AM) and afternoon (PM) peak hour traffic flows at Empire Bay Drive / The Scenic Road / Cochrone Street intersection.
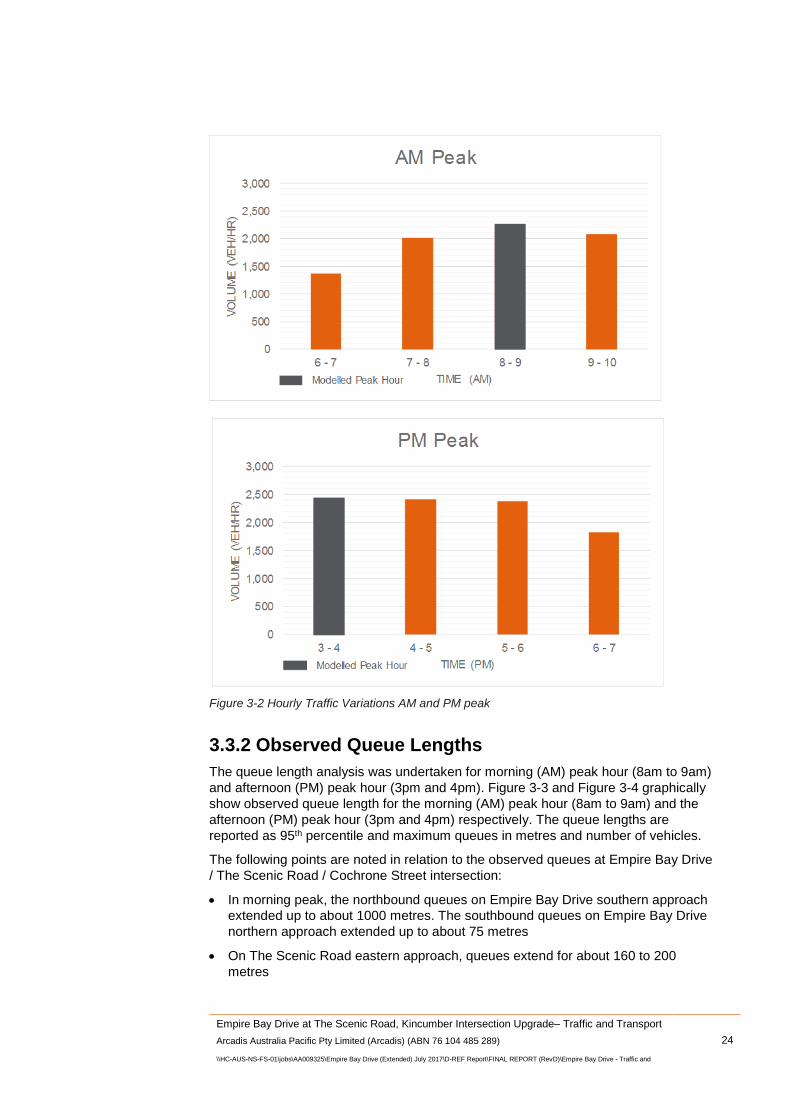
3.3.1 Hourly Traffic Variations Hourly traffic variation at Empire Bay Drive / The Scenic Road / Cochrone Street intersection was analysed for a critical weekday (Thursday).
Table 3-1 and Figure 3-2 show hourly traffic variation from the March 2016 traffic survey.
The following points are noted in relation to peak hour traffic at Empire Bay Drive / The Scenic Road / Cochrone Street intersection:
• The morning peak spreads over two hours between 7am and 9am with the predominant morning peak between 8am and 9am
• The afternoon peak spreads over two hours between 3pm and 5pm with the predominant afternoon peak between 3pm and 4pm. The peak is reached at 3pm before it starts to decline after 5pm.
Table 3-1 Hourly Traffic Variation AM and PM Peak
Approach / Road AM (6AM to 10AM) PM (3PM to 7PM)
6-7 AM
7-8 AM
8-9 AM
9-10 AM
3-4 PM
4-5 PM
5-6 PM
6-7 PM
North – Empire Bay Drive 610 760 880 780 1,030 1,120 1,020 880
East – The Scenic Road 300 450 540 420 420 340 310 210
South – Empire Bay Drive 400 700 700 720 860 770 890 640
West – Cochrone Street 70 110 130 150 140 180 160 100
Total intersection volumes 1,380 2,020 2,250 2,070 2,450 2,410 2,380 1,830 Source: March 2016 traffic survey, provided by Roads and Maritime. Counts data have been rounded to the nearest ten vehicles.
Empire Bay Drive at The Scenic Road, Kincumber Intersection Upgrade– Traffic and Transport
Arcadis Australia Pacific Pty Limited (Arcadis) (ABN 76 104 485 289) 24 \\HC-AUS-NS-FS-01\jobs\AA009325\Empire Bay Drive (Extended) July 2017\D-REF Report\FINAL REPORT (RevD)\Empire Bay Drive - Traffic and
Figure 3-2 Hourly Traffic Variations AM and PM peak
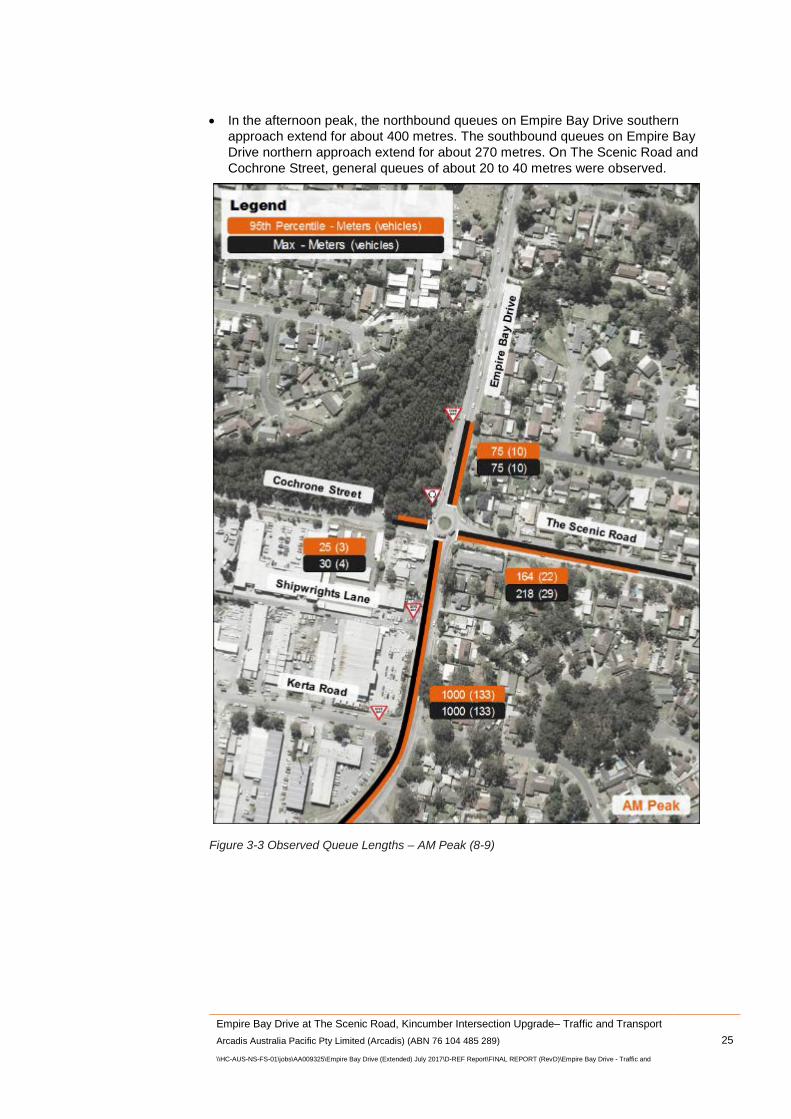
3.3.2 Observed Queue Lengths The queue length analysis was undertaken for morning (AM) peak hour (8am to 9am) and afternoon (PM) peak hour (3pm and 4pm). Figure 3-3 and Figure 3-4 graphically show observed queue length for the morning (AM) peak hour (8am to 9am) and the afternoon (PM) peak hour (3pm and 4pm) respectively. The queue lengths are reported as 95th percentile and maximum queues in metres and number of vehicles.
The following points are noted in relation to the observed queues at Empire Bay Drive / The Scenic Road / Cochrone Street intersection:
• In morning peak, the northbound queues on Empire Bay Drive southern approach extended up to about 1000 metres. The southbound queues on Empire Bay Drive northern approach extended up to about 75 metres
• On The Scenic Road eastern approach, queues extend for about 160 to 200 metres
Empire Bay Drive at The Scenic Road, Kincumber Intersection Upgrade– Traffic and Transport
Arcadis Australia Pacific Pty Limited (Arcadis) (ABN 76 104 485 289) 25 \\HC-AUS-NS-FS-01\jobs\AA009325\Empire Bay Drive (Extended) July 2017\D-REF Report\FINAL REPORT (RevD)\Empire Bay Drive - Traffic and
• In the afternoon peak, the northbound queues on Empire Bay Drive southern approach extend for about 400 metres. The southbound queues on Empire Bay Drive northern approach extend for about 270 metres. On The Scenic Road and Cochrone Street, general queues of about 20 to 40 metres were observed.
Figure 3-3 Observed Queue Lengths – AM Peak (8-9)

Empire Bay Drive at The Scenic Road, Kincumber Intersection Upgrade– Traffic and Transport
Arcadis Australia Pacific Pty Limited (Arcadis) (ABN 76 104 485 289) 26 \\HC-AUS-NS-FS-01\jobs\AA009325\Empire Bay Drive (Extended) July 2017\D-REF Report\FINAL REPORT (RevD)\Empire Bay Drive - Traffic and
Figure 3-4 Observed Queue Lengths – PM Peak (3-4)
Empire Bay Drive at The Scenic Road, Kincumber Intersection Upgrade– Traffic and Transport
Arcadis Australia Pacific Pty Limited (Arcadis) (ABN 76 104 485 289) 27 \\HC-AUS-NS-FS-01\jobs\AA009325\Empire Bay Drive (Extended) July 2017\D-REF Report\FINAL REPORT (RevD)\Empire Bay Drive - Traffic and
3.3.3 Traffic Volumes on Empire Bay Drive and The Scenic Road
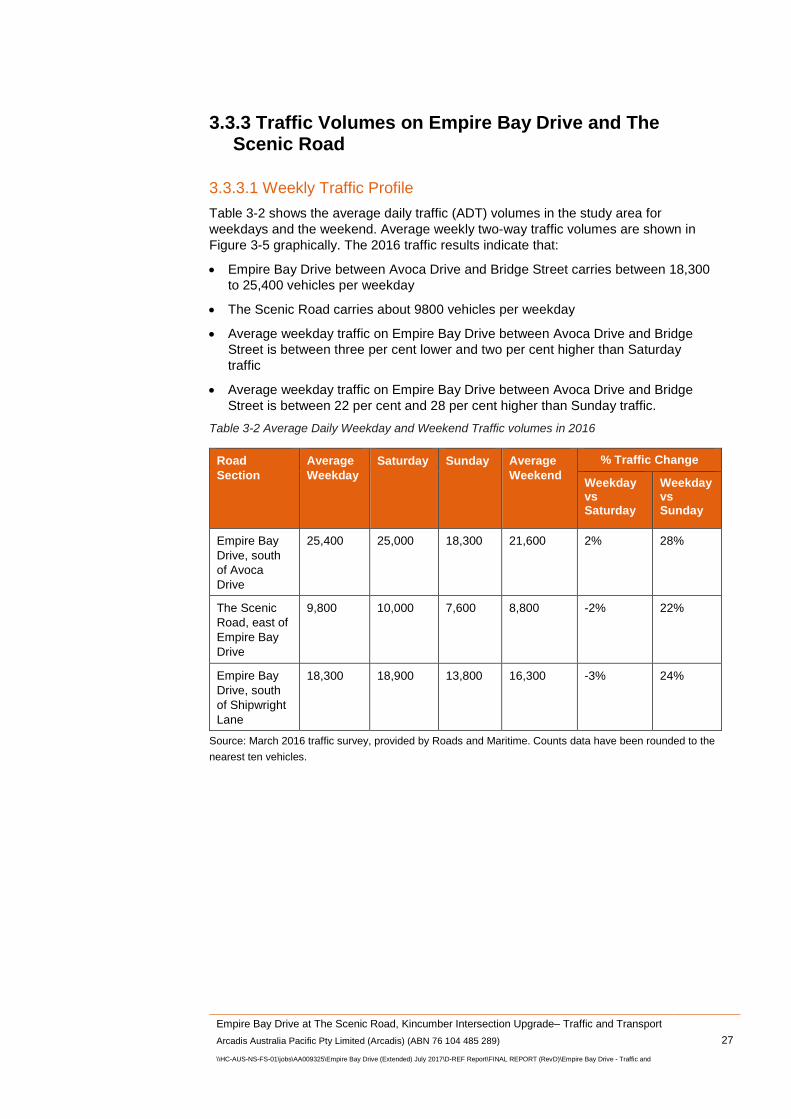
3.3.3.1 Weekly Traffic Profile Table 3-2 shows the average daily traffic (ADT) volumes in the study area for weekdays and the weekend. Average weekly two-way traffic volumes are shown in Figure 3-5 graphically. The 2016 traffic results indicate that:
• Empire Bay Drive between Avoca Drive and Bridge Street carries between 18,300 to 25,400 vehicles per weekday
• The Scenic Road carries about 9800 vehicles per weekday
• Average weekday traffic on Empire Bay Drive between Avoca Drive and Bridge Street is between three per cent lower and two per cent higher than Saturday traffic
• Average weekday traffic on Empire Bay Drive between Avoca Drive and Bridge Street is between 22 per cent and 28 per cent higher than Sunday traffic.
Table 3-2 Average Daily Weekday and Weekend Traffic volumes in 2016
Road Section
Average Weekday
Saturday Sunday Average Weekend
% Traffic Change
Weekday vs Saturday
Weekday vs Sunday
Empire Bay Drive, south of Avoca Drive
25,400 25,000 18,300 21,600 2% 28%
The Scenic Road, east of Empire Bay Drive
9,800 10,000 7,600 8,800 -2% 22%
Empire Bay Drive, south of Shipwright Lane
18,300 18,900 13,800 16,300 -3% 24%
Source: March 2016 traffic survey, provided by Roads and Maritime. Counts data have been rounded to the nearest ten vehicles.

Empire Bay Drive at The Scenic Road, Kincumber Intersection Upgrade– Traffic and Transport
Arcadis Australia Pacific Pty Limited (Arcadis) (ABN 76 104 485 289) 28 \\HC-AUS-NS-FS-01\jobs\AA009325\Empire Bay Drive (Extended) July 2017\D-REF Report\FINAL REPORT (RevD)\Empire Bay Drive - Traffic and
Figure 3-5 Average Daily Traffic (Weekday) in 2016

Empire Bay Drive at The Scenic Road, Kincumber Intersection Upgrade– Traffic and Transport
Arcadis Australia Pacific Pty Limited (Arcadis) (ABN 76 104 485 289) 29 \\HC-AUS-NS-FS-01\jobs\AA009325\Empire Bay Drive (Extended) July 2017\D-REF Report\FINAL REPORT (RevD)\Empire Bay Drive - Traffic and
3.4 Origin Destination Patterns The origin-destination trip patterns to and from the study area were estimated using the origin-destination survey.
The morning (AM) peak origin-destination data shows that:
• Of the total 100 per cent northbound traffic on Empire Bay Drive, about 95 per cent of traffic passed through the Cochrane Street / The Scenic Road roundabout. About 72 per cent traffic had destination to Avoca Drive (west) and 23 per cent traffic had destination to Avoca Drive (east). About 5 per cent traffic had destination to The Scenic Road.
• Of the total 100 per cent southbound traffic on Empire Bay Drive, about 95 per cent of traffic passed through the Cochrane Street / The Scenic Road roundabout. About 60 per cent traffic had origin from Avoca Drive (west) and 34 per cent traffic had origin from Avoca Drive (east). About 5 per cent traffic had origin from The Scenic Road.
The afternoon (PM) peak origin-destination data shows that:
• Of the total 100 per cent northbound traffic on Empire Bay Drive, about 90 per cent of traffic passed through the Cochrane Street / The Scenic Road roundabout. About 56 per cent traffic had destination to Avoca Drive (west) and 34 per cent traffic had destination to Avoca Drive (east). About 10 per cent traffic had destination to The Scenic Road.
• Of the total 100 per cent southbound traffic on Empire Bay Drive, about 94 per cent of traffic passed through the Cochrane Street / The Scenic Road roundabout. About 70 per cent traffic had origin from Avoca Drive (west) and 24 per cent traffic had origin from Avoca Drive (east). About 6 per cent traffic had origin from The Scenic Road.
Empire Bay Drive at The Scenic Road, Kincumber Intersection Upgrade– Traffic and Transport
Arcadis Australia Pacific Pty Limited (Arcadis) (ABN 76 104 485 289) 30 \\HC-AUS-NS-FS-01\jobs\AA009325\Empire Bay Drive (Extended) July 2017\D-REF Report\FINAL REPORT (RevD)\Empire Bay Drive - Traffic and
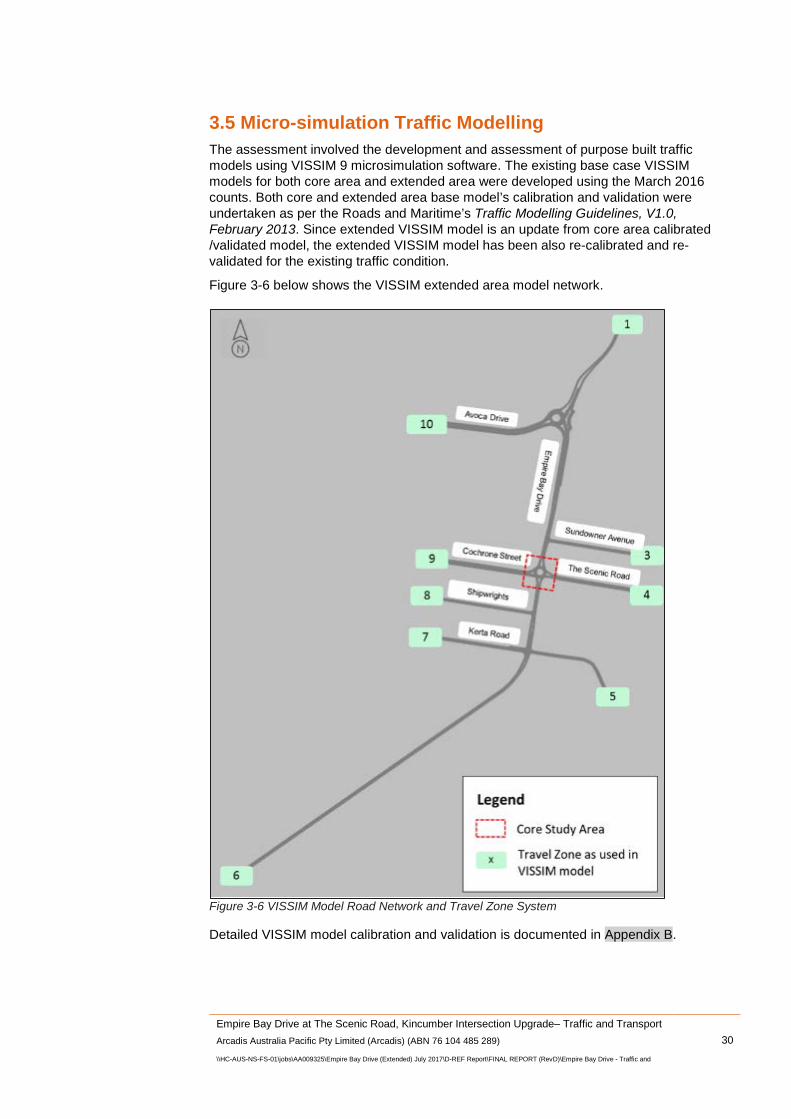
3.5 Micro-simulation Traffic Modelling The assessment involved the development and assessment of purpose built traffic models using VISSIM 9 microsimulation software. The existing base case VISSIM models for both core area and extended area were developed using the March 2016 counts. Both core and extended area base model’s calibration and validation were undertaken as per the Roads and Maritime’s Traffic Modelling Guidelines, V1.0, February 2013. Since extended VISSIM model is an update from core area calibrated /validated model, the extended VISSIM model has been also re-calibrated and re-validated for the existing traffic condition.
Figure 3-6 below shows the VISSIM extended area model network.
Figure 3-6 VISSIM Model Road Network and Travel Zone System
Detailed VISSIM model calibration and validation is documented in Appendix B.
Empire Bay Drive at The Scenic Road, Kincumber Intersection Upgrade– Traffic and Transport
Arcadis Australia Pacific Pty Limited (Arcadis) (ABN 76 104 485 289) 31 \\HC-AUS-NS-FS-01\jobs\AA009325\Empire Bay Drive (Extended) July 2017\D-REF Report\FINAL REPORT (RevD)\Empire Bay Drive - Traffic and
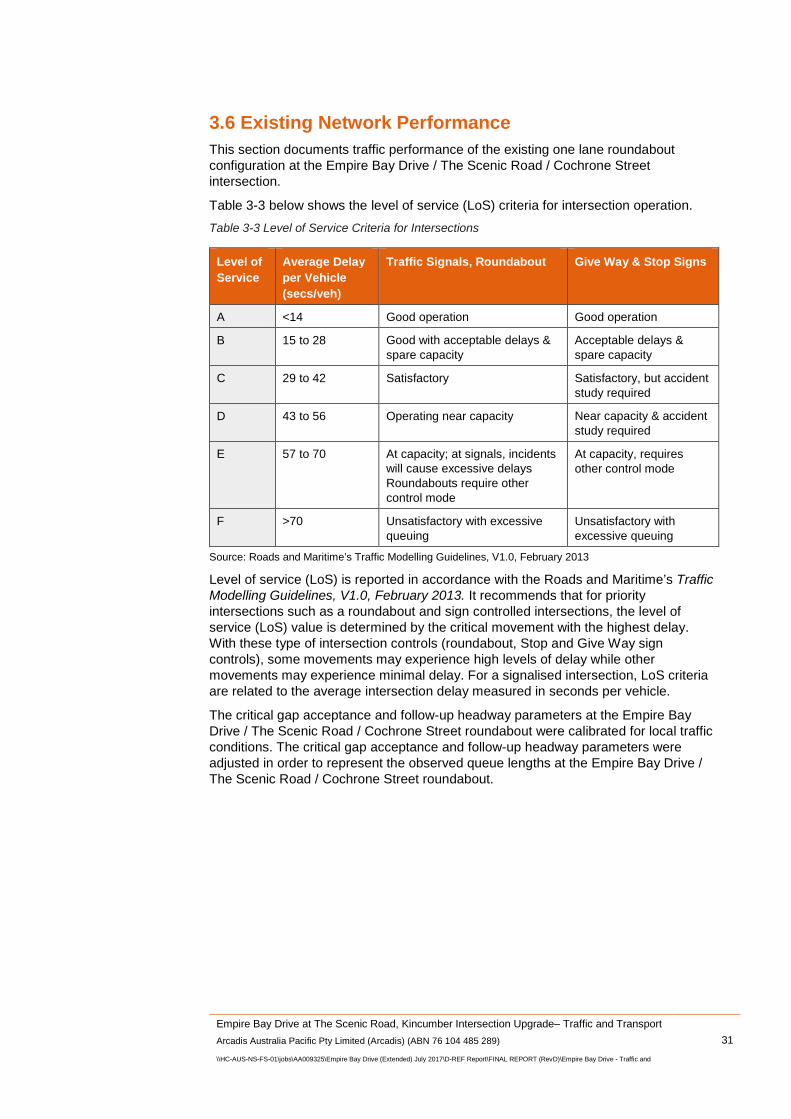
3.6 Existing Network Performance This section documents traffic performance of the existing one lane roundabout configuration at the Empire Bay Drive / The Scenic Road / Cochrone Street intersection.
Table 3-3 below shows the level of service (LoS) criteria for intersection operation. Table 3-3 Level of Service Criteria for Intersections
Level of Service
Average Delay per Vehicle (secs/veh)
Traffic Signals, Roundabout Give Way & Stop Signs
A <14 Good operation Good operation
B 15 to 28 Good with acceptable delays & spare capacity
Acceptable delays & spare capacity
C 29 to 42 Satisfactory Satisfactory, but accident study required
D 43 to 56 Operating near capacity Near capacity & accident study required
E 57 to 70 At capacity; at signals, incidents will cause excessive delays Roundabouts require other control mode
At capacity, requires other control mode
F >70 Unsatisfactory with excessive queuing
Unsatisfactory with excessive queuing
Source: Roads and Maritime’s Traffic Modelling Guidelines, V1.0, February 2013
Level of service (LoS) is reported in accordance with the Roads and Maritime’s Traffic Modelling Guidelines, V1.0, February 2013. It recommends that for priority intersections such as a roundabout and sign controlled intersections, the level of service (LoS) value is determined by the critical movement with the highest delay. With these type of intersection controls (roundabout, Stop and Give Way sign controls), some movements may experience high levels of delay while other movements may experience minimal delay. For a signalised intersection, LoS criteria are related to the average intersection delay measured in seconds per vehicle.
The critical gap acceptance and follow-up headway parameters at the Empire Bay Drive / The Scenic Road / Cochrone Street roundabout were calibrated for local traffic conditions. The critical gap acceptance and follow-up headway parameters were adjusted in order to represent the observed queue lengths at the Empire Bay Drive / The Scenic Road / Cochrone Street roundabout.
Empire Bay Drive at The Scenic Road, Kincumber Intersection Upgrade– Traffic and Transport
Arcadis Australia Pacific Pty Limited (Arcadis) (ABN 76 104 485 289) 32 \\HC-AUS-NS-FS-01\jobs\AA009325\Empire Bay Drive (Extended) July 2017\D-REF Report\FINAL REPORT (RevD)\Empire Bay Drive - Traffic and
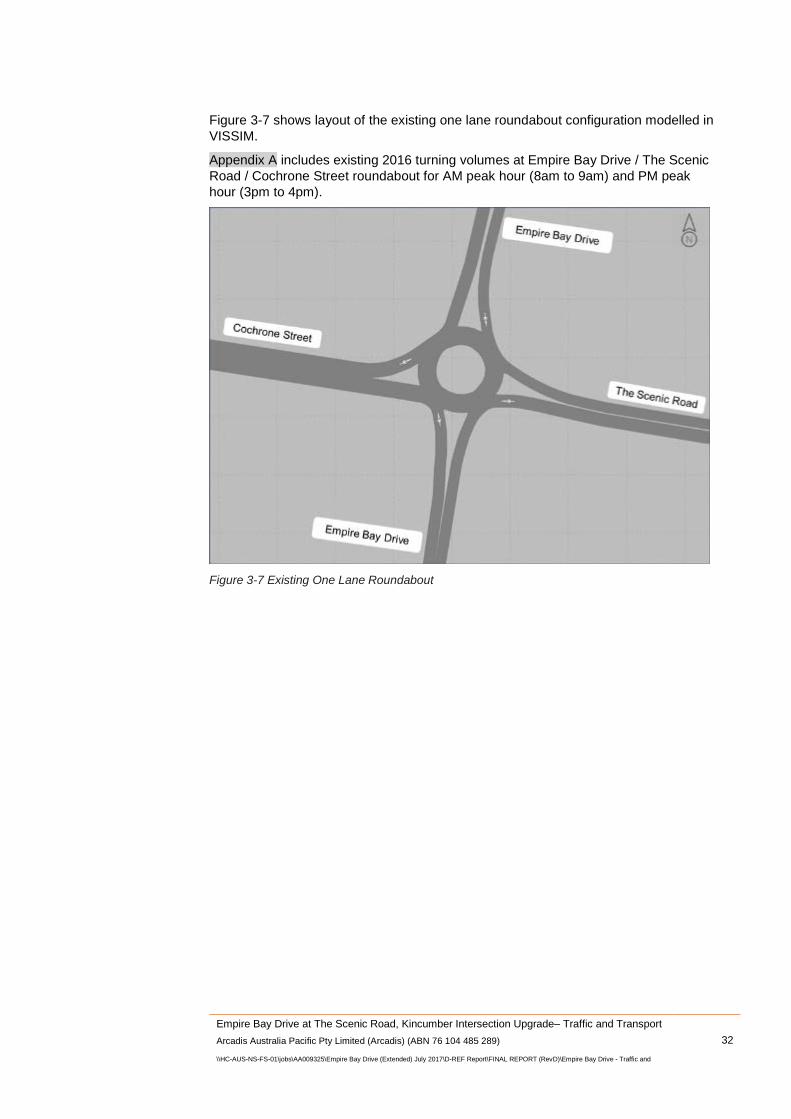
Figure 3-7 shows layout of the existing one lane roundabout configuration modelled in VISSIM.
Appendix A includes existing 2016 turning volumes at Empire Bay Drive / The Scenic Road / Cochrone Street roundabout for AM peak hour (8am to 9am) and PM peak hour (3pm to 4pm).
Figure 3-7 Existing One Lane Roundabout

Empire Bay Drive at The Scenic Road, Kincumber Intersection Upgrade– Traffic and Transport
Arcadis Australia Pacific Pty Limited (Arcadis) (ABN 76 104 485 289) 33 \\HC-AUS-NS-FS-01\jobs\AA009325\Empire Bay Drive (Extended) July 2017\D-REF Report\FINAL REPORT (RevD)\Empire Bay Drive - Traffic and
Table 3-4 below shows the existing level of service at one lane roundabout. Table 3-4 Existing (2016) Level of Service at Empire Bay Drive / The Scenic Road / Cochrone Street roundabout
Approach Road Existing 2016
AM Peak PM Peak
Delay (sec)
LoS Queue (m)
Delay (sec)
LoS Queue (m)
North Empire Bay Drive 71 F 84 20 B 50
East The Scenic Road 157 F 202 34 C 27
South Empire Bay Drive 452 F 779 246 F 675
West Cochrone Street 103 F 20 76 F 19
Overall intersection 452 F 246 F The existing condition traffic modelling results suggest level of service F in both morning and afternoon peak at Empire Bay Drive / The Scenic Road / Cochrone Street roundabout intersection. In the morning peak, the model shows intersection delays up to 7.5 minutes (450 seconds). In the afternoon peak, the model shows intersection delays up to 4.1 minutes (240 seconds).
The existing condition level of service results at Empire Bay Drive / The Scenic Road / Cochrone Street intersection has identified the need to improve the one lane roundabout capacity.
Empire Bay Drive at The Scenic Road, Kincumber Intersection Upgrade– Traffic and Transport
Arcadis Australia Pacific Pty Limited (Arcadis) (ABN 76 104 485 289) 34 \\HC-AUS-NS-FS-01\jobs\AA009325\Empire Bay Drive (Extended) July 2017\D-REF Report\FINAL REPORT (RevD)\Empire Bay Drive - Traffic and
4 Future Traffic Performance of One Lane Roundabout (Do Nothing)
This section documents future traffic performance of one lane roundabout (do nothing condition) at Empire Bay Drive / The Scenic Road / Cochrone Street intersection. The future year modelling was undertaken for 2019 (opening year), 2029 (10 years after opening) and 2039 (20 years after opening) for AM and PM peak traffic conditions.
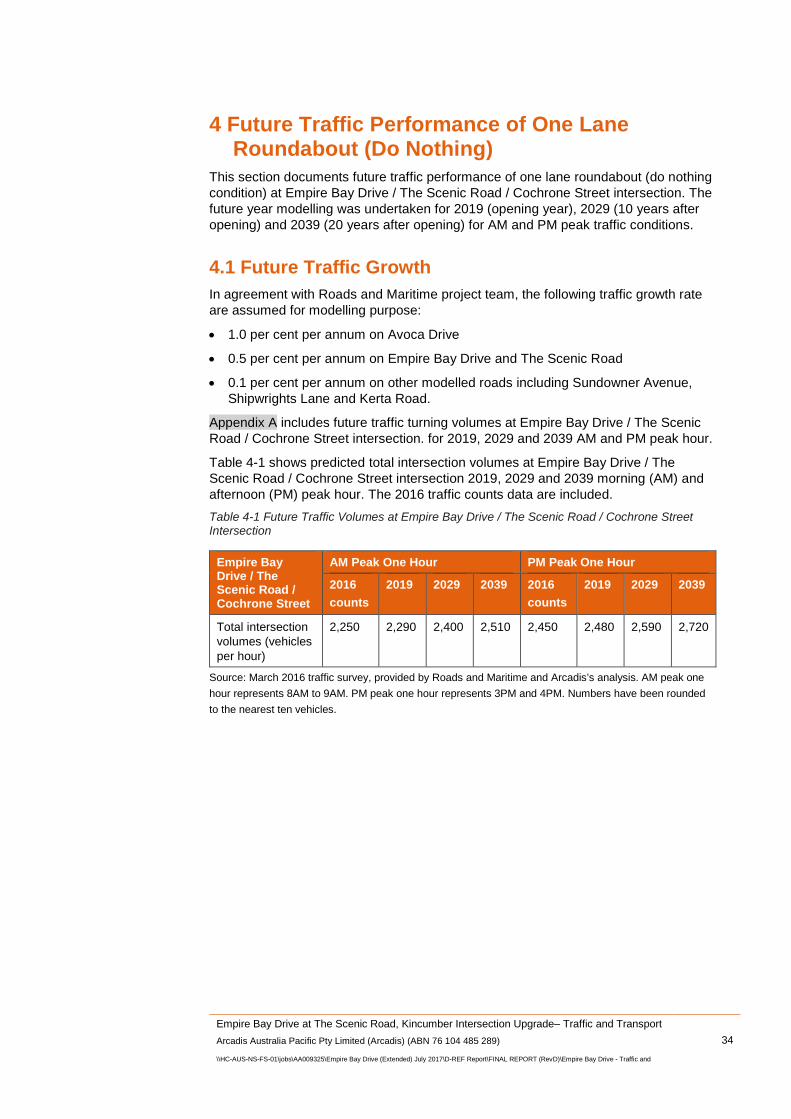
4.1 Future Traffic Growth In agreement with Roads and Maritime project team, the following traffic growth rate are assumed for modelling purpose:
• 1.0 per cent per annum on Avoca Drive
• 0.5 per cent per annum on Empire Bay Drive and The Scenic Road
• 0.1 per cent per annum on other modelled roads including Sundowner Avenue, Shipwrights Lane and Kerta Road.
Appendix A includes future traffic turning volumes at Empire Bay Drive / The Scenic Road / Cochrone Street intersection. for 2019, 2029 and 2039 AM and PM peak hour.
Table 4-1 shows predicted total intersection volumes at Empire Bay Drive / The Scenic Road / Cochrone Street intersection 2019, 2029 and 2039 morning (AM) and afternoon (PM) peak hour. The 2016 traffic counts data are included. Table 4-1 Future Traffic Volumes at Empire Bay Drive / The Scenic Road / Cochrone Street Intersection
Empire Bay Drive / The Scenic Road / Cochrone Street
AM Peak One Hour PM Peak One Hour
2016 counts
2019 2029 2039 2016 counts
2019 2029 2039
Total intersection volumes (vehicles per hour)
2,250 2,290 2,400 2,510 2,450 2,480 2,590 2,720
Source: March 2016 traffic survey, provided by Roads and Maritime and Arcadis’s analysis. AM peak one hour represents 8AM to 9AM. PM peak one hour represents 3PM and 4PM. Numbers have been rounded to the nearest ten vehicles.

Empire Bay Drive at The Scenic Road, Kincumber Intersection Upgrade– Traffic and Transport
Arcadis Australia Pacific Pty Limited (Arcadis) (ABN 76 104 485 289) 35 \\HC-AUS-NS-FS-01\jobs\AA009325\Empire Bay Drive (Extended) July 2017\D-REF Report\FINAL REPORT (RevD)\Empire Bay Drive - Traffic and
4.2 Level of Service of One Lane Roundabout (Do nothing)
Future traffic performance of one lane roundabout (do nothing) traffic conditions was assessed for years 2019, 2029 and 2039.
Table 4-2 to Table 4-4 summarises forecast level of service of the one lane roundabout (do nothing) for 2019, 2029 and 2039 morning and afternoon peak hour.
In line with existing condition model, the future condition models between 2019 and 2039 showed substantial adverse impact to one lane roundabout operation during peak period.
The future condition modelling results (2019, 2029 and 2039) showed level of service F in both morning and afternoon peak at Empire Bay Drive / The Scenic Road / Cochrone Street one lane roundabout intersection.
For do nothing condition, the 2019 future model shows intersection delays up to 8.3 minutes (AM peak) and 4.6 minutes (PM peak). By 2039, the intersection delays are predicted to increase up to 9.7 minutes (AM peak) and 5.8 minutes (PM peak). The future condition traffic model predicted longer queues on the Empire Bay Drive.
The future “do nothing condition” intersection delays and level of service results at Empire Bay Drive / The Scenic Road / Cochrone Street intersection has identified the need to upgrade the existing one lane roundabout to two lane roundabout. Table 4-2 Forecast Level of Service in 2019 – One Lane Roundabout (do nothing)
Approach Road Future 2019 – One Lane Roundabout
AM Peak PM Peak
Delay (sec) LoS Queue
(m) Delay (sec) LoS Queue
(m) North Empire Bay Drive 111 F 194 24 B 46
East The Scenic Road 121 F 164 33 C 25
South Empire Bay Drive 503 F 919 281 F 709
West Cochrone Street 77 F 17 68 E 15
Overall intersection 503 F 281 F Table 4-3 Forecast Level of Service in 2029 – One Lane Roundabout (do nothing)
Approach Road Future 2029 – One Lane Roundabout
AM Peak PM Peak
Delay (sec) LoS Queue
(m) Delay (sec) LoS Queue
(m)
North Empire Bay Drive 104 F 187 51 D 108
East The Scenic Road 147 F 194 62 E 56
South Empire Bay Drive 548 F 1,026 311 F 739
West Cochrone Street 74 F 16 101 F 24
Overall intersection 548 F 311 F

Empire Bay Drive at The Scenic Road, Kincumber Intersection Upgrade– Traffic and Transport
Arcadis Australia Pacific Pty Limited (Arcadis) (ABN 76 104 485 289) 36 \\HC-AUS-NS-FS-01\jobs\AA009325\Empire Bay Drive (Extended) July 2017\D-REF Report\FINAL REPORT (RevD)\Empire Bay Drive - Traffic and
Table 4-4 Forecast Level of Service in 2039 – One Lane Roundabout (do nothing)
Approach Road Future 2039 – One Lane Roundabout
AM Peak PM Peak
Delay (sec) LoS Queue
(m) Delay (sec) LoS Queue
(m)
North Empire Bay Drive 157 F 260 78 F 194
East The Scenic Road 149 F 200 59 E 55
South Empire Bay Drive 584 F 1,037 350 F 827
West Cochrone Street 75 F 16 65 E 15
Overall intersection 584 F 350 F

Empire Bay Drive at The Scenic Road, Kincumber Intersection Upgrade– Traffic and Transport
Arcadis Australia Pacific Pty Limited (Arcadis) (ABN 76 104 485 289) 37 \\HC-AUS-NS-FS-01\jobs\AA009325\Empire Bay Drive (Extended) July 2017\D-REF Report\FINAL REPORT (RevD)\Empire Bay Drive - Traffic and
5 Future Traffic Performance of Two Lane Roundabout Upgrade
This section documents future traffic performance of the proposed two lane roundabout upgrade at Empire Bay Drive / The Scenic Road / Cochrone Street intersection.
The concept design at the Empire Bay Drive / The Scenic Road intersection has been modified by Roads and Maritime from a road safety perspective. The modification includes lane discipline changes on The Scenic Road. The two right turn out of Scenic Road has been modified to one single right turn lane. The kerb side lane is modified for shared through and left turn movements only. No other changes are made to the Empire Bay / The Scenic Road intersection concept design.
Figure 5-1 below shows the updated concept design for two lane roundabout at Empire Bay Drive / The Scenic Road intersection.
Figure 5-1 Two Lane Roundabout Modified Concept Design Layout – VISSIM

Empire Bay Drive at The Scenic Road, Kincumber Intersection Upgrade– Traffic and Transport
Arcadis Australia Pacific Pty Limited (Arcadis) (ABN 76 104 485 289) 38 \\HC-AUS-NS-FS-01\jobs\AA009325\Empire Bay Drive (Extended) July 2017\D-REF Report\FINAL REPORT (RevD)\Empire Bay Drive - Traffic and
Table 5-1 to Table 5-3 summarises forecast 2039 intersection delays and level of service for two lane roundabout upgrade. Table 5-1 Forecast Level of Service in 2019 for Two Lane Roundabout Upgrade
Approach Road Future 2019
AM Peak PM Peak
Delay (sec) LoS Queue
(m) Delay (sec) LoS Queue
(m) North Empire Bay Drive 11 A 10 13 A 17
East The Scenic Road 31 C 32 34 C 18
South Empire Bay Drive 26 B 19 15 B 10
West Cochrone Street 42 C 8 30 C 5
Overall intersection 42 C 34 C Table 5-2 Forecast Level of Service in 2029 for Two Lane Roundabout Upgrade
Approach Road Future 2029
AM Peak PM Peak
Delay (sec) LoS Queue
(m) Delay (sec) LoS Queue
(m) North Empire Bay Drive 11 A 11 13 A 17
East The Scenic Road 44 D 54 36 C 20
South Empire Bay Drive 29 C 22 17 B 15
West Cochrone Street 49 D 9 51 D 9
Overall intersection 49 D 51 D Table 5-3 Forecast Level of Service in 2039 for Two Lane Roundabout Upgrade
Approach Road Future 2039
AM Peak PM Peak
Delay (sec) LoS Queue
(m) Delay (sec) LoS Queue
(m) North Empire Bay Drive 11 A 13 13 A 17
East The Scenic Road 66 E 93 53 D 31
South Empire Bay Drive 38 C 24 45 D 43
West Cochrone Street 57 E 10 59 E 12
Overall intersection 66 E 59 E

Empire Bay Drive at The Scenic Road, Kincumber Intersection Upgrade– Traffic and Transport
Arcadis Australia Pacific Pty Limited (Arcadis) (ABN 76 104 485 289) 39 \\HC-AUS-NS-FS-01\jobs\AA009325\Empire Bay Drive (Extended) July 2017\D-REF Report\FINAL REPORT (RevD)\Empire Bay Drive - Traffic and
The VISSIM modelling results indicated that:
• In opening year 2019, two lane roundabout upgrade would provide level of service C (delay of 42 seconds) in morning peak and level of service C (delay of 34 seconds) in afternoon peak
• In 2029, 10 years after opening two lane roundabout upgrade would provide level of service D (delay of 49 seconds) in morning peak and level of service D (delay of 51 seconds) in afternoon peak
• In 2039, 20 years after opening two lane roundabout upgrade would provide level of service E (delay of 66 seconds) in morning peak and level of service E (delay of 59 seconds) in afternoon peak.
Empire Bay Drive at The Scenic Road, Kincumber Intersection Upgrade– Traffic and Transport
Arcadis Australia Pacific Pty Limited (Arcadis) (ABN 76 104 485 289) 40 \\HC-AUS-NS-FS-01\jobs\AA009325\Empire Bay Drive (Extended) July 2017\D-REF Report\FINAL REPORT (RevD)\Empire Bay Drive - Traffic and
5.1 Impact on Other Travel Modes
5.1.1 Bus Services There would be no impact to the existing bus routes on Empire Bay Drive with proposed two lane roundabout upgrade at Empire Bay / The Scenic Road / Cochrone Street intersection. All existing bus services and bus stops along the Empire Bay Drive would be retained.
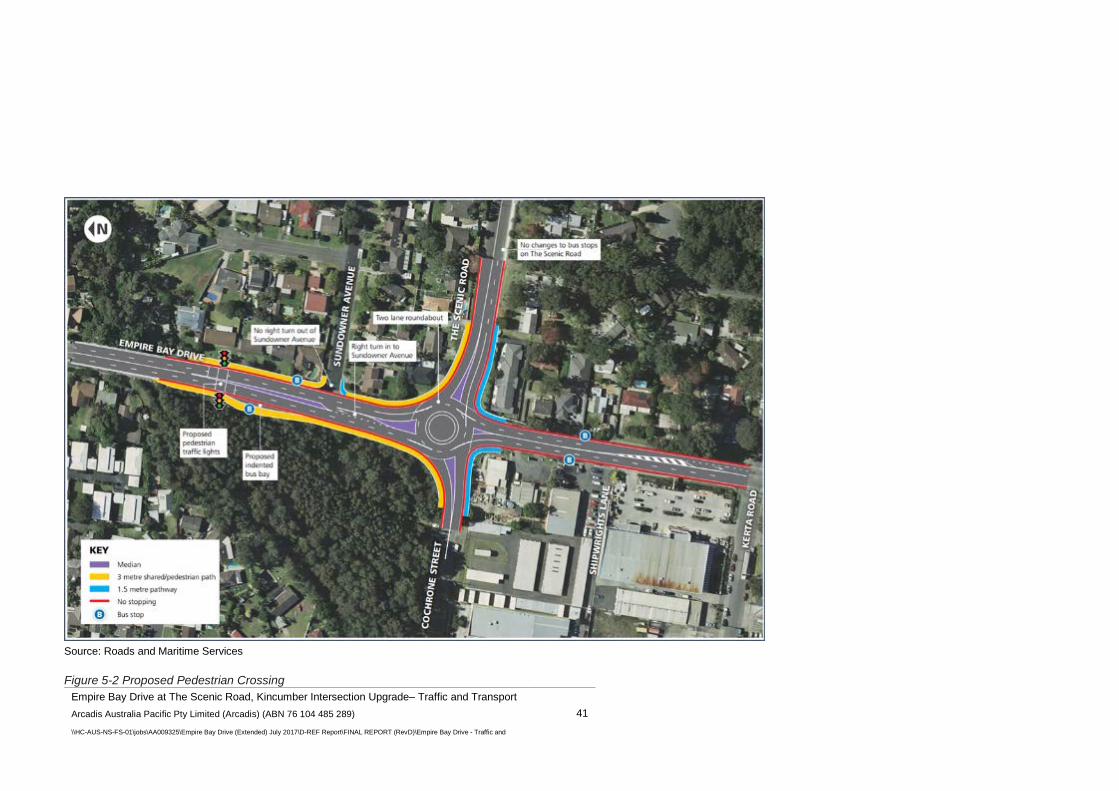
Figure 5-2 below shows the bus stops in the vicinity of proposed two lane roundabout upgrade at Empire Bay / The Scenic Road / Cochrone Street intersection.
5.1.2 Pedestrians As part of the proposed upgrade, a new signalised pedestrian crossing would be provided at existing pedestrian refuge location (about 85 meters north of Sundowner Avenue). This pedestrian crossing facility would improve connectivity between eastern and western side of Empire Bay Drive. Figure 5-2 shows the proposed pedestrian crossing on the Empire Bay Drive.
Empire Bay Drive at The Scenic Road, Kincumber Intersection Upgrade– Traffic and Transport
Arcadis Australia Pacific Pty Limited (Arcadis) (ABN 76 104 485 289) 41 \\HC-AUS-NS-FS-01\jobs\AA009325\Empire Bay Drive (Extended) July 2017\D-REF Report\FINAL REPORT (RevD)\Empire Bay Drive - Traffic and
Source: Roads and Maritime Services
Figure 5-2 Proposed Pedestrian Crossing

Empire Bay Drive at The Scenic Road, Kincumber Intersection Upgrade– Traffic and Transport
Arcadis Australia Pacific Pty Limited (Arcadis) (ABN 76 104 485 289) 42 \\HC-AUS-NS-FS-01\jobs\AA009325\Empire Bay Drive (Extended) July 2017\D-REF Report\FINAL REPORT (RevD)\Empire Bay Drive - Traffic and
6 CONCLUSIONS Roads and Maritime Services ((Roads and Maritime) is planning to upgrade the intersection of Empire Bay Drive, The Scenic Road and Cochrone Street at Kincumber. It is proposed to upgrade the existing one lane roundabout to two lane roundabout. A consultation process involving Roads and Maritime project team constituted an important element of the Study. This included presentation of traffic modelling outcomes to Roads and Maritime project team, and assist in design refinements.
This Traffic and Transport Assessment Report has been prepared to support the Review of Environment Factors (REF) submission for the proposed two lane roundabout upgrade.
Empire Bay Drive is a critical link between the Central Coast suburbs of Woy Woy, Ettalong and Umina in the south and Terrigal, Kincumber and Erina in the north. Empire Bay Drive is currently one lane in each direction and is a pinch point for the 25,000 motorists travelling each day between Kerta Road and Avoca Drive at Kincumber. The existing roundabout at Empire Bay Drive, The Scenic Road and Cochrone Street has one circulating lane. During peak hours, motorists are required to wait for long periods at the roundabout which has a substantial impact on traffic flow.
A road based microsimulation traffic model was developed for the study area using the VISSIM software. Arcadis supplemented this assessment with SIDRA models to assess the performance of individual intersections.
The existing condition traffic modelling results suggest level of service F in both morning and afternoon peak at Empire Bay Drive / The Scenic Road / Cochrone Street roundabout intersection. In the morning peak, the model shows intersection delays up to 7.5 minutes. In the afternoon peak, the model shows intersection delays up to 4.1 minutes. The existing condition level of service results at Empire Bay Drive / The Scenic Road / Cochrone Street intersection has identified the need to improve the one lane roundabout capacity.
In agreement with Roads and Maritime project team, the following traffic growth rate are assumed for modelling purpose:
• 1.0 per cent per annum on Avoca Drive
• 0.5 per cent per annum on Empire Bay Drive and The Scenic Road
• 0.1 per cent per annum on other modelled roads including Sundowner Avenue, Shipwrights Lane and Kerta Road.
For modelling purpose, the Study assumes 2019 as the opening year of the upgraded two lane roundabout. The level of service of proposed two lane roundabout upgrade has been determined for opening year (2019), 10 years after opening (2029) and 20 years after opening (2039).
The traffic and transport assessment found that:
• Two lane roundabout upgrade at Empire Bay Drive / The Scenic Road / Cochrone Street would substantially improve traffic capacity and level of service
• In opening year 2019, two lane roundabout upgrade would provide level of service C (delay of 42 seconds) in morning peak and level of service C (delay of 34 seconds) in afternoon peak
• In 2029, 10 years after opening two lane roundabout upgrade would provide level of service D (delay of 49 seconds) in morning peak and level of service D (delay of 51 seconds) in afternoon peak

Empire Bay Drive at The Scenic Road, Kincumber Intersection Upgrade– Traffic and Transport
Arcadis Australia Pacific Pty Limited (Arcadis) (ABN 76 104 485 289) 43 \\HC-AUS-NS-FS-01\jobs\AA009325\Empire Bay Drive (Extended) July 2017\D-REF Report\FINAL REPORT (RevD)\Empire Bay Drive - Traffic and
• In 2039, 20 years after opening two lane roundabout upgrade would provide level of service E (delay of 66 seconds) in morning peak and level of service E (delay of 59 seconds) in afternoon peak.

APPENDIX A EXISTING 2016 AND FUTURE 2019, 2029, 2039 TURNING VOLUMES (AM AND PM)


\\HC-AUS-NS-FS-01\jobs\AA009325\Empire Bay Drive (Extended) July 2017\D-REF Report\FINAL REPORT (RevD)\Appendix A_Existing 2016 and Future 2019, 2029, 2039 Turning Volumes (AM and PM)_RevD.docx
3
1104 884
51 134 65 7 61 712 104 270
18 458
105 6 588 101 1 38 538 42
696 773
2016 AM
The Scenic Road
Cochrone Street
Empi
re B
ay D
rive
Empi
re B
ay D
rive
1074 1027
79 136 31 11 88 659 269 439
26 278
124 7 706 139 5 29 414 107
857 797
2016 PM
The Scenic Road
Cochrone Street
Empi
re B
ay D
rive
Empi
re B
ay D
rive
\\HC-AUS-NS-FS-01\jobs\AA009325\Empire Bay Drive (Extended) July 2017\D-REF Report\FINAL REPORT (RevD)\Appendix A_Existing 2016 and Future 2019, 2029, 2039 Turning Volumes (AM and PM)_RevD.docx
4
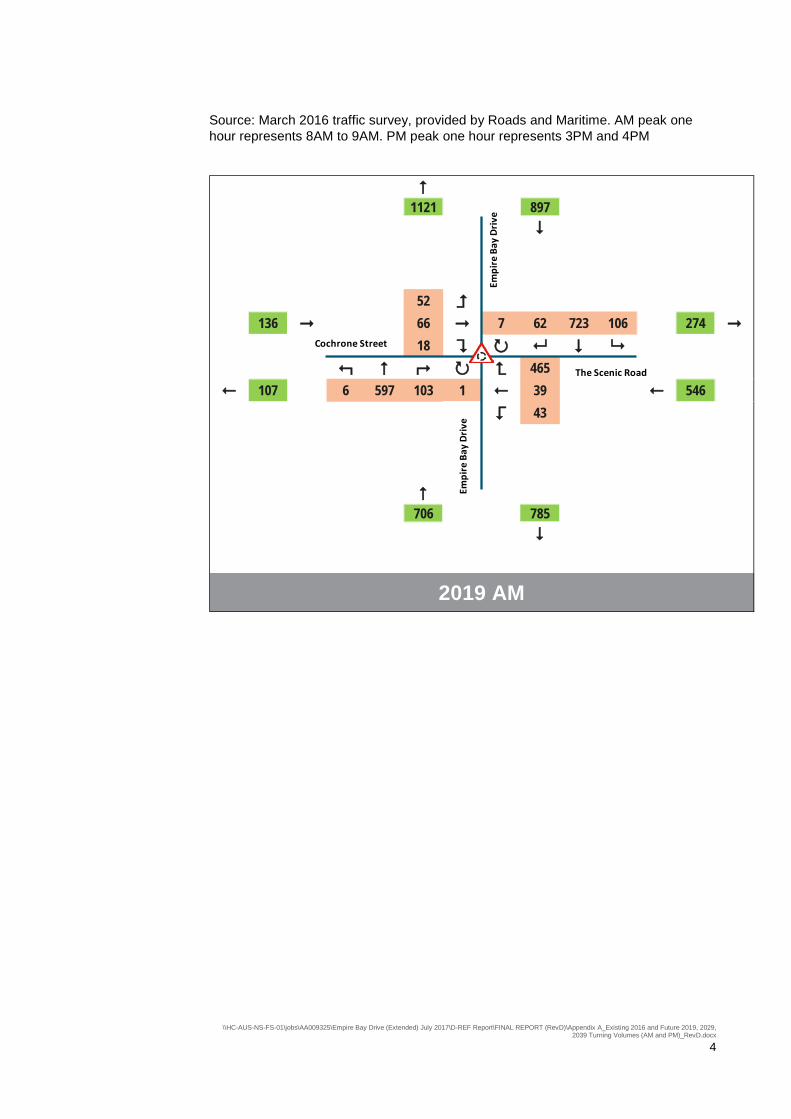
Source: March 2016 traffic survey, provided by Roads and Maritime. AM peak one hour represents 8AM to 9AM. PM peak one hour represents 3PM and 4PM
1121 897
52 136 66 7 62 723 106 274
18 465
107 6 597 103 1 39 546 43
706 785
2019 AM
The Scenic Road
Cochrone Street
Empi
re B
ay D
rive
Empi
re B
ay D
rive

\\HC-AUS-NS-FS-01\jobs\AA009325\Empire Bay Drive (Extended) July 2017\D-REF Report\FINAL REPORT (RevD)\Appendix A_Existing 2016 and Future 2019, 2029, 2039 Turning Volumes (AM and PM)_RevD.docx
5
Source: Arcadis’ analysis. AM peak one hour represents 8AM to 9AM. PM peak one hour represents 3PM and 4PM
1090 1042
80 138 31 11 89 669 273 446
26 282
126 7 717 141 5 29 420 109
870 809
2019 PM
The Scenic Road
Cochrone Street
Empi
re B
ay D
rive
Empi
re B
ay D
rive

\\HC-AUS-NS-FS-01\jobs\AA009325\Empire Bay Drive (Extended) July 2017\D-REF Report\FINAL REPORT (RevD)\Appendix A_Existing 2016 and Future 2019, 2029, 2039 Turning Volumes (AM and PM)_RevD.docx
6
1176 941
54 143 69 7 65 758 111 288
19 488
112 6 626 108 1 40 573 45
741 823
2029 AM
The Scenic Road
Cochrone Street
Empi
re B
ay D
rive
Empi
re B
ay D
rive
1144 1094
84 145 33 12 94 702 286 468
28 296
132 7 752 148 5 31 441 114
913 849
2029 PM
The Scenic Road
Cochrone Street
Empi
re B
ay D
rive
Empi
re B
ay D
rive

\\HC-AUS-NS-FS-01\jobs\AA009325\Empire Bay Drive (Extended) July 2017\D-REF Report\FINAL REPORT (RevD)\Appendix A_Existing 2016 and Future 2019, 2029, 2039 Turning Volumes (AM and PM)_RevD.docx
7
Source: Arcadis’ analysis. AM peak one hour represents 8AM to 9AM. PM peak one hour represents 3PM and 4PM
1231 986
57 149 72 8 68 794 116 301
20 511
117 7 656 113 1 42 600 47
776 862
2039 AM
The Scenic Road
Cochrone Street
Empi
re B
ay D
rive
Empi
re B
ay D
rive

\\HC-AUS-NS-FS-01\jobs\AA009325\Empire Bay Drive (Extended) July 2017\D-REF Report\FINAL REPORT (RevD)\Appendix A_Existing 2016 and Future 2019, 2029, 2039 Turning Volumes (AM and PM)_RevD.docx
8
Source: Arcadis’ analysis. AM peak one hour represents 8AM to 9AM. PM peak one hour represents 3PM and 4PM
1198 1145
88 152 35 12 98 735 300 489
29 310
138 8 787 155 6 32 462 119
956 889
2039 PM
The Scenic Road
Cochrone Street
Empi
re B
ay D
rive
Empi
re B
ay D
rive

APPENDIX B VISSIM MODEL DEVELOPMENT, CALIBRATION AND VALIDATION FOR REF


\\HC-AUS-NS-FS-01\jobs\AA009325\Empire Bay Drive (Extended) July 2017\D-REF Report\FINAL REPORT (RevD)\Appendix B_VISSIM Model, Calibration and Validation_Extended Model for REF_revD.docx
1
1 VISSIM MODEL DEVELOPMENT, CALIBRATION AND VALIDATION The VISIM model development, calibration and validation is presented in two parts as follows:
• Part A: Core area model development, calibration and validation. The core area model calibration and validation was signed off by Roads and Maritime’s project team.
• Part B: Extended area model development, re-calibration and re-validation.
1.1 Part A – Core Area Model Development, Calibration and Validation The VISSIM model for the Empire Bay Drive / The Scenic Road / Cochrone Street intersection (core area) was calibrated and validated for 2016 traffic conditions as part of the traffic modelling works undertaken in June 2017 (referred to report titled “Empire Bay Drive / The Scenic Road / Cochrone Street Intersection – Traffic Modelling on a Dual Lane Roundabout Upgrade”, prepared by Arcadis in June 2017).
A road based micro-simulation traffic model has been developed using VISSIM version 9. Figure 1 shows the VISSIM model developed for the core area. The VISSIM model was calibrated for core area criteria as per Roads and Maritime’s Traffic Modelling Guidelines V1.0, February 2013. The base case model represents the existing 2016 traffic conditions for:
• AM peak period (two hours) between 7AM and 9AM
• PM peak period (three hours) between 3PM and 6PM.
In addition, a pre loading “warm-up” period for 60 minutes and post peak “cool down” period for 60 minutes were applied to AM and PM peak periods.
1.1.1 Data Sources The following data sources were used in the VISSIM model development, calibration and validation purposes:
• The 2016 traffic survey data including intersection movement counts and queue length surveys
• Aerial photography.
1.1.2 Road Network Coding Arcadis utilised aerial photo images to code the road network for the existing one lane roundabout condition. The aerial photography provided adequate information for network coding including road length, lane width, number of lanes, lane discipline and intersection configuration. Figure 1 shows the VISSIM model network study area and travel zones.
All link-types and categories used in the VISSIM model are in line with Roads and Maritime’s guidelines. The roundabout has been coded using the priority rule including headway distance and gap time to reflect local driver behaviour.

\\HC-AUS-NS-FS-01\jobs\AA009325\Empire Bay Drive (Extended) July 2017\D-REF Report\FINAL REPORT (RevD)\Appendix B_VISSIM Model, Calibration and Validation_Extended Model for REF_revD.docx
2
Figure 1 VISSIM Model
The VISSIM model contains four travel zones within the study area. Figure 2 shows the existing one lane roundabout layout in VISSIM.
Figure 2 Existing Single Lane Roundabout
1
2
3
4
Zone

\\HC-AUS-NS-FS-01\jobs\AA009325\Empire Bay Drive (Extended) July 2017\D-REF Report\FINAL REPORT (RevD)\Appendix B_VISSIM Model, Calibration and Validation_Extended Model for REF_revD.docx
3
1.1.3 Demand Matrix The demand matrix was developed using surveyed intersection turning movement counts. The proportion of heavy vehicles and vehicle types was taken directly from available classified traffic data. The demand profiles are developed based on the traffic survey data.
In the absence of actual counts between 2PM and 3PM at Empire Bay Drive / The Scenic Road / Cochrone Street intersection, Arcadis has used an alternative site (see Figure 3 below) very close to this intersection. The 24-hour midblock tube counts data on Empire Bay Drive (north of this intersection) has formed the basis of demand estimation between 2PM and 3PM. An empirical relationship was identified for demand between 2PM and 3PM as proportion of demand between 3PM and 4PM. The analysis found that 2PM and 3PM demand is about 90% of 3PM to 4PM demand as follows:
(2 𝑡𝑡𝑡𝑡 3 𝑃𝑃𝑃𝑃 𝑑𝑑𝑑𝑑𝑑𝑑𝑑𝑑𝑑𝑑𝑑𝑑) ≈ 0.9 ×(3 𝑡𝑡𝑡𝑡 4 𝑑𝑑𝑑𝑑𝑑𝑑𝑑𝑑𝑑𝑑𝑑𝑑)
As such, the 2PM to 3PM demand at Empire Bay Drive / The Scenic Road / Cochrone Street intersection is assumed to be 90% of 3PM to 4PM demand.
Figure 3 Midblock Count Site
The Project
Midblock Count Site

\\HC-AUS-NS-FS-01\jobs\AA009325\Empire Bay Drive (Extended) July 2017\D-REF Report\FINAL REPORT (RevD)\Appendix B_VISSIM Model, Calibration and Validation_Extended Model for REF_revD.docx
4
1.1.4 Modelling Parameters The critical gap acceptance and follow-up headway parameters for one lane roundabout has been modelled using calibrated parameters determined previously using SIDRA model.
Calibration The traffic demand input to 2016 VISSIM models was calibrated using intersection turning movement counts for each hour for AM peak between 7AM and 9AM and for PM peak between 3PM and 6PM. The comparison between counts and model volumes for each hour interval are reported.
The following sections outline the calibration and validation criteria used for the project. This is followed by a comparison of the results for the AM and PM peak models with the observed values.
1.1.1 Calibration criteria Model calibration was carried out based on the core area modelling criteria provided by the Roads and Maritime guidelines. Table 1 outlines calibration targets used. The R-Squared (R2) statistic is used as a goodness-of-fit measure of the correlation between observed volumes and predicted model volumes. Table 1 Calibration Criteria
Calibration Criteria Calibration Targets
Intersection turning movements
• Flows < 99 Within 10 vehicles of observed value
• Flows 100 to 999 Within 10 per cent of observed value
• R2 value including scatter plots > 0.95
Source: Traffic Modelling Guidelines, V1.0, Roads and Maritime, February 2013.

\\HC-AUS-NS-FS-01\jobs\AA009325\Empire Bay Drive (Extended) July 2017\D-REF Report\FINAL REPORT (RevD)\Appendix B_VISSIM Model, Calibration and Validation_Extended Model for REF_revD.docx
5
1.1.2 Calibration results for the AM peak Table 2 summarises turn volume calibration results for the AM peak between 7AM and 8AM and between 8AM and 9AM. Figure 4 shows a scatter plot of modelled and observed flows for the AM peak hour between 8AM and 9AM. A detailed turn count calibration spreadsheet for the AM peak period is included in Attachment A.
The calibration results show that a high standard of calibration was achieved for the AM peak model. For the AM peak, 100% of turn flows satisfy the calibration criteria. The result is reinforced with the high R2 value of 1.00 achieved for all hours.
Table 2 Turn Calibration Summary – Core Area, AM Peak Model
Period Criteria Target Achieved Status
7AM to 8AM
Flows < 99 Within 10 vehicles of observed value
100% Pass
Flows 100 to 999 Within 10 per cent of observed value
100% Pass
R2 value > 0.95 1.00 Pass
8AM to 9AM
Flows < 99 Within 10 vehicles of observed value
100% Pass
Flows 100 to 999 Within 10 per cent of observed value
100% Pass
R2 value > 0.95 1.00 Pass
Figure 4 Scatter Plot Modelled vs Observed Turn Flows – Core Area, AM Peak Hour (8AM to 9AM) The results from above assessment confirmed that the AM Peak model satisfied the calibration criteria.
R² = 0.9992
0
100
200
300
400
500
600
700
800
0 100 200 300 400 500 600 700 800
Mod
elle
d Fl
ows
(veh
/h)
Observed Flows (veh/h)
AM Peak Traffic Volume Comparison (8-9 AM)
Modelled / Observed x=y Linear (Modelled / Observed)

\\HC-AUS-NS-FS-01\jobs\AA009325\Empire Bay Drive (Extended) July 2017\D-REF Report\FINAL REPORT (RevD)\Appendix B_VISSIM Model, Calibration and Validation_Extended Model for REF_revD.docx
6
1.1.3 Calibration results for the PM peak Table 3 summarises turn volume calibration results for the PM peak between 3PM and 4PM and between 4PM and 5PM. Figure 5 shows a scatter plot of modelled and observed flows for the PM peak hour between 3PM and 4 PM. A detailed turn count calibration spreadsheet for the AM peak period is included in Attachment A.
The calibration results show that a high standard of calibration was achieved for the PM peak model. For the PM peak, 100% of turn flows satisfy the calibration criteria. The result is reinforced with the high R2 value of 1.00 achieved for all hours. Table 3 Turn Calibration Summary – PM Peak Model
Period Criteria Target Achieved Status
3PM to 4PM
Flows < 99 Within 10 vehicles of observed value 100% Pass
Flows 100 to 999 Within 10 per cent of observed value 100% Pass
R2 value > 0.95 1.00 Pass
4PM to 5PM
Flows < 99 Within 10 vehicles of observed value
100% Pass
Flows 100 to 999 Within 10 per cent of observed value
100% Pass
R2 value > 0.95 1.00 Pass
5PM to 6PM
Flows < 99 Within 10 vehicles of observed value
100% Pass
Flows 100 to 999 Within 10 per cent of observed value
100% Pass
R2 value > 0.95 1.00 Pass
Figure 5 Scatter Plot Modelled vs Observed Turn Flows – Core Area, PM Peak Hour (3PM to 4PM)
The results from above assessment confirmed that the PM Peak model satisfied the calibration criteria.
R² = 0.9992
0
100
200
300
400
500
600
700
800
0 100 200 300 400 500 600 700 800
Mod
elle
d Fl
ows
(veh
/h)
Observed Flows (veh/h)
PM Peak Traffic Volume Comparison (3-4 PM)
Modelled / Observed x=y Linear (Modelled / Observed)

\\HC-AUS-NS-FS-01\jobs\AA009325\Empire Bay Drive (Extended) July 2017\D-REF Report\FINAL REPORT (RevD)\Appendix B_VISSIM Model, Calibration and Validation_Extended Model for REF_revD.docx
7
Queue length validation Counting or calculating queue length is a subjective exercise since queued vehicles will often still be moving slowly and it will not always be clear what criteria should be used to constitute a queue during surveys. For that reason Roads and Maritime does not have mandatory statistical guideline criteria for queue length comparison.
Nevertheless modelled queue lengths were validated for typical queue lengths at Empire Bay Drive / The Scenic Road / Cochrone Street intersection, where approximately 1 kilometre (south approach) in the morning peak and approximately 400 metres (north approach) in the afternoon peak were observed at site and also advised by Roads and Maritime. Predicted AM and PM peak queue lengths at Empire Bay Drive / The Scenic Road / Cochrone Street intersection are shown in Figure 6 and Figure 7.
The core area VISSIM model has been validated to observed queue lengths.
Figure 6 Predicted Queue Lengths (by Approach) – Core Area, AM Peak Model
Figure 7 Predicted Queue Lengths (by Approach) – Core Area, PM Peak Model
0
200
400
600
800
1000
1200
6 7 8 9 10
Que
ue D
ista
nce
(m)
Time (AM)
Queue Length (AM Peak) - VISSIM
North East South West North (95th Percentile) East (95th Percentile) South (95th Percentile) West (95th Percentile)
0
200
400
600
800
1000
1200
3 4 5 6 7
Que
ue D
ista
nce
(m)
Time (PM)
Queue Length (PM Peak) - VISSIM
North East South West North (95th Percentile) East (95th Percentile) South (95th Percentile) West (95th Percentile)
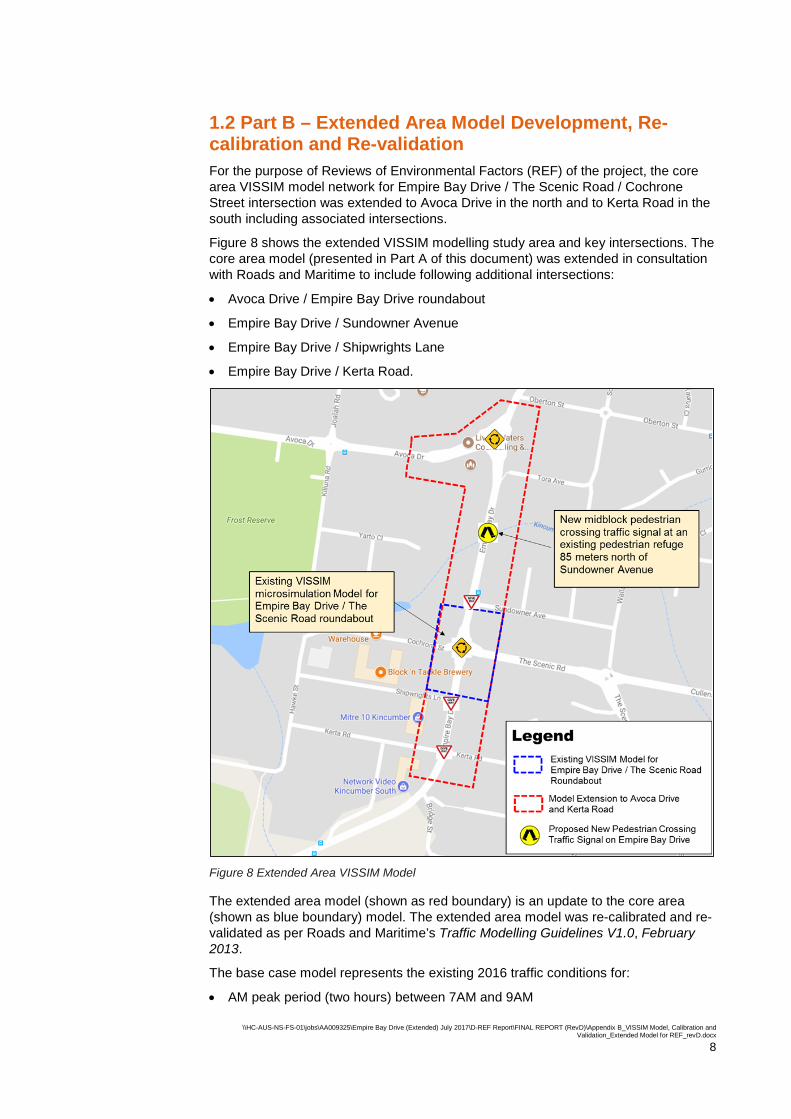
\\HC-AUS-NS-FS-01\jobs\AA009325\Empire Bay Drive (Extended) July 2017\D-REF Report\FINAL REPORT (RevD)\Appendix B_VISSIM Model, Calibration and Validation_Extended Model for REF_revD.docx
8
1.2 Part B – Extended Area Model Development, Re-calibration and Re-validation For the purpose of Reviews of Environmental Factors (REF) of the project, the core area VISSIM model network for Empire Bay Drive / The Scenic Road / Cochrone Street intersection was extended to Avoca Drive in the north and to Kerta Road in the south including associated intersections.
Figure 8 shows the extended VISSIM modelling study area and key intersections. The core area model (presented in Part A of this document) was extended in consultation with Roads and Maritime to include following additional intersections:
• Avoca Drive / Empire Bay Drive roundabout
• Empire Bay Drive / Sundowner Avenue
• Empire Bay Drive / Shipwrights Lane
• Empire Bay Drive / Kerta Road.
Figure 8 Extended Area VISSIM Model
The extended area model (shown as red boundary) is an update to the core area (shown as blue boundary) model. The extended area model was re-calibrated and re-validated as per Roads and Maritime’s Traffic Modelling Guidelines V1.0, February 2013.
The base case model represents the existing 2016 traffic conditions for:
• AM peak period (two hours) between 7AM and 9AM

\\HC-AUS-NS-FS-01\jobs\AA009325\Empire Bay Drive (Extended) July 2017\D-REF Report\FINAL REPORT (RevD)\Appendix B_VISSIM Model, Calibration and Validation_Extended Model for REF_revD.docx
9
• PM peak period (two hours) between 3PM and 5PM.
In addition, a pre loading “warm-up” period for 60 minutes and post peak “cool down” period for 60 minutes were applied to AM and PM peak periods.
1.1.4 Data Sources The following data sources were used to develop, re-calibrate and re-validate extended area model:
• The 2016 traffic survey data including intersection movement counts, midblock traffic counts, intersection queue length surveys and origin destination (OD) surveys
• Aerial photography.
1.1.5 Road Network Coding Arcadis utilised aerial photo images to code the road network for the existing one lane roundabout condition. The aerial photography provided adequate information for network coding including road length, lane width, number of lanes, lane discipline and intersection configuration. Figure 9 shows the extended area VISSIM model and the travel zone system (travel zones are shows as green boxes).
Figure 9 Extended Area VISSIM Model
The VISSIM model contains ten travel zones within the study area.
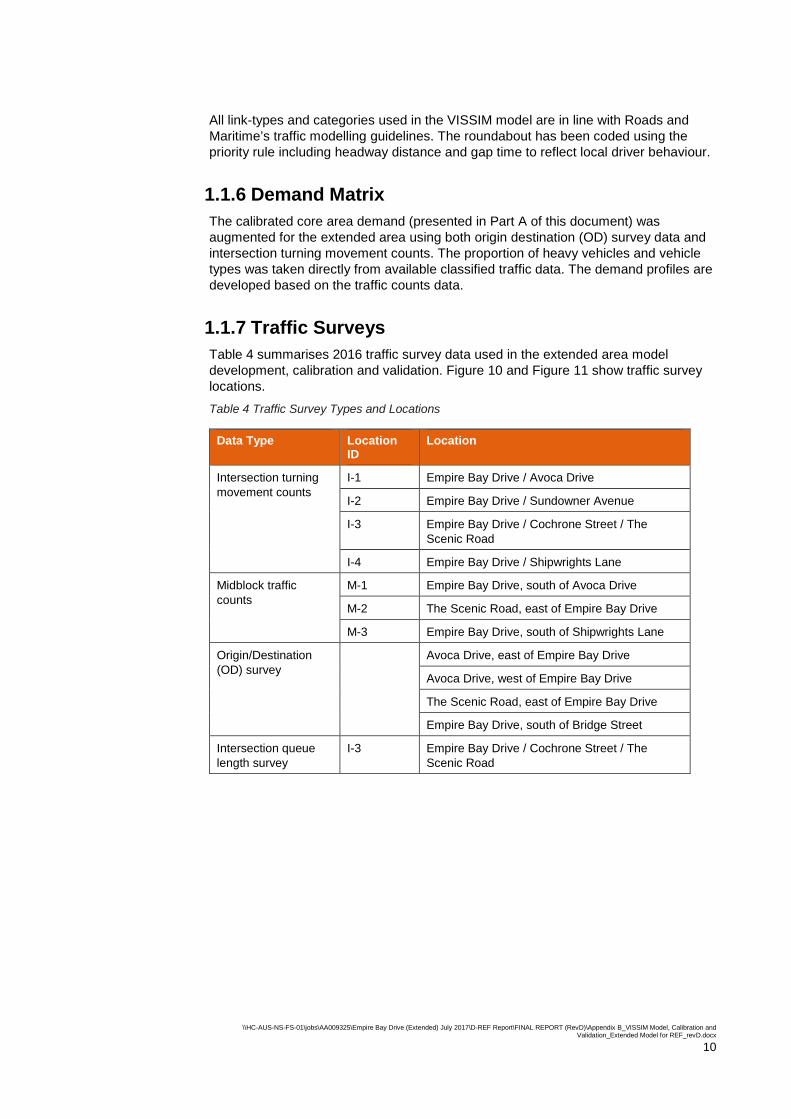
\\HC-AUS-NS-FS-01\jobs\AA009325\Empire Bay Drive (Extended) July 2017\D-REF Report\FINAL REPORT (RevD)\Appendix B_VISSIM Model, Calibration and Validation_Extended Model for REF_revD.docx
10
All link-types and categories used in the VISSIM model are in line with Roads and Maritime’s traffic modelling guidelines. The roundabout has been coded using the priority rule including headway distance and gap time to reflect local driver behaviour.
1.1.6 Demand Matrix The calibrated core area demand (presented in Part A of this document) was augmented for the extended area using both origin destination (OD) survey data and intersection turning movement counts. The proportion of heavy vehicles and vehicle types was taken directly from available classified traffic data. The demand profiles are developed based on the traffic counts data.
1.1.7 Traffic Surveys Table 4 summarises 2016 traffic survey data used in the extended area model development, calibration and validation. Figure 10 and Figure 11 show traffic survey locations. Table 4 Traffic Survey Types and Locations
Data Type Location ID
Location
Intersection turning movement counts
I-1 Empire Bay Drive / Avoca Drive
I-2 Empire Bay Drive / Sundowner Avenue
I-3 Empire Bay Drive / Cochrone Street / The Scenic Road
I-4 Empire Bay Drive / Shipwrights Lane
Midblock traffic counts
M-1 Empire Bay Drive, south of Avoca Drive
M-2 The Scenic Road, east of Empire Bay Drive
M-3 Empire Bay Drive, south of Shipwrights Lane
Origin/Destination (OD) survey
Avoca Drive, east of Empire Bay Drive
Avoca Drive, west of Empire Bay Drive
The Scenic Road, east of Empire Bay Drive
Empire Bay Drive, south of Bridge Street
Intersection queue length survey
I-3 Empire Bay Drive / Cochrone Street / The Scenic Road
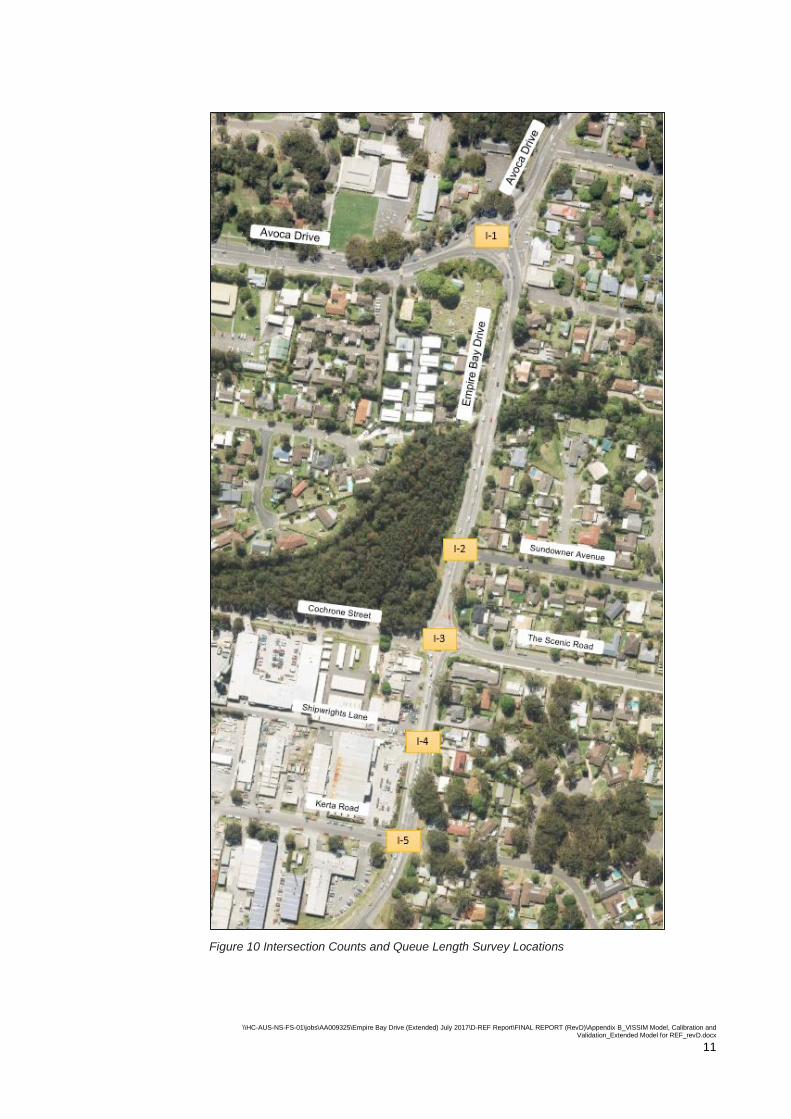
\\HC-AUS-NS-FS-01\jobs\AA009325\Empire Bay Drive (Extended) July 2017\D-REF Report\FINAL REPORT (RevD)\Appendix B_VISSIM Model, Calibration and Validation_Extended Model for REF_revD.docx
11
Figure 10 Intersection Counts and Queue Length Survey Locations

\\HC-AUS-NS-FS-01\jobs\AA009325\Empire Bay Drive (Extended) July 2017\D-REF Report\FINAL REPORT (RevD)\Appendix B_VISSIM Model, Calibration and Validation_Extended Model for REF_revD.docx
12
Figure 11 Midblock Count Locations

\\HC-AUS-NS-FS-01\jobs\AA009325\Empire Bay Drive (Extended) July 2017\D-REF Report\FINAL REPORT (RevD)\Appendix B_VISSIM Model, Calibration and Validation_Extended Model for REF_revD.docx
13
Calibration The following sections outline the calibration and validation criteria used for the extended area model. This is followed by a comparison of the results for the AM and PM peak models with the observed values.
1.1.8 Calibration criteria Model calibration was carried out based on the core area modelling criteria provided by the Roads and Maritime’s Traffic Modelling Guidelines V1.0, February 2013. Table 6 outlines calibration targets used. The R-Squared (R2) statistic is used as a goodness-of-fit measure of the correlation between observed volumes and predicted model volumes. Table 5 Calibration Criteria – Extended Area Model
Calibration Criteria Calibration Targets
Intersection turning movements
• Flows < 99 Within 10 vehicles of observed value
• Flows 100 to 999 Within 10 per cent of observed value
• R2 value including scatter plots > 0.95
Source: Traffic Modelling Guidelines, V1.0, Roads and Maritime, February 2013.

\\HC-AUS-NS-FS-01\jobs\AA009325\Empire Bay Drive (Extended) July 2017\D-REF Report\FINAL REPORT (RevD)\Appendix B_VISSIM Model, Calibration and Validation_Extended Model for REF_revD.docx
14
1.1.9 Re-calibration results for the AM peak Table 7 summarises turn volume calibration results for the AM peak model. Figure 12 shows a scatter plot of modelled and observed hourly flows for the AM peak hour between 8AM and 9AM. Detailed turn count calibration spreadsheet is included in Attachment B.
The calibration results show that a high standard of calibration was achieved for the AM peak model. For the AM peak, 100% of turn flows satisfy the calibration criteria. The result is reinforced with the high R2 value of 0.99 achieved for all hours.
Table 6 Turn Calibration Summary – Extended Area, AM Peak Model
Period Criteria Target Achieved Status
0700-0800
Flows < 99 Within 10 vehicles of observed value
100% Pass
Flows 100 to 999 Within 10 per cent of observed value
100% Pass
R2 value > 0.95 0.99 Pass
0800-0900
Flows < 99 Within 10 vehicles of observed value
100% Pass
Flows 100 to 999 Within 10 per cent of observed value
100% Pass
R2 value > 0.95 0.99 Pass
Figure 12 Scatter Plot Modelled vs Observed Turn Flows – Extended Area, AM Peak Hour (8AM to 9AM) The results from above assessment confirmed that the AM Peak model satisfied the calibration criteria.

\\HC-AUS-NS-FS-01\jobs\AA009325\Empire Bay Drive (Extended) July 2017\D-REF Report\FINAL REPORT (RevD)\Appendix B_VISSIM Model, Calibration and Validation_Extended Model for REF_revD.docx
15
1.1.10 Re-calibration results for the PM peak Table 8 summarises turn volume calibration results for the PM peak model. shows a scatter plot of modelled and observed hourly flows for PM peak hour between 3PM and 4PM. A detailed turn count calibration spreadsheet for the morning peak period is included in Attachment B.
The calibration results show that a high standard of calibration was achieved for the afternoon peak model. For the PM peak, 100% of turn flows satisfy the calibration criteria. The result is reinforced with the high R2 value of 1.00 achieved for all hours. Table 7 Turn Calibration Summary – Extended Area, PM Peak Model
Period Criteria Target Achieved Status
1500-1600
Flows < 99 Within 10 vehicles of observed value 100% Pass
Flows 100 to 999 Within 10 per cent of observed value 100% Pass
R2 value > 0.95 0.99 Pass
1600-1700
Flows < 99 Within 10 vehicles of observed value
100% Pass
Flows 100 to 999 Within 10 per cent of observed value
100% Pass
R2 value > 0.95 0.99 Pass
Figure 13 Scatter Plot Modelled vs Observed Turn Flows – Extended Area, PM Peak Hour (3PM to 4PM)
The results from above assessment confirmed that the afternoon peak model satisfied the calibration criteria.
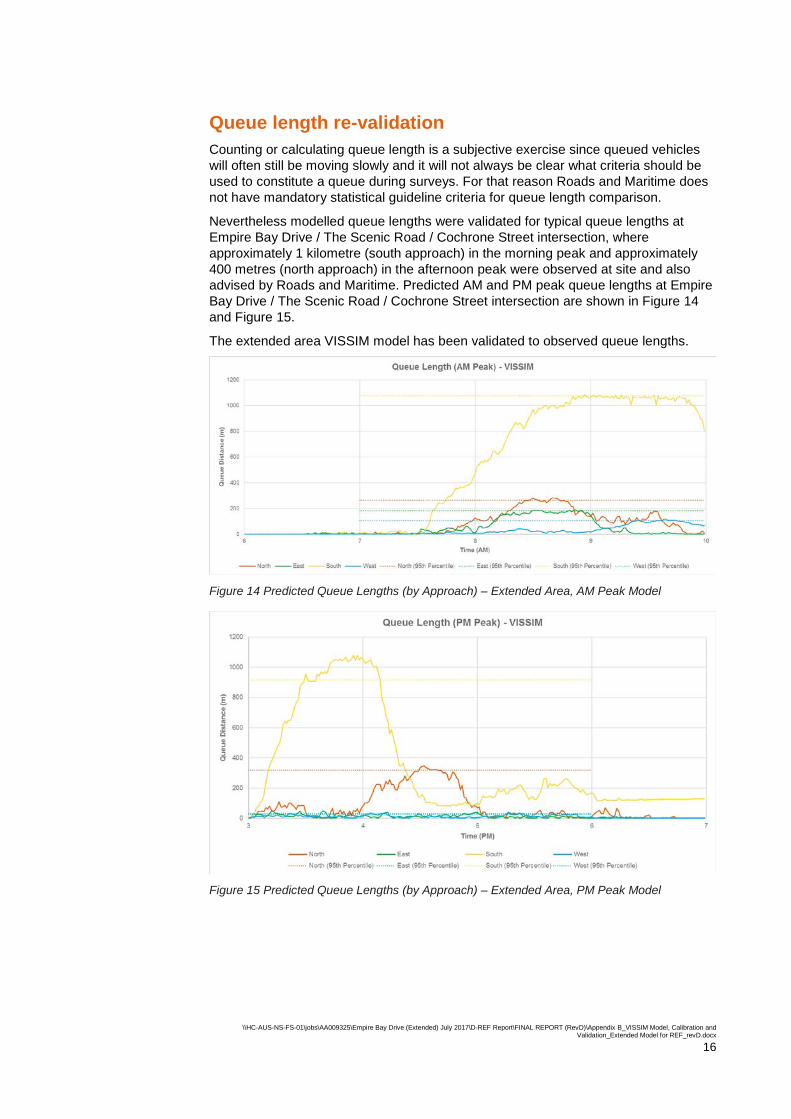
\\HC-AUS-NS-FS-01\jobs\AA009325\Empire Bay Drive (Extended) July 2017\D-REF Report\FINAL REPORT (RevD)\Appendix B_VISSIM Model, Calibration and Validation_Extended Model for REF_revD.docx
16
Queue length re-validation Counting or calculating queue length is a subjective exercise since queued vehicles will often still be moving slowly and it will not always be clear what criteria should be used to constitute a queue during surveys. For that reason Roads and Maritime does not have mandatory statistical guideline criteria for queue length comparison.
Nevertheless modelled queue lengths were validated for typical queue lengths at Empire Bay Drive / The Scenic Road / Cochrone Street intersection, where approximately 1 kilometre (south approach) in the morning peak and approximately 400 metres (north approach) in the afternoon peak were observed at site and also advised by Roads and Maritime. Predicted AM and PM peak queue lengths at Empire Bay Drive / The Scenic Road / Cochrone Street intersection are shown in Figure 14 and Figure 15.
The extended area VISSIM model has been validated to observed queue lengths.
Figure 14 Predicted Queue Lengths (by Approach) – Extended Area, AM Peak Model
Figure 15 Predicted Queue Lengths (by Approach) – Extended Area, PM Peak Model

\\HC-AUS-NS-FS-01\jobs\AA009325\Empire Bay Drive (Extended) July 2017\D-REF Report\FINAL REPORT (RevD)\Appendix B_VISSIM Model, Calibration and Validation_Extended Model for REF_revD.docx
17
2 KEY FINDINGS The AM and PM peak extended area VISSIM models were re-calibrated and re-validated in accordance with Roads and Maritime’s Traffic Modelling Guidelines. The re-calibration and re-validation results for 2016 traffic conditions demonstrate that the updated model meets the desired calibration and validation standards.
The modelling results confirms that both AM and PM peak extended area VISSIM models were adequately calibrated and validated for existing traffic conditions.

\\HC-AUS-NS-FS-01\jobs\AA009325\Empire Bay Drive (Extended) July 2017\D-REF Report\FINAL REPORT (RevD)\Appendix B_VISSIM Model, Calibration and Validation_Extended Model for REF_revD.docx
18
Attachment A – Core Area Calibration Result Table A-1 Detailed AM Peak Calibration Result
Note: Surveys represent March 2016 traffic counts.
%DiffFrom To
Empire Bay Dr U-turn 3U 13 4 8 8 0 0%Right 1 13 8 50 50 0 0%Through 2 13 6 484 471 -13 3%Left 3 13 2 66 65 -1 2%
The Scenic Rd U-turn 6U 1 2 0 0 0 0%Right 4 1 4 233 229 -4 2%Through 5 1 8 40 39 -1 3%Left 6 1 6 27 26 -1 4%
Empire Bay Dr U-turn 9U 14 6 4 4 0 0%Right 7 14 2 33 32 -1 3%Through 8 14 4 354 342 -12 3%Left 9 14 8 7 7 0 0%
Cochrone St U-turn 12U 7 8 0 0 0 0%Right 10 7 6 16 14 -2 13%Through 11 7 2 19 17 -2 11%Left 12 7 4 33 33 0 0%
1,374 1337 -37 -3% Empire Bay Dr U-turn 3U 13 4 12 11 -1 8%
Right 1 13 8 65 62 -3 5%Through 2 13 6 580 582 2 0%Left 3 13 2 105 105 0 0%
The Scenic Rd U-turn 6U 1 2 0 0 0 0%Right 4 1 4 374 357 -17 5%Through 5 1 8 42 42 0 0%Left 6 1 6 33 32 -1 3%
Empire Bay Dr U-turn 9U 14 6 4 4 0 0%Right 7 14 2 67 59 -8 12%Through 8 14 4 622 582 -40 6%Left 9 14 8 6 6 0 0%
Cochrone St U-turn 12U 7 8 0 0 0 0%Right 10 7 6 32 34 2 6%Through 11 7 2 23 22 -1 4%Left 12 7 4 53 50 -3 6%
2,018 1948 -70 -3% Empire Bay Dr U-turn 3U 13 4 7 7 0 0%
Right 1 13 8 61 59 -2 3%Through 2 13 6 712 669 -43 6%Left 3 13 2 104 95 -9 9%
The Scenic Rd U-turn 6U 1 2 0 0 0 0%Right 4 1 4 458 457 -1 0%Through 5 1 8 38 37 -1 3%Left 6 1 6 42 39 -3 7%
Empire Bay Dr U-turn 9U 14 6 1 1 0 0%Right 7 14 2 101 92 -9 9%Through 8 14 4 588 562 -26 4%Left 9 14 8 6 5 -1 17%
Cochrone St U-turn 12U 7 8 0 0 0 0%Right 10 7 6 18 18 0 0%Through 11 7 2 65 67 2 3%Left 12 7 4 51 53 2 4%
2,252 2161 -91 -4% Empire Bay Dr U-turn 3U 13 4 10 11 1 10%
Right 1 13 8 47 50 3 6%Through 2 13 6 621 642 21 3%Left 3 13 2 101 107 6 6%
The Scenic Rd U-turn 6U 1 2 0 0 0 0%Right 4 1 4 356 369 13 4%Through 5 1 8 28 29 1 4%Left 6 1 6 36 39 3 8%
Empire Bay Dr U-turn 9U 14 6 2 2 0 0%Right 7 14 2 97 98 1 1%Through 8 14 4 622 619 -3 0%Left 9 14 8 3 4 1 33%
Cochrone St U-turn 12U 7 8 0 0 0 0%Right 10 7 6 12 12 0 0%Through 11 7 2 103 94 -9 9%Left 12 7 4 38 35 -3 8%
2,076 2111 35 2%
West:
South: 0.999
East:
0900-1000
North:
West:
South: 0.999
East:
0800-0900
North:
West:
South: 0.998
East:
0700-0800
North:
West:
South: 1.000
East:
R 2̂ value
0600-0700
North:
Survey Modelled DifferenceLinkTime Direction Road Name Movement Mov

\\HC-AUS-NS-FS-01\jobs\AA009325\Empire Bay Drive (Extended) July 2017\D-REF Report\FINAL REPORT (RevD)\Appendix B_VISSIM Model, Calibration and Validation_Extended Model for REF_revD.docx
19
Table A-2 Detailed PM Peak Calibration Result
Note: Surveys represent March 2016 traffic counts.
%DiffFrom To
Empire Bay Dr U-turn 3U 13 4 11 11 0 0%Right 1 13 8 88 85 -3 3%Through 2 13 6 659 638 -21 3%Left 3 13 2 269 262 -7 3%
The Scenic Rd U-turn 6U 1 2 1 1 0 0%Right 4 1 4 278 276 -2 1%Through 5 1 8 29 29 0 0%Left 6 1 6 107 105 -2 2%
Empire Bay Dr U-turn 9U 14 6 5 4 -1 20%Right 7 14 2 139 128 -11 8%Through 8 14 4 706 656 -50 7%Left 9 14 8 7 8 1 14%
Cochrone St U-turn 12U 7 8 0 0 0 0%Right 10 7 6 26 27 1 4%Through 11 7 2 31 31 0 0%Left 12 7 4 79 79 0 0%
2,435 2340 -95 -4% Empire Bay Dr U-turn 3U 13 4 18 15 -3 17%
Right 1 13 8 113 105 -8 7%Through 2 13 6 682 614 -68 10%Left 3 13 2 304 277 -27 9%
The Scenic Rd U-turn 6U 1 2 0 0 0 0%Right 4 1 4 178 179 1 1%Through 5 1 8 43 43 0 0%Left 6 1 6 122 123 1 1%
Empire Bay Dr U-turn 9U 14 6 5 5 0 0%Right 7 14 2 133 143 10 8%Through 8 14 4 627 677 50 8%Left 9 14 8 9 9 0 0%
Cochrone St U-turn 12U 7 8 0 0 0 0%Right 10 7 6 38 37 -1 3%Through 11 7 2 34 34 0 0%Left 12 7 4 107 107 0 0%
2,413 2368 -45 -2% Empire Bay Dr U-turn 3U 13 4 10 12 2 20%
Right 1 13 8 84 81 -3 4%Through 2 13 6 614 621 7 1%Left 3 13 2 312 302 -10 3%
The Scenic Rd U-turn 6U 1 2 0 0 0 0%Right 4 1 4 205 205 0 0%Through 5 1 8 20 21 1 5%Left 6 1 6 83 83 0 0%
Empire Bay Dr U-turn 9U 14 6 3 3 0 0%Right 7 14 2 163 159 -4 2%Through 8 14 4 718 686 -32 4%Left 9 14 8 2 2 0 0%
Cochrone St U-turn 12U 7 8 1 1 0 0%Right 10 7 6 32 31 -1 3%Through 11 7 2 30 30 0 0%Left 12 7 4 97 97 0 0%
2,374 2334 -40 -2% Empire Bay Dr U-turn 3U 13 4 15 16 1 7%
Right 1 13 8 53 67 14 26%Through 2 13 6 543 631 88 16%Left 3 13 2 268 317 49 18%
The Scenic Rd U-turn 6U 1 2 0 0 0 0%Right 4 1 4 141 142 1 1%Through 5 1 8 18 18 0 0%Left 6 1 6 55 56 1 2%
Empire Bay Dr U-turn 9U 14 6 1 1 0 0%Right 7 14 2 140 148 8 6%Through 8 14 4 490 532 42 9%Left 9 14 8 4 4 0 0%
Cochrone St U-turn 12U 7 8 0 0 0 0%Right 10 7 6 17 17 0 0%Through 11 7 2 20 20 0 0%Left 12 7 4 62 63 1 2%
1,827 2032 205 11%
West:
South: 0.997
East:
1800-1900
North:
West:
South: 0.999
East:
1700-1800
North:
West:
South: 0.989
East:
1600-1700
North:
West:
South: 0.999
East:
R 2̂ value
1500-1600
North:
Survey Modelled DifferenceLinkTime Direction Road Name Movement Mov

\\HC-AUS-NS-FS-01\jobs\AA009325\Empire Bay Drive (Extended) July 2017\D-REF Report\FINAL REPORT (RevD)\Appendix B_VISSIM Model, Calibration and Validation_Extended Model for REF_revD.docx
20
Attachment B – Extended Area Model Re-calibration Result Table B-1 Detailed AM Peak Calibration Result – Extended Area Model
ID Intersection Approach Survey* Modelled Difference % Diff R2 value
I-1 Empire Bay Drive / Avoca Drive
East – U 0 0 0 0%
0.994
East – T 675 666 -9 1% East – L 321 307 -14 4% South – U 0 0 0 0% South – R 273 300 27 10% South – L 832 749 -83 10% West – U 0 0 0 0% West – R 545 529 -16 3% West – T 415 391 -24 6%
3,061 2,942 -119 4%
I-2 Empire Bay Drive / Sundowner Avenue
North – T 859 829 -30 3%
0.999
North – L 7 4 -3 43% East – R 2 0 -2 100% East – L 25 25 0 0% South – R 1 0 -1 100% South – T 1,103 1082 -21 2%
1,997 1,940 -57 3%
I-3
Empire Bay Drive / The Scenic Road / Cochrone Street
North – U 7 0 -7 100%
0.996
North – R 61 59 -2 3% North – T 712 697 -15 2% North – L 104 98 -6 6% East – U 0 0 0 0% East – R 458 491 33 7% East – T 38 36 -2 5% East – L 42 36 -6 14% South – U 1 5 4 400% South – R 101 94 -7 7% South – T 588 539 -49 8% South – L 6 6 0 0% West – U 0 0 0 0% West – R 18 17 -1 6% West – T 65 65 0 0% West – L 51 53 2 4%
2,252 2,196 -56 2%
I-4 Empire Bay Drive / Shipwrights Lane
North – R 1 0 -1 100%
0.999
North – T 772 755 -17 2% South – T 690 641 -49 7% South – L 1 0 -1 100% West – R 0 0 0 0% West – L 6 4 -2 33%
1,470 1,400 -70 5% Note: Surveys represent AM peak one hour between 8AM and 9AM.

\\HC-AUS-NS-FS-01\jobs\AA009325\Empire Bay Drive (Extended) July 2017\D-REF Report\FINAL REPORT (RevD)\Appendix B_VISSIM Model, Calibration and Validation_Extended Model for REF_revD.docx
21
Table B-2 Detailed PM Peak Calibration Result – Extended Area Model
ID Intersection Approach Survey* Modelled Difference % Diff R2 value
I-1 Empire Bay Drive / Avoca Drive
East – U 0 0 0 0%
0.998
East – T 375 375 0 0% East – L 279 287 8 3% South – U 0 0 0 0% South – R 365 332 -33 9% South – L 706 710 4 1% West – U 0 0 0 0% West – R 752 762 10 1% West – T 658 655 -3 0%
3,135 3,121 -14 0%
I-2 Empire Bay Drive / Sundowner Avenue
North – T 1,014 1028 14 1%
1.00
North – L 17 18 1 6% East – R 0 0 0 0% East – L 13 13 0 0% South – R 3 3 0 0% South – T 1,071 1055 -16 1%
2,118 2,117 -1 0%
I-3
Empire Bay Drive / The Scenic Road / Cochrone Street
North – U 11 9 -2 18%
0.999
North – R 88 86 -2 2% North – T 659 660 1 0% North – L 269 279 10 4% East – U 0 0 0 0% East – R 278 270 -8 3% East – T 29 30 1 3% East – L 107 102 -5 5% South – U 5 0 -5 100% South – R 139 136 -3 2% South – T 706 703 -3 0% South – L 7 7 0 0% West – U 0 0 0 0% West – R 26 26 0 0% West – T 31 31 0 0% West – L 79 77 -2 3%
2,434 2,416 -18 1%
I-4 Empire Bay Drive / Shipwrights Lane
North – R 5 4 -1 20%
1.00
North – T 792 782 -10 1% South – T 847 846 -1 0% South – L 0 0 0 0% West – R 1 0 -1 100% West – L 10 9 -1 10%
1,655 1,641 -14 1% Note: Surveys represent AM peak one hour between 3PM and 4PM.