
Trade Policy and Transport Costs in Uganda
39
________________________________________________________________________ CREDIT Research Paper No. 06/09 ________________________________________________________________________ Trade Policy and Transport Costs in Uganda by Nichodemus Rudaheranwa Abstract Recent studies on trade policy for low-income countries have established that high transport costs associated with poor quality infrastructure in countries such as Uganda represent a barrier to trade and an additional source of protection to domestic producers of import competing goods. This study updates and extends the analysis of Milner et al (2000) for Uganda in the 1994 to compare with the situation in the early 2000s. The results show that trade policy barriers have been further reduced and, in general, transport costs have fallen, although not dramatically. Transport costs remain a significant trade barrier, equivalent to effective protection of over 20% and an implicit tax on exports of over 25% (and up to 50% on air freight). Simulation of the protection effects under the new EAC Customs Union shows that overall the level of tariff protection will increase but any adverse impacts could be offset by greater efficiency at Customs and ports and additional investment to reduce infrastructure- related transport costs. _____________________________________________________________________ Centre for Research in Economic Development and International Trade, University of Nottingham. Research Papers at www.nottingham.ac.uk/economics/credit/
Transcript of Trade Policy and Transport Costs in Uganda

________________________________________________________________________CREDIT Research Paper
No. 06/09________________________________________________________________________
Trade Policy and Transport Costs inUganda
by
Nichodemus Rudaheranwa
Abstract
Recent studies on trade policy for low-income countries have established that hightransport costs associated with poor quality infrastructure in countries such as Ugandarepresent a barrier to trade and an additional source of protection to domesticproducers of import competing goods. This study updates and extends the analysis ofMilner et al (2000) for Uganda in the 1994 to compare with the situation in the early2000s. The results show that trade policy barriers have been further reduced and, ingeneral, transport costs have fallen, although not dramatically. Transport costs remaina significant trade barrier, equivalent to effective protection of over 20% and animplicit tax on exports of over 25% (and up to 50% on air freight). Simulation of theprotection effects under the new EAC Customs Union shows that overall the level oftariff protection will increase but any adverse impacts could be offset by greaterefficiency at Customs and ports and additional investment to reduce infrastructure-related transport costs.
_____________________________________________________________________
Centre for Research in Economic Development and International Trade,University of Nottingham.Research Papers at www.nottingham.ac.uk/economics/credit/

2
_____________________________________________________________________CREDIT Research Paper
No. 06/09
Trade Policy and Transport Costs inUganda
by
Nichodemus Rudaheranwa
JEL Classification: F14, O10, O55
Keywords: Effective Protection, Transport Costs, Trade, Uganda
Outline1. Introduction2. Trade Policy and Performance since the 1990s3. Analytical Approach4. Estimates and Results5. Conclusions and Policy Implications
The AuthorsDr Rudaheranwa is a Research Fellow at the Economic Policy Research Centre (EPRC),Makerere University, Kampala, Uganda.
AcknowledgementsAn earlier version, ‘Tariff and overland transport barriers to Uganda’s Trade’, was prepared as an EPRCDraft Report (September 2004) for the CREDIT project on ‘Trade and Transport Costs’ as one of 23projects funded by EC-PREP, a programme of research sponsored by the UK Department for InternationalDevelopment. All EC-PREP research studies relate to one or more of the six focal areas of EC’sdevelopment policy in the context of their link to poverty eradication. EC-PREP produces findings andpolicy recommendations which aim to contribute to improving the effectiveness of the EC’s developmentassistance. For more information about EC-PREP and any of the other research studies produced under theprogramme, please visit the website www.ec-prep.org.
1
1. INTRODUCTION
Despite significant rates of economic growth over the past decade, Uganda remains an
economy heavily dependent on the agriculture sector, in terms of supplying inputs in the
industrial sector (most manufacturing activities in the country are agro-processing),
employment (over 80%) and export earnings (over 90%). The contribution of the
agricultural sector to GDP declined from about 54% in 1987 to just below 40% in 2004 (The
Republic of Uganda, 1997; and Table 1) but it remains the major productive sector.
Although gold exports have been significant in recent years, agriculture (including fishing)
provides most of Uganda’s exports and, as Milner et al (2000) showed, faced high effective
taxation due to excess transport costs in 1994. This paper analyses trends in trade policy and
transport costs since 1994 to assess the implications for Uganda, in particular agricultural
exports.
Table 1: Sector distribution of the Uganda’s GDP in recent years (%)
Sector 1999/00 2001/02 2003/04Agriculture 40.1 39.7 38.5Industry 18.6 19 19.5Services 40.5 41.2 42
Source: The Republic of Uganda (2004)
The trade-policy reforms initiated in Uganda since the mid-90s consolidated the removal of
controls in financial and commodity markets, reductions in protection for import-competing
firms and simplification of the tariff structure began in the late 1980s. The five tariff bands
in 1993 (0%, 10%, 20%, 30% and 60%), with more than 95 percent of tariff lines between
10 and 30 percent and a simple average tariff rate of 17%, were reduced to three (zero, 7%
and 15%) in 2001 (WTO, 1995 and 2002).1 Uganda grants preferential treatment in form of
duty reductions to COMESA member states on a reciprocal basis and subject to certificates
of origin. According to the WTO (2002), capital goods and raw materials enter duty free,
intermediate goods from COMSA and non-COMESA member countries are subject to tariff
rates of 4% and 7% respectively while finished goods from COMESA Member States attract
1 About 16.4% of all tariff lines were duty free by 2001 while 39.3% carry the maximum rate of 15%. A fewexceptions include cigarettes at 130% and alcoholic beverages at 70%.
2
a tariff rate of 6% only. Quantitative restrictions (e.g. import licensing requirements, quotas,
bans, etc.) have been eliminated or converted into tariff equivalents. A number of state-
owned enterprises (SOE) either have been (or are in process of) being privatised or
liberalized. Specifically, the monopoly of a number of marketing boards in the procurement,
distribution and marketing of agricultural produce has been eliminated.
Policy-induced barriers to trade (e.g. tariffs, control of commodity and foreign exchange
markets, quantitative trade restrictions, etc.) have been substantially reduced. Other barriers
to trade tend to arise from poorly functioning trade-promoting institutions (Rudaheranwa et
al., 2003), inadequate, inefficient and costly infrastructure systems or natural barriers (Milner
et al., 2000; Rudaheranwa, 1999). The current analysis looks at the relative effects of trade
policy reforms (reduction in tariffs) and non-policy barriers (changes in transport costs) on
Uganda comparing 1994 and 2003. The rest of the paper is organized as follows. Section 2
gives an overview of Uganda’s trade structure over the last decade. Section 3 presents the
analytical framework while Section 4 discusses effective rate of protection (ERP) estimates
relating to tariffs and transport costs respectively, including coverage of transport costs as an
effective tax on exports. Section 5 considers some policy implications.
2. TRADE POLICY AND PERFORMANCE SINCE THE 1990s
Trade policy reforms initiated in Uganda over the last decade were designed to reduce the
anti-export bias associated with protection policies, induce resource allocation into the
export sector and improve trade performance. Export earnings have increased, for example
from about US$ 258 million in 1981 to a peak of about US$ 710 million in 1996 and about
US$ 508 million in 2003 (The Republic of Uganda, 1997 and 2004). The commodity
composition of the country’s exports has also changed significantly. The contribution of
traditional exports (mainly coffee, cotton, tea and tobacco) fell from just less than 86 percent
in 1992 to about 53% and 38% in 2000 and 2003 respectively (Figure 1 below; The Republic
of Uganda, 1996 and 2004).
The drastic decline in the share of traditional exports is mainly due to the shrinking
contribution from coffee exports, from about 80 percent in 1992 to about 55% and 21% in

3
1998 and 2003 respectively due to deteriorating terms of trade.2 Coffee export prices fell by
almost 70 percent in dollar terms between 1998/99 and 2001/02 alone leading to a US$ 222
million decline in coffee export earnings (The Republic of Uganda, 2003a). It is worth noting
that though coffee prices began to pick up slightly in the first half of the financial year
2002/2003 (about 0.59 US$/kg), they are still much lower than they were in 1994/95 (about
US$ 2.48/kg). In addition, prices for each of the other three traditional exports (cotton, tea
and tobacco) also fell between 1998/99 and 2002/03 although less markedly than coffee
prices.
Non-traditional exports increased both in volume and value due to the export-diversification
policy drive initiated in the country during the early 1990s. The share of non-traditional
exports rose from about 14 percent (about US$ 25 million) in 1990 to about 47% and 62%
(about US$ 278 million) in 2000 and 2001 respectively (The Republic of Uganda, 1996 &
2002a; Figure 1 below).
Figure1: Composition of Ugandan Exports 1990-2001 (%)
0.0
20.0
40.0
60.0
80.0
100.0
1990 1991 1992 1993 1994 1995 1996 1997 1998 1999 2000 2001
Shar
e (%
)
Traditional exports Non-traditional exports
Significant developments were in exports of fish and fish products from US$ 10.4 million in
1994 to just less than US$ 88 million in 2002, and flowers from about US$ 0.3 million in
1995 to about US$ 17.8 million in 2002 (Table A1 in the Appendix). Other non-traditional
export sectors that experienced performance improvements include: gold and gold
compounds from US$ 9.6 million in 1991 to over US$ 60 million in 2002; maize from US$
2 According to The Republic of Uganda (2004), the share of coffee export earnings were projected to declinefurther to 17.1% of export of goods in 2003/2004.

4
4.2 million to US$ 10.6 million and cattle hides from US$ 4.1 million to US$ 9.8 million
between 1990 and 2002. Generally, non-coffee exports currently account for over 82% of
total exports. Fish and fish products (the largest non-coffee exports) account for 16% of
total export earnings and are estimated to increase by about 18% in 2003/04 mainly due to
more investment in processing facilities and export opportunities (The Republic of Uganda,
2004). Similarly, flower export earnings are projected to increase in 2003/04 as result of
increase in farm size, construction of more greenhouses and declining freight charges, which
have encouraged exports.
The trade deficit has continued to rise mainly because imports (financed by aid inflows) have
increased faster than export earnings (Figure 2). The persistent higher import trend may be
attributed to a number of factors. First, recent rapid growth in construction activities in the
country has involved a higher import growth of construction materials particularly cement,
lime, clay tiles and glass. A second source of import growth has been imports of transport
and telecommunication equipment particularly vehicles and mobile phones given the
country’s growing demand for transport and telecommunication services3. Third, Uganda’s
industries have a high content of imported inputs into their production structure4. Finally,
the import growth could be attributed both to a liberal import trade regime that increased
low-priced and high-quality imports and to the consumption habits in the country with the
general perception that imported products are of better quality. The trade deficit increased
from US$ 641 million in 2002/03 to US$ 712 million in 2003/04 even when exports of
goods grew by 24% while imports rose by 17% over the financial year because imports were
increasing from a higher base than that of exports.
Ugandan trade structure has not changed much in terms of market destination of exports
and import sources (Tables 2 and 3 below). Much of the Ugandan export trade is destined
for Europe with a share of about 73% and 45% of Uganda exports in 1995 and 2001
respectively. However, the share of Ugandan exports (in terms of value) destined to Europe
has persistently declined since 1995 probably largely due to falling coffee prices. It is clear
3 Information from Uganda Communication Council shows that phone subscription has increased from 24,051to 54,000 fixed lines between 1993 and 2002 while the number of mobile phone subscribers increased from3000 lines only in 1996 to 393,310 by July 2002 and the number of private FM radio stations increased from 14in December 1996 to over 130 by July 2002. The importation of motor vehicles has experienced similar trends.

5
that the European Union is traditionally a major trading partner both for Ugandan exports
and imports. Table 2 suggests that the share of Ugandan exports destined to the European
Union has fluctuated between 25% and 59% since 1995. The share of Ugandan exports to
COMESA is low and has not increased significantly since 1995 although that to the rest of
Africa has slightly improved albeit from a very low level. The country’s exports destined for
Asia has more than tripled since 1995 from 2.4 percent to about 13.7 percent in 2001.
Figure 2: Ugandan External Trade (US$ Million and in current values)
-1000
-500
0
500
1000
1500
1994 1995 1996 1997 1998 1999 2000 2001 2002 2003
Year
Valu
e
Exports Imports Trade Balance
Source: The Republic of Uganda (2002b)
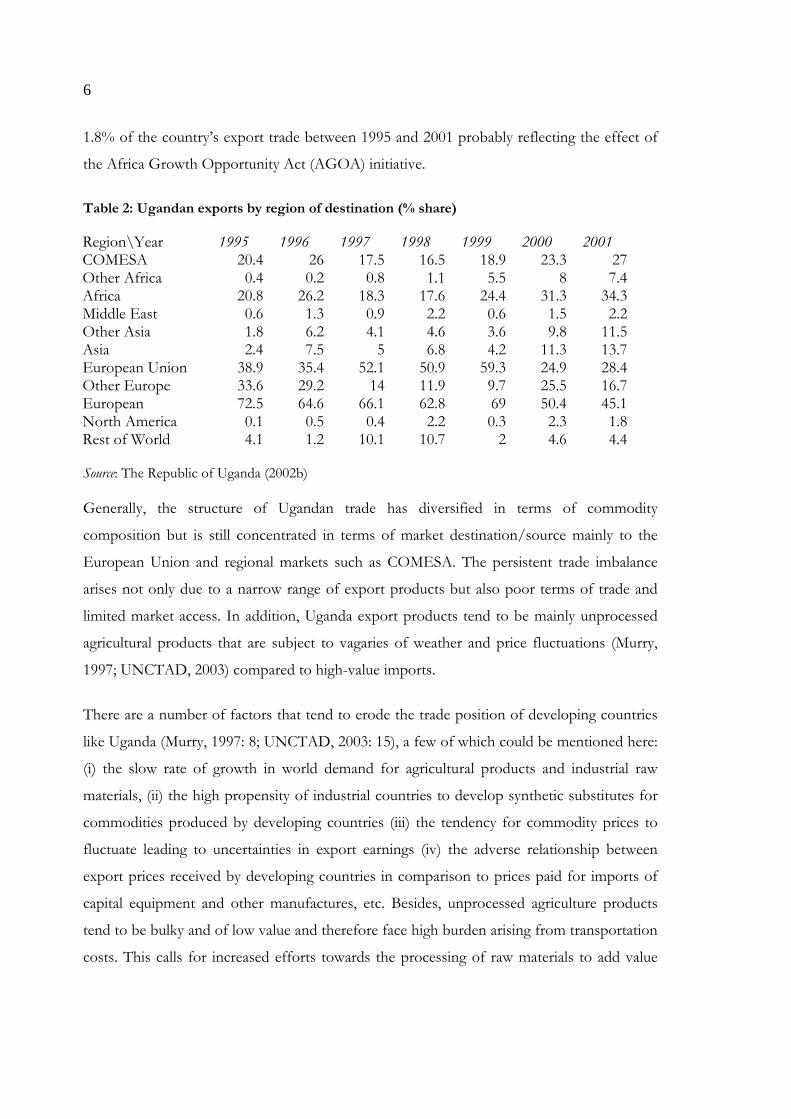
Ugandan import trade by source is dominated by imports from the African continent
particularly from COMESA whose share has remained above 22% of imports throughout
the 1990s. The share of import trade from the rest of Africa other than COMESA, though
low, has improved from 2.2 percent in 1995 to about 8.2 in 2001. The share of imports from
Europe has tended to decline in recent years (see Table 3), however that from Asia has
stabilized around 30 percent. There is little trade (whether import and export) between
Uganda and America although the exports to North America have increased from 0.1% to
4 Hence the critical importance of freight costs as discussed later.
6
1.8% of the country’s export trade between 1995 and 2001 probably reflecting the effect of
the Africa Growth Opportunity Act (AGOA) initiative.
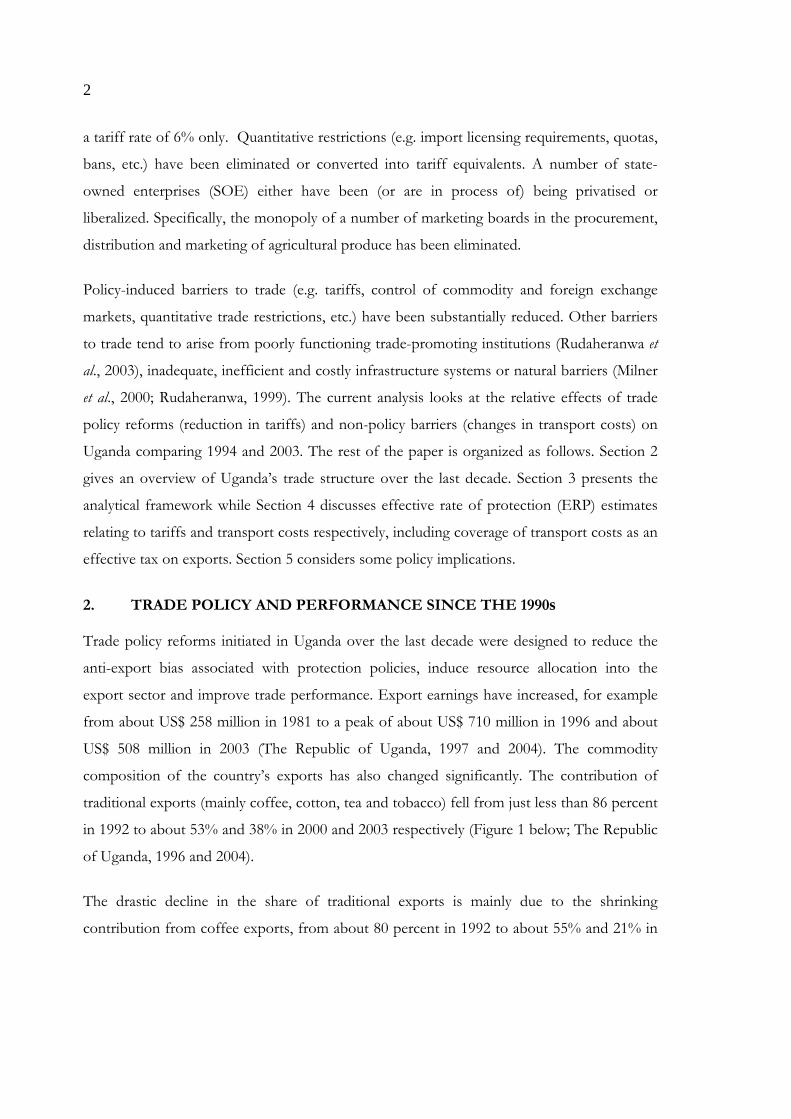
Table 2: Ugandan exports by region of destination (% share)
Region\Year 1995 1996 1997 1998 1999 2000 2001COMESA 20.4 26 17.5 16.5 18.9 23.3 27Other Africa 0.4 0.2 0.8 1.1 5.5 8 7.4Africa 20.8 26.2 18.3 17.6 24.4 31.3 34.3Middle East 0.6 1.3 0.9 2.2 0.6 1.5 2.2Other Asia 1.8 6.2 4.1 4.6 3.6 9.8 11.5Asia 2.4 7.5 5 6.8 4.2 11.3 13.7European Union 38.9 35.4 52.1 50.9 59.3 24.9 28.4Other Europe 33.6 29.2 14 11.9 9.7 25.5 16.7European 72.5 64.6 66.1 62.8 69 50.4 45.1North America 0.1 0.5 0.4 2.2 0.3 2.3 1.8Rest of World 4.1 1.2 10.1 10.7 2 4.6 4.4
Source: The Republic of Uganda (2002b)
Generally, the structure of Ugandan trade has diversified in terms of commodity
composition but is still concentrated in terms of market destination/source mainly to the
European Union and regional markets such as COMESA. The persistent trade imbalance
arises not only due to a narrow range of export products but also poor terms of trade and
limited market access. In addition, Uganda export products tend to be mainly unprocessed
agricultural products that are subject to vagaries of weather and price fluctuations (Murry,
1997; UNCTAD, 2003) compared to high-value imports.
There are a number of factors that tend to erode the trade position of developing countries
like Uganda (Murry, 1997: 8; UNCTAD, 2003: 15), a few of which could be mentioned here:
(i) the slow rate of growth in world demand for agricultural products and industrial raw
materials, (ii) the high propensity of industrial countries to develop synthetic substitutes for
commodities produced by developing countries (iii) the tendency for commodity prices to
fluctuate leading to uncertainties in export earnings (iv) the adverse relationship between
export prices received by developing countries in comparison to prices paid for imports of
capital equipment and other manufactures, etc. Besides, unprocessed agriculture products
tend to be bulky and of low value and therefore face high burden arising from transportation
costs. This calls for increased efforts towards the processing of raw materials to add value
7
for the country’s exports to fetch high prices in export markets and withstand high shipping
costs.
Table 3: Ugandan imports by source (% share)
Region\Year 1994 1995 1996 1997 1998 1999 2000 2001COMESA 30.3 22 24.2 29.2 27.5 27.7 32.6 29.4Other Africa 2.2 3.9 3.8 6.7 9.2 6.5 8 8.2Africa 32.5 25.9 27.9 35.9 36.7 34.2 40.6 37.6Other Asia 23 27.7 26.1 23.1 24.4 25.9 23.4 25.8Middle East 5.8 6.4 6.1 6.6 6.1 6.4 6.3 6.9Asia 28.8 34.1 32.2 29.6 30.5 32.4 29.7 32.7European Union 29.1 29.9 31.3 25.5 24.3 22.4 19.4 19.7Other Europe 2.5 2.8 2.8 2.9 2.4 2.8 2.9 3.4European 31.4 32.7 34.2 28.4 26.7 25.2 22.3 23.1North America 6.6 4.5 4.3 5 4.8 5.7 4.7 3.8Rest of World 0.5 2.7 1.4 1.1 1.3 2.5 2.6 2.7
Source: The Republic of Uganda (2002b)
3. ANALYTICAL FRAMEWORK
The impact of tariff reduction due to trade policy reforms in Uganda on various sectors is
assessed in the framework of nominal and effective rates of protection5. Protection provides
a subsidy to producers of import-competing goods and implicitly taxes production for
export. Nominal rates of protection (NRP) measure the impact of trade distortions on the
price of the final output only, whilst effective rates of protection (ERP) measure the impact
of distortions on the value added of a given economic activity. NRP is the percentage
increase in the domestic price of importables resulting from a given trade-distortion on the
assumption that domestically and imported goods are perfect or close substitutes. The
nominal rate of protection is an indicator of the extent to which tariffs and tariff-like
measures raise the domestic price above the c.i.f. (cost, insurance, and freight) import price
or border price.
5 A theoretical framework of effective rate of protection (ERP) is given in Johnson (1969), Balassa (1965),Balassa et al, (1982) and Corden (1966) while its various application is provided in Jansson and Shneerson(1978), Clark (1981), Milner et al (2000); Rudaheranwa (1999 and 2000) among others. The approach of thecurrent analysis follows Milner et al (2000); Rudaheranwa (1999 and 2000) based on the Balassa method.
8
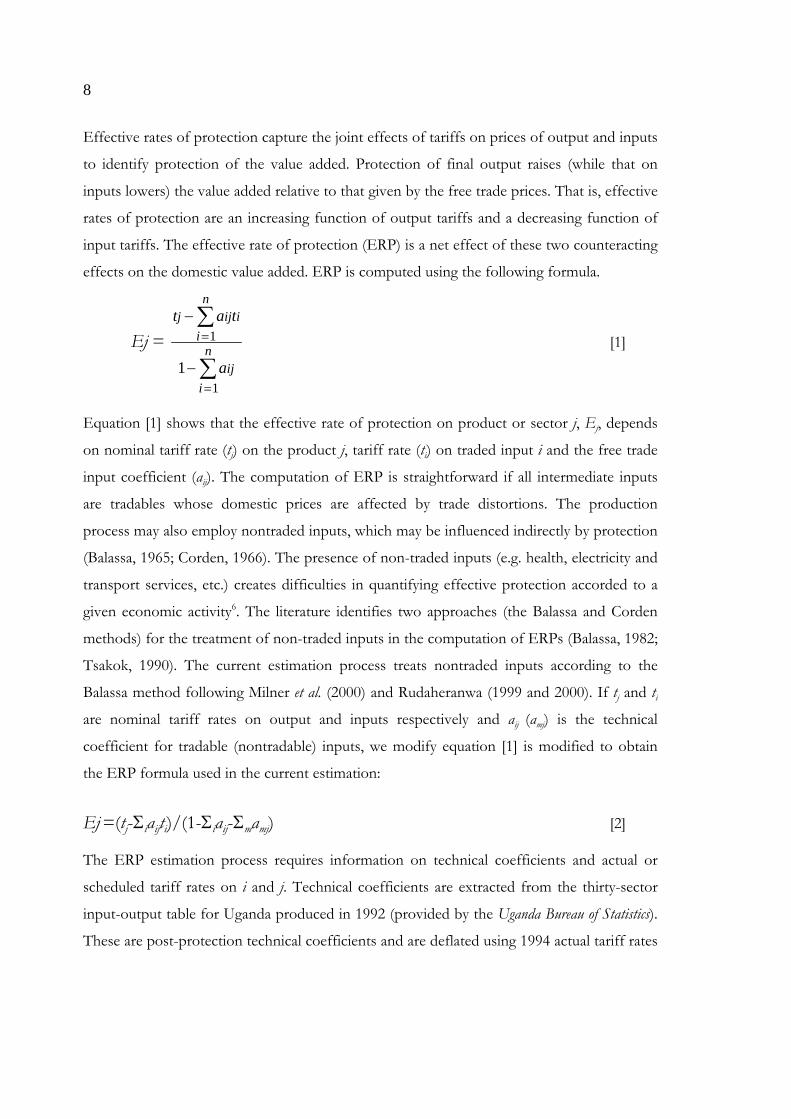
Effective rates of protection capture the joint effects of tariffs on prices of output and inputs
to identify protection of the value added. Protection of final output raises (while that on
inputs lowers) the value added relative to that given by the free trade prices. That is, effective
rates of protection are an increasing function of output tariffs and a decreasing function of
input tariffs. The effective rate of protection (ERP) is a net effect of these two counteracting
effects on the domestic value added. ERP is computed using the following formula.
Ej = t a t
a
j ij ii
n
iji
n
−
−
=
=
∑
∑1
11
[1]
Equation [1] shows that the effective rate of protection on product or sector j, Ej, depends
on nominal tariff rate (tj) on the product j, tariff rate (ti) on traded input i and the free trade
input coefficient (aij). The computation of ERP is straightforward if all intermediate inputs
are tradables whose domestic prices are affected by trade distortions. The production
process may also employ nontraded inputs, which may be influenced indirectly by protection
(Balassa, 1965; Corden, 1966). The presence of non-traded inputs (e.g. health, electricity and
transport services, etc.) creates difficulties in quantifying effective protection accorded to a
given economic activity6. The literature identifies two approaches (the Balassa and Corden
methods) for the treatment of non-traded inputs in the computation of ERPs (Balassa, 1982;
Tsakok, 1990). The current estimation process treats nontraded inputs according to the
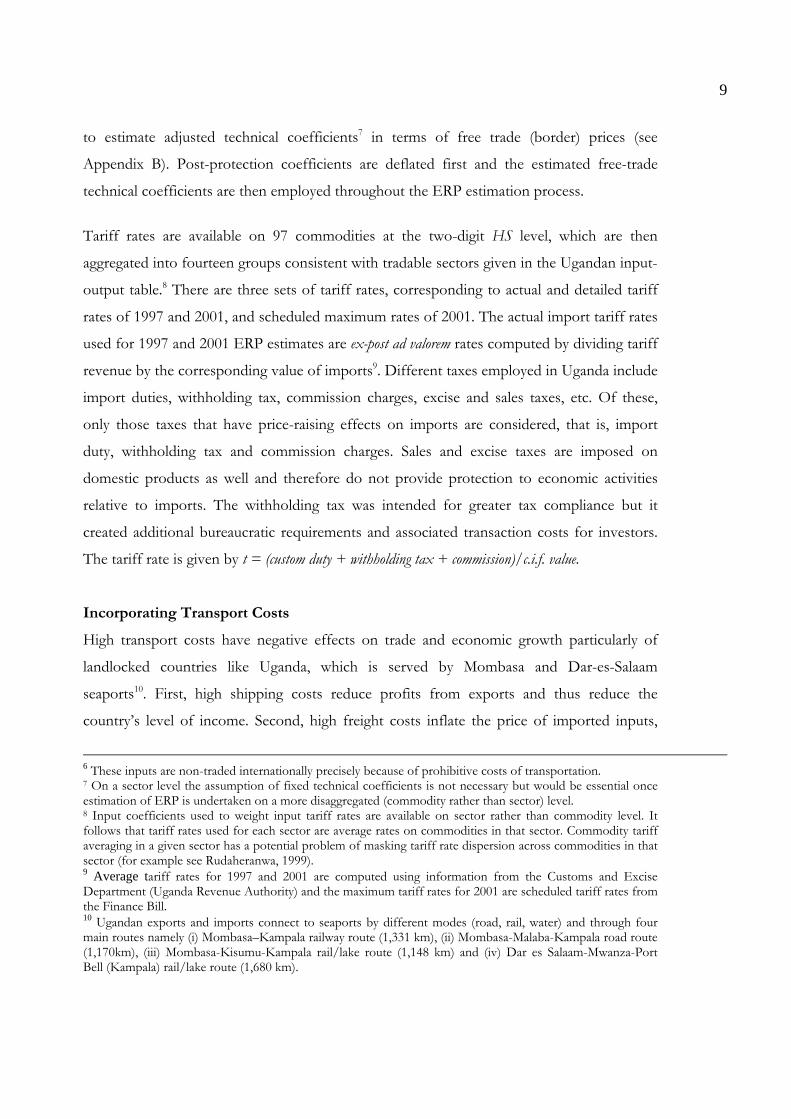
Balassa method following Milner et al. (2000) and Rudaheranwa (1999 and 2000). If tj and ti
are nominal tariff rates on output and inputs respectively and aij (amj) is the technical
coefficient for tradable (nontradable) inputs, we modify equation [1] is modified to obtain
the ERP formula used in the current estimation:
Ej =(tj-Σiaijti)/(1-Σiaij-Σmamj) [2]
The ERP estimation process requires information on technical coefficients and actual or
scheduled tariff rates on i and j. Technical coefficients are extracted from the thirty-sector
input-output table for Uganda produced in 1992 (provided by the Uganda Bureau of Statistics).
These are post-protection technical coefficients and are deflated using 1994 actual tariff rates
9
to estimate adjusted technical coefficients7 in terms of free trade (border) prices (see
Appendix B). Post-protection coefficients are deflated first and the estimated free-trade
technical coefficients are then employed throughout the ERP estimation process.
Tariff rates are available on 97 commodities at the two-digit HS level, which are then
aggregated into fourteen groups consistent with tradable sectors given in the Ugandan input-
output table.8 There are three sets of tariff rates, corresponding to actual and detailed tariff
rates of 1997 and 2001, and scheduled maximum rates of 2001. The actual import tariff rates
used for 1997 and 2001 ERP estimates are ex-post ad valorem rates computed by dividing tariff
revenue by the corresponding value of imports9. Different taxes employed in Uganda include
import duties, withholding tax, commission charges, excise and sales taxes, etc. Of these,
only those taxes that have price-raising effects on imports are considered, that is, import
duty, withholding tax and commission charges. Sales and excise taxes are imposed on
domestic products as well and therefore do not provide protection to economic activities
relative to imports. The withholding tax was intended for greater tax compliance but it
created additional bureaucratic requirements and associated transaction costs for investors.
The tariff rate is given by t = (custom duty + withholding tax + commission)/c.i.f. value.
Incorporating Transport Costs
High transport costs have negative effects on trade and economic growth particularly of
landlocked countries like Uganda, which is served by Mombasa and Dar-es-Salaam
seaports10. First, high shipping costs reduce profits from exports and thus reduce the
country’s level of income. Second, high freight costs inflate the price of imported inputs,
6 These inputs are non-traded internationally precisely because of prohibitive costs of transportation.7 On a sector level the assumption of fixed technical coefficients is not necessary but would be essential onceestimation of ERP is undertaken on a more disaggregated (commodity rather than sector) level.8 Input coefficients used to weight input tariff rates are available on sector rather than commodity level. Itfollows that tariff rates used for each sector are average rates on commodities in that sector. Commodity tariffaveraging in a given sector has a potential problem of masking tariff rate dispersion across commodities in thatsector (for example see Rudaheranwa, 1999).9 Average tariff rates for 1997 and 2001 are computed using information from the Customs and ExciseDepartment (Uganda Revenue Authority) and the maximum tariff rates for 2001 are scheduled tariff rates fromthe Finance Bill.10 Ugandan exports and imports connect to seaports by different modes (road, rail, water) and through fourmain routes namely (i) Mombasa–Kampala railway route (1,331 km), (ii) Mombasa-Malaba-Kampala road route(1,170km), (iii) Mombasa-Kisumu-Kampala rail/lake route (1,148 km) and (iv) Dar es Salaam-Mwanza-PortBell (Kampala) rail/lake route (1,680 km).
10
which is harmful to an economy highly dependent on imported raw materials and semi-
finished/intermediate goods. Third, high transport costs reduce the level of investment, both
directly through increasing costs of imported capital and indirectly through reducing the
level of total savings that is available for investment. Fourth, the availability of a well-
functioning transport system is essential not only for trade to take place but also for
attracting foreign direct investment (FDI). Indeed, among economic factors considered for
selecting a host country for FDI, physical infrastructure, availability of reliable, affordable
and efficient transport and communication services feature prominently. Thus, high
transport costs make Uganda less likely to attract export-oriented FDI, which denies the
country both new technologies and increased productivity. Finally and as will be seen in
discussion later in the paper, transport costs have influence on the country’s selection of
trading partners.
Uganda’s maritime trade is unavoidably dependant on transit through Kenya and/or
Tanzania. Uganda has no control over development of the infrastructure, transport
management and policies in transiting countries. However, the establishment of efficient
transit transport system to seaports for Uganda depends on cooperative arrangements with
Kenya and Tanzania, which is very possible through the East African Community Customs
Union, a treaty signed in March 2004 and is soon to come into force.
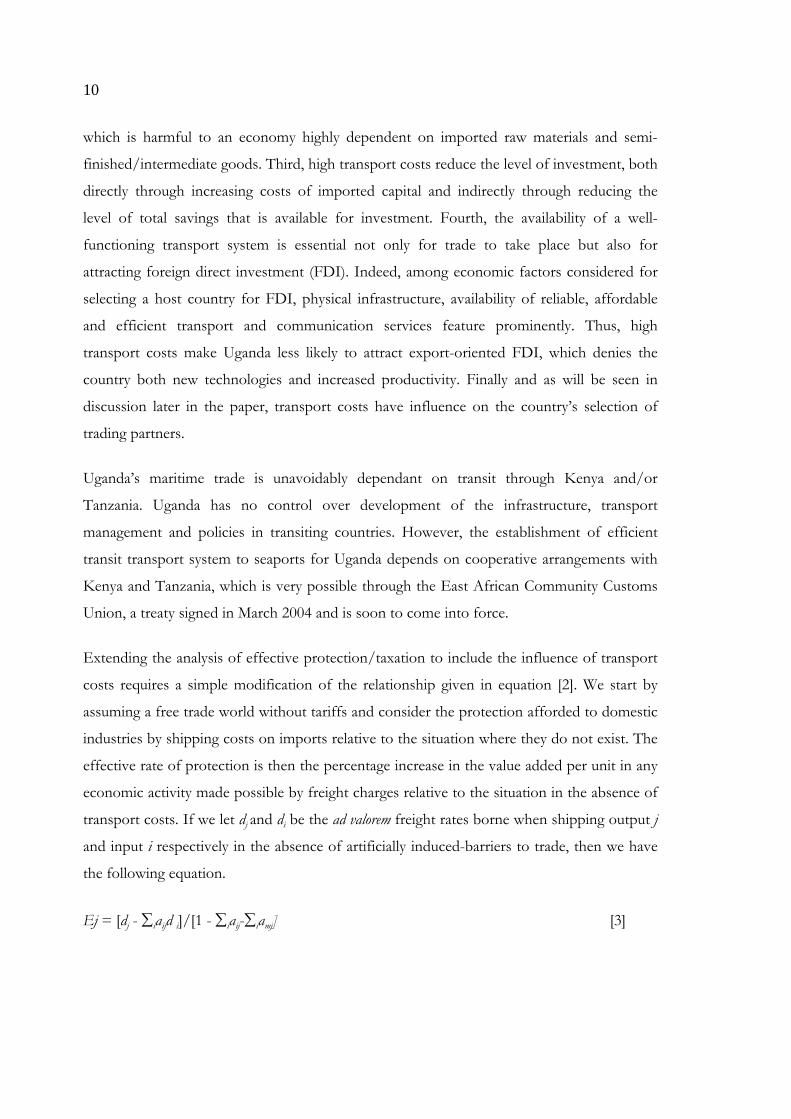
Extending the analysis of effective protection/taxation to include the influence of transport
costs requires a simple modification of the relationship given in equation [2]. We start by
assuming a free trade world without tariffs and consider the protection afforded to domestic
industries by shipping costs on imports relative to the situation where they do not exist. The
effective rate of protection is then the percentage increase in the value added per unit in any
economic activity made possible by freight charges relative to the situation in the absence of
transport costs. If we let dj and di be the ad valorem freight rates borne when shipping output j
and input i respectively in the absence of artificially induced-barriers to trade, then we have
the following equation.
Ej = [dj - ∑iaijd i]/[1 - ∑iaij-∑iamj] [3]
11
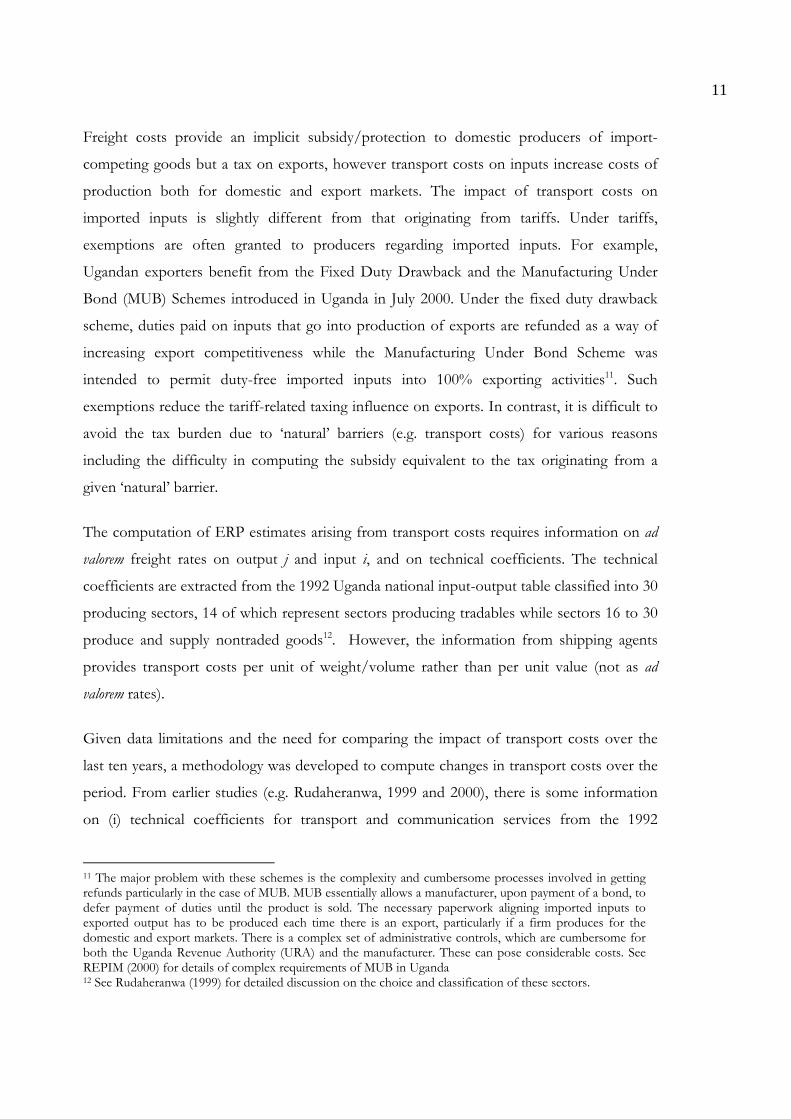
Freight costs provide an implicit subsidy/protection to domestic producers of import-
competing goods but a tax on exports, however transport costs on inputs increase costs of
production both for domestic and export markets. The impact of transport costs on
imported inputs is slightly different from that originating from tariffs. Under tariffs,
exemptions are often granted to producers regarding imported inputs. For example,
Ugandan exporters benefit from the Fixed Duty Drawback and the Manufacturing Under
Bond (MUB) Schemes introduced in Uganda in July 2000. Under the fixed duty drawback
scheme, duties paid on inputs that go into production of exports are refunded as a way of
increasing export competitiveness while the Manufacturing Under Bond Scheme was
intended to permit duty-free imported inputs into 100% exporting activities11. Such
exemptions reduce the tariff-related taxing influence on exports. In contrast, it is difficult to
avoid the tax burden due to ‘natural’ barriers (e.g. transport costs) for various reasons
including the difficulty in computing the subsidy equivalent to the tax originating from a
given ‘natural’ barrier.
The computation of ERP estimates arising from transport costs requires information on ad
valorem freight rates on output j and input i, and on technical coefficients. The technical
coefficients are extracted from the 1992 Uganda national input-output table classified into 30
producing sectors, 14 of which represent sectors producing tradables while sectors 16 to 30
produce and supply nontraded goods12. However, the information from shipping agents
provides transport costs per unit of weight/volume rather than per unit value (not as ad
valorem rates).
Given data limitations and the need for comparing the impact of transport costs over the
last ten years, a methodology was developed to compute changes in transport costs over the
period. From earlier studies (e.g. Rudaheranwa, 1999 and 2000), there is some information
on (i) technical coefficients for transport and communication services from the 1992
11 The major problem with these schemes is the complexity and cumbersome processes involved in gettingrefunds particularly in the case of MUB. MUB essentially allows a manufacturer, upon payment of a bond, todefer payment of duties until the product is sold. The necessary paperwork aligning imported inputs toexported output has to be produced each time there is an export, particularly if a firm produces for thedomestic and export markets. There is a complex set of administrative controls, which are cumbersome forboth the Uganda Revenue Authority (URA) and the manufacturer. These can pose considerable costs. SeeREPIM (2000) for details of complex requirements of MUB in Uganda12 See Rudaheranwa (1999) for detailed discussion on the choice and classification of these sectors.
12
Ugandan input-output table and (ii) estimates of transport costs by sector for 14 tradable
sectors for Uganda in 1994 (as ad valorem freight rates). Interviews carried out in October
2003 with freight agents (combined with information posted on the Ugandan Investment
Authority (UIA) website in August 2003) provide some information on transport costs as
shipment costs per unit of weight (ton). We use the freight costs given as costs per ton from
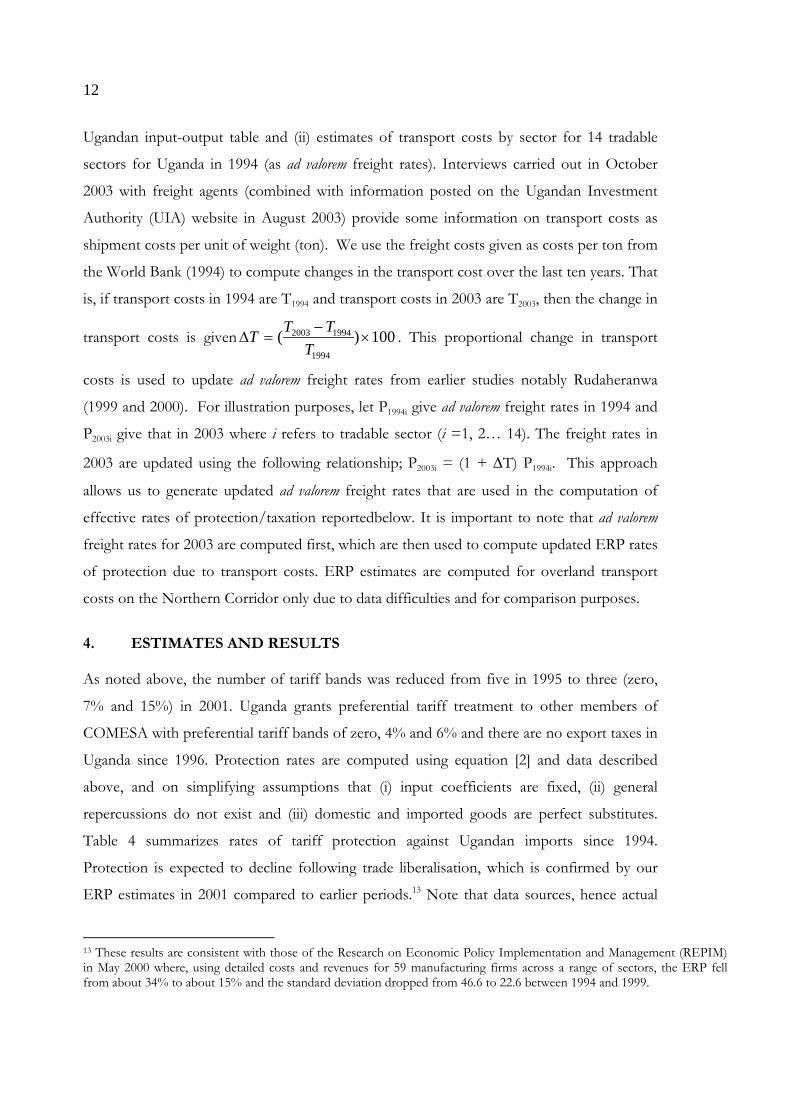
the World Bank (1994) to compute changes in the transport cost over the last ten years. That
is, if transport costs in 1994 are T1994 and transport costs in 2003 are T2003, then the change in
transport costs is given 100)(1994
19942003 ×−
=∆T
TTT . This proportional change in transport
costs is used to update ad valorem freight rates from earlier studies notably Rudaheranwa
(1999 and 2000). For illustration purposes, let P1994i give ad valorem freight rates in 1994 and
P2003i give that in 2003 where i refers to tradable sector (i =1, 2… 14). The freight rates in
2003 are updated using the following relationship; P2003i = (1 + ∆T) P1994i. This approach
allows us to generate updated ad valorem freight rates that are used in the computation of
effective rates of protection/taxation reportedbelow. It is important to note that ad valorem
freight rates for 2003 are computed first, which are then used to compute updated ERP rates
of protection due to transport costs. ERP estimates are computed for overland transport
costs on the Northern Corridor only due to data difficulties and for comparison purposes.
4. ESTIMATES AND RESULTS
As noted above, the number of tariff bands was reduced from five in 1995 to three (zero,
7% and 15%) in 2001. Uganda grants preferential tariff treatment to other members of
COMESA with preferential tariff bands of zero, 4% and 6% and there are no export taxes in
Uganda since 1996. Protection rates are computed using equation [2] and data described
above, and on simplifying assumptions that (i) input coefficients are fixed, (ii) general
repercussions do not exist and (iii) domestic and imported goods are perfect substitutes.
Table 4 summarizes rates of tariff protection against Ugandan imports since 1994.
Protection is expected to decline following trade liberalisation, which is confirmed by our
ERP estimates in 2001 compared to earlier periods.13 Note that data sources, hence actual
13 These results are consistent with those of the Research on Economic Policy Implementation and Management (REPIM)in May 2000 where, using detailed costs and revenues for 59 manufacturing firms across a range of sectors, the ERP fellfrom about 34% to about 15% and the standard deviation dropped from 46.6 to 22.6 between 1994 and 1999.
13
measures, differ each year so one should focus on relative trends rather than precise
estimates.
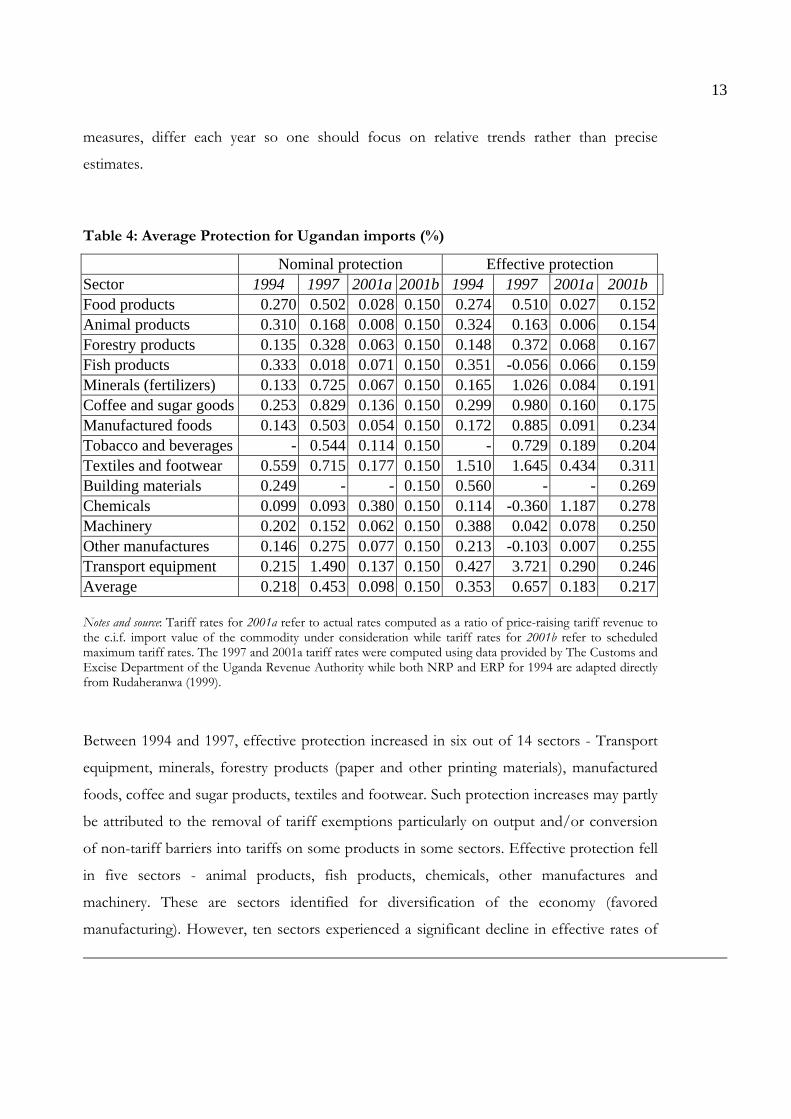
Table 4: Average Protection for Ugandan imports (%)
Nominal protection Effective protectionSector 1994 1997 2001a 2001b 1994 1997 2001a 2001bFood products 0.270 0.502 0.028 0.150 0.274 0.510 0.027 0.152Animal products 0.310 0.168 0.008 0.150 0.324 0.163 0.006 0.154Forestry products 0.135 0.328 0.063 0.150 0.148 0.372 0.068 0.167Fish products 0.333 0.018 0.071 0.150 0.351 -0.056 0.066 0.159Minerals (fertilizers) 0.133 0.725 0.067 0.150 0.165 1.026 0.084 0.191Coffee and sugar goods 0.253 0.829 0.136 0.150 0.299 0.980 0.160 0.175Manufactured foods 0.143 0.503 0.054 0.150 0.172 0.885 0.091 0.234Tobacco and beverages - 0.544 0.114 0.150 - 0.729 0.189 0.204Textiles and footwear 0.559 0.715 0.177 0.150 1.510 1.645 0.434 0.311Building materials 0.249 - - 0.150 0.560 - - 0.269Chemicals 0.099 0.093 0.380 0.150 0.114 -0.360 1.187 0.278Machinery 0.202 0.152 0.062 0.150 0.388 0.042 0.078 0.250Other manufactures 0.146 0.275 0.077 0.150 0.213 -0.103 0.007 0.255Transport equipment 0.215 1.490 0.137 0.150 0.427 3.721 0.290 0.246Average 0.218 0.453 0.098 0.150 0.353 0.657 0.183 0.217
Notes and source: Tariff rates for 2001a refer to actual rates computed as a ratio of price-raising tariff revenue tothe c.i.f. import value of the commodity under consideration while tariff rates for 2001b refer to scheduledmaximum tariff rates. The 1997 and 2001a tariff rates were computed using data provided by The Customs andExcise Department of the Uganda Revenue Authority while both NRP and ERP for 1994 are adapted directlyfrom Rudaheranwa (1999).
Between 1994 and 1997, effective protection increased in six out of 14 sectors - Transport
equipment, minerals, forestry products (paper and other printing materials), manufactured
foods, coffee and sugar products, textiles and footwear. Such protection increases may partly
be attributed to the removal of tariff exemptions particularly on output and/or conversion
of non-tariff barriers into tariffs on some products in some sectors. Effective protection fell
in five sectors - animal products, fish products, chemicals, other manufactures and
machinery. These are sectors identified for diversification of the economy (favored
manufacturing). However, ten sectors experienced a significant decline in effective rates of
14
protection between 1997 and 2001 (actual tariff rates), the exceptions being fish products,
chemical, other manufactures and machinery whose NRP and ERP have increased instead.
Between 1994 and 2001, protection (NRP and ERP) declined in all sector except in
chemicals and in most cases the decline was significant.
Impact of East African Community Customs Union
As noted earlier, Uganda is involved in a number of regional trade arrangements notably the
Common Market for Eastern and Southern Africa (COMESA) and the East Africa
Community (EAC) Customs Union whose treaty was signed on 2 March 2004. According to
Articles 3 and 10 of the treaty, the ultimate objective of the EAC Customs Union is to
eliminate tariffs (and other charges of equivalent effect) on intra-region trade with the aim of
promoting commodity trade within Member States. Article 11 of the EAC Customs Union
treaty makes a number of provisions regarding the flow of goods within the customs union.
First, the establishment of the Customs Union is to be a gradual but progressive process
over a transition period of five years. During the transition period to a full Customs Union,
Member States agreed that (a) goods to and from the Republic of Uganda and the United
Republic of Tanzania are to be duty free and (b) goods from the Republic of Uganda and the
United Republic of Tanzania into the republic of Kenya will be duty free.
Article 11 of the treaty categorizes goods from the Republic of Kenya into the Republic of
Ugandan and the United Republic of Tanzania into two groups namely (i) Category A goods,
which will be eligible for immediate duty free treatment (ii) category B which are eligible for
gradual tariff reduction. Category B goods from the Republic of Kenya into Uganda are to
have a phased out tariff reduction for a period of five years (with an annual 2% tariff
reduction) for all products starting with 10% in the first year of the implementation of the
EAC Customs Union. Since it is difficult to isolate products originating within the Customs
union from imports origination outside the Customs Union, we generate two categories of
ERP estimates reflecting zero and 10% rated imported inputs into production14.
14 It is highly possible that Uganda’s trade structure (commodity composition and market ofdestination/origin) will change once the EAC Customs Union is implemented probably with more importscoming from EAC (and therefore more inputs attracting 0% tariff rates as envisaged under Article 10 of thetreaty) than is the current practice. This however could be taken care of by the current ERP estimatescomputed using zero percent tariff rate in Table 5.
15
The Partner states established a three-band common external tariff rate system with a tariff
rate of 0% for raw materials, 10% for semi-finished goods and a maximum tariff rate of 25%
for all final products imported into the community. The maximum common external tariff
proposed is higher than that currently prevailing in Uganda, and tariffs increase for some
other products. We use these rates to estimate their protection implications for Uganda once
the Customs Union is implemented.
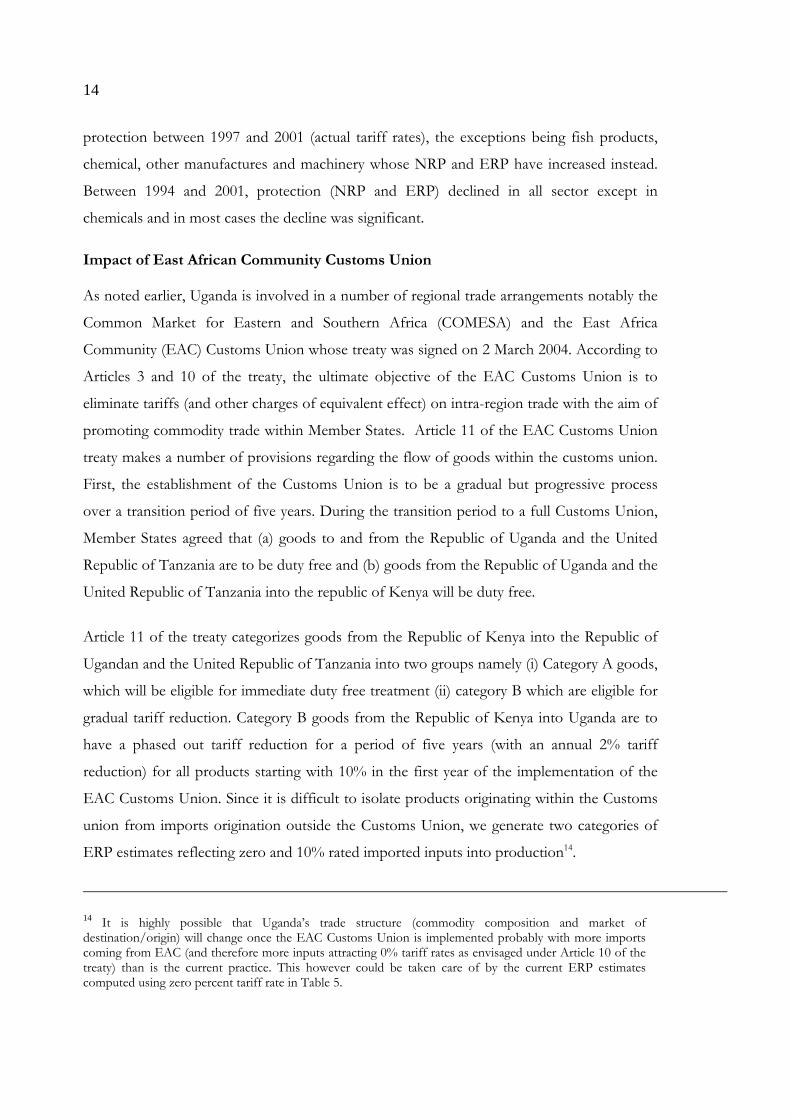
Table 5: Potential tariff protection facing Uganda under EAC Customs Union
SectorNRP2001 ERP2001 NRP2005 ERP2005
(0%)ERP2005(10%)
Food products 0.150 0.152 0.250 0.260 0.257Animal products 0.150 0.154 0.250 0.264 0.261Forestry products 0.150 0.167 0.250 0.345 0.318Fish products 0.150 0.159 0.250 0.305 0.289Minerals and quarry 0.150 0.191 0.250 0.376 0.354Coffee, cotton and sugar 0.150 0.175 0.250 0.308 0.301Manufactured goods 0.150 0.234 0.250 0.605 0.519Tobacco and beverages 0.150 0.204 0.250 0.487 0.428Textiles and footwear 0.150 0.311 0.250 0.871 0.730Building materials 0.150 0.269 0.250 0.711 0.606Chemicals 0.150 0.278 0.250 0.848 0.694Metals and machinery 0.150 0.250 0.250 0.713 0.594Other manufactures 0.150 0.255 0.250 0.704 0.592Transport equipment 0.150 0.246 0.250 0.688 0.577Average 0.150 0.217 0.250 0.535 0.466
Notes: The maximum external tariff is assumed to apply to final goods for each sector in NRP2005. Thepercentage figures in brackets for ERP2005 refer to tariff rates applicable to imported inputs used inproduction across different sectors.Source: Own computation using EAC Customs Union proposed common external tariff rates
It is clear that the Customs Union will increase protection for Ugandan producers of import-
competing products (Table 5). When the tariff rate on imported inputs is 10%, the average
ERP will rise from just less than 22% in 2001 to almost 47% once the EAC Customs Union
is implemented in 2005 (an increase of more than 100%). The protection to domestic
producers will even be higher once tariff rates on intermediate inputs are eliminated (i.e.
rated at 0%). Under this scenario, the average effective rate of protection (ERP) accorded to

16
Ugandan producers of importable products will be as high as 53% (only 12 percentage
points lower than the average ERP in 1997).
All sectors will experience increased protection once the EAC Customs Union comes into
effect. However there are sectors whose ERP will more than double (when imported inputs
are rated at 0%). These include manufactured goods (from 23% to over 60%); tobacco and
beverages;(from 20% to about 49%); textile, clothing and footwear (from 31% to about
87%); building materials (from 27% to about 71%); chemicals (from 28% to about 85%);
metals and machinery (from 25% to over 71%); other manufactures (from 26% to 70%); and
transport equipment (from 25% about 69%). Thus, the coming into force of the EAC
Customs Union will increase protection to Ugandan producers, a step backward from the
progress made in pursuing a liberal trade regime over the past decade. This may however be
offset by increased efficiency in trade facilitation as provided for in Article 6 of the treaty
establishing the Customs Union. This is possible for example through a reduced number
(and adoption of common standards) of trade documentation and procedures, collection and
dissemination of information on trade, ensuring adequate coordination and increasing
efficiency transport services within the Customs Union. We provide more discussion on
implications of the Customs Union for increased trade facilitation and reduced transaction
costs of trade within the Union later in the paper.
Protection/tax burden relating to freight costs
The foregoing discussion shows that Uganda has made major steps in liberalizing the
economy to improve the country’s export competitiveness by reducing distortions associated
with protection. The Ugandan producers, mainly of light industrial goods for domestic
consumption, have faced increased import competition following trade liberalization, which
was expected to induce efficiency and improve productivity. The response to such
competition pressures has been constrained by poorly functioning trade-promoting
institutions, and costly, inadequate and inefficiently functioning infrastructure system such as
unreliable and costly electric power supply and transport services. In as much as other
institutional and infrastructure-related barriers to trade are important, the focus here is on
how transport costs impact on the competitiveness of Ugandan exports.
17
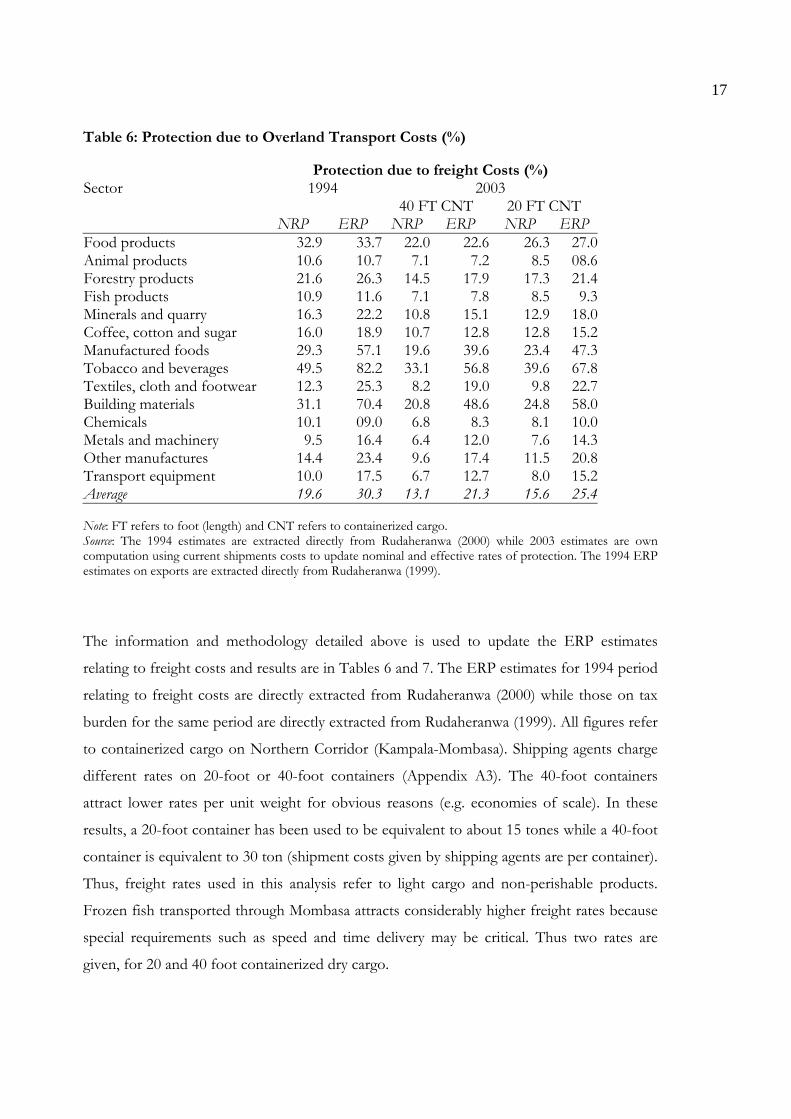
Table 6: Protection due to Overland Transport Costs (%)
Protection due to freight Costs (%)Sector 1994 2003 40 FT CNT 20 FT CNT
NRP ERP NRP ERP NRP ERPFood products 32.9 33.7 22.0 22.6 26.3 27.0Animal products 10.6 10.7 7.1 7.2 8.5 08.6Forestry products 21.6 26.3 14.5 17.9 17.3 21.4Fish products 10.9 11.6 7.1 7.8 8.5 9.3Minerals and quarry 16.3 22.2 10.8 15.1 12.9 18.0Coffee, cotton and sugar 16.0 18.9 10.7 12.8 12.8 15.2Manufactured foods 29.3 57.1 19.6 39.6 23.4 47.3Tobacco and beverages 49.5 82.2 33.1 56.8 39.6 67.8Textiles, cloth and footwear 12.3 25.3 8.2 19.0 9.8 22.7Building materials 31.1 70.4 20.8 48.6 24.8 58.0Chemicals 10.1 09.0 6.8 8.3 8.1 10.0Metals and machinery 9.5 16.4 6.4 12.0 7.6 14.3Other manufactures 14.4 23.4 9.6 17.4 11.5 20.8Transport equipment 10.0 17.5 6.7 12.7 8.0 15.2Average 19.6 30.3 13.1 21.3 15.6 25.4
Note: FT refers to foot (length) and CNT refers to containerized cargo.Source: The 1994 estimates are extracted directly from Rudaheranwa (2000) while 2003 estimates are owncomputation using current shipments costs to update nominal and effective rates of protection. The 1994 ERPestimates on exports are extracted directly from Rudaheranwa (1999).
The information and methodology detailed above is used to update the ERP estimates
relating to freight costs and results are in Tables 6 and 7. The ERP estimates for 1994 period
relating to freight costs are directly extracted from Rudaheranwa (2000) while those on tax
burden for the same period are directly extracted from Rudaheranwa (1999). All figures refer
to containerized cargo on Northern Corridor (Kampala-Mombasa). Shipping agents charge
different rates on 20-foot or 40-foot containers (Appendix A3). The 40-foot containers
attract lower rates per unit weight for obvious reasons (e.g. economies of scale). In these
results, a 20-foot container has been used to be equivalent to about 15 tones while a 40-foot
container is equivalent to 30 ton (shipment costs given by shipping agents are per container).
Thus, freight rates used in this analysis refer to light cargo and non-perishable products.
Frozen fish transported through Mombasa attracts considerably higher freight rates because
special requirements such as speed and time delivery may be critical. Thus two rates are
given, for 20 and 40 foot containerized dry cargo.
18
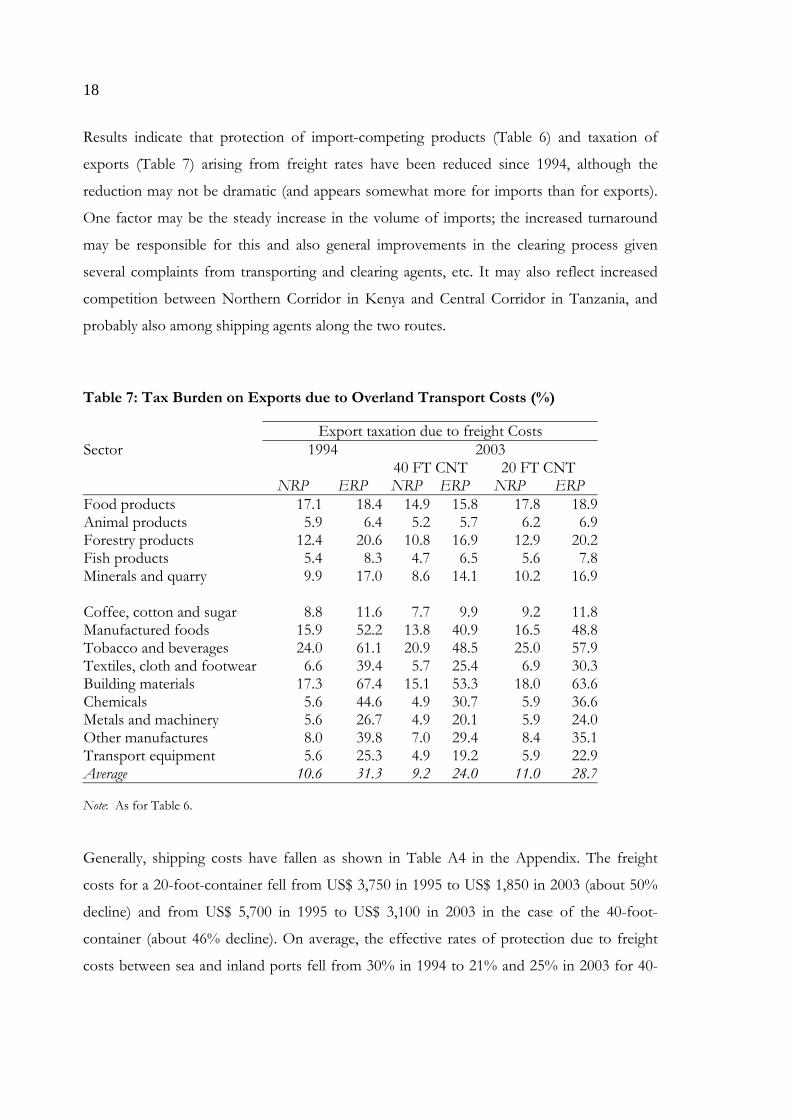
Results indicate that protection of import-competing products (Table 6) and taxation of
exports (Table 7) arising from freight rates have been reduced since 1994, although the
reduction may not be dramatic (and appears somewhat more for imports than for exports).
One factor may be the steady increase in the volume of imports; the increased turnaround
may be responsible for this and also general improvements in the clearing process given
several complaints from transporting and clearing agents, etc. It may also reflect increased
competition between Northern Corridor in Kenya and Central Corridor in Tanzania, and
probably also among shipping agents along the two routes.
Table 7: Tax Burden on Exports due to Overland Transport Costs (%)
Export taxation due to freight CostsSector 1994 2003 40 FT CNT 20 FT CNT
NRP ERP NRP ERP NRP ERPFood products 17.1 18.4 14.9 15.8 17.8 18.9Animal products 5.9 6.4 5.2 5.7 6.2 6.9Forestry products 12.4 20.6 10.8 16.9 12.9 20.2Fish products 5.4 8.3 4.7 6.5 5.6 7.8Minerals and quarry 9.9 17.0 8.6 14.1 10.2 16.9
Coffee, cotton and sugar 8.8 11.6 7.7 9.9 9.2 11.8Manufactured foods 15.9 52.2 13.8 40.9 16.5 48.8Tobacco and beverages 24.0 61.1 20.9 48.5 25.0 57.9Textiles, cloth and footwear 6.6 39.4 5.7 25.4 6.9 30.3Building materials 17.3 67.4 15.1 53.3 18.0 63.6Chemicals 5.6 44.6 4.9 30.7 5.9 36.6Metals and machinery 5.6 26.7 4.9 20.1 5.9 24.0Other manufactures 8.0 39.8 7.0 29.4 8.4 35.1Transport equipment 5.6 25.3 4.9 19.2 5.9 22.9Average 10.6 31.3 9.2 24.0 11.0 28.7
Note: As for Table 6.
Generally, shipping costs have fallen as shown in Table A4 in the Appendix. The freight
costs for a 20-foot-container fell from US$ 3,750 in 1995 to US$ 1,850 in 2003 (about 50%
decline) and from US$ 5,700 in 1995 to US$ 3,100 in 2003 in the case of the 40-foot-
container (about 46% decline). On average, the effective rates of protection due to freight
costs between sea and inland ports fell from 30% in 1994 to 21% and 25% in 2003 for 40-

19
foot and 20-foot containerized imported shipments respectively with variations across the 14
sectors15. Equally, the taxation/burden on exports relating to transport costs has declined on
average over the last ten years, i.e. the average effective rate of taxation declined from just
over 31% in 1994 to about 24% and 29% in 2003 for 40-foot and 20-foot containerized
exports respectively. The general observation is that the export burden arising from freight
rates is still high at 29% on average (although down from 31% in 1994) as there are no
policy-induced or explicit export taxes. The effective protection to import-competing
products arising from freight costs is still high (about 25%) relative to that arising from tariff
rates (about 22%) seen earlier in Table 4. This simply means that freight costs have gained
more significance than tariffs in impeding trade.
There seem to have been considerable reductions in the transit times since 1994 (Appendix
A3). Transit time, which used to range from 39 to 46 days between Kampala and Mombasa
for import shipment before 1994 (World Bank, 1994), fell to between 12 to 15 days for road
and 18 to 21 days for rail transport, based on information available in October 2003. The
transit time for exports used to be between 40 and 44 days, but has been reduced to as little
as 4 to 7 days by October 2003. The transit period for 2003 does include the period involved
in processing documents within the seaport. Our analysis is unable to quantify (put a
monetary value on) the effect of the reduction in transaction costs due to improved
efficiency in transit procedures but this is likely to be significant.
As noted earlier, the EAC Customs Union provides for increased trade facilitation (Article 6)
and the simplification, standardization and harmonization of trade information and
processing of the documentation (Article 7), commodity description and coding system.
Articles 4 and 13 of the treaty imply that institutional and infrastructural barriers to trade,
and therefore implied transaction costs, will reduce considerably following the
implementation of the EAC Customs Union. This may partially offset increased protection
to import-competing products and subsequent implicit export-bias that may arise from
higher common external tariff rates.
15 The interactive effect of tariff and freight rates has not been computed on assumption that it is negligiblegiven that both tariff and freight rates has reduced considerably over the last ten years.
20
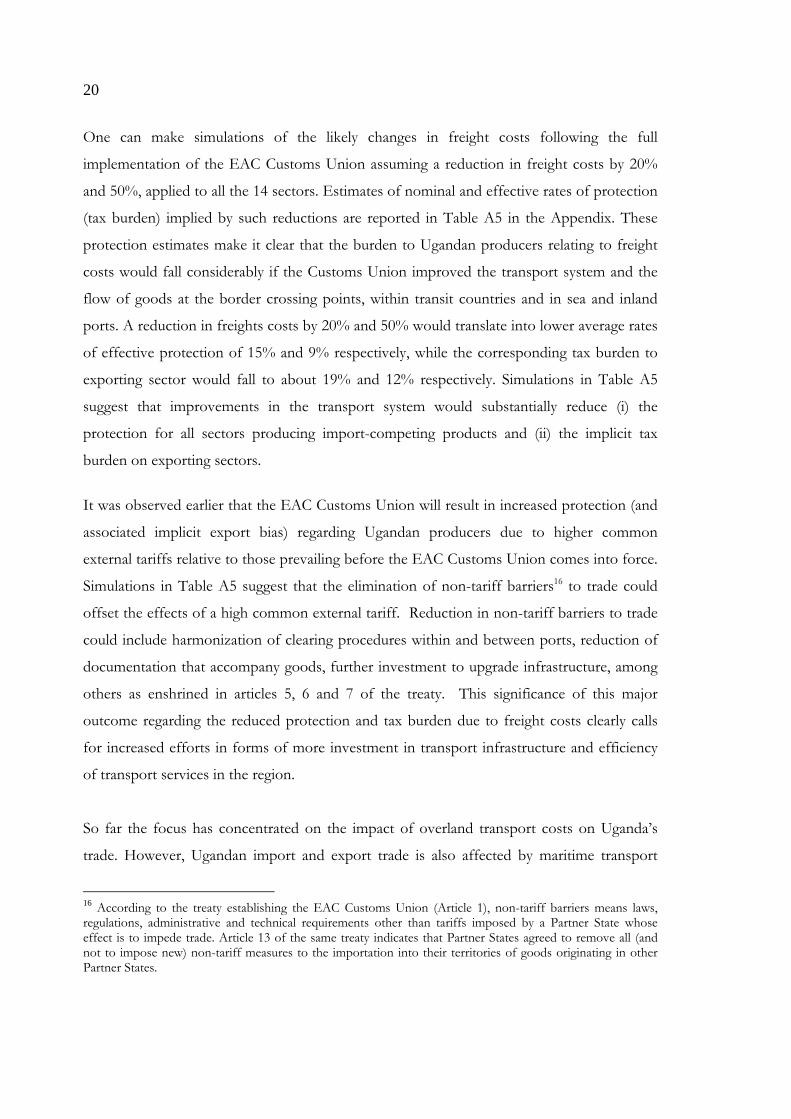
One can make simulations of the likely changes in freight costs following the full
implementation of the EAC Customs Union assuming a reduction in freight costs by 20%
and 50%, applied to all the 14 sectors. Estimates of nominal and effective rates of protection
(tax burden) implied by such reductions are reported in Table A5 in the Appendix. These
protection estimates make it clear that the burden to Ugandan producers relating to freight
costs would fall considerably if the Customs Union improved the transport system and the
flow of goods at the border crossing points, within transit countries and in sea and inland
ports. A reduction in freights costs by 20% and 50% would translate into lower average rates
of effective protection of 15% and 9% respectively, while the corresponding tax burden to
exporting sector would fall to about 19% and 12% respectively. Simulations in Table A5
suggest that improvements in the transport system would substantially reduce (i) the
protection for all sectors producing import-competing products and (ii) the implicit tax
burden on exporting sectors.
It was observed earlier that the EAC Customs Union will result in increased protection (and
associated implicit export bias) regarding Ugandan producers due to higher common
external tariffs relative to those prevailing before the EAC Customs Union comes into force.
Simulations in Table A5 suggest that the elimination of non-tariff barriers16 to trade could
offset the effects of a high common external tariff. Reduction in non-tariff barriers to trade
could include harmonization of clearing procedures within and between ports, reduction of
documentation that accompany goods, further investment to upgrade infrastructure, among
others as enshrined in articles 5, 6 and 7 of the treaty. This significance of this major
outcome regarding the reduced protection and tax burden due to freight costs clearly calls
for increased efforts in forms of more investment in transport infrastructure and efficiency
of transport services in the region.
So far the focus has concentrated on the impact of overland transport costs on Uganda’s
trade. However, Ugandan import and export trade is also affected by maritime transport
16 According to the treaty establishing the EAC Customs Union (Article 1), non-tariff barriers means laws,regulations, administrative and technical requirements other than tariffs imposed by a Partner State whoseeffect is to impede trade. Article 13 of the same treaty indicates that Partner States agreed to remove all (andnot to impose new) non-tariff measures to the importation into their territories of goods originating in otherPartner States.
21
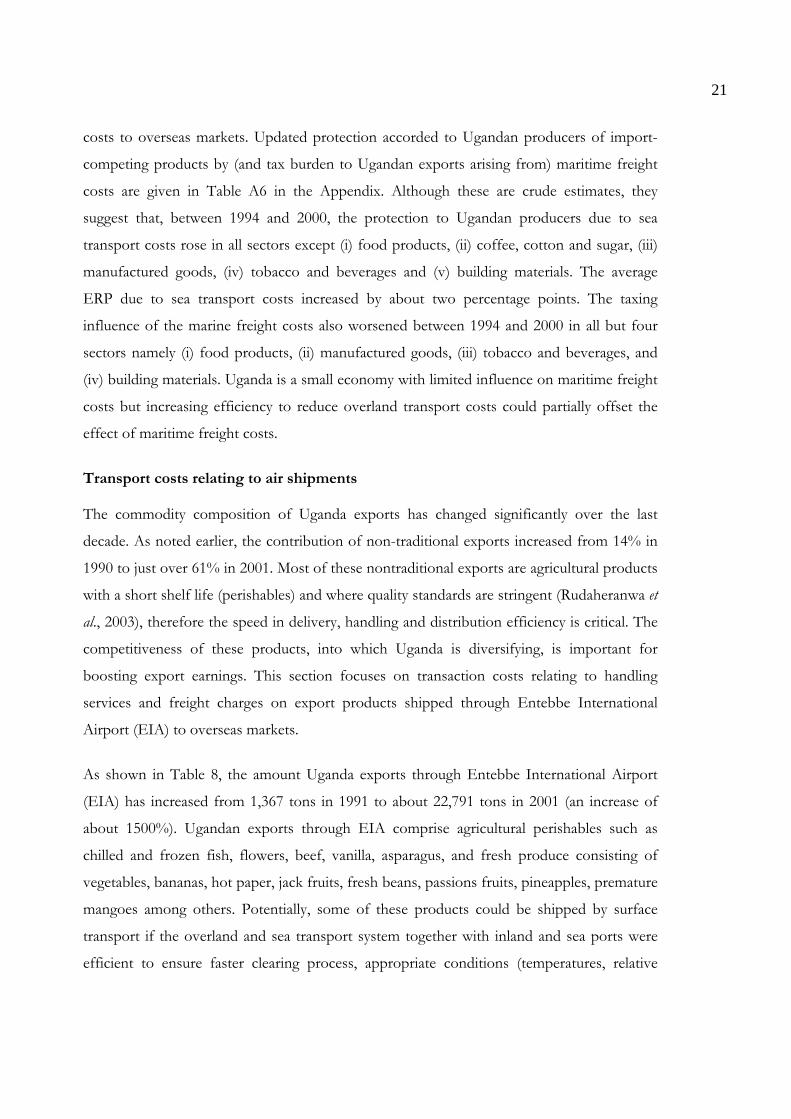
costs to overseas markets. Updated protection accorded to Ugandan producers of import-
competing products by (and tax burden to Ugandan exports arising from) maritime freight
costs are given in Table A6 in the Appendix. Although these are crude estimates, they
suggest that, between 1994 and 2000, the protection to Ugandan producers due to sea
transport costs rose in all sectors except (i) food products, (ii) coffee, cotton and sugar, (iii)
manufactured goods, (iv) tobacco and beverages and (v) building materials. The average
ERP due to sea transport costs increased by about two percentage points. The taxing
influence of the marine freight costs also worsened between 1994 and 2000 in all but four
sectors namely (i) food products, (ii) manufactured goods, (iii) tobacco and beverages, and
(iv) building materials. Uganda is a small economy with limited influence on maritime freight
costs but increasing efficiency to reduce overland transport costs could partially offset the
effect of maritime freight costs.
Transport costs relating to air shipments
The commodity composition of Uganda exports has changed significantly over the last
decade. As noted earlier, the contribution of non-traditional exports increased from 14% in
1990 to just over 61% in 2001. Most of these nontraditional exports are agricultural products
with a short shelf life (perishables) and where quality standards are stringent (Rudaheranwa et
al., 2003), therefore the speed in delivery, handling and distribution efficiency is critical. The
competitiveness of these products, into which Uganda is diversifying, is important for
boosting export earnings. This section focuses on transaction costs relating to handling
services and freight charges on export products shipped through Entebbe International
Airport (EIA) to overseas markets.
As shown in Table 8, the amount Uganda exports through Entebbe International Airport
(EIA) has increased from 1,367 tons in 1991 to about 22,791 tons in 2001 (an increase of
about 1500%). Ugandan exports through EIA comprise agricultural perishables such as
chilled and frozen fish, flowers, beef, vanilla, asparagus, and fresh produce consisting of
vegetables, bananas, hot paper, jack fruits, fresh beans, passions fruits, pineapples, premature
mangoes among others. Potentially, some of these products could be shipped by surface
transport if the overland and sea transport system together with inland and sea ports were
efficient to ensure faster clearing process, appropriate conditions (temperatures, relative
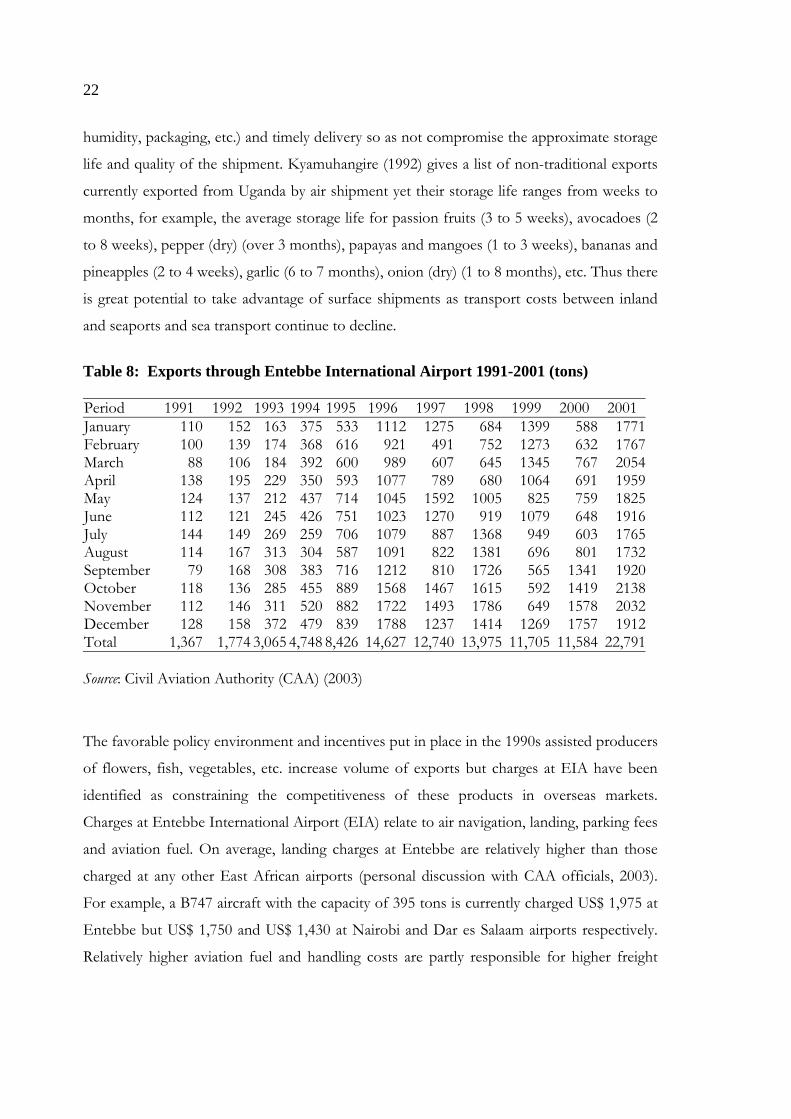
22
humidity, packaging, etc.) and timely delivery so as not compromise the approximate storage
life and quality of the shipment. Kyamuhangire (1992) gives a list of non-traditional exports
currently exported from Uganda by air shipment yet their storage life ranges from weeks to
months, for example, the average storage life for passion fruits (3 to 5 weeks), avocadoes (2
to 8 weeks), pepper (dry) (over 3 months), papayas and mangoes (1 to 3 weeks), bananas and
pineapples (2 to 4 weeks), garlic (6 to 7 months), onion (dry) (1 to 8 months), etc. Thus there
is great potential to take advantage of surface shipments as transport costs between inland
and seaports and sea transport continue to decline.
Table 8: Exports through Entebbe International Airport 1991-2001 (tons)
Period 1991 1992 1993 1994 1995 1996 1997 1998 1999 2000 2001January 110 152 163 375 533 1112 1275 684 1399 588 1771February 100 139 174 368 616 921 491 752 1273 632 1767March 88 106 184 392 600 989 607 645 1345 767 2054April 138 195 229 350 593 1077 789 680 1064 691 1959May 124 137 212 437 714 1045 1592 1005 825 759 1825June 112 121 245 426 751 1023 1270 919 1079 648 1916July 144 149 269 259 706 1079 887 1368 949 603 1765August 114 167 313 304 587 1091 822 1381 696 801 1732September 79 168 308 383 716 1212 810 1726 565 1341 1920October 118 136 285 455 889 1568 1467 1615 592 1419 2138November 112 146 311 520 882 1722 1493 1786 649 1578 2032December 128 158 372 479 839 1788 1237 1414 1269 1757 1912Total 1,367 1,774 3,065 4,748 8,426 14,627 12,740 13,975 11,705 11,584 22,791
Source: Civil Aviation Authority (CAA) (2003)
The favorable policy environment and incentives put in place in the 1990s assisted producers
of flowers, fish, vegetables, etc. increase volume of exports but charges at EIA have been
identified as constraining the competitiveness of these products in overseas markets.
Charges at Entebbe International Airport (EIA) relate to air navigation, landing, parking fees
and aviation fuel. On average, landing charges at Entebbe are relatively higher than those
charged at any other East African airports (personal discussion with CAA officials, 2003).
For example, a B747 aircraft with the capacity of 395 tons is currently charged US$ 1,975 at
Entebbe but US$ 1,750 and US$ 1,430 at Nairobi and Dar es Salaam airports respectively.
Relatively higher aviation fuel and handling costs are partly responsible for higher freight
23
charges at Entebbe compared to Nairobi and Dar es Salaam. For example, freight charges in
1999 ranged from US$1.80 to US$ 1.90 in Uganda but US$1.65 to US$ 1.85 in Kenya (ADC,
1999). Additional factors responsible for lower freight charges in Kenya include large
volume of available charter space (more aircraft charters) and the number of agents who
negotiate for cargo space in Kenya.
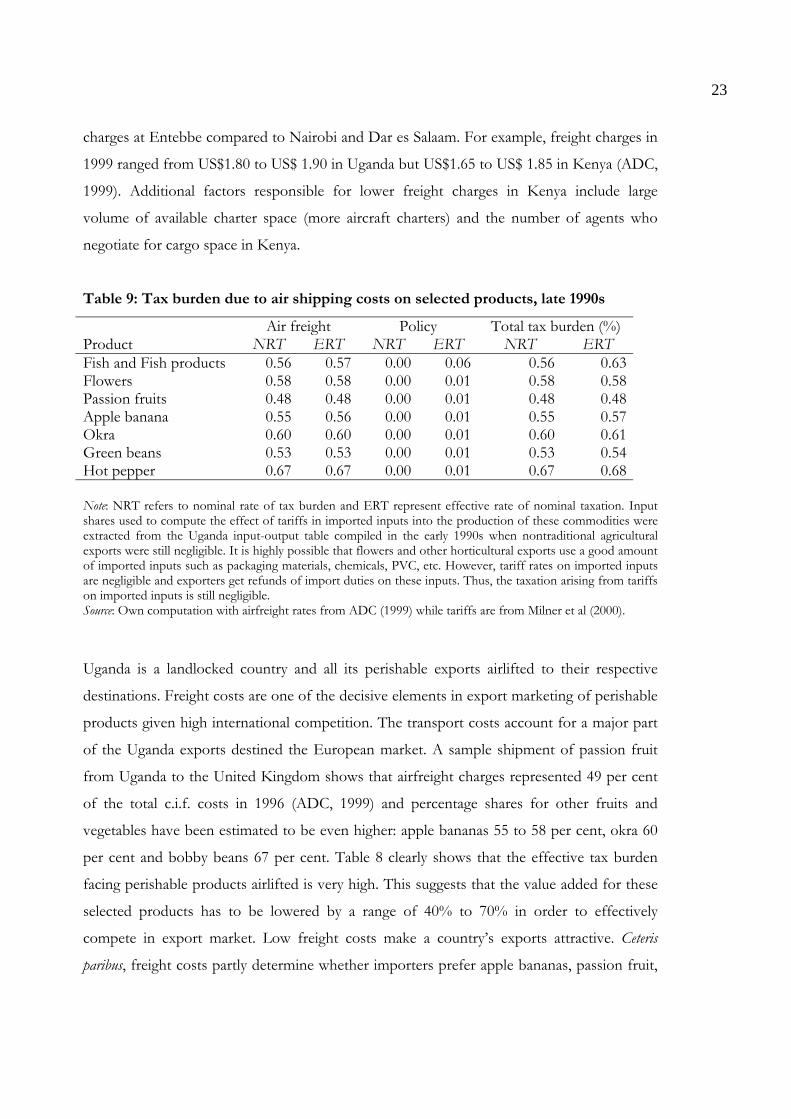
Table 9: Tax burden due to air shipping costs on selected products, late 1990s
Air freight Policy Total tax burden (%)Product NRT ERT NRT ERT NRT ERTFish and Fish products 0.56 0.57 0.00 0.06 0.56 0.63Flowers 0.58 0.58 0.00 0.01 0.58 0.58Passion fruits 0.48 0.48 0.00 0.01 0.48 0.48Apple banana 0.55 0.56 0.00 0.01 0.55 0.57Okra 0.60 0.60 0.00 0.01 0.60 0.61Green beans 0.53 0.53 0.00 0.01 0.53 0.54Hot pepper 0.67 0.67 0.00 0.01 0.67 0.68
Note: NRT refers to nominal rate of tax burden and ERT represent effective rate of nominal taxation. Inputshares used to compute the effect of tariffs in imported inputs into the production of these commodities wereextracted from the Uganda input-output table compiled in the early 1990s when nontraditional agriculturalexports were still negligible. It is highly possible that flowers and other horticultural exports use a good amountof imported inputs such as packaging materials, chemicals, PVC, etc. However, tariff rates on imported inputsare negligible and exporters get refunds of import duties on these inputs. Thus, the taxation arising from tariffson imported inputs is still negligible.Source: Own computation with airfreight rates from ADC (1999) while tariffs are from Milner et al (2000).
Uganda is a landlocked country and all its perishable exports airlifted to their respective
destinations. Freight costs are one of the decisive elements in export marketing of perishable
products given high international competition. The transport costs account for a major part
of the Uganda exports destined the European market. A sample shipment of passion fruit
from Uganda to the United Kingdom shows that airfreight charges represented 49 per cent
of the total c.i.f. costs in 1996 (ADC, 1999) and percentage shares for other fruits and
vegetables have been estimated to be even higher: apple bananas 55 to 58 per cent, okra 60
per cent and bobby beans 67 per cent. Table 8 clearly shows that the effective tax burden
facing perishable products airlifted is very high. This suggests that the value added for these
selected products has to be lowered by a range of 40% to 70% in order to effectively
compete in export market. Low freight costs make a country’s exports attractive. Ceteris
paribus, freight costs partly determine whether importers prefer apple bananas, passion fruit,
24
okra, fresh beans and hot peppers from Uganda or elsewhere. While the distance to be flown
determines freight costs, the efficiency in transportation and handling systems during
production and distribution could partially offset the impact of freight costs. The relative
low utilisation of the EIA and cargo flights increases the cost of Ugandan exports relative to
competitors such as Kenya, Zimbabwe and South Africa.
6 CONCLUSIONS AND POLICY IMPLICATIONS
The recent decline in policy-induced barriers (such as tariffs) to trade has implied an
increased relative importance of transport and infrastructure services in explaining trade,
access to markets, and income growth. The significance of transport services as a
determinant of export competitiveness is clear. Transport services are essential intermediate
inputs into many other sectors of the economy and producers depend on such services to
deliver their output to end-users.
As noted earlier, higher shipping costs reduce returns on exports and resources for
investment (Amjadi and Yeats, 1995) and determine a country’s selection of trading partners
(Hummels, 2001; Limao and Venables, 2001). Hummels’ (2001) analysis shows that each
additional day spent in transport reduces the probability that the United States (USA) will
source from that country by a range of 1% (all goods) to 1.5% (manufactures). Inefficient
transport service provision acts as a tax on production and prevents the realization of
significant gains in productivity (Naude, 1999 and World Bank, 2001) and greatly
undermines the ability of firms to compete in foreign markets. Improving the efficiency of
transport services within and in transit countries is crucial to unlock the economic potential
of both maritime and landlocked countries. The major interest of landlocked countries like
Uganda with respect to transit transport services is to (i) secure unfettered access to the sea
by all means of transport (ii) reduce shipping costs and improve transport services so as to
improve the competitiveness of exports (iii) reduce delivered costs of imports (iv) have
routes free from delays and uncertainties (v) reduce losses relating to damage and
deterioration and (vi) open the way for export expansion.
Recent studies (notably Amjadi and Yeats, 1995; Limao and Venables, 1999; Milner
Morrissey and Rudaheranwa, 2000) do indicate that transport costs are a significant factor in
explaining sub-Saharan Africa’s poor trade performance. Net freight payments to foreign

25
transport service providers absorbed as much as 15% of Africa’s export earnings compared
to a developing country average of 5.8% in the 1990s and, for landlocked countries, the
freight cost ratio exceeds 30% (Amjadi and Yeats, 1995). Limao and Venables’ (1999 and
2001) studies of intra-African trade flows indicate that their relatively low trade is largely
explained by infrastructure limitations. The implicit taxation of Ugandan exporters arising
from high transport costs in the 1990s ranged from 40% for food exports to 24% for coffee;
goods that make up the majority of the country’s exports (Milner, Morrissey and
Rudaheranwa, 2000). Sectors that produce goods (namely manufactured foods; tobacco and
beverages; textile, clothing and foot wear; building materials and chemicals) that are bulky
relative to value and /or require imported inputs had an implicit transport tax rate in excess
of 100%.
Limao and Venables (1999) show that a landlocked economy usually has about 30% of the
trade volume of a maritime economy of a similar income level and argue that halving
transport costs increases the volume of trade by a factor of five. Clark, Dollar and Micco
(2001) further argue that improving port efficiency from 25th percentile to 75th percentile
reduces the shipping costs by 12% (or equivalent of 5,000 miles in distance) and that
inefficiency in ports is equivalent to being 60% farther away from markets for the average
country. World Bank (2001) cites studies that estimate additional costs of transportation
borne by landlocked countries to the tune of more than 50% of that paid by maritime
countries. However, the extra overland distance to sea alone cannot explain additional
transport costs facing landlocked countries. There are genuine and avoidable costs of
transportation (Milner, 1996); the avoidable component of transportation costs arises from
border delays, transportation coordination problems, uncertainty and inefficiency at inland
and seaports.
High costs of transportation feed into import and export prices, which reduce returns to
capital, wages and productivity. Under circumstances of unreliable and infrequent transport
services, firms are likely to maintain higher inventory holdings at every stage of the
production chain, with significant financial costs particularly in developing countries where
capital is scarce and rates of interest are high. As countries reduce tariffs and other barriers
to trade, effective rates of protection, for example in the manufacturing sector, may become

26
negative if they continue to face input prices that are higher than they would if services
markets were competitive (World Bank, 2001).
The limited literature (see Tovar, Jara-Diaz and Trujillo, 2003) available indicates that
transport costs are negatively related to trade. Any deficiencies in logistical operations
directly affect the price of imported inputs and the export competitiveness thereby
negatively affecting trade. Lengthy transit times impose inventory holding and depreciation
costs on traders, for example the spoilage of perishables, items with immediate information
content, and mismatch between what is produced and what consumers desire to buy later.
Shipping time strongly affects both the selection of trading partners and raises costs of trade,
which may explain the extent and composition of Ugandan trade growth. Wilson, Mann and
Otsuki (2004) have shown that benefits of increased efficiency in logistical services delivery
are very large and gains fall disproportionately on exports.
Policy implications
An efficient transport system (in terms of speed, reliability and affordability) is very critical
for the export competitiveness of landlocked countries like Uganda. High shipping costs
associated with inadequate infrastructure, imbalance of trade flows, inefficient transport
system, cumbersome clearing procedures and documentation pose serious constraints to
Uganda’s trade and economic development. Shipping costs arise from a number of sources
including handling charges at inland and seaports; costs incurred on customs clearance;
security costs incurred in providing additional security arrangements (convoys) for avoiding
dilution and pilferage of the transit shipment; delays and fees for various overlapping
sanitary or health inspections, addition costs for delays in excess of normal transit time, etc.
Some of these sources of transport costs lie in the domain of policy makers and could be
influenced.
Uganda’s trade depends on Kenya and Tanzania for access to and from seaports and
reducing transport costs will require more effective cooperation and collaboration with these
countries. Uganda is privileged to be in the East African Community (EAC) Customs Union
and the Common Market for Eastern and Southern Africa (COMESA) regional grouping.
Already the COMESA and the Northern Corridor Transit Transport Authority (TTA) have
adopted a number of regional transit and transport instruments including the application of

27
harmonised road transit charges and axle limits, regional third-party motor insurance scheme
(COMESA Yellow Card) which reduced costs and delays associated with multi-insurance
coverage. Under the EAC Customs Union, Uganda should push for a common customs
control document that is acceptable and enforceable by customs administration along the
transport corridors. In this way, transaction costs and delays associated with national
customs clearances and documentation for transit shipment could be reduced through the
harmonisation, simplification and standardisation of these processes.
Transport policy reforms, (e.g. the commercialisation of Ugandan Railways to compete with
road transportation in the early 1990s) improved efficiency in rail transportation and had a
positive impact in reducing transport costs and associated delays. Similar policy reforms
should be encouraged. Further efforts should be made to improve constraints relating to
poorly functioning institutions and regulatory systems by liberalising and commercialising
auxiliary services in inland and seaports. Currently custom officers at border entry points
(e.g. Malaba, Busia, etc.) do not work on weekends and after 5.00 pm on workdays. In
addition, there is no priority given to merchandise imports and exports of critical urgency.
Simply by designating categories of items for customs clearance and accord priority to
perishable exports and other urgently needed imported inputs could significantly reduce
trade costs and improve Uganda’s competitiveness. Introducing a 24-hour clearing service
throughout the week (including weekends) through working shifts is another way of
minimising delays and associated trade costs.
The long-term solution to high shipment costs will be increased investment both in Uganda
and transit countries specifically to upgrade and improve the efficiency of the transportation
systems (roads, rails, water transport, inland and sea ports). However, Uganda, Kenya and
Tanzania are developing countries facing economic difficulties including inadequate
infrastructure in the transport sector. Infrastructure rehabilitation and development requires
heavy investments. Hence, some external assistance to rehabilitate (roads, ports, railway) and
further develop the transport system could be timely and beneficial for the three countries.
Efforts could also be focused on increasing the value-added of exports. The share of
shipping costs in high value exports is likely to be lower than would be the case for low and
bulky commodities.

28
Uganda is now characterized by a relatively more liberal trade regime after rationalizing the
tariff structure and reducing the maximum tariff rate from 60% to 15%. Both financial and
commodity markets have been liberalized. This analysis shows that the average nominal rate
of protection due to applied tariff rates fell from 22% in 1994 to about 10% in 2001 with
corresponding average effective rates of protection of 35% in 1994 and 18% in 2001.
However, policy-induced barriers to trade is but one of the many constraints facing traders.
The effective rate of protection arising from transportation costs reduced slightly from 30%
in 1994 to 25% in the early 2000s. Clearly, this is still above the protection accorded to
import-competing producers from tariff measures.
There are no explicit taxes on Ugandan exports but the effective burden to exporters due to
costs of overland transportation only is high, although it has been reduced slightly from over
30% on average to about 28% in the early 2000s. However, air freight costs for perishable
exports are considerably higher, as much as 50% of the unit price. Uganda is attempting to
diversify into non-traditional agricultural exports, the majority of which are perishable
products. The limited analysis here indicates that high freight and other charges place
Ugandan exports at a competitive disadvantage relative to other exporters. Policy
implications are clear (some of which are outlined above), that non-policy induced barriers
such as transport system should be given attention as a way of minimizing implied
transaction costs and improving the competitiveness of Ugandan exports.

29
REFERENCES
Amjadi, A. and A. J. Yeats (1995), ‘Have transport costs contributed to the relative decline ofSub-Saharan African exports? Some preliminary empirical evidence’, Policy ResearchWorking Paper 1559, International Economics Division, International Trade Division,The World Bank, Washington, DC.
ADC, (1999), Competitive Handling of Fresh Fruits, Vegetables and Flowers at Entebbe Airport,Uganda’s Investment in Developing Export Agriculture (IDEA) Project, a paperpresented for the Horticultural Association of Uganda, the Uganda Flowers Associationand the Civil Aviation Authority, USAID Funded Project, September 1999.
Balassa, B. (1965), ‘Tariff protection in industrial countries: An evaluation’, Journal of PoliticalEconomy, Vol. 73: 573-594
Balassa, B., and Associates (1982), Development Strategies in Semi-industrial economies, A WorldBank Research Publication, The Johns Hopkins University Press
Clark, D. P. (1981), ‘Protection by international transport charges: An analysis by stage offabrication,’ Journal of Development Economics, Vol. 8: 339-345.
Clark X., Dollar D. and A. Micco (2001), Maritime transport costs and port efficiency, February2001.
Corden, W. M. (1966), ‘The structure of tariff system and the effective protection rate’,Journal of Political Economy, Vol. 74, No. 3: 221-237
Hummels D. (2001), Time as a Trade Barrier, Unpublished paper, Department of Economics,Purdue University.
Johnson H. G. (1969), ‘The theory of effective protection and preferences,’ Economica, Vol.36: 119-138
Jansson J. O. and D. Shneerson (1978), ‘The effective protection implicit in liner shippingfreight rates,’ Review of Economics and Statistics, Vol. 60: 569-573
Kasekende L., Abuka C and P. K. Asea (2001), Trade policy, manufacturing efficiency and Exportsin Uganda, www.aceg.org/unpublished.htm-52k
Kyamuhangire W. (1992), Post-harvest handling, Transport and Storage of Thirteen Crops: ExportersHandbook, Export Policy Analysis and Development Unit.
Limao and Venables (1999), Infrastructure, geographical disadvantage, and transport costs,The World Bank Policy Research Working Paper, 2257
Limao and Venables (2001), Infrastructure, geographical disadvantage, transport costs andtrade, The World Bank Economic Review, Vol. 15(3): 451-479
Milner C. (1996), ‘On natural and policy-induced sources of protection and traderegime/bias’, Weltwirtschaftliches Archiv, Vol. 132: 740-752
Milner C., Morrissey O. and N. Rudaheranwa (2000), “Policy and non-policy barriers totrade and implicit taxation of exports in Uganda,” The Journal of Development Studies, Vol.37(2): 67-90

30
Morrissey O., Rudaheranwa N. and L. Moller (2003), ‘Trade policies, performance and poverty inUganda,’ Uganda trade and poverty project (UTPP) Project funded by UDFID, UK.
Morrissey and Rudaheranwa, (1998), Ugandan trade policy and export performance inthe 1990s, DFID-TERP CREDIT discussion paper no.6. University of Nottingham
Murray T. (1977), Trade Preferences for Developing Countries, New York University
Naude W. (1999), Trade in Transport services: South Africa and the General Agreementon Trade in Services, a paper submitted to the Trade and Industrial Policy Secretariat (TIPS)
REPIM (2000), The impact of tariff changes requested by the Uganda Manufacturers Association,Research on Economic policy Implementation and Management, England.
Rudaheranwa N. (2000), Transport costs and protection for Ugandan industry, Chapter 14 in JalilianH., Tribe M. and J. Weiss (2000) Industrial development and policy in Africa: Issues of de-industrialization and development, Edward Elgar Publishing ltd. UK.
Rudaheranwa N. (1999), Transport costs and export trade of landlocked countries: Evidence fromUganda, Unpublished PhD Thesis, School of Economics, The University of Nottingham
Rudaheranwa N., Matovu F. and W. Musinguzi (2003), Enhancing Uganda’s Access toInternational Markets: A Focus on Quality, Chapter 5. in Wilson J. S. and V. O. Abiola (Eds),Standards & Global Trade: A Voice for Africa, The World Bank, Washington, D.C.
The Republic of Uganda (1996, 2002a and 2003), Statistical Abstract, Uganda Bureau ofStatistics, Entebbe
The Republic of Uganda (2002b), External Trade Statistics Bulletin, Uganda Bureau of Statistics,Entebbe, Vol. 1 (2002)
The Republic of Uganda (various series), Background to the Budget, Ministry of Finance, Planningand Economic Development, Kampala
Tovar B., Jara-Diaz and L. Trujillo (2003), “A Multioutput Cost Function for PortsTerminals: Some Guidelines for Regulation,” World Bank Policy Research Working Paper, 3151
Tsakok, I. (1990), Agricultural price policy: A practitioner’s guide to partial equilibrium analysis,Cornell University Press Ithaca-New York.
UNCTAD (2003), Trade Performance and Commodity Dependence, United Nations, Geneva.
Wilson, J. S., Mann C. L. and T. Otsuki (2004), “Assessing the Potential Benefits of TradeFacilitation: A Global Perspective,” World Bank Policy Research Working Paper, 3224.
World Bank (2001), Global Development Prospects 2002: Making services work for the world’s poor,Washington, DC.
World Bank (2003), Global Development Prospects 2004: Realizing the development promise of the DohaAgenda Washington, DC.
World Bank (1994), International transport in East Africa: A discussion Brief, The Great LakesCorridor Study Washington, DC.
World Trade Organization (WTO), (1995 and 2002), Trade Policy Review: for Uganda, Geneva.
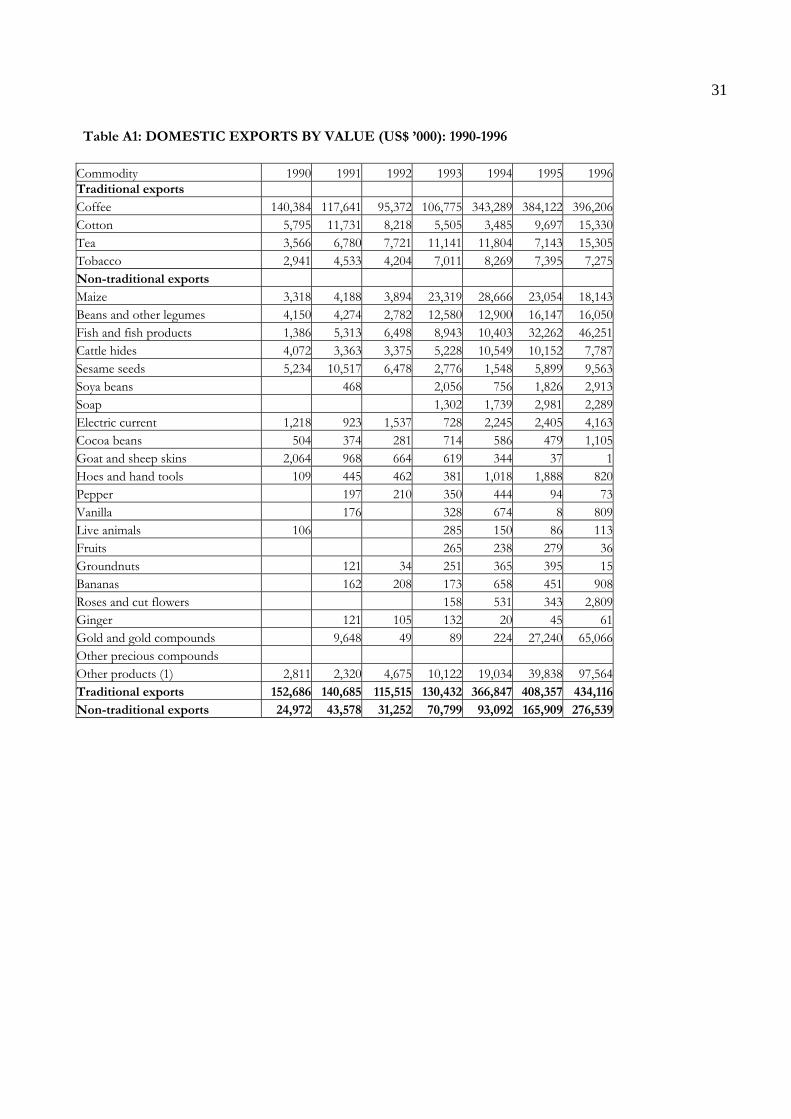
31
Table A1: DOMESTIC EXPORTS BY VALUE (US$ ’000): 1990-1996
Commodity 1990 1991 1992 1993 1994 1995 1996Traditional exports Coffee 140,384 117,641 95,372 106,775 343,289 384,122 396,206Cotton 5,795 11,731 8,218 5,505 3,485 9,697 15,330Tea 3,566 6,780 7,721 11,141 11,804 7,143 15,305Tobacco 2,941 4,533 4,204 7,011 8,269 7,395 7,275Non-traditional exports Maize 3,318 4,188 3,894 23,319 28,666 23,054 18,143Beans and other legumes 4,150 4,274 2,782 12,580 12,900 16,147 16,050Fish and fish products 1,386 5,313 6,498 8,943 10,403 32,262 46,251Cattle hides 4,072 3,363 3,375 5,228 10,549 10,152 7,787Sesame seeds 5,234 10,517 6,478 2,776 1,548 5,899 9,563Soya beans 468 2,056 756 1,826 2,913Soap 1,302 1,739 2,981 2,289Electric current 1,218 923 1,537 728 2,245 2,405 4,163Cocoa beans 504 374 281 714 586 479 1,105Goat and sheep skins 2,064 968 664 619 344 37 1Hoes and hand tools 109 445 462 381 1,018 1,888 820Pepper 197 210 350 444 94 73Vanilla 176 328 674 8 809Live animals 106 285 150 86 113Fruits 265 238 279 36Groundnuts 121 34 251 365 395 15Bananas 162 208 173 658 451 908Roses and cut flowers 158 531 343 2,809Ginger 121 105 132 20 45 61Gold and gold compounds 9,648 49 89 224 27,240 65,066Other precious compounds Other products (1) 2,811 2,320 4,675 10,122 19,034 39,838 97,564Traditional exports 152,686 140,685 115,515 130,432 366,847 408,357 434,116Non-traditional exports 24,972 43,578 31,252 70,799 93,092 165,909 276,539

32
Table A2: DOMESTIC EXPORTS BY VALUE (US$ ’000): 1997-2002
Commodity 1997 1998 1999 2000 2001 2002Traditional exports Coffee 309,362 295,666 287,958 125,316 97,652 109,200Cotton 29,197 7,691 17,408 22,088 13,434 26,150Tea 30,483 28,181 21,425 37,889 30,031 29,800Tobacco 12,576 22,332 14,673 26,889 32,096 51,100Non-traditional exports Maize 15,063 9,359 5,291 2,437 18,339 10,609Beans and other legumes 11,875 6,451 8,754 4,454 2,354 3,283Fish and fish products 27,864 39,879 24,837 30,818 78,233 87,945Cattle hides 10,020 6,088 2,967 12893 25,405 9,810Sesame seeds 1,448 11 1,420 747 796 510Soya beans 236 29 0 Soap 2,273 1,727 1,960 1,639 2,700 3,434Electric current 11,688 11,741 13,209 18,634 10,554 15,910Cocoa beans 1,300 1,429 1,474 1,491 19,23 2,023Goat and sheep skins 0 16 0 Hoes and hand tools 262 247 242 334 359Pepper 81 117 692 354 397Vanilla 4 1,260 0 Live animals 30 75 58 0 199Fruits 314 386 111 733 Groundnuts 21 118 228 14 26Bananas 52 257 473 983 672Roses and cut flowers 3,592 7,502 7,328 9,912 14,750 17,828Ginger 23 21 0 Gold and gold compounds 80,615 19,493 33,485 43,285 49,293 60,342Other precious compounds 2,682 10,963 12,656Other products (1) 46,249 76,673 32,075 50,899 47,379 73,465Traditional exports 381,618 353,870 341,464 211,341 173,213Non-traditional exports 213,010 182,882 137,286 190,229 278,161 285,528

33
Table A3: UGANDA TRANSPORT COSTS AND TRANSIT TIMES IN 2003
Agent RoadCosts (US$) Transit time
Imports Exports Imports Exports20ft 40ft 20ft 40ft
Transami 1,850 3,100 1,200 1,600 12-15days 4-7daysTanzania Harbour Authority* 90 100 180 270Kenya Ports Authority 14-16days 13*** daysP&O Ned Lloyd 1,950 2,750Kenfreight 3,200 1,400 2,800 15-21days 8daysRailways (Northern Corridor)Mombasa/Kampala 1270 2540 1225 2250 18 - 21 days**
Railways (Central Corridor)Kampala/Dar-es-Salaam 1150 2305 743 1485
Note: * These are port and other handling charges** This information was provided by one shipping company (Transami) and should be regarded as
indicative but not average.*** The information available from the Kenya Ports Authority indicates that the overall average
transit time both for export and import rail shipments is 14 days for Mombasa-Kampala; 16 daysfor Mombasa-Kampala (via Tororo) and 13 days Mombasa-Kampala (via wagon ferry throughKisumu to Port Bell). More generally, the transit times may range between 5 and 46 days incertain cases but the majority of the containerised cargo take a range of 8 to 12 days. Thesetransit times were derived from the rail study conducted in August 2003 by Kenya PortsAuthority and covering about 377 TEU containers.
Table A4: Transport Costs (US$) over time from TRANSAMI Shipping Company
Year Imports 20ft 40ft2003 Up to 15/30 tons gross weight 1,850 3,100
Per extra ton from 15 to 18 tons gross weight 1152000 Up to 15/30 tons gross weight 2,000 3,650
Per extra ton from 15 to 18 tons gross weight 1101999 Up to 15/30 tons gross weight 2,150 3,750
Per extra ton from 15 to 18 tons gross weight 1101998 Up to 15/30 tons gross weight 2,400 4,000
Per extra ton from 15 to 18 tons gross weight 1501997 Up to 15/30 tons gross weight 3,000 4,500
Per extra ton from 15 to 18 tons gross weight 1501996 Up to 15/30 tons gross weight 3,500 5,200
Per extra ton from 15 to 18 tons gross weight 2201995 Up to 15/30 tons gross weight 3,750 5,700
Per extra ton from 15 to 18 tons gross weight 250
Source: Transami (2003)

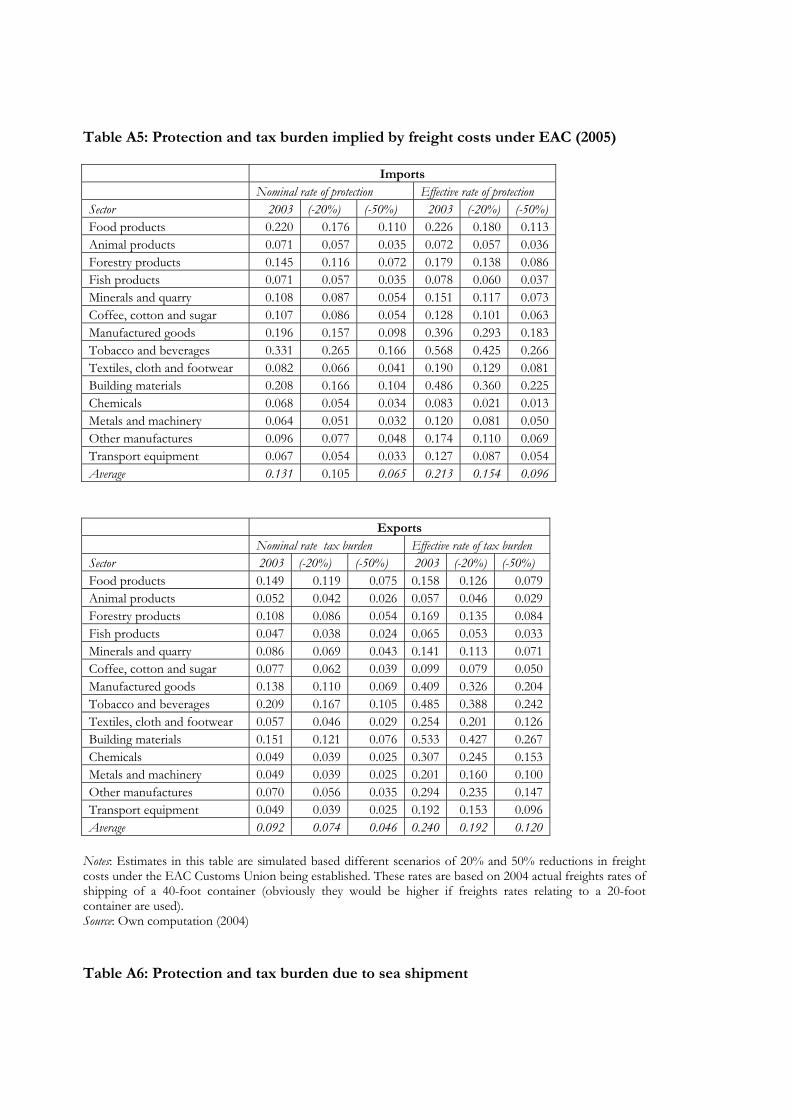
Table A5: Protection and tax burden implied by freight costs under EAC (2005)
ImportsNominal rate of protection Effective rate of protection
Sector 2003 (-20%) (-50%) 2003 (-20%) (-50%)Food products 0.220 0.176 0.110 0.226 0.180 0.113Animal products 0.071 0.057 0.035 0.072 0.057 0.036Forestry products 0.145 0.116 0.072 0.179 0.138 0.086Fish products 0.071 0.057 0.035 0.078 0.060 0.037Minerals and quarry 0.108 0.087 0.054 0.151 0.117 0.073Coffee, cotton and sugar 0.107 0.086 0.054 0.128 0.101 0.063Manufactured goods 0.196 0.157 0.098 0.396 0.293 0.183Tobacco and beverages 0.331 0.265 0.166 0.568 0.425 0.266Textiles, cloth and footwear 0.082 0.066 0.041 0.190 0.129 0.081Building materials 0.208 0.166 0.104 0.486 0.360 0.225Chemicals 0.068 0.054 0.034 0.083 0.021 0.013Metals and machinery 0.064 0.051 0.032 0.120 0.081 0.050Other manufactures 0.096 0.077 0.048 0.174 0.110 0.069Transport equipment 0.067 0.054 0.033 0.127 0.087 0.054Average 0.131 0.105 0.065 0.213 0.154 0.096
ExportsNominal rate tax burden Effective rate of tax burden
Sector 2003 (-20%) (-50%) 2003 (-20%) (-50%)Food products 0.149 0.119 0.075 0.158 0.126 0.079Animal products 0.052 0.042 0.026 0.057 0.046 0.029Forestry products 0.108 0.086 0.054 0.169 0.135 0.084Fish products 0.047 0.038 0.024 0.065 0.053 0.033Minerals and quarry 0.086 0.069 0.043 0.141 0.113 0.071Coffee, cotton and sugar 0.077 0.062 0.039 0.099 0.079 0.050Manufactured goods 0.138 0.110 0.069 0.409 0.326 0.204Tobacco and beverages 0.209 0.167 0.105 0.485 0.388 0.242Textiles, cloth and footwear 0.057 0.046 0.029 0.254 0.201 0.126Building materials 0.151 0.121 0.076 0.533 0.427 0.267Chemicals 0.049 0.039 0.025 0.307 0.245 0.153Metals and machinery 0.049 0.039 0.025 0.201 0.160 0.100Other manufactures 0.070 0.056 0.035 0.294 0.235 0.147Transport equipment 0.049 0.039 0.025 0.192 0.153 0.096Average 0.092 0.074 0.046 0.240 0.192 0.120
Notes: Estimates in this table are simulated based different scenarios of 20% and 50% reductions in freightcosts under the EAC Customs Union being established. These rates are based on 2004 actual freights rates ofshipping of a 40-foot container (obviously they would be higher if freights rates relating to a 20-footcontainer are used).Source: Own computation (2004)
Table A6: Protection and tax burden due to sea shipment

36
Protection(1994) Protection(2000)NRP ERP NRP ERP
Food products 0.227 0.232 0.105 0.106Animal products 0.081 0.081 0.105 0.107Forestry products 0.148 0.170 0.225 0.269Fish products 0.075 0.074 0.225 0.252Minerals and quarry 0.117 0.155 0.195 0.267Coffee, cotton and sugar 0.115 0.134 0.100 0.115Manufactured goods 0.195 0.334 0.130 0.205Tobacco and beverages 0.306 0.454 0.160 0.244Textiles, cloth and footwear 0.108 0.206 0.170 0.377Building materials 0.226 0.461 0.075 0.035Chemicals 0.065 -0.034 0.110 0.185Metals and machinery 0.071 0.096 0.100 0.162Other manufactures 0.096 0.099 0.150 0.286Transport equipment 0.072 0.099 0.110 0.183Average 0.136 0.183 0.140 0.199
Taxation (1994) Taxation (2000)NRP ERP NRP ERP
Food products 0.179 0.192 0.105 0.113Animal products 0.062 0.070 0.105 0.116Forestry products 0.130 0.214 0.225 0.352Fish products 0.056 0.086 0.225 0.297Minerals and quarry 0.103 0.176 0.195 0.320Coffee, cotton and sugar 0.092 0.121 0.100 0.132Manufactured goods 0.166 0.539 0.130 0.421Tobacco and beverages 0.251 0.631 0.160 0.379Textiles, cloth and footwear 0.069 0.405 0.170 0.702Building materials 0.181 0.696 0.075 0.391Chemicals 0.059 0.455 0.110 0.551Metals and machinery 0.059 0.275 0.100 0.407Other manufactures 0.084 0.408 0.150 0.558Transport equipment 0.059 0.260 0.110 0.421Average 0.111 0.323 0.140 0.368
Notes: Extra caution is needed while interpreting the 2000 estimates as they are crude estimate based onindicative rather than actual freight costs.Source: Information used to 2000 ERP estimates regarding sea shipment is adapted from Kiringai (2004)while 1994 ERP estimates are extracted in Milner, Morrissey and Rudaheranwa (2000).
Appendix B: Deflating technical coefficients
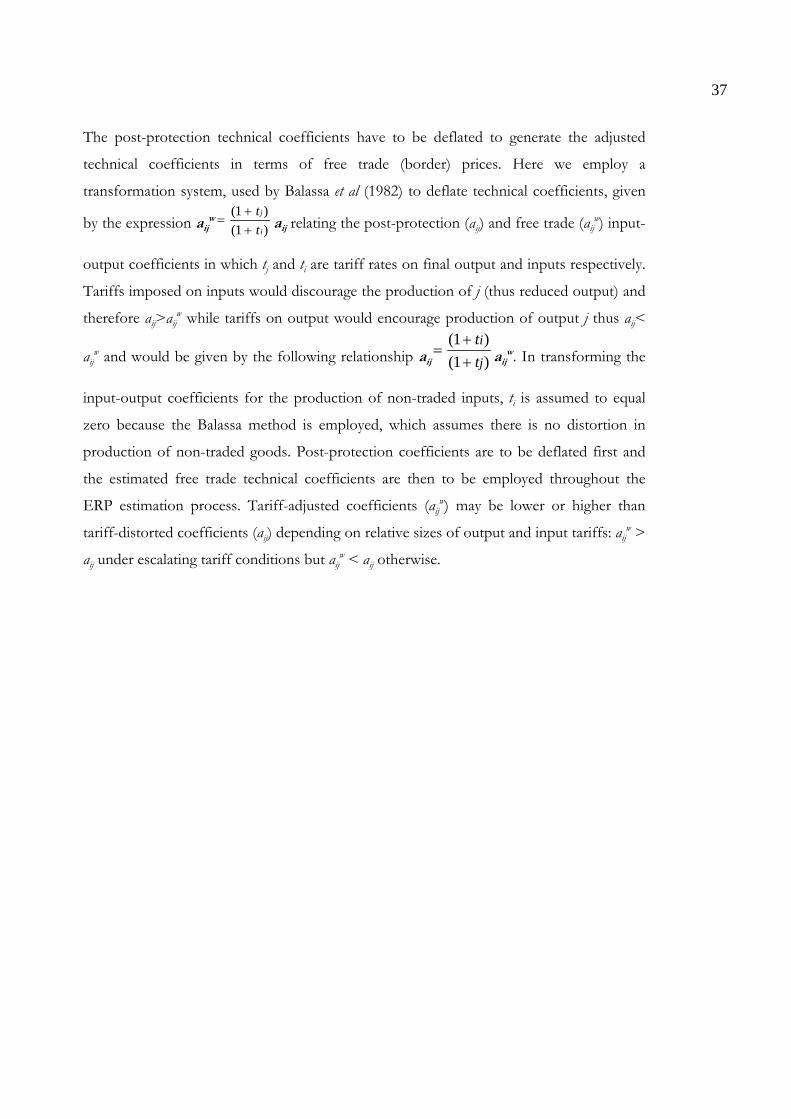
37
The post-protection technical coefficients have to be deflated to generate the adjusted
technical coefficients in terms of free trade (border) prices. Here we employ a
transformation system, used by Balassa et al (1982) to deflate technical coefficients, given
by the expression aijw
)1()1(
i
j
tt
++
= aij relating the post-protection (aij) and free trade (aijw) input-
output coefficients in which tj and ti are tariff rates on final output and inputs respectively.
Tariffs imposed on inputs would discourage the production of j (thus reduced output) and
therefore aij>aijw while tariffs on output would encourage production of output j thus aij<
aijw and would be given by the following relationship aij
=++
( )( )11
tti
j aijw. In transforming the
input-output coefficients for the production of non-traded inputs, ti is assumed to equal
zero because the Balassa method is employed, which assumes there is no distortion in
production of non-traded goods. Post-protection coefficients are to be deflated first and
the estimated free trade technical coefficients are then to be employed throughout the
ERP estimation process. Tariff-adjusted coefficients (aijw) may be lower or higher than
tariff-distorted coefficients (aij) depending on relative sizes of output and input tariffs: aijw >
aij under escalating tariff conditions but aijw < aij otherwise.


![The Round Trip E ect: Endogenous Transport Costs and ...1 Introduction \If transport costs varied with volume of trade, the [iceberg transport costs] would not be constants. Realistically,](https://static.fdocuments.net/doc/165x107/5fee33565d72df536c477535/the-round-trip-e-ect-endogenous-transport-costs-and-1-introduction-if-transport.jpg)

