Trade Liberalisation, the Balance of Payments and … · 2 Trade Liberalisation, the Balance of...
34
Trade Liberalisation, the Balance of Payments and Growth in Latin America Penélope Pacheco-López and A.P. Thirlwall University of Kent Abstract The broad purpose of trade liberalisation is to raise the rate of growth of countries on a sustainable basis, consistent with the achievement of other macroeconomic objectives. In this paper we consider whether trade liberalisation in seventeen countries of Latin America has improved the trade-off between GDP growth and the trade balance, allowing the countries to grow faster without sacrificing foreign exchange. We find that in the aftermath of liberalisation, the majority of countries did grow faster, but at the expense of a deteriorating trade balance. Testing formally for the impact of trade liberalisation in a full model of trade balance determination, we find that only in Chile and Venezuela has the trade-off unequivocally improved. In other countries there has been a significant deterioration or no change. Nine out of the seventeen countries have grown faster post-liberalisation than pre-liberalisation but, except for Chile and Venezuela, at the expense of a wider trade or current account deficit. JEL Classification: C21, C22, F13, F32, F43. Keywords: Latin America; Trade Liberalisation; Growth; Balance of Payments. Acknowledgments: The authors are grateful to Bill Collier for statistical advice, and Professor Thirlwall is grateful to the Leverhulme Trust for the award of an Emeritus Fellowship which provided financial support for the research project. Address for Correspondence: Professor A.P. Thirlwall, Department of Economics, Keynes College, University of Kent, Canterbury, Kent, CT2 7NP E-mail: [email protected]
Transcript of Trade Liberalisation, the Balance of Payments and … · 2 Trade Liberalisation, the Balance of...
Trade Liberalisation, the Balance of Payments and Growth in Latin America
Penélope Pacheco-López and A.P. Thirlwall
University of Kent
Abstract
The broad purpose of trade liberalisation is to raise the rate of growth of countries on a sustainable basis, consistent with the achievement of other macroeconomic objectives. In this paper we consider whether trade liberalisation in seventeen countries of Latin America has improved the trade-off between GDP growth and the trade balance, allowing the countries to grow faster without sacrificing foreign exchange. We find that in the aftermath of liberalisation, the majority of countries did grow faster, but at the expense of a deteriorating trade balance. Testing formally for the impact of trade liberalisation in a full model of trade balance determination, we find that only in Chile and Venezuela has the trade-off unequivocally improved. In other countries there has been a significant deterioration or no change. Nine out of the seventeen countries have grown faster post-liberalisation than pre-liberalisation but, except for Chile and Venezuela, at the expense of a wider trade or current account deficit.
JEL Classification: C21, C22, F13, F32, F43.
Keywords: Latin America; Trade Liberalisation; Growth; Balance of Payments.
Acknowledgments: The authors are grateful to Bill Collier for statistical advice, and Professor Thirlwall is grateful to the Leverhulme Trust for the award of an Emeritus Fellowship which provided financial support for the research project. Address for Correspondence: Professor A.P. Thirlwall, Department of Economics, Keynes College, University of Kent, Canterbury, Kent, CT2 7NP E-mail: [email protected]
2
Trade Liberalisation, the Balance of Payments and Growth in Latin America
Penélope Pacheco-López and A.P. Thirlwall University of Kent
1. Introduction
Over the last twenty to thirty years, most countries in Latin America have
implemented extensive programmes of trade liberalisation, either voluntarily or under
pressure from multilateral agencies such as the World Bank, the IMF and WTO. The
broad purpose of reducing barriers to imports and exports is to improve the overall
macroeconomic performance of an economy, and particularly to achieve a faster rate
of growth of output (GDP) and living standards consistent with a sustainable balance
of payments and low inflation. The main purpose of this paper is to examine whether
this has been the outcome of the liberalisation process in a sample of seventeen Latin
American countries over the period 1977 to 2002, taking and comparing the years
before and after liberalisation.1 The focus is particularly on the impact of trade
liberalisation on the balance of trade (visible exports minus visible imports) on the
hypothesis that if the trade balance improves this helps to relax a balance of payments
(or foreign exchange) constraint on growth. Contra wise, if the balance of trade
deteriorates, this can act as a constraint on growth because there is a limit to which
countries can sustain deficits and accumulate foreign debt.2 It has to be said in
advance that an immediate worsening of the foreign exchange position is a distinct
possibility given that it is much easier for imports to respond to a reduction in trade
barriers than it is for domestic producers to switch resources from producing goods 1 See Table 1 later for the dates of liberalisation. The dates are taken largely from Sachs and Warner (1995) and corroborated by information from the IMF, World Bank and WTO. See Appendix 1which describes the liberalisation process in each of the years. 2 In the econometric estimations (as opposed to the descriptive analysis), we do not focus directly on the current account, firstly because trade liberalisation (as opposed to financial liberalisation) does not impact directly on invisible items such as remittances, net tourist earnings and net factor payments abroad, and secondly because it is clear from the accounts that many invisible items are highly erratic (see IMF, International Financial Statistics, various issues).
3
for the home market to exports. Taylor and Vos (2002) remark in their survey of
balance of payments liberalisation in a selection of Latin American and Caribbean and
countries that “higher import demand and typically lagging exports meant that the
trade deficit went up for a given output level” and “higher import propensities offset
the growth impacts of export expansion that nearly all countries witnessed. Although
exports gained importance as a source of growth…the gains do not seem to have been
so strong as originally supposed by advocates of liberalisation”. But there could be
lags in the system with the balance of payments first deteriorating and then
improving. We later test for this.
In general, the economic record of Latin American countries in the era since
liberalisation has not been good. Rodrik (2004) remarks in his WIDER lecture that
“Latin America [during the 1990s] grew more slowly not only compared to other parts
of the world … but also compared to its own performance in the 1960s and 1970s.
That is a striking empirical fact, the importance of which is hard to downplay. After
all, Latin America of the 1960s and 1970s is a region of import substitution,
macroeconomic populism, and protectionism, while the Latin America of the 1990s is
a region of openness, privatisation and liberalisation. The cold fact is that per capita
economic growth performance has been abysmal during the 1990s by any standards”.
Rodrik examines 83 growth accelerations3 across the world over the period 1957 and
1992 and finds that only 15 per cent were preceded by economic liberalisation, and
that only 18 per cent of significant liberalisations produced growth acceleration.
3 A growth acceleration is defined as a difference of 2 percentage points or more between eight years before the event and eight years after, with a minimum post-acceleration growth rate of 3.5 per cent.

4
We tackle this important topic of the relationship between trade liberalisation, the
balance of payments and growth in a number of different ways. Firstly, some of the
analysis is qualitative and non-parametric, e.g. looking at the growth performance and
the balance of trade (and the current account) of countries five years before
liberalisation and five years after. Secondly, we attempt to identify the trade-off
between GDP growth and the trade balance as a ratio of GDP. Normally, faster output
growth sucks in imports and worsens the trade balance ratio, which then imposes a
constraint on future growth, unless exports rise to compensate. Thirdly, we test
whether trade liberalisation has improved the growth /trade-balance ratio. Fourthly,
we then test whether any improvement in the trade-off (or deterioration, as the case
may be) is robust with respect to the introduction of control variables in the simple
trade-off equation, such as changes in the real exchange rate and the growth of world
income. We also look for lags in the relationship between liberalisation and the trade
balance. When Greenaway et al. (2002) examined the relationship between trade
liberalisation and economic growth in a sample of 73 countries over the period 1975
to 1993, they found a J-curve relationship with growth first deteriorating and then
improving. They gave no explanation, but one possibility is that the trade balance first
deteriorates, necessitating adjustment, and then improves. We test for this.
Apart from the descriptive ‘before and after’ analysis, all these issues are explored
firstly taking all countries together, using both panel and time-series/cross section
estimation techniques, and secondly taking each of the 17 countries separately using
time series analysis over the period 1977 to 2002.
5
Using these various approaches and techniques of analysis, a picture is painted of
what the consequences of trade liberalisation have been for the balance of trade and
growth of the 17 countries considered, and which countries seem to have benefited,
and which have not. If it is found that the balance of trade has deteriorated and this
has constrained growth performance, this has lessons for the practice of liberalisation,
and particularly for the sequencing of liberalisation to ensure that a semblance of
balance is maintained between the growth of exports and the growth of imports if
trade liberalisation is to be successful.
Some work on the above topic has already been undertaken by the present authors.
Santos-Paulino and Thirlwall (2004) take a panel of 22 developing countries over the
period of the 1970s, 1980s and 1990s and estimate the impact of trade liberalisation
on export growth, import growth , the balance of trade and current account of the
balance of payments, using ordinary least squares and general methods of moments
(GMM) as estimators. On average, it was found that liberalisation raised export
growth by 2 percentage points and import growth by 6 percentage points. As a
consequence, the ratio of the trade balance to GDP deteriorated by 2 percentage
points, and the ratio of the current account to GDP deteriorated by 0.8 percentage
points. Nine of the 22 countries were Latin American. Using a time-series/cross
section estimator, it was found for the Latin American countries separately that the
trade balance ratio deteriorated by 1.51 percentage points and the current account ratio
by 1.16 percentage points. The fact that the current account deteriorated by less than
the trade balance indicates that trade liberalisation either improved the invisible trade
balance (which is unlikely) and/or growth had to be constrained (which is more likely)
for the current account to be sustainable and financed.

6
Pacheco-López and Thirlwall (2004) and Pacheco-López (2005) examine explicitly
the impact of trade liberalisation in Mexico in 1985/86, and in 1994 when the country
joined NAFTA. Imports responded faster than exports in the 1985/86 period, and
there is evidence of a structural break in the trade balance, but no significant effect
was found as a result of joining NAFTA.4 What is striking, however, is the increase in
the income elasticity of demand for imports in the post-liberalisation period; also
found by Moreno-Brid (2001). In the pre-liberalisation period 1973-1986, the
elasticity averaged 1.4; in the period 1986-1999, it averaged 3.2. By contrast, export
growth hardly changed, averaging 9 per cent before 1986 and 10 per cent per annum
after. As a consequence, Mexico’s sustainable growth rate, applying Thirlwall’s
balance of payments constrained growth model (Thirlwall, 1979), is estimated to have
halved post-1986.
2. Growth, the Trade Balance and the Current Account Balance Before and After Liberalisation.
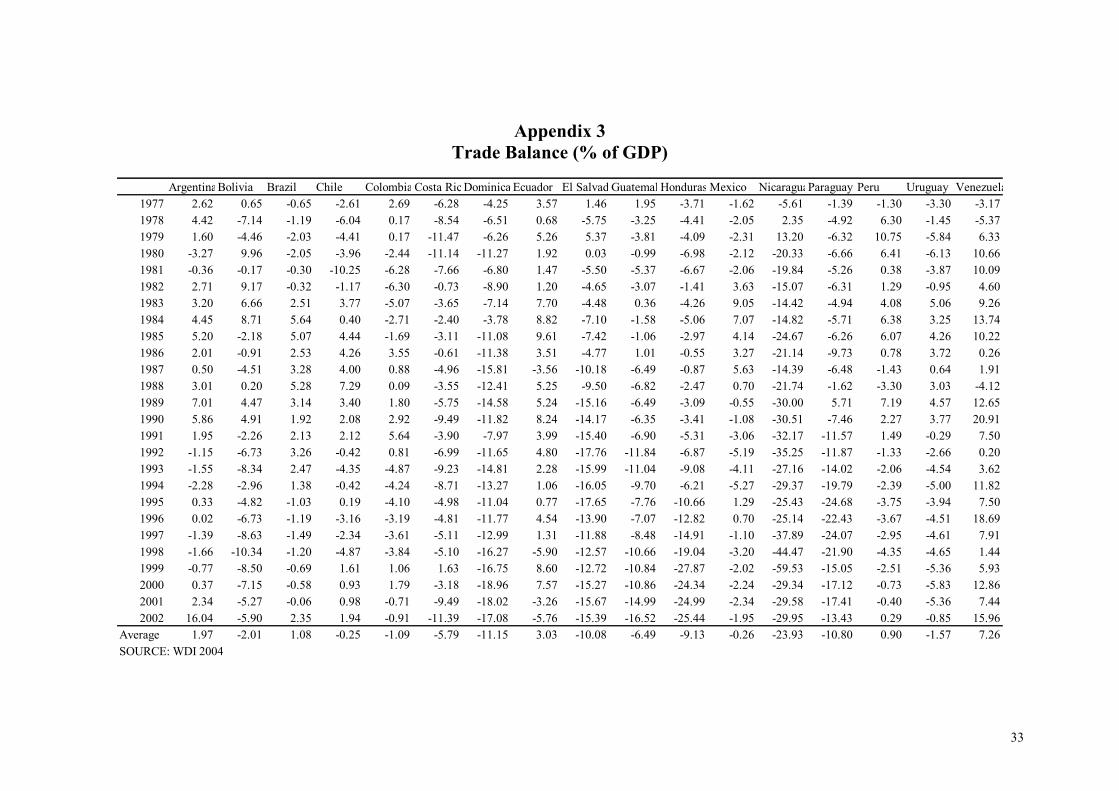
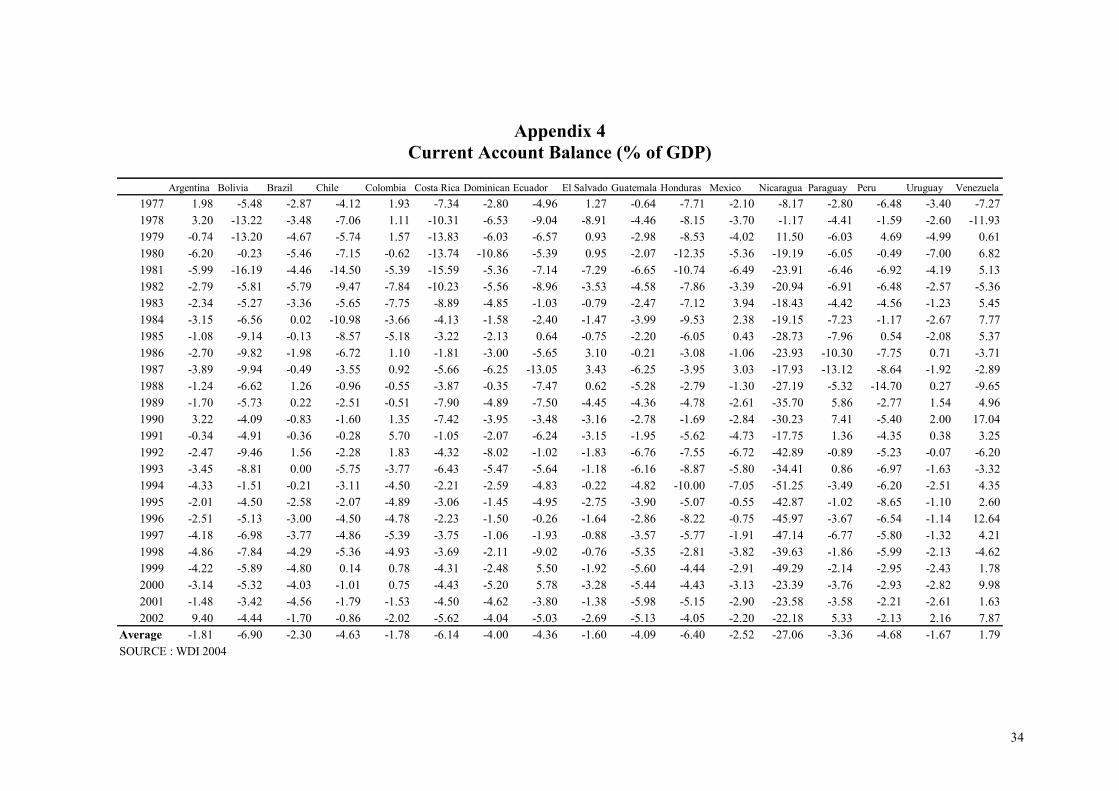
We start the analysis in a simple way by comparing the average growth of GDP; the
average ratio of the trade balance to GDP, and the average ratio of the current account
balance to GDP, five years before the date of liberalisation and five years after (see
Appendices 2, 3 and 4 for the full data set). The ‘before and after’ comparison has the
advantage of simplicity, but also has the weakness that no control variables are
introduced into the analysis, so that any changes, favourable or unfavourable, cannot
be attributed to liberalisation alone. Nonetheless, it is still an interesting factual
question to answer of whether some countries became better off on all criteria; did
4 This is because virtually all trade barriers between Mexico and the United States had already been removed. The major impact of NAFTA was on foreign direct investment into Mexico.

7
some countries become worse off on all criteria, or are most countries ‘in between’
with faster growth and a worse balance of payments or a better balance of payments
and slower growth?
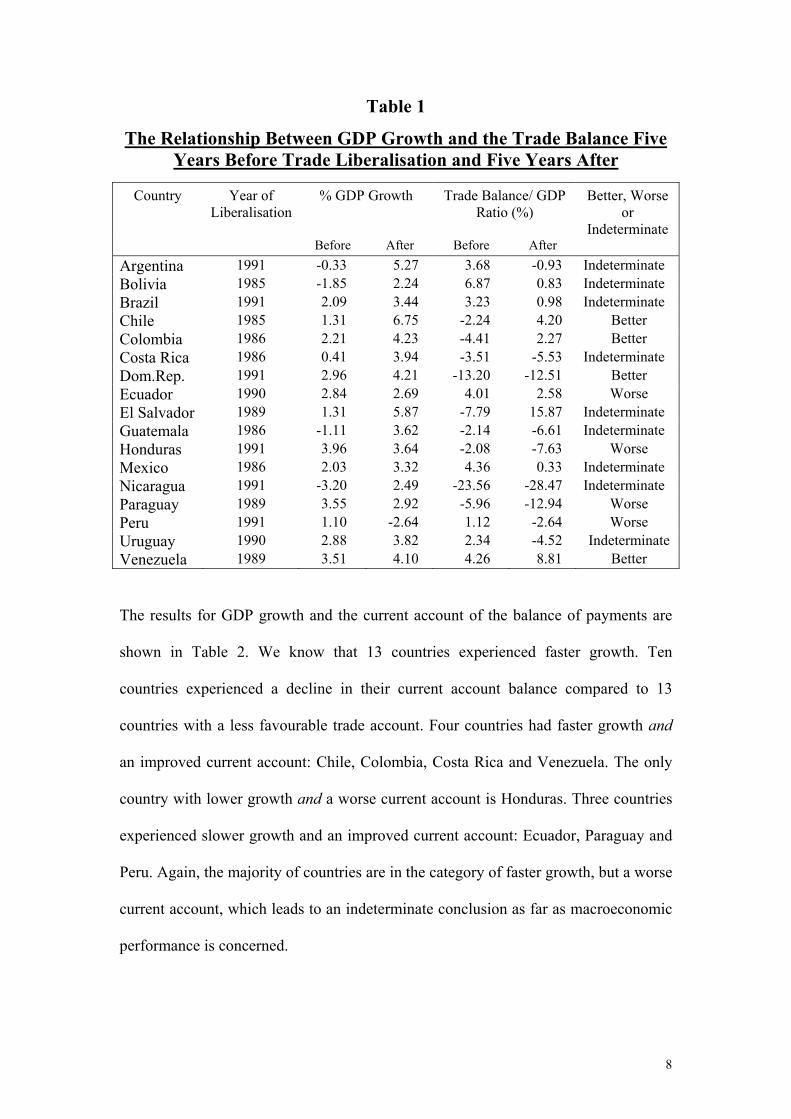
The results of looking at growth and the trade balance ratio are shown in Table 1.
Thirteen out of the 17 countries had faster average growth rates after liberalisation
than before, and 13 countries (not all the same) had worse trade deficits. Four
countries experienced faster growth and a more favourable trade balance: Chile,
Colombia, the Dominican Republic and Venezuela. Four countries experienced
slower growth and a worse trade deficit: Honduras, Ecuador, Paraguay, and Peru.
Most of the countries experienced faster growth but with a worse trade balance. For
this majority of countries, it is not possible to say whether trade liberalisation has been
associated with a better or worse macroeconomic performance without knowing
whether the trade-off between growth and the balance of trade improved or not. Part
of the deterioration in the trade balance could have come from the improved growth
performance itself, but trade liberalisation may also have worsened the trade balance
autonomously such as to worsen the trade-off between growth and the balance of
trade with implications for the sustainability of growth. This issue is examined
econometrically in Section 3.
8
Table 1
The Relationship Between GDP Growth and the Trade Balance Five Years Before Trade Liberalisation and Five Years After
Country Year of Liberalisation
% GDP Growth Trade Balance/ GDP Ratio (%)
Better, Worse or
Indeterminate Before After Before After Argentina 1991 -0.33 5.27 3.68 -0.93 Indeterminate Bolivia 1985 -1.85 2.24 6.87 0.83 Indeterminate Brazil 1991 2.09 3.44 3.23 0.98 Indeterminate Chile 1985 1.31 6.75 -2.24 4.20 Better Colombia 1986 2.21 4.23 -4.41 2.27 Better Costa Rica 1986 0.41 3.94 -3.51 -5.53 Indeterminate Dom.Rep. 1991 2.96 4.21 -13.20 -12.51 Better Ecuador 1990 2.84 2.69 4.01 2.58 Worse El Salvador 1989 1.31 5.87 -7.79 15.87 Indeterminate Guatemala 1986 -1.11 3.62 -2.14 -6.61 Indeterminate Honduras 1991 3.96 3.64 -2.08 -7.63 Worse Mexico 1986 2.03 3.32 4.36 0.33 Indeterminate Nicaragua 1991 -3.20 2.49 -23.56 -28.47 Indeterminate Paraguay 1989 3.55 2.92 -5.96 -12.94 Worse Peru 1991 1.10 -2.64 1.12 -2.64 Worse Uruguay 1990 2.88 3.82 2.34 -4.52 Indeterminate Venezuela 1989 3.51 4.10 4.26 8.81 Better
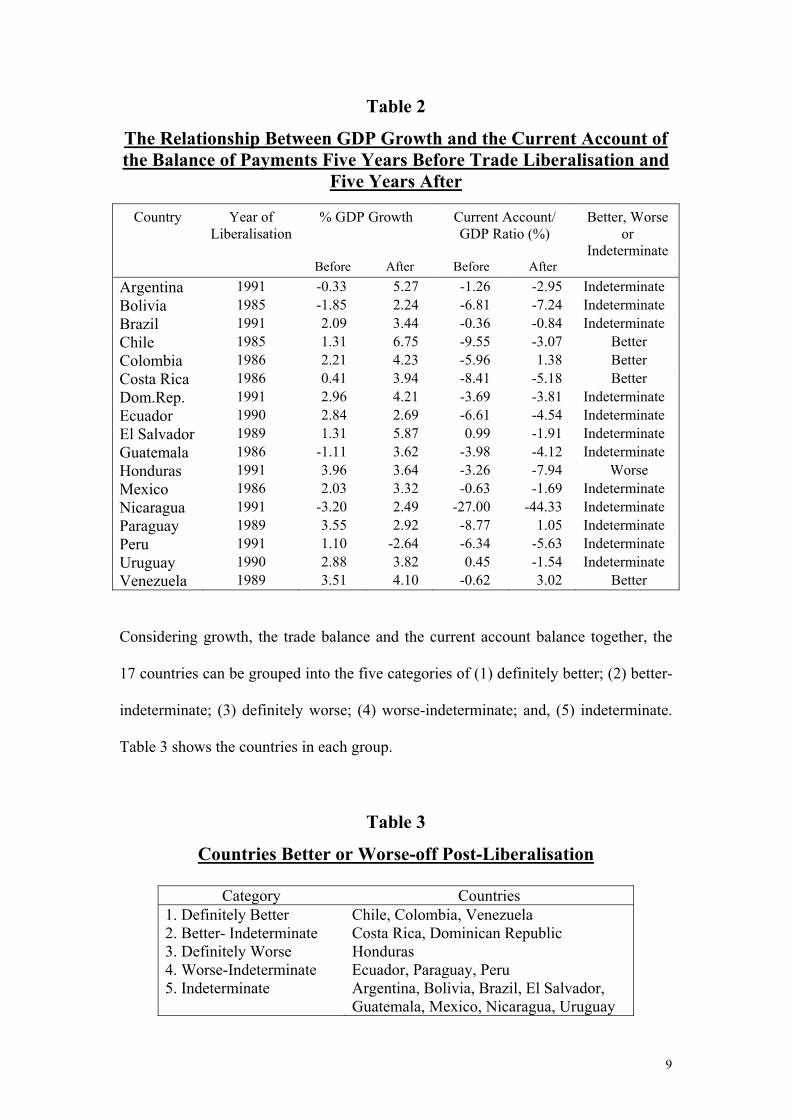
The results for GDP growth and the current account of the balance of payments are
shown in Table 2. We know that 13 countries experienced faster growth. Ten
countries experienced a decline in their current account balance compared to 13
countries with a less favourable trade account. Four countries had faster growth and
an improved current account: Chile, Colombia, Costa Rica and Venezuela. The only
country with lower growth and a worse current account is Honduras. Three countries
experienced slower growth and an improved current account: Ecuador, Paraguay and
Peru. Again, the majority of countries are in the category of faster growth, but a worse
current account, which leads to an indeterminate conclusion as far as macroeconomic
performance is concerned.
9
Table 2
The Relationship Between GDP Growth and the Current Account of the Balance of Payments Five Years Before Trade Liberalisation and
Five Years After
Country Year of Liberalisation
% GDP Growth Current Account/ GDP Ratio (%)
Better, Worse or
Indeterminate Before After Before After Argentina 1991 -0.33 5.27 -1.26 -2.95 Indeterminate Bolivia 1985 -1.85 2.24 -6.81 -7.24 Indeterminate Brazil 1991 2.09 3.44 -0.36 -0.84 Indeterminate Chile 1985 1.31 6.75 -9.55 -3.07 Better Colombia 1986 2.21 4.23 -5.96 1.38 Better Costa Rica 1986 0.41 3.94 -8.41 -5.18 Better Dom.Rep. 1991 2.96 4.21 -3.69 -3.81 Indeterminate Ecuador 1990 2.84 2.69 -6.61 -4.54 Indeterminate El Salvador 1989 1.31 5.87 0.99 -1.91 Indeterminate Guatemala 1986 -1.11 3.62 -3.98 -4.12 Indeterminate Honduras 1991 3.96 3.64 -3.26 -7.94 Worse Mexico 1986 2.03 3.32 -0.63 -1.69 Indeterminate Nicaragua 1991 -3.20 2.49 -27.00 -44.33 Indeterminate Paraguay 1989 3.55 2.92 -8.77 1.05 Indeterminate Peru 1991 1.10 -2.64 -6.34 -5.63 Indeterminate Uruguay 1990 2.88 3.82 0.45 -1.54 Indeterminate Venezuela 1989 3.51 4.10 -0.62 3.02 Better
Considering growth, the trade balance and the current account balance together, the
17 countries can be grouped into the five categories of (1) definitely better; (2) better-
indeterminate; (3) definitely worse; (4) worse-indeterminate; and, (5) indeterminate.
Table 3 shows the countries in each group.
Table 3
Countries Better or Worse-off Post-Liberalisation
Category Countries 1. Definitely Better Chile, Colombia, Venezuela 2. Better- Indeterminate Costa Rica, Dominican Republic 3. Definitely Worse Honduras 4. Worse-Indeterminate Ecuador, Paraguay, Peru 5. Indeterminate Argentina, Bolivia, Brazil, El Salvador,
Guatemala, Mexico, Nicaragua, Uruguay
10
There are six countries in the better or better-indeterminate category; five in the worse
or worse-indeterminate category, and nine in the indeterminate category. To derive
more definitive conclusions on the impact of trade liberalisation, particularly for those
countries in the indeterminate category, we need to know whether the trade-off
between growth and the trade balance has improved or not.
3. The Trade-off Between Growth and the Trade Balance and the Impact of Liberalisation Using Pooled Data
To undertake the trade-off analysis, the data are first pooled and four issues are
explored.5 Firstly, what does the trade-off between growth and the trade balance look
like: how well is it defined? All the observations of GDP growth and the trade balance
ratio are plotted on a scatter diagram for the 17 countries and 26 years, and a least
squares regression line is estimated between them (see Figure 1). Secondly, a shift
dummy variable is included in the regression for the year in which each country
undertook trade liberalisation in a significant way (see Table 1 for dates and Appendix
1) to estimate whether a significant improvement or deterioration in the trade-off can
be discerned. Thirdly, panel data estimation is used to estimate the impact of trade
liberalisation using a full model of trade balance determination to control for other
variables affecting the trade balance, and also lagging the trade liberalisation dummy
by one and two years. Finally, since the number of countries in the sample is less than
the number of observations, the panel estimates are compared with a time series/cross-
section estimator to test the robustness of the results. All the estimations are
undertaken using the software package LIMDEP.
5 In Section (4), the same procedures are applied to individual countries.
11
Figure 1
The Relation between GDP Growth and the Trade Balance Ratio
Pooled Data, 1977-2002
-60.0
-55.0-50.0
-45.0
-40.0
-35.0-30.0
-25.0
-20.0-15.0
-10.0
-5.00.0
5.0
10.0
15.020.0
25.0
-26.5 -21.5 -16.5 -11.5 -6.5 -1.5 3.5 8.5 13.5 18.5
GDP growth
TB/G
DP
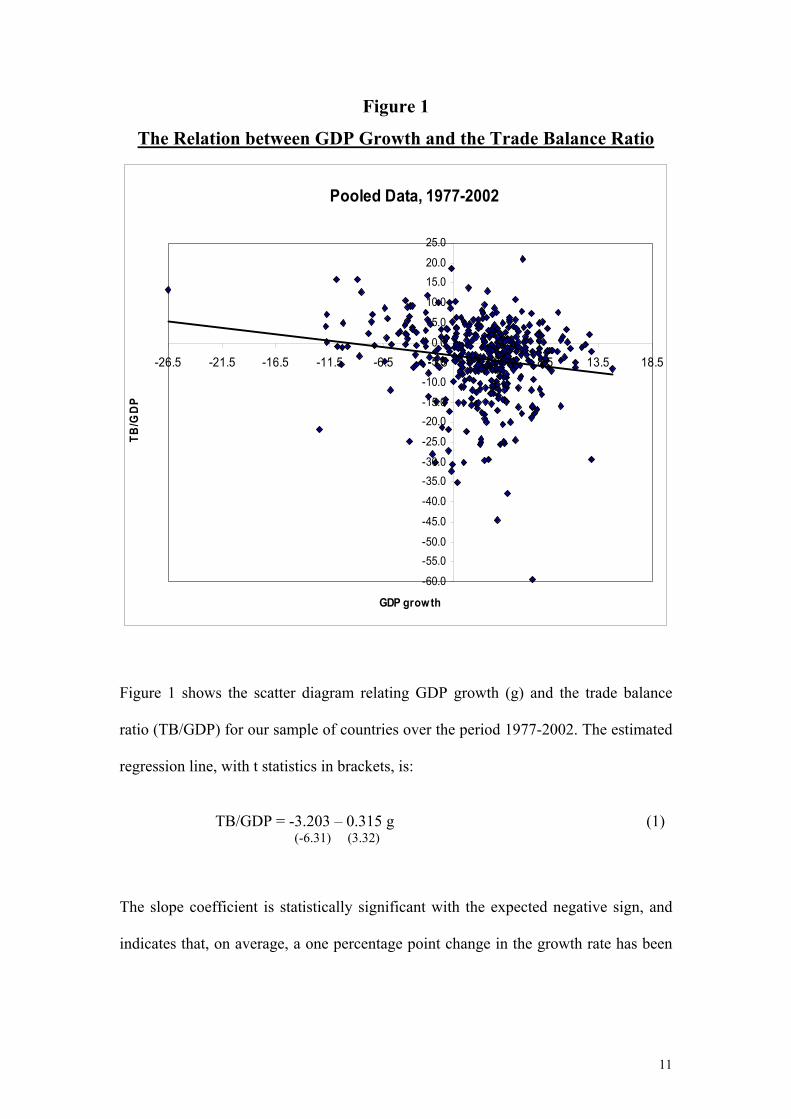
Figure 1 shows the scatter diagram relating GDP growth (g) and the trade balance
ratio (TB/GDP) for our sample of countries over the period 1977-2002. The estimated
regression line, with t statistics in brackets, is:
TB/GDP = -3.203 – 0.315 g (1)
(-6.31) (3.32)
The slope coefficient is statistically significant with the expected negative sign, and
indicates that, on average, a one percentage point change in the growth rate has been
12
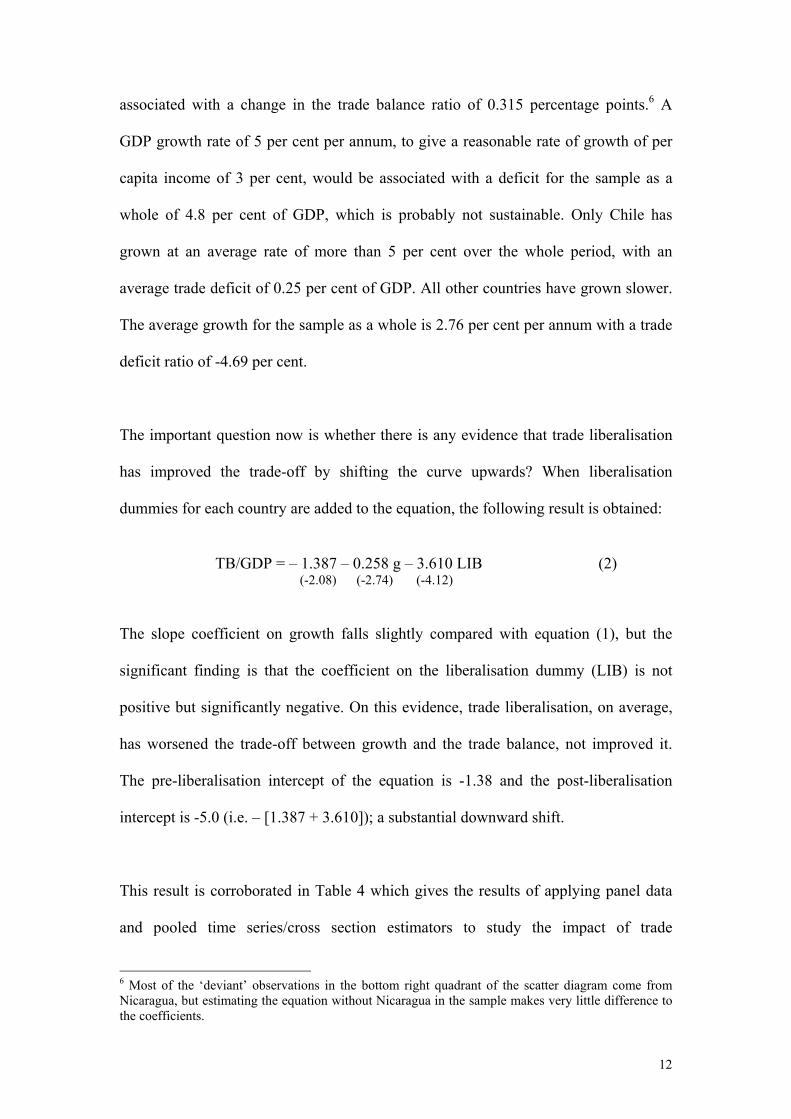
associated with a change in the trade balance ratio of 0.315 percentage points.6 A
GDP growth rate of 5 per cent per annum, to give a reasonable rate of growth of per
capita income of 3 per cent, would be associated with a deficit for the sample as a
whole of 4.8 per cent of GDP, which is probably not sustainable. Only Chile has
grown at an average rate of more than 5 per cent over the whole period, with an
average trade deficit of 0.25 per cent of GDP. All other countries have grown slower.
The average growth for the sample as a whole is 2.76 per cent per annum with a trade
deficit ratio of -4.69 per cent.
The important question now is whether there is any evidence that trade liberalisation
has improved the trade-off by shifting the curve upwards? When liberalisation
dummies for each country are added to the equation, the following result is obtained:
TB/GDP = – 1.387 – 0.258 g – 3.610 LIB (2)
(-2.08) (-2.74) (-4.12)
The slope coefficient on growth falls slightly compared with equation (1), but the
significant finding is that the coefficient on the liberalisation dummy (LIB) is not
positive but significantly negative. On this evidence, trade liberalisation, on average,
has worsened the trade-off between growth and the trade balance, not improved it.
The pre-liberalisation intercept of the equation is -1.38 and the post-liberalisation
intercept is -5.0 (i.e. – [1.387 + 3.610]); a substantial downward shift.
This result is corroborated in Table 4 which gives the results of applying panel data
and pooled time series/cross section estimators to study the impact of trade
6 Most of the ‘deviant’ observations in the bottom right quadrant of the scatter diagram come from Nicaragua, but estimating the equation without Nicaragua in the sample makes very little difference to the coefficients.
13
liberalisation in a full model of trade balance determination in which the trade balance
as a ratio of GDP (TB/GDP) is assumed to be a negative function of the rate of growth
of domestic income (yd) (which affects import growth); a positive function of the rate
of growth of foreign income (yf) (which affects export growth), and an indeterminate
function of the rate of change of the exchange rate (rer) (the effect of which depends
on the Marshall-Lerner condition). In linear form, the equation to be estimated, with
the effect of liberalisation (LIB) then added as a shift dummy, is:
(TB/GDP) it = a i + b1 (yd it) + b2 (yf it) + b3 (rer it) + b4 (LIB it) + e it (3)
where a i is the country specific effect where the panel data fixed effect estimator is
used, and e it is an error term. The expected signs of the coefficients are b1 < 0; b2 > 0,
and b3 and b4 are to be determined.
In equation (3) above, we also lag the liberalisation dummy two periods to test for
lags in the relationship between liberalisation and the trade balance.
The panel data estimates reported are for both the random and fixed (country-specific)
effects model (for purposes of comparison). The times series/cross section estimates
reported allow for groupwise heteroscedastic and correlated regressions with group
specific autocorrelation.
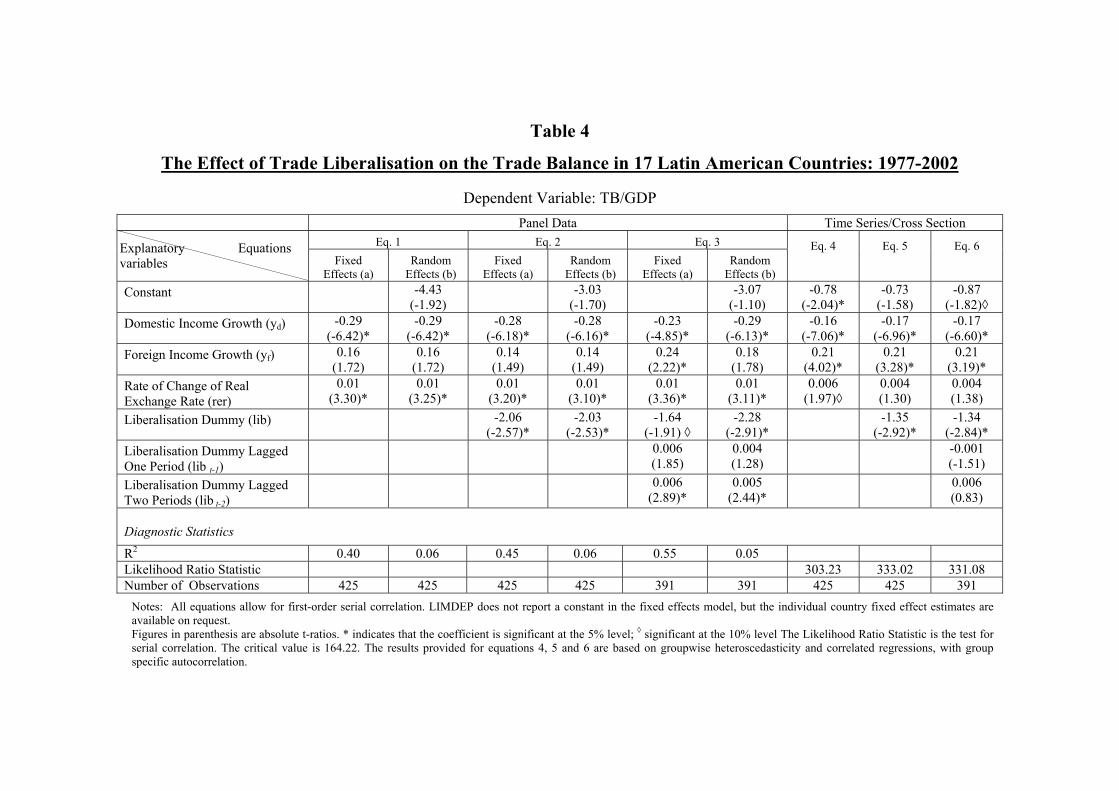
Table 4
The Effect of Trade Liberalisation on the Trade Balance in 17 Latin American Countries: 1977-2002
Dependent Variable: TB/GDP
Panel Data Time Series/Cross Section Eq. 1 Eq. 2 Eq. 3
Explanatory Equations variables Fixed
Effects (a) Random
Effects (b) Fixed
Effects (a) Random
Effects (b) Fixed
Effects (a) Random
Effects (b)
Eq. 4 Eq. 5 Eq. 6
Constant -4.43 (-1.92)
-3.03 (-1.70)
-3.07 (-1.10)
-0.78 (-2.04)*
-0.73 (-1.58)
-0.87 (-1.82)◊
Domestic Income Growth (yd) -0.29 (-6.42)*
-0.29 (-6.42)*
-0.28 (-6.18)*
-0.28 (-6.16)*
-0.23 (-4.85)*
-0.29 (-6.13)*
-0.16 (-7.06)*
-0.17 (-6.96)*
-0.17 (-6.60)*
Foreign Income Growth (yf) 0.16 (1.72)
0.16 (1.72)
0.14 (1.49)
0.14 (1.49)
0.24 (2.22)*
0.18 (1.78)
0.21 (4.02)*
0.21 (3.28)*
0.21 (3.19)*
Rate of Change of Real Exchange Rate (rer)
0.01 (3.30)*
0.01 (3.25)*
0.01 (3.20)*
0.01 (3.10)*
0.01 (3.36)*
0.01 (3.11)*
0.006 (1.97)◊
0.004 (1.30)
0.004 (1.38)
Liberalisation Dummy (lib) -2.06 (-2.57)*
-2.03 (-2.53)*
-1.64 (-1.91) ◊
-2.28 (-2.91)*
-1.35 (-2.92)*
-1.34 (-2.84)*
Liberalisation Dummy Lagged One Period (lib t-1)
0.006 (1.85)
0.004 (1.28)
-0.001 (-1.51)
Liberalisation Dummy Lagged Two Periods (lib t-2)
0.006 (2.89)*
0.005 (2.44)*
0.006 (0.83)
Diagnostic Statistics
R2 0.40 0.06 0.45 0.06 0.55 0.05 Likelihood Ratio Statistic 303.23 333.02 331.08 Number of Observations 425 425 425 425 391 391 425 425 391
Notes: All equations allow for first-order serial correlation. LIMDEP does not report a constant in the fixed effects model, but the individual country fixed effect estimates are available on request. Figures in parenthesis are absolute t-ratios. * indicates that the coefficient is significant at the 5% level; ◊ significant at the 10% level The Likelihood Ratio Statistic is the test for serial correlation. The critical value is 164.22. The results provided for equations 4, 5 and 6 are based on groupwise heteroscedasticity and correlated regressions, with group specific autocorrelation.
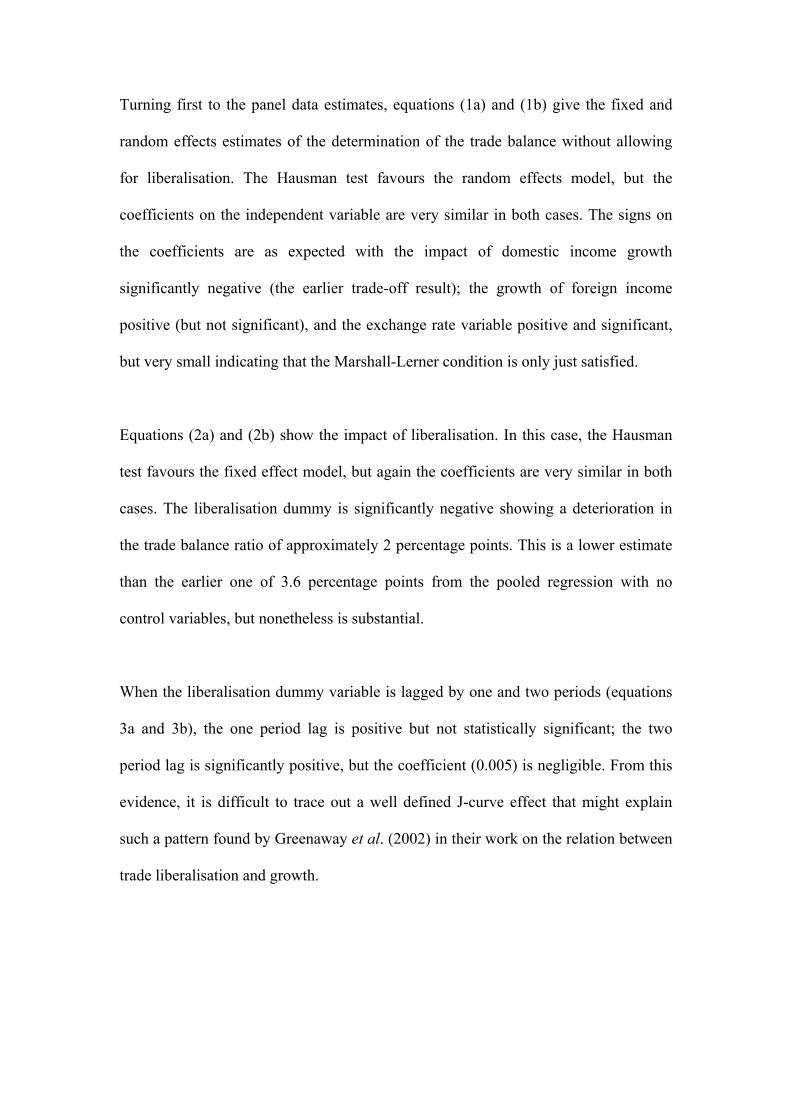
Turning first to the panel data estimates, equations (1a) and (1b) give the fixed and
random effects estimates of the determination of the trade balance without allowing
for liberalisation. The Hausman test favours the random effects model, but the
coefficients on the independent variable are very similar in both cases. The signs on
the coefficients are as expected with the impact of domestic income growth
significantly negative (the earlier trade-off result); the growth of foreign income
positive (but not significant), and the exchange rate variable positive and significant,
but very small indicating that the Marshall-Lerner condition is only just satisfied.
Equations (2a) and (2b) show the impact of liberalisation. In this case, the Hausman
test favours the fixed effect model, but again the coefficients are very similar in both
cases. The liberalisation dummy is significantly negative showing a deterioration in
the trade balance ratio of approximately 2 percentage points. This is a lower estimate
than the earlier one of 3.6 percentage points from the pooled regression with no
control variables, but nonetheless is substantial.
When the liberalisation dummy variable is lagged by one and two periods (equations
3a and 3b), the one period lag is positive but not statistically significant; the two
period lag is significantly positive, but the coefficient (0.005) is negligible. From this
evidence, it is difficult to trace out a well defined J-curve effect that might explain
such a pattern found by Greenaway et al. (2002) in their work on the relation between
trade liberalisation and growth.
16
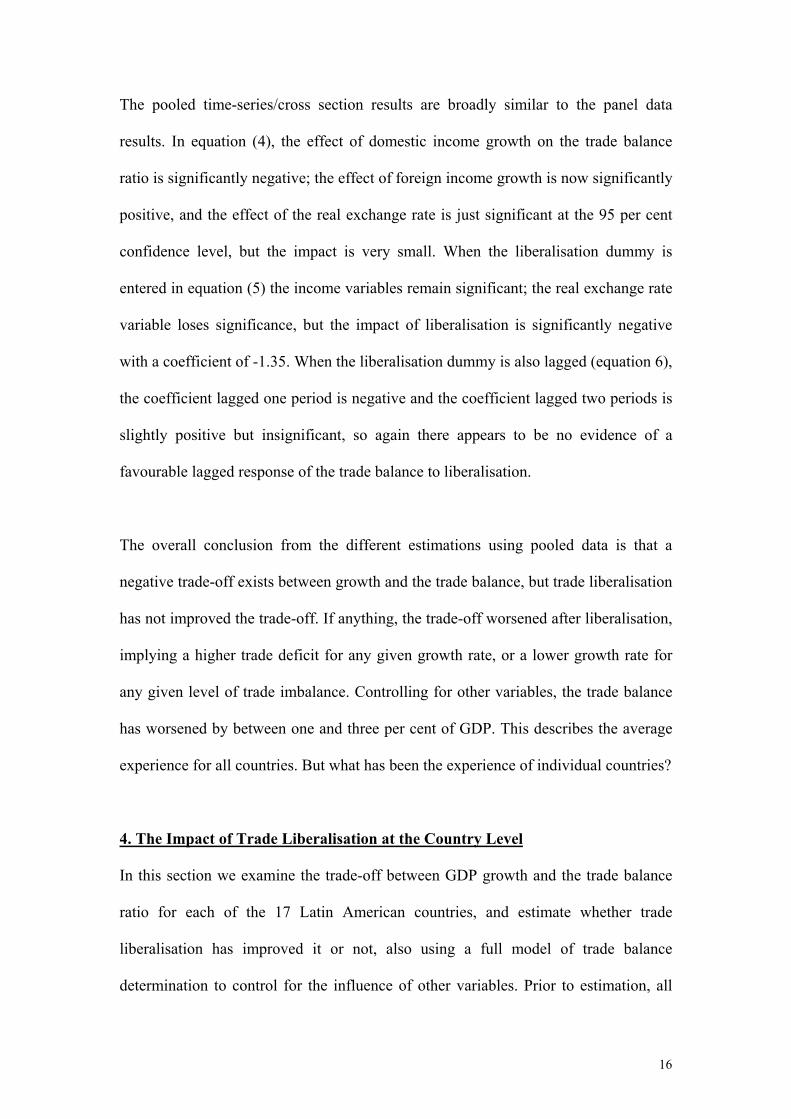
The pooled time-series/cross section results are broadly similar to the panel data
results. In equation (4), the effect of domestic income growth on the trade balance
ratio is significantly negative; the effect of foreign income growth is now significantly
positive, and the effect of the real exchange rate is just significant at the 95 per cent
confidence level, but the impact is very small. When the liberalisation dummy is
entered in equation (5) the income variables remain significant; the real exchange rate
variable loses significance, but the impact of liberalisation is significantly negative
with a coefficient of -1.35. When the liberalisation dummy is also lagged (equation 6),
the coefficient lagged one period is negative and the coefficient lagged two periods is
slightly positive but insignificant, so again there appears to be no evidence of a
favourable lagged response of the trade balance to liberalisation.
The overall conclusion from the different estimations using pooled data is that a
negative trade-off exists between growth and the trade balance, but trade liberalisation
has not improved the trade-off. If anything, the trade-off worsened after liberalisation,
implying a higher trade deficit for any given growth rate, or a lower growth rate for
any given level of trade imbalance. Controlling for other variables, the trade balance
has worsened by between one and three per cent of GDP. This describes the average
experience for all countries. But what has been the experience of individual countries?
4. The Impact of Trade Liberalisation at the Country Level
In this section we examine the trade-off between GDP growth and the trade balance
ratio for each of the 17 Latin American countries, and estimate whether trade
liberalisation has improved it or not, also using a full model of trade balance
determination to control for the influence of other variables. Prior to estimation, all
17
the variables in the sample of countries were tested for the existence of unit roots
using both the Augmented Dickey-Fuller and Perron tests. The test results showed
some variables to be I(0) and others I(1). We therefore adopted the Pesaran et al.
(2001) test for the existence of a long run relationship between the levels of the
variables, for which the order of integration does not matter. The null hypothesis of no
long-run relationship was rejected in all 17 countries; 13 at the 95 per cent confidence
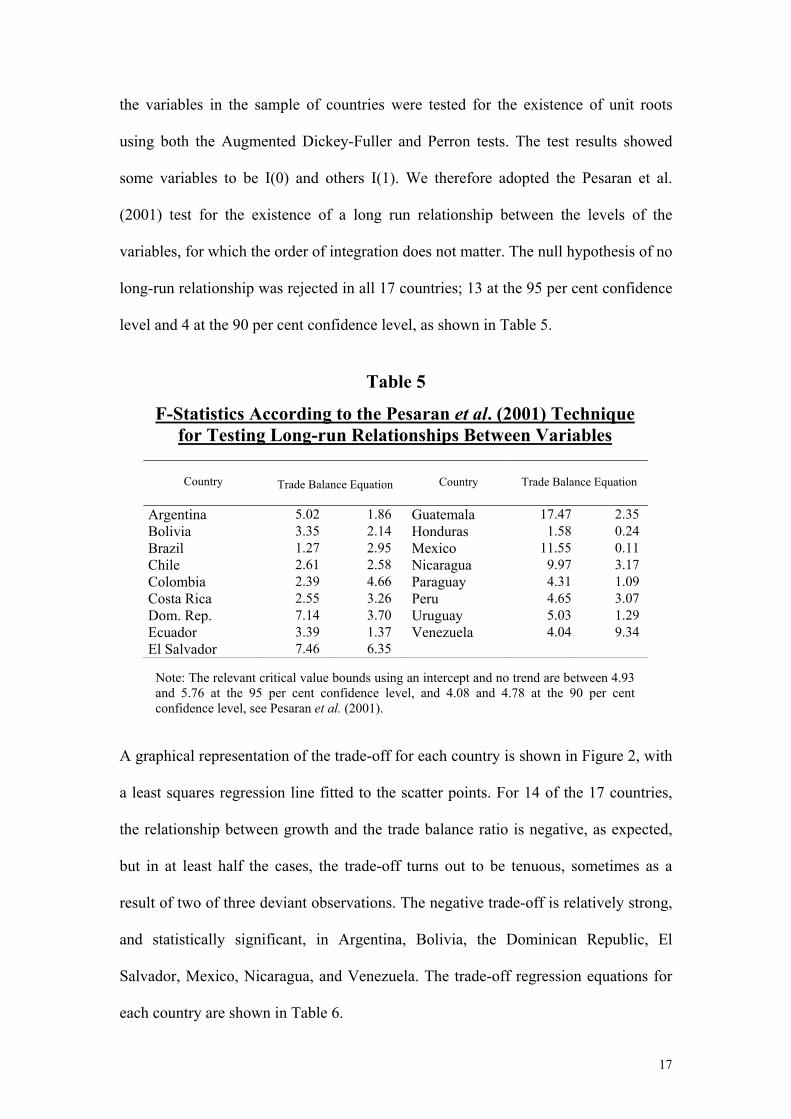
level and 4 at the 90 per cent confidence level, as shown in Table 5.
Table 5
F-Statistics According to the Pesaran et al. (2001) Technique for Testing Long-run Relationships Between Variables
Country
Trade Balance Equation
Country
Trade Balance Equation
Argentina 5.02 1.86 Guatemala 17.47 2.35 Bolivia 3.35 2.14 Honduras 1.58 0.24 Brazil 1.27 2.95 Mexico 11.55 0.11 Chile 2.61 2.58 Nicaragua 9.97 3.17 Colombia 2.39 4.66 Paraguay 4.31 1.09 Costa Rica 2.55 3.26 Peru 4.65 3.07 Dom. Rep. 7.14 3.70 Uruguay 5.03 1.29 Ecuador 3.39 1.37 Venezuela 4.04 9.34 El Salvador 7.46 6.35
Note: The relevant critical value bounds using an intercept and no trend are between 4.93 and 5.76 at the 95 per cent confidence level, and 4.08 and 4.78 at the 90 per cent confidence level, see Pesaran et al. (2001).
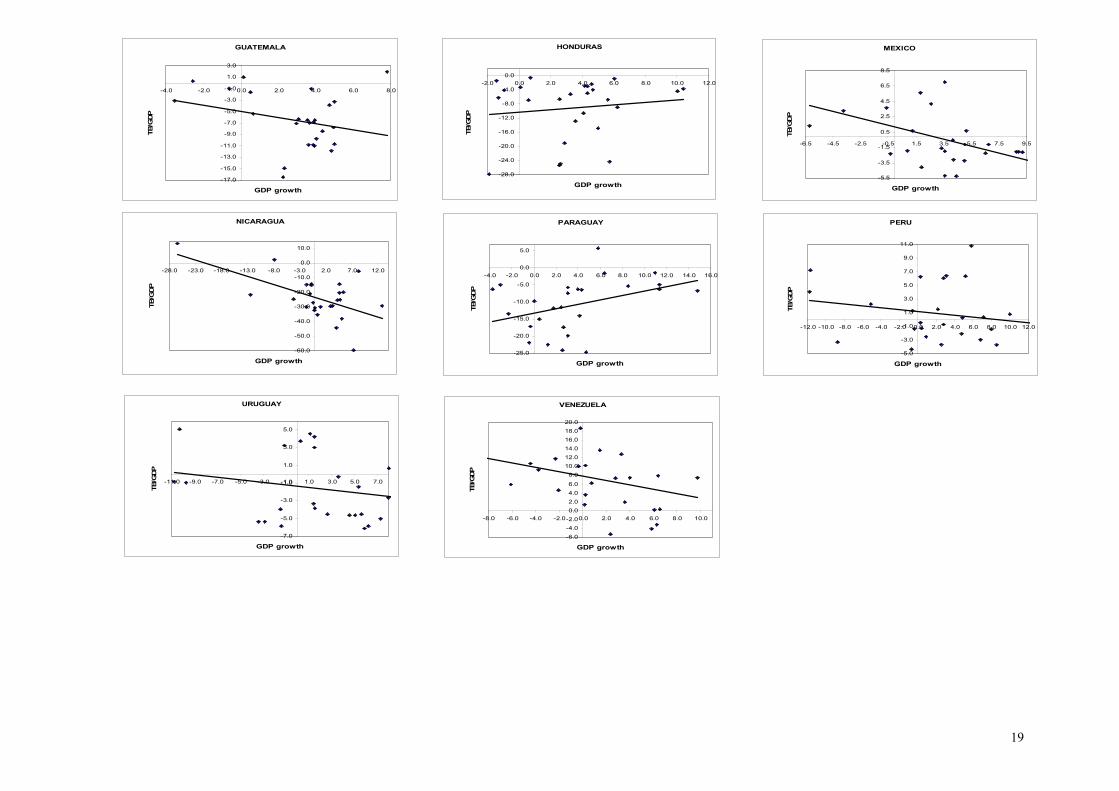
A graphical representation of the trade-off for each country is shown in Figure 2, with
a least squares regression line fitted to the scatter points. For 14 of the 17 countries,
the relationship between growth and the trade balance ratio is negative, as expected,
but in at least half the cases, the trade-off turns out to be tenuous, sometimes as a
result of two of three deviant observations. The negative trade-off is relatively strong,
and statistically significant, in Argentina, Bolivia, the Dominican Republic, El
Salvador, Mexico, Nicaragua, and Venezuela. The trade-off regression equations for
each country are shown in Table 6.

Figure 2 Trade-off between Growth and TB/GDP, 1977-2002
Figure 2 continued
ARGENTINA
-4.0
-2.0
0.0
2.0
4.0
6.0
8.0
10.0
12.0
14.0
16.0
-11.0 -9.0 -7.0 -5.0 -3.0 -1.0 1.0 3.0 5.0 7.0 9.0 11.0 13.0
GDP growth
TB/G
DP
BOLIVIA
-11.0
-9.0
-7.0
-5.0
-3.0
-1.0
1.0
3.0
5.0
7.0
9.0
11.0
-5.0 -3.0 -1.0 1.0 3.0 5.0
GDP growth
TB/G
DP
BRAZIL
-2.5
-1.5
-0.5
0.5
1.5
2.5
3.5
4.5
5.5
-5.0 -3.0 -1.0 1.0 3.0 5.0 7.0 9.0
GDP growth
TB/G
DP
CHILE
-10.0
-8.0
-6.0
-4.0
-2.0
0.0
2.0
4.0
6.0
8.0
-11.0 -9.0 -7.0 -5.0 -3.0 -1.0 1.0 3.0 5.0 7.0 9.0 11.0 13.0
GDP growth
TB/G
DP
COLOMBIA
-7.0
-5.0
-3.0
-1.0
1.0
3.0
5.0
7.0
-5.0 -3.0 -1.0 1.0 3.0 5.0 7.0 9.0
GDP growth
TB/G
DP
COSTA RICA
-12.0
-10.0
-8.0
-6.0
-4.0
-2.0
0.0
2.0
-8.0 -6.0 -4.0 -2.0 0.0 2.0 4.0 6.0 8.0 10.0
GDP growth
TB/G
DP
DOMINICAN REPUBLIC
-19.0
-17.0
-15.0
-13.0
-11.0
-9.0
-7.0
-5.0
-3.0
-1.0
1.0
-6.0 -4.0 -2.0 0.0 2.0 4.0 6.0 8.0 10.0
GDP growth
TB/G
DP
ECUADOR
-6.0
-4.0
-2.0
0.0
2.0
4.0
6.0
8.0
10.0
-7.0 -5.0 -3.0 -1.0 1.0 3.0 5.0 7.0 9.0
GDP growth
TB/G
DP
EL SALVADOR
-18.0
-16.0
-14.0
-12.0
-10.0
-8.0-6.0
-4.0
-2.0
0.0
2.0
4.0
6.0
-12.0 -10.0 -8.0 -6.0 -4.0 -2.0 0.0 2.0 4.0 6.0 8.0
GDP growth
TB/G
DP
19
MEXICO
-5.5
-3.5
-1.5
0.5
2.5
4.5
6.5
8.5
-6.5 -4.5 -2.5 -0.5 1.5 3.5 5.5 7.5 9.5
GDP growth
TB/G
DP
GUATEMALA
-17.0
-15.0
-13.0
-11.0
-9.0
-7.0
-5.0
-3.0
-1.0
1.0
3.0
-4.0 -2.0 0.0 2.0 4.0 6.0 8.0
GDP growth
TB/G
DP
HONDURAS
-28.0
-24.0
-20.0
-16.0
-12.0
-8.0
-4.0
0.0-2.0 0.0 2.0 4.0 6.0 8.0 10.0 12.0
GDP growth
TB/G
DP
NICARAGUA
-60.0
-50.0
-40.0
-30.0
-20.0
-10.0
0.0
10.0
-28.0 -23.0 -18.0 -13.0 -8.0 -3.0 2.0 7.0 12.0
GDP growth
TB/G
DP
PARAGUAY
-25.0
-20.0
-15.0
-10.0
-5.0
0.0
5.0
-4.0 -2.0 0.0 2.0 4.0 6.0 8.0 10.0 12.0 14.0 16.0
GDP growth
TB/G
DP
PERU
-5.0
-3.0
-1.0
1.0
3.0
5.0
7.0
9.0
11.0
-12.0 -10.0 -8.0 -6.0 -4.0 -2.0 0.0 2.0 4.0 6.0 8.0 10.0 12.0
GDP growth
TB/G
DP
URUGUAY
-7.0
-5.0
-3.0
-1.0
1.0
3.0
5.0
-11.0 -9.0 -7.0 -5.0 -3.0 -1.0 1.0 3.0 5.0 7.0
GDP growth
TB/G
DP
VENEZUELA
-6.0-4.0-2.00.02.04.06.0
8.010.012.014.016.018.020.0
-8.0 -6.0 -4.0 -2.0 0.0 2.0 4.0 6.0 8.0 10.0
GDP growth
TB/G
DP

Table 6
Trade-off Between GDP Growth and the Trade Balance Ratio, and the Effect of Liberalisation
Constant yt
d libt R2 2.42
(3.71) -0.34
(-3.44) 0.33
Argentina 2.35 (3.24)
-0.33 (-3.20)
-0.96 (-0.73) 0.34
0.01 (0.00)
-1.06 (-2.89)
0.25 Bolivia 2.75
(1.57) -0.63
(-1.58)-5.14
(-2.10) 0.37 1.16
(1.97) -0.03
(-0.23) 0.00
Brazil 1.74 (2.37)
-0.04 (-0.30)
-1.19 (-1.28) 0.06
0.14 (0.11)
-0.07 (-0.42)
0.00 Chile -2.36
(-1.70)-0.16
(-1.10)-4.39
(-2.85) 0.26 -2.03
(-1.88)0.28
(0.28) 0.04
Colombia -3.61 (-2.58)
0.33 (1.29)
2.16 (1.69) 0.15
-5.66 (-5.54)
-0.03 (-0.16)
0.00 Costa Rica -5.97
(-4.56)-0.05
(-0.26)-0.59
(-0.38) 0.00 -9.67
(-7.37)-0.46
(-1.87) 0.12
Dom Republic -8.73 (-7.27)
-0.22 (-0.95)
-4.26 (-2.84) 0.35
3.52 (3.13)
-0.19 (-0.66)
0.01 Ecuador 4.52
(3.11) -0.21
(-0.77)-1.84
(-1.08) 0.06 -8.86
(-8.07)-0.72
(-3.89) 0.32
El Salvador -4.60 (-4.79)
-0.22 (-1.41)
-9.48 (-6.28) 0.75
-4.89 (-3.39)
-0.54 (-1.43)
0.07 Guatemala -1.73
(-1.34)-0.07
(-0.24)-6.92
(-4.44) 0.50 -10.33 (-4.16)
0.35 (0.64)
0.01 Honduras -4.38
(-2.10)0.22
(0.60) -11.97 (-5.13) 0.54
1.24 (1.50)
-0.45 (-2.25)
0.25 Mexico 4.13
(3.73) -0.56
(-4.11)-3.86
(-3.34) 0.49 -23.43
(-10.01)-1.09
(-3.45) 0.33
Nicaragua -17.18 (-6.11)
-0.69 (-2.33)
-13.93 (-3.16) 0.53
-13.19 (-7.09)
0.64 (2.02)
0.14 Paraguay -6.90
(-2.89)-0.25 (0.89)
-8.98 (-3.46) 0.43
-1.16 (-1.38)
-0.13 (-1.02)
0.04 Peru 3.28
(3.73) -0.01
(-0.13)-5.08
(-3.76) 0.40 -1.35
(-1.73)-0.14
(-1.01) 0.04
Uruguay 0.48 (0.50)
-0.14 (-1.20)
-3.66 (-2.72) 0.27
7.82 (6.06)
-0.50 (-1.89)
0.13 Venezuela 5.18
(2.93) -0.47
(-1.92)4.86
(2.05) 0.26

21
To test whether trade liberalisation has improved the trade-off between growth and
the trade balance, a shift dummy variable is added to the equations for the year in
which liberalisation took place in a significant way.
The results are shown in the second equation for each country in Table 6. In only two
of the countries, Colombia and Venezuela, is the sign on the liberalisation dummy
positive, indicating an improvement in the trade-off, but only in Venezuela is the
positive impact statistically significant. In the other 15 countries, the sign is negative,
and significantly so in Bolivia, Chile, the Dominican Republic, El Salvador,
Guatemala, Honduras, Mexico, Nicaragua, Paraguay, Peru and Uruguay. These
preliminary results, without controlling for other variables, support the earlier panel
and time-series/cross section results.
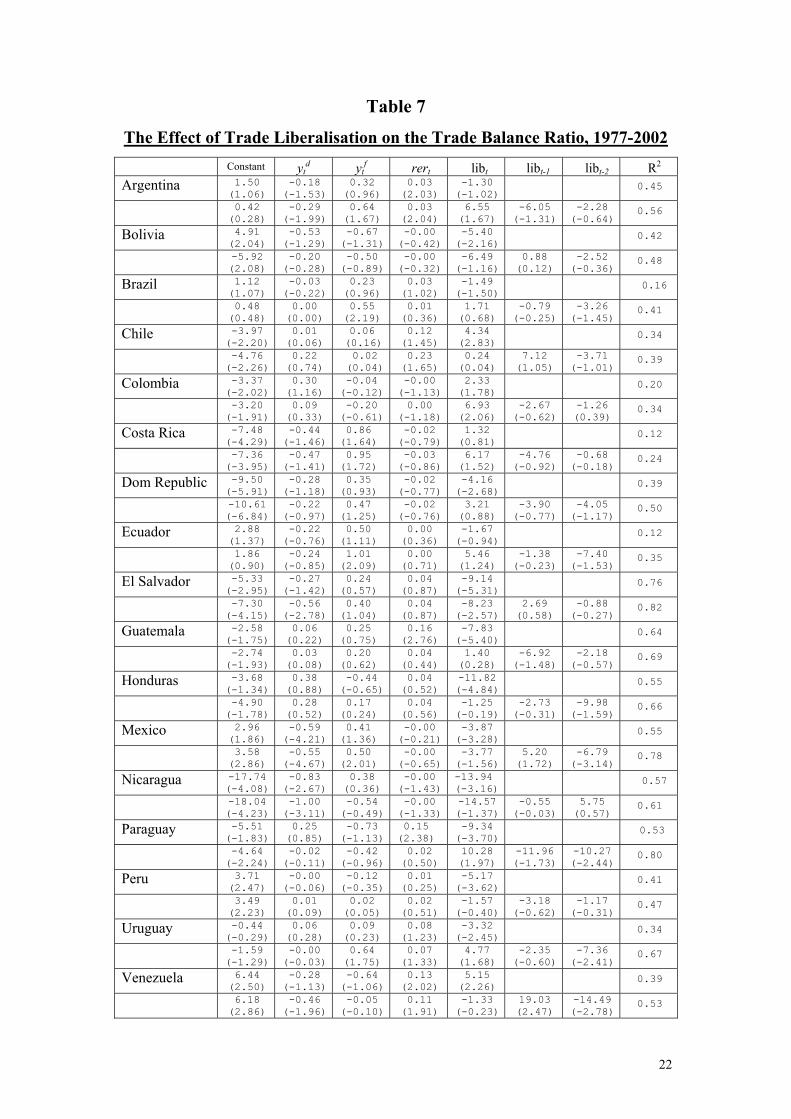
Table 7 shows the estimates of the effect of liberalisation in a full model of trade
balance determination, controlling (as before) for domestic income growth (yd),
foreign income growth (yf) and the exchange rate (rer), and also lagging the
liberalisation dummy variable by one and two years (libt-1 and libt-2). Without lagging,
the impact of liberalisation on the trade-off curve turns out to be positive in Colombia,
Costa Rica, Chile and Venezuela. These are four out of the five countries that show up
as ‘definitely better’ or ‘better-indeterminate’ in the ‘before and after’ liberalisation
comparison in Table 3. Only in Venezuela and Chile, however, is the positive
coefficient statistically significant.
22
Table 7
The Effect of Trade Liberalisation on the Trade Balance Ratio, 1977-2002 Constant yt
d ytf rert libt libt-1 libt-2 R2
Argentina 1.50 (1.06)
-0.18 (-1.53)
0.32 (0.96)
0.03 (2.03)
-1.30 (-1.02)
0.45
0.42 (0.28)
-0.29 (-1.99)
0.64 (1.67)
0.03 (2.04)
6.55 (1.67)
-6.05 (-1.31)
-2.28 (-0.64) 0.56
Bolivia 4.91 (2.04)
-0.53 (-1.29)
-0.67 (-1.31)
-0.00 (-0.42)
-5.40 (-2.16)
0.42
-5.92 (2.08)
-0.20 (-0.28)
-0.50 (-0.89)
-0.00 (-0.32)
-6.49 (-1.16)
0.88 (0.12)
-2.52 (-0.36) 0.48
Brazil 1.12 (1.07)
-0.03 (-0.22)
0.23 (0.96)
0.03 (1.02)
-1.49 (-1.50)
0.16
0.48 (0.48)
0.00 (0.00)
0.55 (2.19)
0.01 (0.36)
1.71 (0.68)
-0.79 (-0.25)
-3.26 (-1.45) 0.41
Chile -3.97 (-2.20)
0.01 (0.06)
0.06 (0.16)
0.12 (1.45)
4.34 (2.83)
0.34
-4.76 (-2.26)
0.22 (0.74)
0.02 (0.04)
0.23 (1.65)
0.24 (0.04)
7.12 (1.05)
-3.71 (-1.01) 0.39
Colombia -3.37 (-2.02)
0.30 (1.16)
-0.04 (-0.12)
-0.00 (-1.13)
2.33 (1.78)
0.20
-3.20 (-1.91)
0.09 (0.33)
-0.20 (-0.61)
0.00 (-1.18)
6.93 (2.06)
-2.67 (-0.62)
-1.26 (0.39) 0.34
Costa Rica -7.48 (-4.29)
-0.44 (-1.46)
0.86 (1.64)
-0.02 (-0.79)
1.32 (0.81)
0.12
-7.36 (-3.95)
-0.47 (-1.41)
0.95 (1.72)
-0.03 (-0.86)
6.17 (1.52)
-4.76 (-0.92)
-0.68 (-0.18) 0.24
Dom Republic -9.50 (-5.91)
-0.28 (-1.18)
0.35 (0.93)
-0.02 (-0.77)
-4.16 (-2.68)
0.39
-10.61 (-6.84)
-0.22 (-0.97)
0.47 (1.25)
-0.02 (-0.76)
3.21 (0.88)
-3.90 (-0.77)
-4.05 (-1.17) 0.50
Ecuador 2.88 (1.37)
-0.22 (-0.76)
0.50 (1.11)
0.00 (0.36)
-1.67 (-0.94)
0.12
1.86 (0.90)
-0.24 (-0.85)
1.01 (2.09)
0.00 (0.71)
5.46 (1.24)
-1.38 (-0.23)
-7.40 (-1.53) 0.35
El Salvador -5.33 (-2.95)
-0.27 (-1.42)
0.24 (0.57)
0.04 (0.87)
-9.14 (-5.31)
0.76
-7.30 (-4.15)
-0.56 (-2.78)
0.40 (1.04)
0.04 (0.87)
-8.23 (-2.57)
2.69 (0.58)
-0.88 (-0.27) 0.82
Guatemala -2.58 (-1.75)
0.06 (0.22)
0.25 (0.75)
0.16 (2.76)
-7.83 (-5.40)
0.64
-2.74 (-1.93)
0.03 (0.08)
0.20 (0.62)
0.04 (0.44)
1.40 (0.28)
-6.92 (-1.48)
-2.18 (-0.57) 0.69
Honduras -3.68 (-1.34)
0.38 (0.88)
-0.44 (-0.65)
0.04 (0.52)
-11.82 (-4.84)
0.55
-4.90 (-1.78)
0.28 (0.52)
0.17 (0.24)
0.04 (0.56)
-1.25 (-0.19)
-2.73 (-0.31)
-9.98 (-1.59) 0.66
Mexico 2.96 (1.86)
-0.59 (-4.21)
0.41 (1.36)
-0.00 (-0.21)
-3.87 (-3.28)
0.55
3.58 (2.86)
-0.55 (-4.67)
0.50 (2.01)
-0.00 (-0.65)
-3.77 (-1.56)
5.20 (1.72)
-6.79 (-3.14) 0.78
Nicaragua -17.74 (-4.08)
-0.83 (-2.67)
0.38 (0.36)
-0.00 (-1.43)
-13.94 (-3.16)
0.57
-18.04 (-4.23)
-1.00 (-3.11)
-0.54 (-0.49)
-0.00 (-1.33)
-14.57 (-1.37)
-0.55 (-0.03)
5.75 (0.57) 0.61
Paraguay -5.51 (-1.83)
0.25 (0.85)
-0.73 (-1.13)
0.15 (2.38)
-9.34 (-3.70)
0.53
-4.64 (-2.24)
-0.02 (-0.11)
-0.42 (-0.96)
0.02 (0.50)
10.28 (1.97)
-11.96 (-1.73)
-10.27 (-2.44) 0.80
Peru 3.71 (2.47)
-0.00 (-0.06)
-0.12 (-0.35)
0.01 (0.25)
-5.17 (-3.62)
0.41
3.49 (2.23)
0.01 (0.09)
0.02 (0.05)
0.02 (0.51)
-1.57 (-0.40)
-3.18 (-0.62)
-1.17 (-0.31) 0.47
Uruguay -0.44 (-0.29)
0.06 (0.28)
0.09 (0.23)
0.08 (1.23)
-3.32 (-2.45)
0.34
-1.59 (-1.29)
-0.00 (-0.03)
0.64 (1.75)
0.07 (1.33)
4.77 (1.68)
-2.35 (-0.60)
-7.36 (-2.41) 0.67
Venezuela 6.44 (2.50)
-0.28 (-1.13)
-0.64 (-1.06)
0.13 (2.02)
5.15 (2.26)
0.39
6.18 (2.86)
-0.46 (-1.96)
-0.05 (-0.10)
0.11 (1.91)
-1.33 (-0.23)
19.03 (2.47)
-14.49 (-2.78) 0.53
23
By the criteria we use, only in these two countries is it possible to say with some
confidence that trade liberalisation improved macroeconomic performance allowing
countries to grow faster without jeopardising the trade balance.
In 10 of the other thirteen countries, the coefficient on the liberalisation dummy is
significantly negative, even when other variables are controlled for: Bolivia, the
Dominican Republic, El Salvador, Guatemala, Honduras, Mexico, Nicaragua,
Paraguay, Peru and Uruguay. When the liberalisation dummy is lagged, the lagged
effect is rarely significant, and there is no evidence of a J-curve effect. The lagged
effects sometimes turn the instantaneous effect positive, but only significantly so in
the case of Paraguay.
The major conclusion must be that for most of the countries in our sample, the classic
conflict exists between faster GDP growth and the trade balance, and that there is very
little evidence that trade liberalisation has eased the conflict except in Venezuela and
Chile (and perhaps Colombia and Costa Rica). Indeed, the evidence suggests that the
trade-off between growth and the trade balance has worsened in at least 10 of the
Latin American countries. In this sense, trade liberalisation has not improved
macroeconomic performance, but seems to have worsened it.
5. Has Anything Changed Much in Latin America? Trade Liberalisation and Growth in Long Run Perspective
The analysis so far has focused specifically on the impact of trade liberalisation on the
trade-off between growth and the trade balance ratio. In this final, and concluding

24
section, we consider briefly the long run growth performance of the seventeen Latin
American countries since liberalisation; whether countries have sustained larger or
smaller trade and current account deficits/surpluses since liberalisation, and whether
there has been any significant feedback from trade performance to growth
performance. In short, has anything changed very much in Latin America since
liberalisation?
Most cross-section or panel data studies of the impact of trade liberalisation on GDP
growth find a positive overall effect, but the experiences of individual countries can
be very mixed. Wacziard and Welch (2003) in their up-date of the Sachs and Warner
(1995) study of trade openness and growth find that when the countries that
liberalised in the 1990s become part of the sample of open economies, there is no
openness /liberalisation effect on growth. The dummy variable that discriminates
between open and closed economies (controlling for other variables) is insignificant.
When Wacziard and Welch use panel data, however, and include dummy variables for
the dates of trade liberalisation in individual countries, they find a positive growth
impact of 1.56 percentage points in a random-effects model, and 0.56 percentage
points in a fixed-effects model. They recognise, however, that in many individual
countries, the impact may have been negative, or at least that growth has not
improved since liberalisation. An example they examine is Mexico.
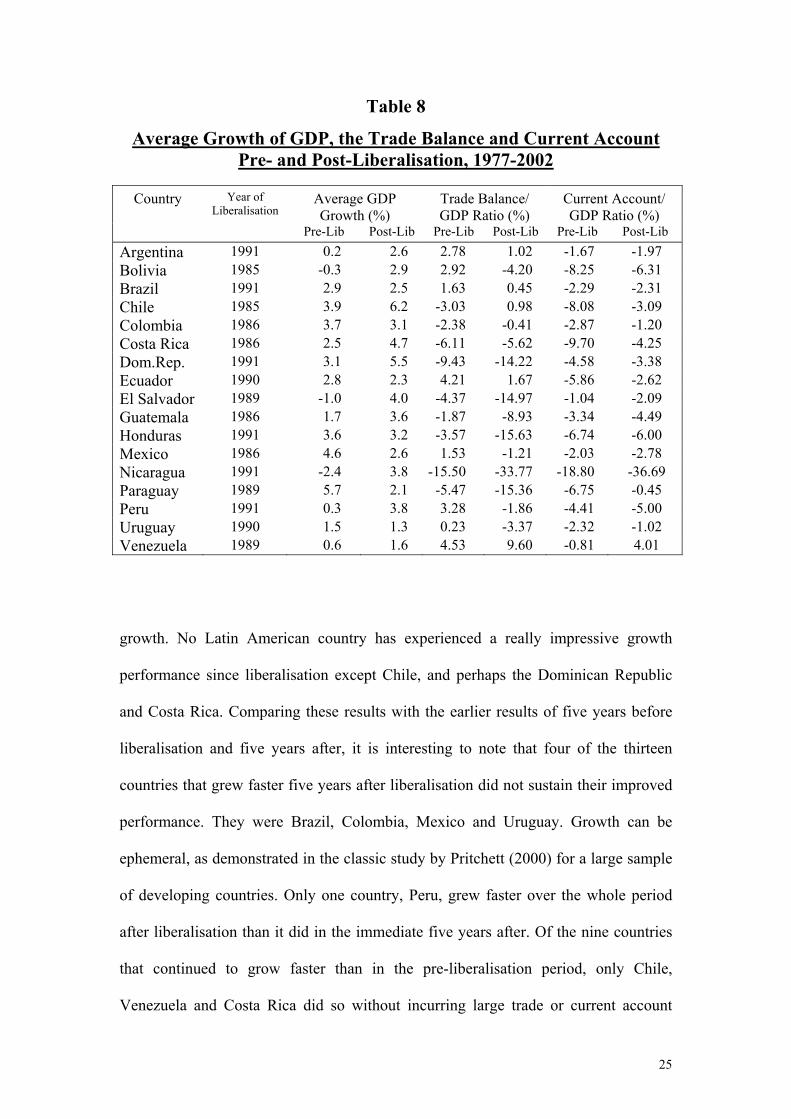
In Table 8, we show for our seventeen countries, the average rate of growth of GDP
for the whole period since the date of liberalisation compared to the growth rate
before liberalisation, and also the trade and current account balance as a percent of
GDP for each country. Nine countries had faster growth, and eight had slower
25
Table 8
Average Growth of GDP, the Trade Balance and Current Account Pre- and Post-Liberalisation, 1977-2002
Country Year of
Liberalisation Average GDP Growth (%)
Trade Balance/ GDP Ratio (%)
Current Account/ GDP Ratio (%)
Pre-Lib Post-Lib Pre-Lib Post-Lib Pre-Lib Post-Lib Argentina 1991 0.2 2.6 2.78 1.02 -1.67 -1.97 Bolivia 1985 -0.3 2.9 2.92 -4.20 -8.25 -6.31 Brazil 1991 2.9 2.5 1.63 0.45 -2.29 -2.31 Chile 1985 3.9 6.2 -3.03 0.98 -8.08 -3.09 Colombia 1986 3.7 3.1 -2.38 -0.41 -2.87 -1.20 Costa Rica 1986 2.5 4.7 -6.11 -5.62 -9.70 -4.25 Dom.Rep. 1991 3.1 5.5 -9.43 -14.22 -4.58 -3.38 Ecuador 1990 2.8 2.3 4.21 1.67 -5.86 -2.62 El Salvador 1989 -1.0 4.0 -4.37 -14.97 -1.04 -2.09 Guatemala 1986 1.7 3.6 -1.87 -8.93 -3.34 -4.49 Honduras 1991 3.6 3.2 -3.57 -15.63 -6.74 -6.00 Mexico 1986 4.6 2.6 1.53 -1.21 -2.03 -2.78 Nicaragua 1991 -2.4 3.8 -15.50 -33.77 -18.80 -36.69 Paraguay 1989 5.7 2.1 -5.47 -15.36 -6.75 -0.45 Peru 1991 0.3 3.8 3.28 -1.86 -4.41 -5.00 Uruguay 1990 1.5 1.3 0.23 -3.37 -2.32 -1.02 Venezuela 1989 0.6 1.6 4.53 9.60 -0.81 4.01
growth. No Latin American country has experienced a really impressive growth
performance since liberalisation except Chile, and perhaps the Dominican Republic
and Costa Rica. Comparing these results with the earlier results of five years before
liberalisation and five years after, it is interesting to note that four of the thirteen
countries that grew faster five years after liberalisation did not sustain their improved
performance. They were Brazil, Colombia, Mexico and Uruguay. Growth can be
ephemeral, as demonstrated in the classic study by Pritchett (2000) for a large sample
of developing countries. Only one country, Peru, grew faster over the whole period
after liberalisation than it did in the immediate five years after. Of the nine countries
that continued to grow faster than in the pre-liberalisation period, only Chile,
Venezuela and Costa Rica did so without incurring large trade or current account
26
deficits (as can be seen in Table 8). The Dominican Republic and Bolivia incurred
huge trade deficits; El Salvador, Guatemala, and Nicaragua suffered worse trade and
current account deficits, and in Argentina the current account deficit worsened
slightly.
These descriptive statistics support the earlier rigorous econometric estimates showing
that only in Chile and Venezuela did trade liberalisation shift favourably the trade-off
curve between growth and the trade balance allowing faster growth without
deterioration in the foreign exchange position. 7
The weak performance is partly accounted for by the impact that movements in the
balance of trade and the current account have on growth in subsequent periods. A
simple test of this is to regress the growth of GDP in the current period on the trade
balance or current account ratio in the previous period, controlling for other variables
such as the real exchange rate and the impact of liberalisation itself. When this is
done, the sign of the coefficient on the lagged trade and current account ratio is
invariably positive, indicating that an improvement in the balance of payments
position permits faster growth, and a deterioration acts as a constraint. For Chile and
Venezuela, the signs are significantly positive, as they are for other countries where
the trade balance deteriorated and impacted unfavourably on growth.8
We started out this research on Latin American economies to test the hypothesis that
trade liberalisation has improved the trade-off between GDP growth and the balance
of payments on the premise that the main objective of trade liberalisation is to
7 For Costa Rica, the liberalisation coefficient is positive but only significant at the 90 per cent level. 8 The full results are available on request.
27
improve the economic welfare of countries by raising the sustainable growth rate, and
that the foreign exchange position can act as a constraint on growth. What we have
found is that in the aftermath of trade liberalisation, growth performance did improve
in the majority of countries, but at the expense of trade balance deterioration. For
some countries, the growth was not sustainable; for others it was sustainable only by
financing larger trade or current account deficits. In the vast majority of countries, the
trade-off between growth and the trade balance did not improve as a result of
liberalisation, but deteriorated. Only in Chile and Venezuela does there seem to have
been an unequivocal improvement. Thus, the impact of liberalisation on the
macroeconomic performance and economic welfare of the Latin American countries
must be regarded as disappointing to say the least. The lesson is that trade
liberalisation needs to proceed with great care if the potential real income gains from
trade are not to be offset by the constraint of the balance of payments. A short-term
boost to growth at the expense of a loss of foreign exchange is no gain at all if deficits
cannot be financed without countries going further into debt or growth cannot be
sustained. Trade liberalisation is not a substitute for a trade and development strategy.

28
Bibliography Greenaway, D. Morgan, W. and Wright, P. (2002), ‘Trade Liberalisation and Growth in Developing Countries’, Journal of Development Economics, 67: 229-244. McCombie, J. and Thirlwall, A.P. (2004), Essays on Balance of Payments Constrained Growth: Theory and Evidence, (London: Routledge). Moreno-Brid, J.C. (2001), Essays on Economic Growth and the Balance of Payments Constraint with Special Reference to the Case of Mexico, Trinity College, Cambridge, PhD Thesis. Pacheco-López, P. (2005), ‘The Impact of Trade Liberalisation on Exports, Imports, the Balance of Payments and Growth: the Case of Mexico’, Journal of Post Keynesian Economics, 27(4): 595-619. Pacheco-López, P. and Thirlwall, A.P. (2004), ‘Trade Liberalisation in Mexico: Rhetoric and Reality’, Banca Nazionale del Lavoro Quarterly Review, 229, June, pp. 141-167. Pesaran, M., Shin Y. and Smith R., (2001), “Bounds Testing Approach to the Analysis of Level Relationships”, Journal of Applied Econometrics, 16, 289-326. Pritchett, L. (2000), ‘Understanding Patterns of Growth: Searching for Hills among Plateaus, Mountains and Plains’, World Bank Economic Review, 14 (1): 221-250. Rodrik, D. (2004), ‘Rethinking Growth Strategies’, WIDER Annual Lecture 8, United Nations World Institute for Development Economic Research, Helsinki. Sachs, J. and A. Warner (1995), ‘Economic Reforms and the Process of Global Integration’, Brookings Papers on Economic Activity, 1, pp.1-118. Santos-Paulino, A. and Thirlwall, A.P. (2004), ‘The Impact of Trade Liberalisation on Exports, Imports and the Balance of Payments of Developing Countries’, Economic Journal, 114, February, pp50-72. Thirlwall, A.P. (1979), ‘The Balance of Payments Constraint as an Explanation of International Growth Rate Differences’, Banca Nazionale del Lavoro Quarterly Review, March, 128: 45-53. Vos, Ros, Taylor, Lance and Paes de Barros, Ricardo (2002), Economic Liberalisation, Distribution and Poverty, Latin America in the 1990s (Edward Elgar: London). Wacziard, R. and K. Welch (2003), ‘Trade Liberalisation and Growth: New Evidence’, NBER Working Paper 10152 (National Bureau of Economic Research, Cambridge, Mass.).
29
Appendix 1
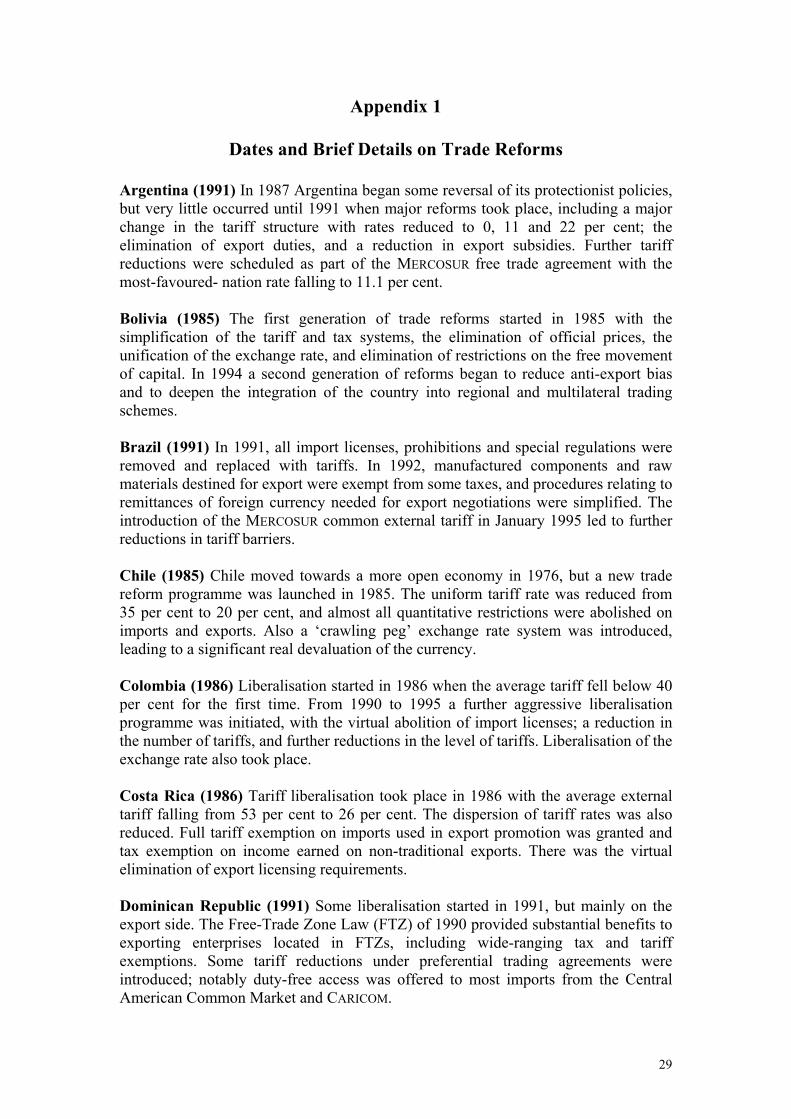
Dates and Brief Details on Trade Reforms
Argentina (1991) In 1987 Argentina began some reversal of its protectionist policies, but very little occurred until 1991 when major reforms took place, including a major change in the tariff structure with rates reduced to 0, 11 and 22 per cent; the elimination of export duties, and a reduction in export subsidies. Further tariff reductions were scheduled as part of the MERCOSUR free trade agreement with the most-favoured- nation rate falling to 11.1 per cent. Bolivia (1985) The first generation of trade reforms started in 1985 with the simplification of the tariff and tax systems, the elimination of official prices, the unification of the exchange rate, and elimination of restrictions on the free movement of capital. In 1994 a second generation of reforms began to reduce anti-export bias and to deepen the integration of the country into regional and multilateral trading schemes. Brazil (1991) In 1991, all import licenses, prohibitions and special regulations were removed and replaced with tariffs. In 1992, manufactured components and raw materials destined for export were exempt from some taxes, and procedures relating to remittances of foreign currency needed for export negotiations were simplified. The introduction of the MERCOSUR common external tariff in January 1995 led to further reductions in tariff barriers. Chile (1985) Chile moved towards a more open economy in 1976, but a new trade reform programme was launched in 1985. The uniform tariff rate was reduced from 35 per cent to 20 per cent, and almost all quantitative restrictions were abolished on imports and exports. Also a ‘crawling peg’ exchange rate system was introduced, leading to a significant real devaluation of the currency. Colombia (1986) Liberalisation started in 1986 when the average tariff fell below 40 per cent for the first time. From 1990 to 1995 a further aggressive liberalisation programme was initiated, with the virtual abolition of import licenses; a reduction in the number of tariffs, and further reductions in the level of tariffs. Liberalisation of the exchange rate also took place. Costa Rica (1986) Tariff liberalisation took place in 1986 with the average external tariff falling from 53 per cent to 26 per cent. The dispersion of tariff rates was also reduced. Full tariff exemption on imports used in export promotion was granted and tax exemption on income earned on non-traditional exports. There was the virtual elimination of export licensing requirements. Dominican Republic (1991) Some liberalisation started in 1991, but mainly on the export side. The Free-Trade Zone Law (FTZ) of 1990 provided substantial benefits to exporting enterprises located in FTZs, including wide-ranging tax and tariff exemptions. Some tariff reductions under preferential trading agreements were introduced; notably duty-free access was offered to most imports from the Central American Common Market and CARICOM.
30
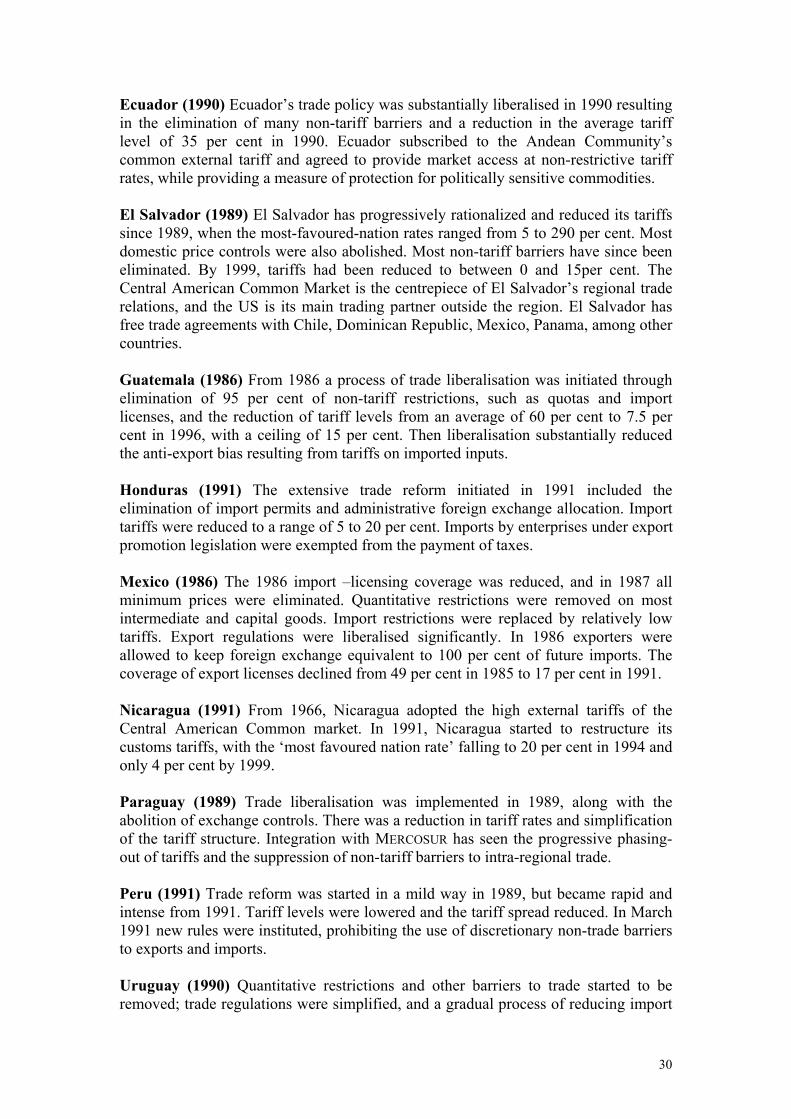
Ecuador (1990) Ecuador’s trade policy was substantially liberalised in 1990 resulting in the elimination of many non-tariff barriers and a reduction in the average tariff level of 35 per cent in 1990. Ecuador subscribed to the Andean Community’s common external tariff and agreed to provide market access at non-restrictive tariff rates, while providing a measure of protection for politically sensitive commodities. El Salvador (1989) El Salvador has progressively rationalized and reduced its tariffs since 1989, when the most-favoured-nation rates ranged from 5 to 290 per cent. Most domestic price controls were also abolished. Most non-tariff barriers have since been eliminated. By 1999, tariffs had been reduced to between 0 and 15per cent. The Central American Common Market is the centrepiece of El Salvador’s regional trade relations, and the US is its main trading partner outside the region. El Salvador has free trade agreements with Chile, Dominican Republic, Mexico, Panama, among other countries. Guatemala (1986) From 1986 a process of trade liberalisation was initiated through elimination of 95 per cent of non-tariff restrictions, such as quotas and import licenses, and the reduction of tariff levels from an average of 60 per cent to 7.5 per cent in 1996, with a ceiling of 15 per cent. Then liberalisation substantially reduced the anti-export bias resulting from tariffs on imported inputs. Honduras (1991) The extensive trade reform initiated in 1991 included the elimination of import permits and administrative foreign exchange allocation. Import tariffs were reduced to a range of 5 to 20 per cent. Imports by enterprises under export promotion legislation were exempted from the payment of taxes. Mexico (1986) The 1986 import –licensing coverage was reduced, and in 1987 all minimum prices were eliminated. Quantitative restrictions were removed on most intermediate and capital goods. Import restrictions were replaced by relatively low tariffs. Export regulations were liberalised significantly. In 1986 exporters were allowed to keep foreign exchange equivalent to 100 per cent of future imports. The coverage of export licenses declined from 49 per cent in 1985 to 17 per cent in 1991. Nicaragua (1991) From 1966, Nicaragua adopted the high external tariffs of the Central American Common market. In 1991, Nicaragua started to restructure its customs tariffs, with the ‘most favoured nation rate’ falling to 20 per cent in 1994 and only 4 per cent by 1999. Paraguay (1989) Trade liberalisation was implemented in 1989, along with the abolition of exchange controls. There was a reduction in tariff rates and simplification of the tariff structure. Integration with MERCOSUR has seen the progressive phasing-out of tariffs and the suppression of non-tariff barriers to intra-regional trade. Peru (1991) Trade reform was started in a mild way in 1989, but became rapid and intense from 1991. Tariff levels were lowered and the tariff spread reduced. In March 1991 new rules were instituted, prohibiting the use of discretionary non-trade barriers to exports and imports. Uruguay (1990) Quantitative restrictions and other barriers to trade started to be removed; trade regulations were simplified, and a gradual process of reducing import
31
duties was established. Reference prices were eliminated in 1994. The structure and level of tariffs have been determined by the programme of convergence towards the common external tariff of MERCOSUR. Venezuela (1989) In 1989, licensing was eliminated on items covering 76 per cent of manufacturing imports, and in 1990 quantitative restrictions on manufactures and agricultural products were removed. Both the level and range of tariffs were lowered substantially. The average rate was reduced from 37 per cent to 19 per cent between 1989 and 1991. In March 1990, all export restrictions were eliminated and a duty-drawback scheme was introduced with a flat rate of 5 per cent.
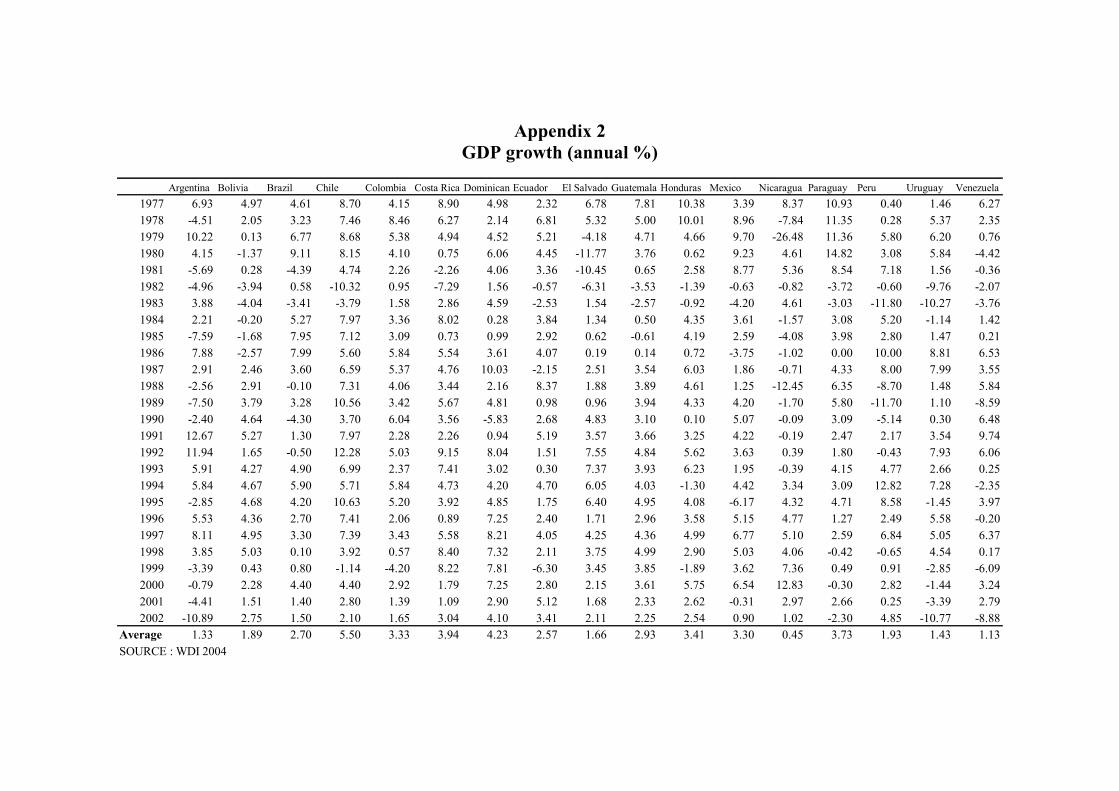
Appendix 2 GDP growth (annual %)
Argentina Bolivia Brazil Chile Colombia Costa Rica Dominican Ecuador El SalvadorGuatemala Honduras Mexico Nicaragua Paraguay Peru Uruguay Venezuela
1977 6.93 4.97 4.61 8.70 4.15 8.90 4.98 2.32 6.78 7.81 10.38 3.39 8.37 10.93 0.40 1.46 6.271978 -4.51 2.05 3.23 7.46 8.46 6.27 2.14 6.81 5.32 5.00 10.01 8.96 -7.84 11.35 0.28 5.37 2.351979 10.22 0.13 6.77 8.68 5.38 4.94 4.52 5.21 -4.18 4.71 4.66 9.70 -26.48 11.36 5.80 6.20 0.761980 4.15 -1.37 9.11 8.15 4.10 0.75 6.06 4.45 -11.77 3.76 0.62 9.23 4.61 14.82 3.08 5.84 -4.421981 -5.69 0.28 -4.39 4.74 2.26 -2.26 4.06 3.36 -10.45 0.65 2.58 8.77 5.36 8.54 7.18 1.56 -0.361982 -4.96 -3.94 0.58 -10.32 0.95 -7.29 1.56 -0.57 -6.31 -3.53 -1.39 -0.63 -0.82 -3.72 -0.60 -9.76 -2.071983 3.88 -4.04 -3.41 -3.79 1.58 2.86 4.59 -2.53 1.54 -2.57 -0.92 -4.20 4.61 -3.03 -11.80 -10.27 -3.761984 2.21 -0.20 5.27 7.97 3.36 8.02 0.28 3.84 1.34 0.50 4.35 3.61 -1.57 3.08 5.20 -1.14 1.421985 -7.59 -1.68 7.95 7.12 3.09 0.73 0.99 2.92 0.62 -0.61 4.19 2.59 -4.08 3.98 2.80 1.47 0.211986 7.88 -2.57 7.99 5.60 5.84 5.54 3.61 4.07 0.19 0.14 0.72 -3.75 -1.02 0.00 10.00 8.81 6.531987 2.91 2.46 3.60 6.59 5.37 4.76 10.03 -2.15 2.51 3.54 6.03 1.86 -0.71 4.33 8.00 7.99 3.551988 -2.56 2.91 -0.10 7.31 4.06 3.44 2.16 8.37 1.88 3.89 4.61 1.25 -12.45 6.35 -8.70 1.48 5.841989 -7.50 3.79 3.28 10.56 3.42 5.67 4.81 0.98 0.96 3.94 4.33 4.20 -1.70 5.80 -11.70 1.10 -8.591990 -2.40 4.64 -4.30 3.70 6.04 3.56 -5.83 2.68 4.83 3.10 0.10 5.07 -0.09 3.09 -5.14 0.30 6.481991 12.67 5.27 1.30 7.97 2.28 2.26 0.94 5.19 3.57 3.66 3.25 4.22 -0.19 2.47 2.17 3.54 9.741992 11.94 1.65 -0.50 12.28 5.03 9.15 8.04 1.51 7.55 4.84 5.62 3.63 0.39 1.80 -0.43 7.93 6.061993 5.91 4.27 4.90 6.99 2.37 7.41 3.02 0.30 7.37 3.93 6.23 1.95 -0.39 4.15 4.77 2.66 0.251994 5.84 4.67 5.90 5.71 5.84 4.73 4.20 4.70 6.05 4.03 -1.30 4.42 3.34 3.09 12.82 7.28 -2.351995 -2.85 4.68 4.20 10.63 5.20 3.92 4.85 1.75 6.40 4.95 4.08 -6.17 4.32 4.71 8.58 -1.45 3.971996 5.53 4.36 2.70 7.41 2.06 0.89 7.25 2.40 1.71 2.96 3.58 5.15 4.77 1.27 2.49 5.58 -0.201997 8.11 4.95 3.30 7.39 3.43 5.58 8.21 4.05 4.25 4.36 4.99 6.77 5.10 2.59 6.84 5.05 6.371998 3.85 5.03 0.10 3.92 0.57 8.40 7.32 2.11 3.75 4.99 2.90 5.03 4.06 -0.42 -0.65 4.54 0.171999 -3.39 0.43 0.80 -1.14 -4.20 8.22 7.81 -6.30 3.45 3.85 -1.89 3.62 7.36 0.49 0.91 -2.85 -6.092000 -0.79 2.28 4.40 4.40 2.92 1.79 7.25 2.80 2.15 3.61 5.75 6.54 12.83 -0.30 2.82 -1.44 3.242001 -4.41 1.51 1.40 2.80 1.39 1.09 2.90 5.12 1.68 2.33 2.62 -0.31 2.97 2.66 0.25 -3.39 2.792002 -10.89 2.75 1.50 2.10 1.65 3.04 4.10 3.41 2.11 2.25 2.54 0.90 1.02 -2.30 4.85 -10.77 -8.88
Average 1.33 1.89 2.70 5.50 3.33 3.94 4.23 2.57 1.66 2.93 3.41 3.30 0.45 3.73 1.93 1.43 1.13SOURCE : WDI 2004
33
Appendix 3 Trade Balance (% of GDP)
ArgentinaBolivia Brazil Chile Colombia Costa Ric Dominica Ecuador El Salvad Guatemal Honduras Mexico NicaraguaParaguay Peru Uruguay Venezuela
1977 2.62 0.65 -0.65 -2.61 2.69 -6.28 -4.25 3.57 1.46 1.95 -3.71 -1.62 -5.61 -1.39 -1.30 -3.30 -3.171978 4.42 -7.14 -1.19 -6.04 0.17 -8.54 -6.51 0.68 -5.75 -3.25 -4.41 -2.05 2.35 -4.92 6.30 -1.45 -5.371979 1.60 -4.46 -2.03 -4.41 0.17 -11.47 -6.26 5.26 5.37 -3.81 -4.09 -2.31 13.20 -6.32 10.75 -5.84 6.331980 -3.27 9.96 -2.05 -3.96 -2.44 -11.14 -11.27 1.92 0.03 -0.99 -6.98 -2.12 -20.33 -6.66 6.41 -6.13 10.661981 -0.36 -0.17 -0.30 -10.25 -6.28 -7.66 -6.80 1.47 -5.50 -5.37 -6.67 -2.06 -19.84 -5.26 0.38 -3.87 10.091982 2.71 9.17 -0.32 -1.17 -6.30 -0.73 -8.90 1.20 -4.65 -3.07 -1.41 3.63 -15.07 -6.31 1.29 -0.95 4.601983 3.20 6.66 2.51 3.77 -5.07 -3.65 -7.14 7.70 -4.48 0.36 -4.26 9.05 -14.42 -4.94 4.08 5.06 9.261984 4.45 8.71 5.64 0.40 -2.71 -2.40 -3.78 8.82 -7.10 -1.58 -5.06 7.07 -14.82 -5.71 6.38 3.25 13.741985 5.20 -2.18 5.07 4.44 -1.69 -3.11 -11.08 9.61 -7.42 -1.06 -2.97 4.14 -24.67 -6.26 6.07 4.26 10.221986 2.01 -0.91 2.53 4.26 3.55 -0.61 -11.38 3.51 -4.77 1.01 -0.55 3.27 -21.14 -9.73 0.78 3.72 0.261987 0.50 -4.51 3.28 4.00 0.88 -4.96 -15.81 -3.56 -10.18 -6.49 -0.87 5.63 -14.39 -6.48 -1.43 0.64 1.911988 3.01 0.20 5.28 7.29 0.09 -3.55 -12.41 5.25 -9.50 -6.82 -2.47 0.70 -21.74 -1.62 -3.30 3.03 -4.121989 7.01 4.47 3.14 3.40 1.80 -5.75 -14.58 5.24 -15.16 -6.49 -3.09 -0.55 -30.00 5.71 7.19 4.57 12.651990 5.86 4.91 1.92 2.08 2.92 -9.49 -11.82 8.24 -14.17 -6.35 -3.41 -1.08 -30.51 -7.46 2.27 3.77 20.911991 1.95 -2.26 2.13 2.12 5.64 -3.90 -7.97 3.99 -15.40 -6.90 -5.31 -3.06 -32.17 -11.57 1.49 -0.29 7.501992 -1.15 -6.73 3.26 -0.42 0.81 -6.99 -11.65 4.80 -17.76 -11.84 -6.87 -5.19 -35.25 -11.87 -1.33 -2.66 0.201993 -1.55 -8.34 2.47 -4.35 -4.87 -9.23 -14.81 2.28 -15.99 -11.04 -9.08 -4.11 -27.16 -14.02 -2.06 -4.54 3.621994 -2.28 -2.96 1.38 -0.42 -4.24 -8.71 -13.27 1.06 -16.05 -9.70 -6.21 -5.27 -29.37 -19.79 -2.39 -5.00 11.821995 0.33 -4.82 -1.03 0.19 -4.10 -4.98 -11.04 0.77 -17.65 -7.76 -10.66 1.29 -25.43 -24.68 -3.75 -3.94 7.501996 0.02 -6.73 -1.19 -3.16 -3.19 -4.81 -11.77 4.54 -13.90 -7.07 -12.82 0.70 -25.14 -22.43 -3.67 -4.51 18.691997 -1.39 -8.63 -1.49 -2.34 -3.61 -5.11 -12.99 1.31 -11.88 -8.48 -14.91 -1.10 -37.89 -24.07 -2.95 -4.61 7.911998 -1.66 -10.34 -1.20 -4.87 -3.84 -5.10 -16.27 -5.90 -12.57 -10.66 -19.04 -3.20 -44.47 -21.90 -4.35 -4.65 1.441999 -0.77 -8.50 -0.69 1.61 1.06 1.63 -16.75 8.60 -12.72 -10.84 -27.87 -2.02 -59.53 -15.05 -2.51 -5.36 5.932000 0.37 -7.15 -0.58 0.93 1.79 -3.18 -18.96 7.57 -15.27 -10.86 -24.34 -2.24 -29.34 -17.12 -0.73 -5.83 12.862001 2.34 -5.27 -0.06 0.98 -0.71 -9.49 -18.02 -3.26 -15.67 -14.99 -24.99 -2.34 -29.58 -17.41 -0.40 -5.36 7.442002 16.04 -5.90 2.35 1.94 -0.91 -11.39 -17.08 -5.76 -15.39 -16.52 -25.44 -1.95 -29.95 -13.43 0.29 -0.85 15.96
Average 1.97 -2.01 1.08 -0.25 -1.09 -5.79 -11.15 3.03 -10.08 -6.49 -9.13 -0.26 -23.93 -10.80 0.90 -1.57 7.26SOURCE: WDI 2004
34
Appendix 4 Current Account Balance (% of GDP)
Argentina Bolivia Brazil Chile Colombia Costa Rica Dominican Ecuador El SalvadorGuatemala Honduras Mexico Nicaragua Paraguay Peru Uruguay Venezuela
1977 1.98 -5.48 -2.87 -4.12 1.93 -7.34 -2.80 -4.96 1.27 -0.64 -7.71 -2.10 -8.17 -2.80 -6.48 -3.40 -7.271978 3.20 -13.22 -3.48 -7.06 1.11 -10.31 -6.53 -9.04 -8.91 -4.46 -8.15 -3.70 -1.17 -4.41 -1.59 -2.60 -11.931979 -0.74 -13.20 -4.67 -5.74 1.57 -13.83 -6.03 -6.57 0.93 -2.98 -8.53 -4.02 11.50 -6.03 4.69 -4.99 0.611980 -6.20 -0.23 -5.46 -7.15 -0.62 -13.74 -10.86 -5.39 0.95 -2.07 -12.35 -5.36 -19.19 -6.05 -0.49 -7.00 6.821981 -5.99 -16.19 -4.46 -14.50 -5.39 -15.59 -5.36 -7.14 -7.29 -6.65 -10.74 -6.49 -23.91 -6.46 -6.92 -4.19 5.131982 -2.79 -5.81 -5.79 -9.47 -7.84 -10.23 -5.56 -8.96 -3.53 -4.58 -7.86 -3.39 -20.94 -6.91 -6.48 -2.57 -5.361983 -2.34 -5.27 -3.36 -5.65 -7.75 -8.89 -4.85 -1.03 -0.79 -2.47 -7.12 3.94 -18.43 -4.42 -4.56 -1.23 5.451984 -3.15 -6.56 0.02 -10.98 -3.66 -4.13 -1.58 -2.40 -1.47 -3.99 -9.53 2.38 -19.15 -7.23 -1.17 -2.67 7.771985 -1.08 -9.14 -0.13 -8.57 -5.18 -3.22 -2.13 0.64 -0.75 -2.20 -6.05 0.43 -28.73 -7.96 0.54 -2.08 5.371986 -2.70 -9.82 -1.98 -6.72 1.10 -1.81 -3.00 -5.65 3.10 -0.21 -3.08 -1.06 -23.93 -10.30 -7.75 0.71 -3.711987 -3.89 -9.94 -0.49 -3.55 0.92 -5.66 -6.25 -13.05 3.43 -6.25 -3.95 3.03 -17.93 -13.12 -8.64 -1.92 -2.891988 -1.24 -6.62 1.26 -0.96 -0.55 -3.87 -0.35 -7.47 0.62 -5.28 -2.79 -1.30 -27.19 -5.32 -14.70 0.27 -9.651989 -1.70 -5.73 0.22 -2.51 -0.51 -7.90 -4.89 -7.50 -4.45 -4.36 -4.78 -2.61 -35.70 5.86 -2.77 1.54 4.961990 3.22 -4.09 -0.83 -1.60 1.35 -7.42 -3.95 -3.48 -3.16 -2.78 -1.69 -2.84 -30.23 7.41 -5.40 2.00 17.041991 -0.34 -4.91 -0.36 -0.28 5.70 -1.05 -2.07 -6.24 -3.15 -1.95 -5.62 -4.73 -17.75 1.36 -4.35 0.38 3.251992 -2.47 -9.46 1.56 -2.28 1.83 -4.32 -8.02 -1.02 -1.83 -6.76 -7.55 -6.72 -42.89 -0.89 -5.23 -0.07 -6.201993 -3.45 -8.81 0.00 -5.75 -3.77 -6.43 -5.47 -5.64 -1.18 -6.16 -8.87 -5.80 -34.41 0.86 -6.97 -1.63 -3.321994 -4.33 -1.51 -0.21 -3.11 -4.50 -2.21 -2.59 -4.83 -0.22 -4.82 -10.00 -7.05 -51.25 -3.49 -6.20 -2.51 4.351995 -2.01 -4.50 -2.58 -2.07 -4.89 -3.06 -1.45 -4.95 -2.75 -3.90 -5.07 -0.55 -42.87 -1.02 -8.65 -1.10 2.601996 -2.51 -5.13 -3.00 -4.50 -4.78 -2.23 -1.50 -0.26 -1.64 -2.86 -8.22 -0.75 -45.97 -3.67 -6.54 -1.14 12.641997 -4.18 -6.98 -3.77 -4.86 -5.39 -3.75 -1.06 -1.93 -0.88 -3.57 -5.77 -1.91 -47.14 -6.77 -5.80 -1.32 4.211998 -4.86 -7.84 -4.29 -5.36 -4.93 -3.69 -2.11 -9.02 -0.76 -5.35 -2.81 -3.82 -39.63 -1.86 -5.99 -2.13 -4.621999 -4.22 -5.89 -4.80 0.14 0.78 -4.31 -2.48 5.50 -1.92 -5.60 -4.44 -2.91 -49.29 -2.14 -2.95 -2.43 1.782000 -3.14 -5.32 -4.03 -1.01 0.75 -4.43 -5.20 5.78 -3.28 -5.44 -4.43 -3.13 -23.39 -3.76 -2.93 -2.82 9.982001 -1.48 -3.42 -4.56 -1.79 -1.53 -4.50 -4.62 -3.80 -1.38 -5.98 -5.15 -2.90 -23.58 -3.58 -2.21 -2.61 1.632002 9.40 -4.44 -1.70 -0.86 -2.02 -5.62 -4.04 -5.03 -2.69 -5.13 -4.05 -2.20 -22.18 5.33 -2.13 2.16 7.87
Average -1.81 -6.90 -2.30 -4.63 -1.78 -6.14 -4.00 -4.36 -1.60 -4.09 -6.40 -2.52 -27.06 -3.36 -4.68 -1.67 1.79SOURCE : WDI 2004