Trade Integration, Environmental Degradation, and Public Health...
35
Trade Integration, Environmental Degradation, and Public Health in Chile: Assessing the Linkages John Beghin, Brad Bowland, Sebastien Dessus, David Roland-Holst, and Dominique van der Mensbrugghe Working Paper 99-WP 211 February 1999
Transcript of Trade Integration, Environmental Degradation, and Public Health...
Trade Integration, EnvironmentalDegradation, and Public Health in Chile:Assessing the Linkages
John Beghin, Brad Bowland, Sebastien Dessus,David Roland-Holst, and Dominique van der Mensbrugghe
Working Paper 99-WP 211February 1999
TRADE INTEGRATION, ENVIRONMENTAL DEGRADATION,AND PUBLIC HEALTH IN CHILE:
ASSESSING THE LINKAGES
John Beghin, Brad Bowland, Sebastien Dessus,David Roland-Holst, and Dominique van der Mensbrugghe
Working Paper 99-WP 211February 1999
Center for Agricultural and Rural DevelopmentIowa State UniversityAmes, IA 50011-1070
John Beghin is an associate professor in the Department of Economics and head of the Trade and AgriculturalPolicy Division, CARD, Iowa State University; Brad Bowland is a research assistant, Department of AppliedEconomics, University of Minnesota; Sebastien Dessus is an economist, OECD Development Centre; DavidRoland-Holst is the James Irvine Professor of Economics, Mills College, and an economist, Center of EconomicPolicy Research (CEPR); and Dominique van der Mensbrugghe is a senior economist, OECD Development Centre.The views expressed in this paper are those of the authors and should not be attributed to their affiliated institutions.
The authors thank Jim Chalfant, Shanta Devarajan, Gunnar Eskeland, Per Fredriksson, Eckhard Janeba, Raul O'Ryan,and Randy Wigle, and conference and workshop participants at the Universidad de Chile, Comision Nacional delMedio Ambiante in Santiago, Camp Resource, The NBER University Conference on Trade and Environment, and TheWorld Bank Conference on Trade and Environment, for useful discussions and comments.
For questions or comments about the contents of this paper, please contact John C. Beghin, Iowa StateUniversity, 568E Heady Hall, Ames, IA 50011-1070; e-mail: [email protected] , phone: 515-294-5811;fax: 515-294-6336.
Permission is granted to reproduce this information with appropriate attribution to the authors and theCenter for Agricultural and Rural Development, Iowa State University, Ames, Iowa 50011-1070.
ABSTRACT
This paper uses an empirical simulation model to examine links between trade integration, pollution,
and public health in Chile. Using a general equilibrium framework, we synthesize economic, engineering,
and health data in a way that elucidates this complex relationship and can support more coherent policy in
all three areas. The basic tool of analysis is a 72-sector calibrated general equilibrium (CGE) model,
incorporating monitoring functions for 13 effluent categories and a variety of mortality and morbidity
indicators. While the methodology supports more general applications, present attention is confined to
atmospheric pollution and health status in the Santiago metropolitan area.
The trade integration scenarios examined include Chile's accession to the North American Free Trade
Agreement (NAFTA), Common Market of the Southern Cone (MERCOSUR), and unilateral opening to
world markets. The latter scenario induces substantial worsening of pollution and expansion of resource-
based sectors, partly because it facilitates access to cheaper energy. NAFTA integration is environmentally
benign in terms of pollution emissions. NAFTA accession, relative to other trade integration scenarios,
actually reduces environmental damage. Reduced Environmental damage results because trade diversion
reduces reliance on cheap energy, unlike the other two trade integration scenarios.
We find that emissions of small particulates PM-10, S02, and N0 2 , have the strongest impact on local
mortality and morbidity. These three pollutants appear to be complementary in economic activity. For
several types of emissions, accession to the NAFTA appears to be environmentally benign. Integration via
both MERCOSUR and unilateral liberalization have negative effects on the environment and upon urban
morbidity and mortality. Damages due to rising morbidity and mortality are of similar magnitude and
substantial. Integration based on unilateral trade liberalization induces damages equal to 13 percent of the
income gains arising from the trade integration.
Our results strongly support the double dividend conjecture (environment and efficiency gains).
Taxing air pollutants while reducing trade distortions and maintaining revenue neutrality induces net
welfare gains from both reduced health damages and increased efficiency.
TRADE INTEGRATION, ENVIRONMENTAL DEGRADATION,AND PUBLIC HEALTH IN CHILE:
ASSESSING THE LINKAGES
Introduction
The policy significance of trade and environment linkages has increased sharply in recent years, largely
because of a higher profile in trade negotiations such as the Uruguay Round and the North American Free
Trade Agreement (NAFTA). Among academic observers, a consensus has emerged that trade policy is not
an adequate tool for environmental protection (Beghin et al. 1994), but many other aspects of this linkage
remain contentious issues and will remain central to the policy debate (Whalley 1996).
Unfortunately, the empirical evidence to inform this debate is still scarce, and this scarcity motivates the
present paper. In particular, we seek to quantify the direct and indirect effects of environmental taxes,
including their revenue, cost, and output effects, as well as their interaction with trade policies and their
incidence upon the environment, public health, and elsewhere in the economy. For fast-growing developing
economies, greater outward-orientation holds great promise in terms of growth and efficiency. Pursuing this
goal blindly, however, may jeopardize long-term prosperity because of the environmental costs of such a
strategy. Hence, it is essential to assess the environmental impact of trade policy generally and trade
liberalization in particular, and to examine how these might be better coordinated with environmental
policies to mitigate environmental degradation.
Our paper makes several contributions. First, we explicitly incorporate links from trade to environment
to public health indicators, rather than simply measuring pollution incidence or other environmental
variables. Secondly, this paper is empirical, and intended to strengthen the basis of evidence for the rapidly
evolving policy debate on trade-environment linkages.` The present paper gives empirical evidence for
Chile, but the methodology can be extended to other countries. Using an applied general equilibrium model,
we investigate the interactions between trade and environmental policies, focusing particularly on trade
liberalization and coordinated policies of effluent taxation. We provide estimates of emissions for detailed
pollution types at the national level, identifying patterns of pollution intensity that emerge with greater
outward orientation. Although we estimate increased intensities for several pollutants when trade integration
is undertaken without concurrent environmental taxes, none of these is alarming.
3eghin, Bowland, Dessus, Roland-Holst, van der Mensbrugghe
A second motivation for the present study is to make more tangible the linkages between economic,
environmental, and public health indicators, building upon recent and current work on urban pollution and
health in Santiago (World Bank 1994; Ostro et. a l . 1995; O'Ryan 1994). This is an essential step in support
of policy formulation that takes more explicit account of economy-environment linkages. Past emphasis in
this area has been on resource depletion, which is appropriate but seriously limited since it omits more direct
and immediate personal costs of environmental degradation. We quantify the incremental mortality and
morbidity associated with combined economic and environmental polices and their monetary damages.
Because its topology, local climate, and economic concentration make this urban area comparable to
Mexico City and Jakarta, pollution in Santiago poses a major environmental challenge to Chilean policy
makers, now and well into the next century. z
In this context, we find that abatement of three air pollutants (small particulates; S02; and N02 a
determinant of ozone) has the largest impact on mortality and morbidity and far outweighs the health
benefits which might arise from abatement of other air pollutants in Santiago. We also find that Chile's
accession to the NAFTA, compared to unilateral trade liberalization, would reduce the emissions of many
pollutants and have a relatively benign effect on urban public health. Unilateral integration, by contrast,
would appear to induce a significant transfer of pollution capacity to Chile from the rest of the world,
adversely affecting the environment and public health. Here the case for coordination with environmental
policy is compelling indeed.
Last, we provide new empirical insights on the double dividend hypothesis. The double dividend arises
from revenue-neutral tax reform inducing two welfare gains: an environmental improvement through
environmental taxes and a deadweight loss reduction from decreasing existing taxes to keep revenue
constant. Several forms of the hypothesis exist (Goulder 1995). Most of the empirical investigations of the
double-dividend hypothesis abstract from considering trade distortion reductions and omit the utility gains
from improving the environment (Bovenberg and Goulder 1996; Espinosa and Smith forthcoming; for an
important exception). The omission is motivated by the hope of finding evidence of the efficiency dividend,
which would then be sufficient to establish a double dividend. Such evidence would also show that
environmental reforms pay for themselves. The difficulty of quantifying the environmental dividend may
also have been a reason to omit it. The omission tends to bias the test of the hypothesis towards rejection.
Our Chilean investigation is well suited for looking at the double-dividend conjecture. The policy reform
scenarios considered in our analysis maintain tax revenue neutrality and we explicitly value the health
benefits from mitigating air pollution. We look at several conjectures. First, we establish that imposing
revenue-neutral environmental taxes on air pollution induces net welfare gains via reduction in health
damages. We also find that the efficiency dividend is negative for these environmental reforms. Scaling
trade Integration, Environmental Degradation, and Public Health in Chij
income taxation back to offset the revenue increase from the environmental taxes induces a small decrease
i n real income. The inclusion of health damage reduction is pivotal to empirically establish net welfare gains
of this type of taxation reform. Second, we find that revenue-neutral coordinated policy reforms, in which
trade and environmental distortions are both reduced, are also welfare improving. Taxing air pollutants
while reducing trade distortions and maintaining revenue neutrality induces net welfare gains from reduced
health damages. We establish a true double dividend: efficiency gains from the tax substitution and
environmental health damages reduction.
Until 1975, Chile represented a textbook case of import-substitution, replete with trade distortions, slow
growth, foreign exchange restrictions, and resulting misallocation of resources. Following a series of policy
reforms under the structural adjustment of the 1980s, Chile has become a thriving outward-oriented
economy (Papageorgiou et al. 1990; World Bank 1994). Growth of output and exports has been spectacular
in natural resource-based industries such as agriculture, fisheries, forestry, and mining sectors in which
Chile has traditionally been competitive. These expansions have fostered rising living standards and
concerns for the environmental consequences of the resource intensity of the growth (World Bank 1994).
In parallel, urbanization is already well advanced in Chile, where about 85 percent of the population live
in or within the vicinity of major cities (for example, Santiago Metropolitan Area and Valparaiso). The
income growth and rapid urbanization have outpaced the development of infrastructures such as paved
roads, public transportation equipment, and sewage treatment systems. Several environmental problems in
urban areas are linked to the poor road infrastructure and the use of untreated wastewater in irrigated
agriculture (World Bank 1994).
The infrastructure problem exacerbates air pollution in Santiago by contributing to emissions of
suspended particulates and other effluents in the air. This problem combined with unique topological and
climatic conditions (thermal inversion) put Santiago in the league of the most-polluted cities in the world.
Rising income and heath concerns are at odds with this situation. With the assistance of international
organizations, Chile has started addressing these environmental problems especially, air and water pollution
in Santiago, and the depletion of forest resources, but environmental regulation remains limited (Birdsall
and Wheeler 1992; World Bank 1994).
A critical mass of information has recently been accumulated on urban pollution in Santiago (O'Ryan
1994; Sanchez 1992; Turner et al. 1993; World Bank 1994). We make use of this information when we link
national pollution estimates to pollution concentrations in Santiago. Our study is a useful contribution to the
existing work on Santiago for several reasons. It provides estimates of pollution emissions at the national
level and of their variations induced by policy changes, and links them to ambient pollution in Santiago.

3eghin, Bowland, Dessus, Roland-Hoist, van der Mensbrugghe
Second, our valuation of the change in mortality in Santiago resulting from policy reforms is based on a
willingness-to-pay approach (Bowland 1997), which is more accurate than the World Bank's human capital
approach (World Bank 1994). The latter merely serves as a lower bound on the value of a life saved, but it is
not terribly informative.
The TEQUILA Model
The Trade and Environment e o UILibrium Analysis (TEQUILA) model is a prototype computable
general equilibrium model developed at the Organization for Economic Cooperation and Development
(OECD) Development Centre for research on sustainable development. 3 The full model is described in
detail in Beghin et al. (1996). The TEQUILA model is recursive dynamic: each period is solved as a static
equilibrium problem given an allocation of savings and expenditure on current consumption. The bulk of
labor and capital income is distributed to the different households, and it is therefore possible to assess the
distributional impacts of changes in both trade and environmental policies.
Households are assumed to maximize utility using the extended linear expenditure system (ELES). We
assume that commodity and environmental consumptions are separable and that welfare consequences of
reforms are the sum of the welfare effects in commodity markets and environmental health damages. The
next section describes the salient features of the health module used to obtain environmental health damages.
The TEQUILA model is multi-sectoral (72 sectors for Chile) with careful disaggregation of pollution-
intensive and natural-resource-based sectors. Natural resource activities include five agricultural sectors,
forestry, fisheries, and five mining/extraction sectors. Twelve agricultural processing sectors, four wood
based sectors, four oil-based chemical industries, and eight mineral-based activities capture the linkages
between natural resources and manufacturing.
Output is characterized by CRS technology and the structure of production consists of a series of
nested CES functions. Final output is determined from the combination of (non-energy) intermediate
inputs and a composite bundle of energy and value added-labor and capital (machinery and land). Non
energy intermediate inputs are assumed to be utilized in fixed proportions with repect to total non-energy
intermediate demand. The energy-value-added bundle is decomposed into a labor aggregate, and a
capital-energy bundle. Labor demand is further decomposed into ten occupations. The capital-energy
bundle is further disaggregated into capital demand and demand for an energy aggregate. The energy
bundle is itself decomposed into four base fuel components. We use elasticity values in the multi-nesting
of production decisions, from top nesting to bottom, that reflect conventional wisdom on plausible
parameter values for developing economies (see Sadoulet and de Janvry 1995, chapter 12). These values are

Trade Integration, Environmental Degradation, and Puhlic Health in Chih
conservative estimates and are motivated by our concern not to overstate abatement possibilities achieved
through substitution away from dirty inputs and to be transparent in our model building.
We use the following values:
•
between intermediate consumption and aggregate value added made of old capital, 0;
•
between intermediate consumption and aggregate valued added including new capital, 0.5;
•
within value added and between aggregate labor and aggregate energy cum old capital, 0.12;
•
between aggregate labor and aggregate energy cum new capital, 1;
•
within aggregate labor, and between any two categories of labor, 0.4;
•
between aggregate energy and old capital, 0;
•
between aggregate energy and new capital, 0.8;
•
within aggregate energy combined with old capital and between any two types of energy inputs, 0.25;
and finally,
•
between any two energy sources combined to new capital, 2.
Most existing economywide models investigating pollution issues assume fixed proportion between
sectoral output and emissions associated with that sector (see for example Lee and Roland-Holst 1997;
Espinosa and Smith 1995). By contrast, we posit substitution possibilities between value added, energy and
non-energy intermediate goods, which allow the decrease of pollution associated with production if
pollution taxes are put in place. This is a major improvement in the incorporation of pollution in
economywide modeling. We econometrically estimate the pollution effluents by sector as being function of
energy and input use (Dessus et al. 1994). Estimates of these input-based effluents' intensities are obtained
by matching data from a social accounting matrix disaggregated at the 4-digit ISIC level to the
corresponding IPPS pollution database of The World Bank (Martin et al. 1991). Both the final consumption
and the intermediate use of polluting goods generate emissions. Excise/effluent taxes are used to achieve
pollution abatement. These taxes are measured as unit of currency per unit of emissions and are uniform
taxes per unit of effluent for all sectors. Since every sector has different effluent intensities, the pollution tax,
expressedper unit of output, varies across sectors.
A vector of 13 measures of various water, air, and soil effluents characterizes pollution by sector.
Pollution intensity varies by sector and with relative prices, since the use of "dirty" inputs is influenced by
relative price changes induced by policy intervention. The 13 pollution measures include: toxic pollutants in
water, air, and land (TOXWAT, TOXAIR, TOXSOL); bio-accumulative toxic metals in air, soil, and water
(BIOAIR, BIOSOL, BIOWAT); air pollutants such as SOz , NOz, CO z, volatile organic compounds (VOC),
and particulate intensity (PART); and finally, water pollution measured by biological oxygen demand
(BOD), and total suspended solids (TSS).

ghin, Bowland, Dessus, Roland-Holst, van der Mensbrugghe
The model incorporates three closure rules. The government saving/deficit is assumed to be fixed in real
terms, which implies that some tax rate is endogenous to achieve this budget balance. We choose to have the
household direct tax rates endogenous. Excess revenues are distributed by scaling these tax rates
proportionally. The second closure rule is that investment is savings driven. Changes in saving levels
(household, government, or foreign) will have a direct impact on the investment level. The third closure rule
holds that the trade balance is fixed (in foreign currency terms). The impact of this closure rule is that a
removal of trade distortions typically leads to a real depreciation, as increasing import demand must be
matched by rising exports at constant world prices.
There are three essential dynamic components in the TEQUILA model. The first element is factor
accumulation. Labor supply is assumed to grow exogenously, while the capital stock evolves with investment
activity. The second element is productivity growth. There are efficiency factors for capital, labor (by each
occupation), and energy. The efficiency factors are normally exogenous, but the capital efficiency factor is
imputed in the benchmark simulation to achieve a specified trajectory of real gross domestic product (GDP)
growth. The third element is a vintage capital assumption. The composition of the capital stock, which will
determine the degree of flexibility in production, is be influenced by the time path of total and sectoral
investment allocation.
We calibrate the TEQUILA model using a detailed social accounting matrix of Chile for 1992. The
model is neoclassical with all markets reaching equilibrium. Trade is modeled assuming goods are
differentiated with respect to region of origin and destination. On the import side, we account for the
heterogeneity of imports and domestic goods with the CES specification attributed to Armington. We
assume a CET specification for domestic output, in which producers are assumed to differentiate between
the domestic and export markets. We assume that Chile is a small country. Trade distortions are expressed
as ad valorem tariffs. This assumption is consistent with the recent tariffication of most trade distortions in
Chile following its structural reforms.
The Santiago Health Module
This section outlines how we map predicted pollution emissions from our simulations into health effects
for residents of Santiago, and then ascribe monetary damages to health impacts of pollution. A detailed
description is provided upon request. The model estimates the change in health status associated with a
change in major air pollutants by each of 72 industrial activities in Santiago. Changes in industry emissions
used are obtained from the economywide model. The health effects model transforms these emissions data
into corresponding changes in health status (e.g., reduction in PM-10 related mortality). In so doing, the

Trade Integration, Environmental Degradation, and Public Health in Chic
health-effects component is used to estimate the potential health damage savings (costs) corresponding to
alternative trade and environment policy scenarios analyzed by the economywide model.
In characterizing emissions, we use baseline information on major air pollutants and emission sources.
This step involves collecting data on pollutants known to cause significant health problems in Santiago, the
corresponding emission sources, and baseline average annual emissions and ambient concentration levels.
The data are used to estimate the portion of economywide emissions attributable to Santiago, as well as to
calibrate the health module of the CGE model to initial conditions. Dispersion modeling maps effluent
emissions into ambient concentration levels, and population-weighted concentration levels are used to
determine exposure rates for health impacts.
The next step involves calculating the health status response to changes in concentrations of air
pollutants. Dose response functions express the change in incidence of mortality/morbidity induced by
changes in pollution concentrations (Ostro et al. 1995). The figures on health end-points presented in the
results section should be interpreted as increases or decreases in mortality and morbidity with respect to
the mortality and morbidity that would have prevailed at a predetermined safe standard of pollution
concentrations. We look at various morbidity and mortality indicators:
premature mortality due to PM-10, SOz , and ozone;•
•
premature mortality in males ages 40-59 due to lead;
•
respiratory hospital admissions (for PM-10, ozone);
•
emergency room visits (for PM-10);
•
restricted activity days (for PM-10);
•
l ower respiratory illness for children less than 17 years of age (PM-10);
•
asthma symptoms for asthmatic population (for PM-10, ozone);
•
respiratory symptoms (for PM-10, ozone);
•
chronic bronchitis in the population age 25 or older (for PM-10);
•
minor restricted activity days (for ozone);
•
respiratory symptoms in children (for SOZ);
•
chest discomfort in adults (for SOz);
•
respiratory symptoms in adults (for NO 2 );
3eghin, Bowland, Dessus, Roland-Holst, van der Mensbrugghc
eye irritation in adults (for ozone);
•
number of headaches in adults (for CO);
•
IQ decrement in children (for lead);
•
cases of hypertension in adult males (for lead); and
non-fatal heart attacks in males ages 40-59 (for lead).
The last step is to attach a monetary value to the health impact figures. We follow a willingness-to-
pay approach to valuing morbidity and loss of life due to a change in mortality, and rely on the large body of
information and data on such measures for industrialized economies to econometrically estimate these
damages for Chile. Damages due to mortality are based on the value of a statistical life, which indicates the
aggregate valuation by individuals of reducing the risk of dying. For Santiago, our estimate is roughly .55
million dollars per life, in 1992 (purchasing power parity) US dollars. This estimate corresponds to the value
of a life reached in 2010 evaluated at risk and income levels of the business-as-usual scenario (Bowland
1997).
Because of the scarcity of corresponding morbidity estimates available for industrialized countries,
our morbidity willingness-to-pay measures are less sophisticated. Available estimates from industrialized
countries were simply scaled down to reflect the per capita income differences between Chile and these
i ndustrialized countries, expressed in (PPP) 1992 US dollars. The appendix provides the unit values used to
value morbidity and mortality changes.
Policy Reform Scenarios
The time horizon of the simulations is the period 1992-2010. We first define a reference trajectory for the
economy based on DRI-McGraw-Hill predictions of GDP growth until 2010. Factor and energy
productivity changes are endogenously determined such that the GDP forecast and the model are consistent
with each other. All policies are held constant in this reference scenario, called the business-as-usual (BAU)
scenario. For the years 1992 to 2010, the model gives us a reference trajectory base for output, absorption,
trade, and pollution emissions for this BAU scenario. This is the base or reference trajectory of the economy
for our analysis. All reported results are expressed in deviations (in percent) from this BAU scenario and for
2010, which is the final year of the simulation exercise.
The first reform scenario imposes taxes on pollutants, one at a time.' Each tax level is endogenous and is
such that the emissions of the targeted pollutant progressively decrease over time and reach a 25 percent
decrease relative to its level in the BAU results by 2010. The phasing in of these taxes is set to obtain

Trade Integration, Environmental Degradation, and Public Health in Chili
gradual reductions of 10 percent in 1995, 15 percent in 2000, 20 percent in 2005, and 25 percent in 2010.
The tax rates per unit of effluent are the shadow prices of the quantitative constraints on the pollution
emissions.
The second scenario considers gradual trade integration, combining unilateral trade liberalization
through tariff reduction vis-a-vis all trade partners, with a concurrent but modest improvement of terms of
trade. Terms of trade are parametric for Chile, assumed to be a small country, and the terms of trade
improvement is introduced as an exogenous shock to mimic transaction cost reduction resulting from
integration. We assume that export prices increase to simulate the improvement that should result from the
i ntegration of trading countries. This is equivalent to an improvement of the terms of trade. Hence, our
simulation results should not be read literally as estimates of the impact of trade liberalization under the
General Agreement on Tariffs and Trade (GATT) obligations or other types of agreement. Rather, we want
to replicate likely conditions resulting from integration and analyze their implications on specialization,
pollution, real income, and other variables of interest.'
Specifically, we decrease the ad-valorem tariffs, progressively to zero, from their reference levels (1992)
as 90 percent of original tariffs in 1995, 60 percent in 2000, 30 percent in 2005, and no tariff in 2010.
Terms-of-trade improvements are expressed as increases in observed world prices for exports by 2 percent
in 1995, 4 percent in 2000, 7 percent in 2005, and 10 percent in 2010.
We consider analogous regional integration and liberalization scenarios with NAFTA and MERCOSUR
countries. Disaggregated data on trade flows allow us to consider these alternative trade integration
scenarios. In these two trade scenarios, we remove tariffs and increase export prices following a similar
progression as in the previous scenario, but only with respect to trading partners that are members of these
two regional agreements. Our objective is to impose a sizable trade shock on the Chilean economy to
estimate changes in sectoral composition of production and trade following a more selective trade
integration. These changes determine the pollution emitted and induced by the outward trade orientation.
The last group of reform scenarios combines the first two types of reforms. For this last scenario,
the objective is to investigate the implications of coordinated trade and environment policies. Analytical
results (Copeland 1994; Beghin et al. 1997) imply that the coordinated piecemeal approach-gradual
changes of two instruments to correct for trade and environmental distortions-leads to welfare
improvements. In the context of joint trade and environmental reforms, efficiency gains are obtained
because trade distortions are reduced and because environmental degradation can be reduced as well. Recall
we want to investigate the effect of such joint reform on sectoral allocation, trade, and pollution abatement.
When border distortions have been removed (domestic border prices are equal to world prices), the

3eghin, Bowland, Dessus, Roland-Hoist, van der Mensbrugghe
i ncentives to change input mixes to abate pollution in production have been altered, compared to the case of
the single environmental reform. The differences in the incentive structures lead one to expect contrasting
results concerning the indirect abatement achieved via complementarity and substitution among emission
types, which occurs under the two scenarios.
Results from Policy Reform Simulations
Results follow the sequence of the three reform scenarios: environmental tax reform, trade integration
(unilateral, NAFTA, and MERCOSUR), and then combined trade integration and environmental protection.
Results are presented for the final year, 2010, in percent deviations from their BAU values. Table 1
summarizes the salient results of the simulations in aggregate. Table 2 shows the effects of the various
scenarios on pollution emissions. We first note some stylized facts emerging from the Social Accounting
Matrix on sectors that appear to be pollution hot-spots in Chile. The following sectors exhibit high
intensities and levels for several effluent types: agriculture, sugar refining, mining, chemicals, metals,
pottery, electricity, gas, and transportation sectors.
Effluent taxes
Effluent taxes have a small negative impact on growth except for the tax on bio-accumulative emissions
released in water (BIOWAT), which has a larger impact (an 8.1 percent decrease in GDP over 18 years with
respect to what it would have been under BAU). Hence, this negative real income effect indicates that
environmental reforms "do not pay" for themselves in the narrow efficiency sense of the double-dividend
conjecture. There is a real efficiency cost involved in the implementation of the environmental reforms. The
effects of these taxes on other aggregate measures of economic activity tend to be small as well, with the
same exception of the tax on BIOWAT. Trade decreases by about 10 percent and investment decreases by
23 percent. The moderate aggregate output effect of the environmental taxes is a result from aggregation. It
dissimulates substantial variations at the disaggregated sectoral level and reallocation of resources across
sectors.
Next we look at noticeable sectoral output effects, i.e. substantial changes in output occurring in some of
the 72 disaggregated sectors included in the model. For the first four taxes (all three toxics, BIOAIR), fish
and seafood output increase significantly (increases of 60 to 193 percent). For the same effluent taxes,
mining activities decrease sharply (-17 to -60 percent). The tax on BIOWAT, which induces the largest
decrease in aggregate output, has a negative effect on virtually all sectors, and it especially has a strong
effect on iron, coal, and basic metals (-30 to -59 percent). For trade contracts with the effluent taxes, at the
disaggregated sectoral levels, trade effects are mixed (some decreases, some increases) and moderate.
Trade Integration, Environmental Degradation, and Public Health in Chile / 1 i
The simulation results indicate that the impact of the taxes on pollution abatement is diverse. Strong
complementarities are observed in several subsets of the 13 effluent types, despite the clear possibility of
substitution among pollution emissions implied by our model since we do not impose any fixed proportions
between output and emissions. An increase in the tax on one effluent induces a decrease in another effluent
level. All toxics are such a group; so are all bio-accumulative emissions, and N0 2 , SO 2 and PART (PM-10).
The larger subset of toxics and bio-accumulative emissions follows such a pattern. More intriguing is the
presence, in the aggregate, of substitution possibilities among effluents. For example, SO 2 and NO2 are
substitutes for TSS and for bio-accumulative emissions in air and soil.
The tax rates implied by the targeted decrease in emissions are realistic when expressed in ad
valorem equivalent of the producer price. On average, the pollution tax per unit of sectoral output is 4
percent or less for all 13 scenarios. The individual tax rates (per sector and by effluent) vary from 0 percent
to less than 15 percent for all 13 scenarios, except for the scenario targeting reduction in VOC. In the latter
scenario the pollution tax rate on wine and liquors jumps to 52 percent, and the corresponding tax rate on
furniture products is 37 percent. These high rates are caused by the fact that these two sectors account for
most of the VOC pollution in production.
The decomposition of pollution abatement by source, following Copeland and Taylor's (1994)
decomposition into scale (aggregate output expansion), composition (composition of GDP), and technique
(input substitution) effects, reveals interesting results.' First, the composition effect seems overwhelming
both in the abatement in production and consumption. The effect is more substantial in production than in
consumption; that is, imports substitute for domestic output in pollution-intensive sectors. The technical
effect in production is moderate, and the scale effect is marginal for most pollutants except for the case of
the tax on BIOWAT (production scale effect of -8.1 percent). Surprisingly, a few simulations exhibit
positive scale effects in production abatement (all toxics, BIOAIR, BIOSOL, and BOD). Since the scale
effect is the aggregation of sectoral output effects over all sectors, the latter result may be due to the
expansion of activities that are not intensive in the pollutants being taxed. This expansion, weighted by
prices, outweighs the decrease in output in polluting sectors. For instance, the taxes on all three toxics
decrease toxic-intensive industries such as mining and metallic industries, but stimulate fisheries and
seafood, and forestry and wood products.
This example shows the limitation of tackling environmental degradation by a single pollution
effluent at a time. Abatement of one effluent gives rise to an increase in resource-intensive activities such as
forestry and may induce additional degradation and welfare losses if externalities are present in these
sectors. This result reinforces our finding that targeting one specific pollutant group can have unintended
eghin, Bowland, Dessus, Roland-Hoist, van der Mensbrugghe
and damaging consequences on emissions of "substitute" pollutant groups, and calls for an integrated
approach to the design of environmental policies (all emissions, natural resource extraction).
In addition, the decomposition of abatement sheds light on the substitutability between effluents. A
variety of patterns emerges. Substitution between two effluent types occurs when all three effects are
positive (for example, TSS response to tax on TOXWAT), or when two or less out of the three effects are
positive and larger in magnitude than the remaining effect(s) (for example, C0 2 response to BOD tax).
The impact of the effluent taxes on the concentration in Santiago is diverse and to some extent
follows the complementarity/substitution patterns observed for emissions. As shown in Table 2, all three
toxic taxes provide significant decreases in lead (about 10 percent), but nothing else, except for a slight
increase in CO concentration (1.1 percent). The three bio-accumulative pollution taxes decrease lead
concentrations as well (by 10 to 20 percent). The tax on BIOWAT has negative and sometime large effects
on other concentrations as well-remember it is the tax that has the largest negative scale effects among the
effluent taxes. Air pollution taxes also produce similar concentration patterns. Emission taxes on either NO 2,
S02 , or PM-10 lead to a substantial decrease in the other two (averaging about 19 percent), and some
decrease in CO (averaging about 5 percent). Taxes on CO and VOC also achieve substantial decreases in
concentration in Santiago. The taxes on water pollution (BOD, TSS) have marginal impact on most of the
concentrations.
As shown in Table 3, the health endpoint changes are striking for the taxes on S02 , N02, and PM-
10. Premature mortality due to PM-10, SO 2 , and ozone decreases by more than 30 percent. With these three
taxes, most endpoints show improvements with decreases of morbidity of about 30 percent for seven of the
morbidity measures. There is a marginal deterioration of morbidity incidence linked to lead (about 1
percent). This result is the consequence of the slight increase in BIOAIR emissions induced by the taxes on
S02 and N0 2 (around 4 percent).
Table 4 presents the health damages reduction induced by the environmental taxes. Figures within
parentheses indicate a reduction in damages. The tax on PM-10 induces a decrease in monetary damages
equivalent to .82 percent of the BAU 2010 GDP; taxes on S02 and N0 2 reduce damages by an amount
equivalent to .65 percent of BAU 2010 GDP. The latter taxes induce net gains or a double dividend, as
approximated by the loss of aggregate income plus the reduction in damages. These results show the
importance of accounting for nonmarket benefits when considering the impact of environmental taxes. The
estimated welfare gains are lower-bound estimates because the decreases in morbidity and mortality are
only applied to Santiago's population. As suggested by the table, some taxes, such as the tax on VOC,
induce negligible net gains in welfare. Hence, we find evidence of a net dividend-when accounting for

health damages environmental reform can pay for themselves-but the latter is rather small in part because
we only value health benefits for a subset of the Chilean population.
Trade Integration
'rade Integration, Environmental Degradation, and Public Health in Chic
To summarize, we look at two types of trade integration leading to three scenarios: with the world
(unilateral integration), and regional integration (NAFTA and MERCOSUR). Unilateral integration induces
the largest increase in GDP (+5.6 percent), followed by NAFTA (1.4 percent) and MERCOSUR (0.6
percent). These gains are small-they represent the relative gains over 18 years. These small changes
originate in the outward-orientation Chile has been following; large gains from liberalization have already
occurred. Nevertheless these reforms have more significant positive impacts on aggregate trade and
aggregate gross investment.
Moving to disaggregated sectoral output effects, the three trade reforms exhibit sharp contrast. The
unilateral trade reform stimulates the output of fruit, forestry, iron, other mining, food processing, wood
products, paper, and petroleum refining. Conversely, petroleum and gas production, chemicals, glass and
other manufacturing contract with undistorted trade. With NAFTA integration, fruit, agricultural services,
other mining, food processing, wine and liquor would expand significantly, whereas copper, iron, and paper
would decrease. Hence, NAFTA integration departs significantly from integration with all partners in terms
of international specialization. MERCOSUR integration does not induce any strong effect, except for a
major increase in transportation material and a decrease in fish and seafood production.
The trade effects of these reforms are as follows. The unilateral reform induces major increases in
virtually all sectoral imports and exports, except for imports of chemicals, glass, and other manufacturing.
NAFTA integration has a smaller effect on trade than unilateral reform, except for noticeable increases in
imports of agriculture, and smaller increases for livestock, forestry, fish, mining sectors, sugar, wood
products, furniture, paper, and plastic; and for exports of fruits, mining (other than copper, coal, and iron),
dairy, wine and liquor, furniture, and pottery. Finally, the MERCOSUR integration induces increases in
imports of agricultural products, iron, oils, sugar, tobacco, petroleum refining, and metals; imports of fish
would decrease. On the export side, substantial reductions occur in exports of fish, iron, and seafood; but
food processing, chemicals, plastics, and printing expand significantly.
The pollution implications of these trade reforms are contrasting. Unilateral integration is pollution
intensive, e.g., N0 2, S02, and PM-10 have an elasticity of 3.5 with respect to GDP increases induced by this
unilateral reform. By contrast, MERCOSUR and NAFTA have elasticity values around 2.7 and 2.2,
respectively, for the same effluents. NAFTA integration induces decreases in several pollutants (the three
3eghin, Bowland, Dessus, Roland-Hoist, van der Mensbrugghe
toxics, BIOAIR, BIOSOL, and BOD). MERCOSUR induces a decrease in TSS only. The trade diversion of
NAFTA integration provides a significant environmental benefit in terms of mitigated emissions, relative to
the other two trade integration scenarios. This is an unexpected, if not overlooked, insight on trade diversion
in presence of externalities. The decrease in effluents under the NAFTA scenario is achieved through strong
composition effects in production, outweighing the scale expansion induced by NAFTA. By contrast, the
unilateral integration vis-a-vis all partners induces higher intensities in S0 2 , N02 , and PART (PM-10) via
strong technical effects towards pollution-intensive input combinations.
Still under unilateral integration, we observe marginal increases for all toxics, BIOAIR, C0 2 , VOC,
and BOD; we have marginal decreases for TSS, and BIOSOL. Finally, we see substantial increases for PM-
10, S02 , and N0 2 . These increases are observed after 18 years of expected growth and hence do not
represent anything dramatic. By contrast, NAFTA membership induces decreases in pollution intensity of
GDP or production. This difference between the two trade reforms is caused by the cheap energy import
occurring under the unilateral trade reform scenarios, but not under NAFTA.
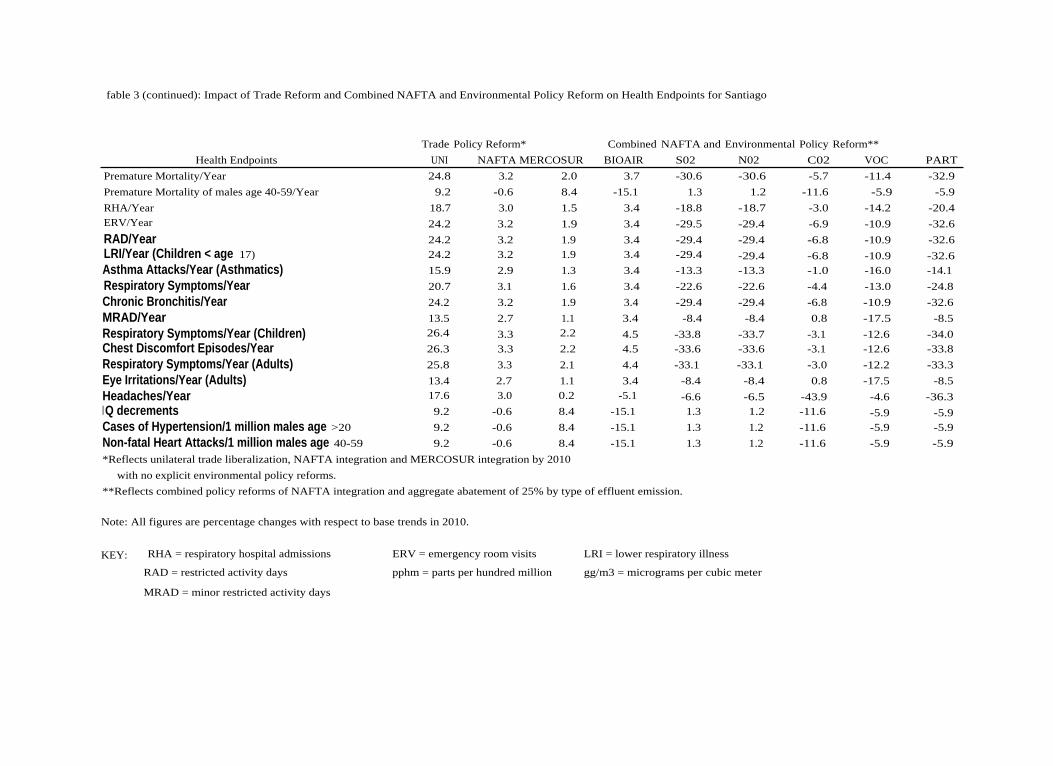
For the health end-points in Santiago, the unilateral integration scenario has negative consequences
for both mortality and almost all measures of morbidity. Premature mortality due to PM-10, ozone, and SO 2
i ncreases by 25 percent and premature death in males ages 40-59 due to lead increases by 9.2 percent, as
shown in Table 3. Morbidity increases range from 9 percent for cases of hypertension and non-fatal heart
attacks to about 26 percent for chest discomfort episodes and respiratory symptoms in children. NAFTA and
MERCOSUR induce marginal increases in the health end-points. Although NAFTA decreases several types
of emissions, these decreases do not translate into major gains for urban health because these improvements
are not relevant for air pollution in Santiago, except for a small improvement in lead concentration. The
damages associated with the health incidences are substantial for the unilateral trade integration scenario. As
suggested by Table 4, the damages represent 13 percent of the aggregate income gains induced by trade
integration (damages as percent of gains in GDP). By contrast the damages under the NAFTA scenario are
moderate due to the small deterioration of the average health status in Santiago.
Trade Integration Combined with Environmental Protection
In this last set of reforms, we first combine NAFTA integration and effluent taxes on a subset of
pollutants (air pollutants). Then, we consider the integration via unilateral trade integration coordinated with
effluent tax on one pollutant at a time. The effluent taxes are designed as in the first set of scenarios on
environmental reforms (incremental and leading to a 25 percent decrease in emissions of the taxed effluent
with respect to their BAU levels). The tax rates corresponding to these reforms are slightly higher than in
the environmental reforms alone. The average tax rates on pollution, expressed in percent of the producer
Trade Integration, Environmental Degradation, and Public Health in Chic
price per unit of output, do not exceed 5.8 percent. With trade integration, the pollution expansion requires
higher tax rates than those reached under the environmental reform alone in order to go back to a pollution
level corresponding to a 25 percent decrease with respect to the BAU level. As an additional consequence of
these higher rates, substitution/complementarity relationships between pollutant types are exacerbated.
The aggregate effect of the combined reforms (NAFTA cum effluent tax) is small in general, but it
is positive on real income in all cases. Back to the double dividend conjecture, this positive real income
effect suggests that with this larger policy menu (trade and environmental distortions), the environmental
reform pays for itself, even when one abstracts from the associated health benefits. The aggregate effects
also differ according to the pollutant considered. For example, the effluent tax on COz has practically no
effect on aggregate measures, whereas the tax on VOC has a negative impact on production and
consumption. The pollution abatement figures, including the multiplier effects of the tax on pollutants that
are not directly targeted by the tax, are surprisingly similar to the abatement figures for the reforms limited
to environmental reforms alone. The abatement on the targeted emission is, of course, exactly similar by
design, but the indirect abatement of the other pollutants does not have to be because relative prices are
different under the two scenarios. The result is surprising because changing border prices affect
specialization and hence pollution. This result is due to the fact that NAFTA integration has a mitigated
impact on the Chilean environment.
The impact of coordinated reforms-unilateral trade integration cum environmental taxes-appears
almost additive on aggregate output, trade, and consumption: the aggregate effect of the coordinated
approach is the sum of the aggregate effects of the two individual reforms. This is a recurrent result in this
type of simulation exercise (Lee and Roland-Hoist 1997; Beghin, Roland-Hoist and van der Mensbrugghe
1995). However, with respect to the double dividend issue, not all scenarios lead to an environmental benefit
and here this additivity breaks down. This result is caused by substitutions among emissions groups that are
exacerbated when trade distortions are removed. A tax on one pollutant group increases emissions of
another pollutant group and increases associated health damages. The scenarios involving unilateral trade
integration and a tax on BIOWAT, SOz NO Z VOC, and PART (PM-10) induce an environmental dividend.
The other combined scenarios do not.
Aggregate trade expands less under the coordinated reforms than under the simple unilateral trade
integration. However, some sectoral imports induced by the latter reform grow even more under the
coordinated scenario because imports are a way to abate pollution. For instance, imports of fish are larger
under the combined scenario than under the unilateral trade integration scenario.

Qhin, Bowland, Dessus, Roland-Hoist, van der Mensbrugghe
The inventory of emissions shown in Table 2 tends to duplicate the patterns reached under the
single effluent tax reform since we target the amount of pollution in a similar fashion (-25 percent for each
effluent type). Nevertheless, the substitution between bio-accumulative and toxic pollutants as a group and
air pollutants (S02, N02 , VOC, PM-10, and C0 2) as another group is amplified by trade integration. This
increased substitution is caused by a selective increase in pollution dictated by the change in relative prices
of pollutants when only one type of pollutant is taxed.
In Table 3, the urban health impact of the coordinated reforms reflects these stronger substitutions
between broad groups of pollutants. Mortality due to air pollution increases dramatically under the
combined scenarios involving bio-accumulative and toxic pollution because the emissions of PM-10, S0 2 ,
and N02 are stimulated. Similarly, the morbidity induced by S0 2, N02 , PM-10, and CO increases under the
same combined scenarios. The VOCs-ozone increases have a negative effect on many morbidity measures
including increases in restricted activity days, in the number of asthma attacks, in respiratory symptoms, in
minor restricted activity days, and in eye irritation cases. As shown in the last part of Table 4, damages
reductions under coordinated reforms are less substantial than under the environmental tax alone because of
the substitution forces at work among pollutant types. This last result was commented on earlier on. When
we compare the combined reforms to the unilateral trade integration reform alone, all combined scenarios
exhibit higher real income levels, inclusive of the health damages. For example, the tax on PM-10 combined
with unilateral trade integration induces net welfare gains that are 14 percent higher than the net gains under
trade integration alone.
Conclusions
This paper seeks to elucidate linkages between trade, environment, and public health status in an
outward-oriented economy. From our results, it is apparent that such linkages are quite complex, and policy
makers relying on intuition alone are unlikely to achieve anything close to optimality. Policies in all three
areas are clearly interdependent, and better coordination could reduce the social and economic costs of
economic growth and environmental mitigation. More detailed empirical work is needed, however, to
support such policies.
Trade integration scenarios offer different outcomes in terms of growth, international division of labor,
and environmental consequences. Integration into NAFTA is relatively benign to the environment and has
the smallest pollution elasticity with respect to the trade-induced growth. World trade integration via
unilateral trade liberalization, with no pollution abatement policy, induces higher growth and patterns of
specialization more adverse towards the environment, leading to detrimental impacts on public health in
Santiago and considerable monetary damages associated with the negative health impact. MERCOSUR
Trade Integration, Environmental Degradation, and Public Health in Chili
simulations do not indicate substantial changes in income, pollution, or public health, except for increased
emissions of bio-accumulative pollutants, and small increases in mortality and morbidity linked to lead
pollution in Santiago.
Considering effluent taxes alone, the abatement of three pollutants, SO z , NOZ , and PM-10 achieves the
largest decrease in both mortality and morbidity in Santiago. The health damage reduction exceeds the
foregone aggregate real income and corresponds to a net welfare gain to the Chilean economy. Coordinated
scenarios are well-grounded in economic theory and represent the best of both worlds (efficiency gains from
trade and protected environment); they are characterized by economic expansion and decreases in the
emissions of the targeted pollutant as well as its polluting "complements." Nevertheless, emissions of
untaxed substitute pollutants increase considerably. These strong substitutions have a negative impact on
urban health, with notable increases in mortality and morbidity when toxic and bio-accumulative pollutants
are the targets. Further, several natural-resource based sectors expand as well, hence increasing the
dimensionality of policy coordination (trade policy, effluent taxes, natural resource management). This is a
result specific to our investigation of Chile. By contrast, our analysis of trade and environment linkages in
Mexico suggests mostly complementarity between effluent types (Beghin et al. 1995).
The observed substitutability among pollutant types and its implications for urban health raises two
additional coordination and targeting issues. The first one is the coordination of environmental programs
targeting subgroups of pollutants (e.g., toxic, bio-accumulative, air criteria pollutants). Given the substantial
substitutability between these groups, an integrated approach to environmental reform encompassing all
major groups of pollutants appears appropriate to avoid unintended environmental degradation or negative
health consequences.
The other issue is the hopeful observation that strong complementarities exist within some groups
of pollutants and that a policy targeting any pollutant within a group would achieve substantial abatement in
most emission types included in the group. This finding is common to most of our case studies and emerges
as an empirical regularity in these linkages.
Another regularity shared by this study and the other case studies using the same methodology is
the relatively low cost of pollution abatement in terms of foregone aggregate income. In this specific case of
Chile and Santiago, we establish this result in terms of welfare. The monetary damages equivalent to the
health impact of air pollution are greatly reduced by environmental taxes, especially by the tax on PM-10,
NOz , and S02, such that the these welfare gains exceed the loss of GDP induced by the taxes. A net welfare
gain emerges. This statement should be qualified because the resource reallocation implied by the effluent

3eghin, Bowland, Dessus, Roland-Holst, van der Mensbrugghe
Last, we provide new empirical insights on the double dividend hypothesis, especially in the neglected
context of open economies and trade distortions. We find that revenue-neutral environmental taxes on air
pollution induce health benefits that are larger than the net efficiency loss induced by these new taxes. We
also establish that revenue-neutral coordinated policy reforms, in which trade and environmental distortions
are both reduced, constitute a double dividend with both substantial efficiency and environmental gains in
the case of air pollution in Chile. In the latter context, reducing PM-10, NO z , and S02, combined with a
removal of trade distortions, induces both efficiency and environmental benefits.
1.
The recent empirical literature on trade and environment linkages looks at the interaction between environmental regulation in the North;foreign investment and firms on the international division of labor and the emergence of pollution havens (Eskeland and Harrison 1997;Tobey 1990; Low and Yeats 1992); and the interaction between openness and specialization, and associated pollution intensity of outputand trade (Beghin et al. 1995; Birdsall and Wheeler 1992; Grossman and Krueger 1992; Hettige et al. 1992; Lee and Roland-Hoist 1997).
2.
For example, total suspended particulates (TSP) and respirable particulates (PM-10), ozone and CO concentrations in Santiago are in excessof established standards for several months every year (World Bank 1994). The one-year average concentration of PM-10 was estimated at501xg/m 3 in Santiago in 1992, the most recent year reported in the World Bank Environmental Report (World Bank 1994). Comparable PM1 0 measures for Jakarta and Bangkok suggest that Santiago's PM-10 concentration is about 50 and 30 percent higher, respectively, thanthose in the two cities.
3.
The Chilean investigation is part of the research program of the OECD Development Centre on the interface between growth, trade and theenvironment, with a focus on Pacific countries: Chile, China, Costa Rica, Indonesia, Mexico, and Vietnam (see Beghin et al., 1995, Leeand Roland-Hoist 1997, and Dessus and Bussolo 1998 for companion papers).
4.
Taxing all pollutants simultaneously raises difficulties. First, tracing the effect of any single tax on resource allocation becomes impossible.Second several tax combinations lead to the same decrease in all pollutants, but with different implications on sectoral allocation,consumption and trade.
5.
We thank Randy Wigle for this cautionary note.
ENDNOTES
6
Our decomposition of pollution follows Copeland and Taylor (1994) and Beghin et al. (1997), which differs from Grossman and Krueger's(1992). The major difference resides in the technique effect. Grossman and Krueger include technical change in their technique effect; bycontrast we consider movements along an iso-production surface away from polluting inputs with given technology.

REFERENCES
Beghin, J., D. Roland-Hoist, and D. van der Mensbrugghe, "Trade and Pollution Linkages: PiecemealReform and Optimal Intervention." Canadian Journal of Economics XXX(1997):442-55.
Beghin J., S. Dessus, D. Roland-Hoist, and D. van der Mensbrugghe. "Prototype CGE Model for theTrade and the Environment Program. Technical Specification." OECD Development CentreTechnical Papers No 116, Paris, 1996.
Beghin, J., D. Roland-Hoist, and D. van der Mensbrugghe, "Trade Liberalization and the Environment inthe Pacific Basin: Coordinated Approaches to Mexican Trade and Environment Policy." AmericanJournal ofAgricultural Economics 77(1995): 778-85.
Beghin J., D. Roland-Hoist, and D. van der Mensbrugghe. "The Trade and Environment Nexus. GlobalDimensions." OECD Economic Studies 23(winter 1994): 167-92.
Birdsall, N. and D. Wheeler. "Trade Policy and Industrial Pollution in Latin America Where are thePollution Havens?" In International Trade and the Environment, P. Low ed., pp. 159-68, 1992.
Bovenberg, A.L. and L.H. Goulder. "Optimal Environmental Taxation in the Presence of Other Taxes:General Equilibrium Analyses." American Economic Review 86(1996):985-1000.
Bowland, B.J. "Marginal Benefits of Trade and Environmental Policy: Valuing Air Pollution and Healthin a Developing Country." Thesis. North Carolina State University, Raleigh, 1997.
Copeland, B.R. "International and the Environment: Policy Reform in a Polluted Small Open Economy."Journal of Environmental Economics and Management 20(1994):44-65.
Copeland, B.R. and M.S. Taylor. "North-South Trade and the Environment." Quarterly Journal ofEconomics 109(1994):755-87.
Dessus, S. and M. Bussolo. "Is There a Trade-off Between Trade Liberalization and Pollution Abatement?A Computable General Equilibrium Assessment Applied to Costa Rica." Journal of Policy Modeling20(1998):11-31.
Dessus, S., D. Roland-Hoist, and D. van der Mensbrugghe. "Input-based Estimates for EnvironmentalAssessment in Developing Countries." OECD Development Centre Technical Papers No 87, Paris,August 1994.
Eskeland, G.S. and A.E. Harrison. "Moving to Greener Pastures? Multinationals and the Pollution-HavenHypothesis." Policy Research Working Paper No 1744, The World Bank, Washington D.C.,1997.
Espinosa, J. A. and V.K. Smith. "Measuring the Environmental Consequences of Trade Policy: ANonmarket CGE Analysis." American Journal of Agricultural Economics 77(1995):772-77.
Espinosa, J.A. and V.K. Smith. "Using the Revised MECModel to evaluate the Double Dividend ofEnvironmental Taxes." Presentation at the 1998 Southern Economics Association Meetings.

Beghin, Bowland, Dessus, Roland-Hoist, van der Mensburgghe
Goulder, L.H. "Environmental Taxation and the `Double Dividend': A Reader's Guide." International Taxand Public Finance 2(1995):157-83.
Grossman, G.M. and A.B. Krueger. "Environmental Impact of a North American Free Trade Agreement."CEPR Discussion Paper 644 (1992), London.
Hettige, H., R.E.B. Lucas, and David Wheeler. "The Toxic Intensity of Industrial Production: GlobalPatterns, Trends and Trade Policy.' American Economic Review Papers and Proceedings82(1992):478-81.
Lee, H. and D. Roland-Hoist. "The Environment and Welfare Implications of Trade and Tax Policy."Journal of Development Economics 52(1)(1997):65-82.
Low, P. (ed.). International Trade and the Environment. World Bank Discussion Paper No 159, WashingtonD.C., 1992.
Low, P. and A. Yeats. "Do Dirty Industries Migrate?" In International Trade and the Environment, P. Lowed., pp. 89-104, 1992.
Martin, P., D. Wheeler, M. Hettige, and R. Stengren. "The Industrial Pollution Projection System: Concept,Initial Development, and Critical Assessment." Mimeo. The World Bank, 1991.
O'Ryan, R.E. "Cost Effective Policies to Improve Urban Air Quality in Developing Countries: CaseStudy for Santiago, Chile." Thesis. University of California, Berkeley, 1993.
Ostro, B., J.M. Sanchez, C. Aranda, and G.S. Eskeland. "Air Pollution and Mortality: Results fromSantiago, Chile." Policy Research Working Paper (No. 1453). The World Bank, Washington D.C,1995.
Papageorgiou, D., A.M. Choksi, and M. Michaely. Liberalizing Foreign Trade in Developing Countries.The Lessons of Experience. World Bank Publications, Washington D.C., 1990.
Sadoulet, E. and A. de Janvry. Quantitative Development Policy Analysis. Baltimore: The Johns HopkinsUniversity Press, 1995.
Sanchez, J. M. "The Costs of Urban Pollution: The Case of Santiago." ILADES/Georgetown University,1992.
Tobey, J. "The Effects of Domestic Environmental Policy on Patterns of World Trade: An EmpiricalTest." Kyklos 43(1990):191-209.
Turner, S.H., C.S. Weaver, and M.J. Reale. "Cost and Emissions Benefits of Selected Air PollutionControl Measures For Santiago, Chile." Final Report Submitted to The World Bank. Engine, Fuel,and Emissions Engineering, Inc: Sacramento, CA, 1993.
Whalley, J. "Trade and Environment Beyond Singapore." NBER Working Paper NO 5768, Cambridge,MA, September 1996.
World Bank. "Chile: Managing Environmental Problems. Economic Analysis of Selected Issues." ReportNo. 13061-CH, Washington D.C., 1994.

Table 1. Impact of Policy Reform on Aggregate Variables
Aggregate VariablesReal GDPProductionConsumptionInvestmentExportsImportsLabor SupplyCapital SupplyReal IncomeAbsorption
Environmental Reform: Aggregate Abatement of 25% by Type of Effluent Emission
Aggregate Variables
Real G DP Production Consumption Investment Exports Imports Labor Supply Capital Supply Real Income Absorption
'Reflects unilateral trade liberalization, NAFTA integration and MERCOSUR integration by 2010 with no explicit environmental policy reforms.bReflects combined policy reforms of NAFTA integration and aggregate abatement of 25 percent by type of effluent emission.
TOXAIR TOXWAT TOXSOL BIOAIR BIOWAT BIOSOL S02 N02 C02 VOC PART BOD TSS
-0.7 -0.8 -0.7 -0.3 -8.1 -0.3 -0.2 -0.2 -0.1 -0.4 -0.3 -0.7 0.00.4 0.3 0.3 0.3 -8.1 0.4 -2.4 -2.4 -0.8 -3.0 -2.6 0.3 -0.1-0.4 -0.5 -0.4 0.0 -1.6 0.0 -1.3 -1.3 -0.2 -1.8 -1.3 -0.4 0.0-2.1 -2.6 -2.2 -0.8 -23.2 -0.7 -1.3 -1.3 -0.4 -2.0 -1.5 -2.3 -0.1-1.6 -1.9 -1.7 -1.0 -10.2 -0.8 -3.1 -3.1 -0.6 -2.1 -3.2 -1.7 0.0-1.2 -1.4 -1.3 -0.7 -9.6 -0.5 -3.0 -3.0 -0.5 -1.7 -3.1 -1.3 0.0-0.2 -0.3 -0.2 -0.1 -3.1 -0.1 0.2 0.2 0.0 -0.1 0.2 -0.2 0.0-0.9 -1.1 -0.9 -0.4 -10.4 -0.3 -0.6 -0.6 -0.2 -0.7 -0.7 -1.0 0.0-0.3 -0.5 -0.4 0.0 -1.3 0.0 -1.2 -1.2 -0.1 -2.5 -1.2 -0.4 0.0-0.8 -1.0 -0.8 -0.2 -7.1 -0.2 -1.2 -1.2 -0.2 -1.7 -1.2 -0.8 0.0
Trade Policy Reform' I Combined NAFTA and Environmental Policy ReformUnilateral NAFTA MERCOSUR I BIOAIR SO N0 2 C02 VOC PART
5.6 1.4 0.6 1.2 1.2 1.2 1.4 0.9 1.17.3 1.6 0.6 1.8 -1.1 -1.1 0.7 -1.8 -1.49.2 2.1 0.9 2.1 0.6 0.6 1.8 -0.1 0.617.7 4.3 1.8 3.5 2.7 2.7 3.7 1.9 2.41 8.0 3.6 2.7 2.7 0.1 0.1 2.9 1.2 -0.129.1 6.0 3.9 5.3 2.4 2.4 5.3 3.9 2.32.0 0.8 0.2 0.7 1.0 1.0 0.8 0.6 1.07.2 1.7 0.7 1.4 1.1 1.1 1.5 0.9 0.98.6 2.0 0.8 2.1 0.6 0.6 1.9 -0.9 0.6
1 0.5 2.4 1.0 2.3 1.1 1.1 2.2 0.5 1.0

Table 1 (cont) Unilateral Trade with Aggregate Abatement of 25 percent by Type of Effluent EmissionAggregate Variables TOXAIR TOXWAT TOXSOL BIOAIR BIOWAT BIOSOL SO Z NO Z CO Z VOC PART BOD TSS
Real GDP 4.7 4.4 4.7 5.3 -7.4 5.4 5.2 5.2 5.5 4.9 5.0 4.7 5.6Production 7.8 7.5 7.8 7.9 -5.9 7.9 2.9 2.9 5.5 2.4 2.5 7.8 7.1Consumption 8.7 8.4 8.7 9.1 6.3 9.1 6.7 6.7 8.6 6.0 6.7 8.6 9.2Investment 14.4 13.3 1 4.4 16.9 -21.9 1 7.1 1 4.9 14.9 16.6 13.9 1 4.5 14.3 1 7.6Exports 16.4 15.9 1 6.4 17.0 0.2 17.5 11.7 11.8 16.2 13.5 11.6 16.3 17.9I mports 27.9 27.4 27.9 28.3 10.5 28.9 22.2 22.3 27.3 24.7 22.2 27.9 29.1Labor Supply 1.7 1.7 1.7 1.8 -2.9 1.9 2.4 2.4 2.2 1.9 2.3 1.7 2.0Capital Supply 6.1 5.7 6.0 6.9 -9.6 6.9 6.2 6.2 6.9 6.0 6.0 6.0 7.2Real Income 8.2 7.9 8.1 8.6 6.1 8.6 6.2 6.3 8.2 4.4 6.3 8.1 8.6Absorption 9.3 8.8 9.3 10.3 -1.8 10.3 8.2 8.2 9.9 7.5 8.1 9.3 1 0.5

fable 2: Impact of Environmental Policy Reforms on National Effluent Emissions and Santiago Ambient Air Concentrations
Aggregate Abatement of 25% by Type of Effluent Emission
Note: All figures are percentage changes with respect to base trends in 2010.
TOXAIR TOXWAT TOXSOL BIOAIR BIOWAT BIOSOL S02 N02 C02 VOC PART BOD TSS
National Effluent EmissionsTOXAIR -25.0 -27.4 -25.0 -15.7 -11.9 -14.5 0.9 0.7 0.9 -0.1 0.8 -25.2 0.1TOXWAT -22.7 -25.0 -22.7 -13.8 -11.5 -12.8 -0.5 -0.6 0.7 -1.2 -0.5 -22.9 0.1
TOXSOL -25.0 -27.4 -25.0 -15.4 -12.2 -14.3 1.1 1.0 1.0 0.0 1.1 -25.2 0.1
BIOAIR -29.5 -31.5 -29.1 -25.0 -18.7 -19.8 4.4 4.1 -4.5 2.0 0.4 -29.1 -3.0
BIOWAT -2.0 -2.3 -2.0 -1.7 -25.0 -0.7 -0.3 -0.2 -4.1 -1.5 -3.0 -2.1 -2.0BIOSOL -37.3 -39.9 -36.8 -27.3 -13.7 -25.0 4.2 3.8 1.6 3.7 4.1 -36.9 0.0
S02 -0.6 -1.4 -0.5 0.4 -5.2 0.2 -25.0 -25.0 -4.1 -10.2 -25.2 -0.5 0.5NO, -0.6 -1.4 -0.5 0.4 -5.2 0.2 -25.0 -25.0 -4.1 -10.1 -25.3 -0.6 0.5C02 0.4 0.3 0.6 -5.1 -29.8 0.6 -8.0 -7.9 -25.0 -4.7 -23.6 0.6 -11.9VOC -0.9 -1.5 -0.9 0.1 -4.0 0.1 -3.5 -3.4 -0.6 -25.0 -3.4 -0.9 0.0PART -0.6 -1.3 -0.5 -0.2 -7.8 0.2 -23.1 -23.1 -6.2 -9.3 -25.0 -0.5 -0.8BOD -24.7 -27.2 -24.8 -15.2 -12.2 -14.0 1.1 0.9 1.0 -0.1 1.1 -25.0 0.1TSS 0.6 1.2 0.9 -11.7 -55.5 0.2 9.9 10.0 -47.0 0.8 -21.9 0.9 -25.0
Santiago Ambient ConcentrationsLead (air) -10.1 -10.9 -9.9 -12.8 -20.1 -7.2 1.3 1.3 -8.1 -3.9 -3.9 -9.8 -4.1S02 0.3 -0.3 0.4 0.9 -4.2 0.7 -19.0 -19.0 -3.0 -8.1 -19.1 0.3 0.5
N02 0.3 -0.3 0.3 0.9 -4.1 0.6 -18.7 -18.6 -3.0 -7.9 -18.8 0.3 0.5
C02 1.1 1.1 1.3 -5.0 -32.8 1.0 -5.5 -5.5 -27.0 -4.3 -22.3 1.3 -12.8
VOCS 0.1 -0.3 0.1 0.6 -3.0 0.6 -3.1 -3.0 -0.6 -18.5 -3.1 0.1 0.0PM-10 0.3 -0.2 0.4 0.3 -6.4 0.6 -16.1 -16.1 -4.8 -6.9 -17.7 0.3 -0.7Ozone 0.1 -0.2 0.1 0.5 -2.7 0.5 -6.8 -6.8 -1.1 -12.1 -6.8 0.1 0.1

Table 2 (cont): Impact of Trade Reform and Combined NAFTA and Environmental Policy Reform on National Effluent Emissionsand Santiago Ambient Air Concentrations
Note: All figures are percentage changes with respect to base trends in 2010.
*Reflects unilateral trade liberalization, NAFTA integration and MERCOSUR integration by 2010with no explicit environmental policy reforms. '
**Reflects combined policy reforms of NAFTA integration and aggregate abatement of 25% by type of effluent emission.
TradeUNI
Policy Reform'Nafta Mercosur
CombinedBIOAIR
NAFTA andSo t
Environmental
N0 2
Policy
CotReform**
voc PART
National Effluent EmissionsTOXAIR 8.6 -1.0 3.5 -13.9 -0.3 -0.4 -0.2 -1.4 -0.3
TOXWAT 9.5 -0.4 3.3 -11.8 -1.2 -1.3 0.1 -2.1 -1.3
TOXSOL 8.6 -0.8 3.5 -13.5 0.2 0.0 0.1 -1.1 0.1
BIOAIR 8.4 -3.6 8.1 -25.0 1.2 0.9 -8.6 -1.5 -3.2
BIOWAT 14.8 3.6 1.4 1.9 3.2 3.2 -0.9 1.7 0.2
BIOSO L 4.0 -4.8 4.8 -27.7 -0.4 -0.7 -3.4 -0.8 -0.5
S02 19.9 3.1 1.6 3.4 -25.0 -25.0 -1.8 -8.4 -25.2
N02 19.8 3.2 1.6 3.4 -25.0 -25.0 -1.8 -8.3 -25.2
C02 11.8 2.2 0.3 -2.8 -6.7 -6.7 -25.0 -3.2 -24.0
VOC 13.2 3.6 1.2 3.7 -0.4 -0.4 2.9 -25.0 -0.4
PART 18.9 3.1 1.5 2.8 -23.0 -23.0 -4.2 -7.5 -25.0
BO D 8.8 -0.8 3.5 -13.3 0.1 0.0 0.1 -1.1 0.1
TSS 2.8 1.4 -1.2 -10.0 12.6 12.6 -49.3 2.2 -22.8
Santiago Ambient Concentrations
Lead (air) 7.5 -0.5 6.8 -12.2 1.1 1.0 -9.4 -4.8 -4.8
S02 15.1 1.9 1.2 2.6 -19.3 -19.3 -1.8 -7.2 -19.514.7 1.9 1.2 2.5 -19.0 -18.9 -1.7 -7.0 -19.1N02
C02 11.1 1.9 0.1 -3.2 -4.2 -4.1 -27.6 -2.9 -22.8
VOCs 9.7 2.6 0.8 3.1 -0.9 -0.9 1.9 -18.6 -0.9
PM-10 13.3 1.8 1.0 1.9 -16.2 -16.2 -3.8 -6.0 -17.9
Ozone 9.2 1.9 0.8 2.3 -5.8 -5.7 0.5 -12.0 -5.8

Table 2 (continued): Impact of Coordinated Trade and Environmental Policy Reforms on National Effluent Emissions and Santiago Ambient Air
Unilateral Trade with Aggregate Abatement of 25% by Type of Effluent Emission
Note: All figures are percentage changes with respect to base trends in 2010.
TOXAIR TOXWAT TOXSOL BIOAIR BIOWAT BIOSOL S02 N02 C0 2 voc PART BOD TSS
National Effluent EmissionsTOXAIR -25.0 -28.6 -24.9 -10.4 -9.4 -7.9 12.0 11.6 12.3 10.2 11.9 -25.2 8.8
TOXWAT -21.3 -25.0 -21.2 -7.2 -8.4 -5.0 10.1 9.8 12.1 8.9 10.1 -21.6 9.7
TOXSOL -25.1 -28.9 -25.0 -10.0 -9.9 -7.6 12.4 12.0 12.4 10.3 12.4 -25.4 8.9
BIOAIR -28.5 -30.2 -27.9 -25.0 -15.8 -13.8 18.9 18.3 6.3 12.0 13.1 -27.9 5.2
BIOWAT 11.7 10.6 11.7 13.2 -25.0 14.3 13.8 13.9 8.9 11.8 9.8 11.6 12.5
BIOSOL -44.0 -46.3 -43.4 -29.8 -13.5 -25.0 15.4 14.6 11.2 13.7 15.3 -43.5 4.3
S02 18.4 16.2 18.7 20.7 8.9 20.3 -25.0 -24.9 7.2 0.9 -24.9 18.7 20.5
N02 18.3 16.2 18.6 20.5 9.0 20.2 -25.1 -25.0 7.2 1.1 -25.0 18.6 20.4
C02 11.5 10.7 11.9 7.3 -26.3 12.9 -3.3 -3.2 -25.0 2.8 -26.0 11.9 -1.4
VOC 11.4 10.0 11.5 13.3 5.9 13.4 6.4 6.5 11.4 -25.0 6.7 11.4 13.2
PART 17.5 15.5 17.8 19.0 5.1 19.3 -22.7 -22.6 3.8 1.6 -25.0 17.7 18.1
BOD -24.7 -28.5 -24.6 -9.5 -9.9 -7.2 12.3 12.0 12.5 10.3 12.4 -25.0 9.0
TSS 2.7 3.5 3.2 -8.6 -63.4 3.5 19.2 19.3 -59.2 4.3 -27.4 3.3 -25.0
Santiago Ambient ConcentrationsLead (air) -4.8 -5.7 -4.2 -11.6 -19.8 0.7 10.0 9.9 -3.8 -1.2 2.0 -4.1 2.8
S02 15.3 13.6 15.6 16.8 6.2 16.4 -19.1 -19.0 5.3 -0.1 -19.0 15.5 15.7
N02 14.9 13.2 15.2 16.3 6.1 15.9 -18.8 -18.7 5.2 0.0 -18.7 15.1 15.3
C02 12.0 11.3 12.4 6.9 -31.3 12.9 0.3 0.4 -28.9 3.0 -24.6 12.3 -3.3
VOC 9.4 8.4 9.5 10.5 4.2 10.5 3.6 3.7 7.9 -18.8 3.8 9.5 9.8
PM-10 13.5 12.0 13.8 14.3 2.2 14.4 -15.7 -15.6 1.9 0.4 -17.8 13.7 12.5
Ozone 9.1 8.1 9.2 10.0 3.9 9.9 -3.4 -3.3 5.6 -10.3 -3.2 9.2 9.4

TABLE 3: IMPACT OF ENVIRONMENTAL POLICY REFORM ON HEALTH ENDPOINTS FOR SANTIAGO
pg/m3 = micrograms per cubic meter
AGGREGATE ABATEMENT OF 25% BY TYPE OF EFFLUENT EMISSION
Note: All figures are percentage changes with respect to base trends in 2010.
KEY:
RHA = respiratory hospital admissions
ERV = emergency room visits
RAID = restricted activity days
LRI = lower respiratory illness
MRAD = minor restricted activity days
pphm = parts per hundred million
HEALTH ENDPOINTS TOXAIR TOXWA TOXSO BIOAIR BIOWAT BIOSOL S02 N02 C02 VOC PART BOD TS
Premature Mortality/Year 0.5 -0.4 0.6 0.9 -10.3 1.1 -30.3 -30.3 -7.7 -13.0 -32.4 0.6 -0.7
Premature Mortality of males age 40-59/Year -12.6 -13.5 -12.2 -15.8 -24.8 -8.9 1.7 1.6 -10.0 -4.8 -4.8 -12.2 -5.0
RHA/Year 0.3 -0.4 0.4 0.7 -7.7 0.9 -19.5 -19.4 -5.1 -15.2 -20.9 0.4 -0.5
ERV/Year 0.5 -0.4 0.7 0.5 -11.6 1.1 -29.3 -29.2 -8.7 -12.6 -32.1 0.6 -1.3
RAD/Year 0.5 -0.4 0.7 0.5 -11.6 1.1 -29.2 -29.2 -8.7 -12.6 -32.1 0.6 -1.3
LRI/Year (Children < age 17) 0.5 -0.4 0.7 0.5 -11.6 1.1 -29.2 -29.2 -8.7 -12.6 -32.1 0.6 -1.3
Asthma Attacks/Year (Asthmatics) 0.3 -0.3 0.3 0.7 -5.7 0.8 -14.4 -14.4 -3.3 -16.5 -15.1 0.3 -0.1
Respiratory Symptoms/Year 0.4 -0.4 0.5 0.6 -9.1 1.0 -23.0 -22.9 -6.4 -14.3 -24.9 0.5 -0.8
Chronic Bronchitis/Year 0.5 -0.4 0.7 0.5 -11.6 1.1 -29.2 -29.2 -8.7 -12.6 -32.1 0.6 -1.3
MRAD/Year 0.2 -0.3 0.2 0.8 -4.0 0.7 -10.0 -9.9 -1.6 -17.7 -10.0 0.2 0.2
Respiratory Symptoms/Year (Children) 0.5 -0.6 0.6 1.6 -7.4 1.2 -33.2 -33.1 -5.3 -14.2 -33.4 0.6 0.8
Chest Discomfort Episodes/Year 0.5 -0.6 0.6 1.6 -7.3 1.2 -33.1 -33.0 -5.3 -14.2 -33.3 0.6 0.8
Respiratory Symptoms/Year (Adults) 0.4 -0.6 0.6 1.5 -7.1 1.1 -32.6 -32.5 -5.2 -13.8 -32.8 0.5 0.8
Eye Irritations/Year (Adults) 0.2 -0.3 0.2 0.8 -4.0 0.7 -10.0 -9.9 -1.6 -17.7 -10.0 0.2 0.2
Headaches/Year 1.8 1.7 2.0 -8.0 -52.0 1.5 -8.8 -8.7 -42.9 -6.8 -35.4 2.0 -20.4
I Q decrements -12.6 -13.5 -12.2 -15.8 -24.8 -8.9 1.7 1.6 -10.0 -4.8 -4.8 -12.2 -5.0
Cases of Hypertension/1 million males age >20 -12.6 -13.5 -12.2 -15.8 -24.8 -8.9 1.7 1.6 -10.0 -4.8 -4.8 -12.2 -5.0
Non-fatal Heart Attacks/1 million males age 40-59 -12.6 -13.5 -12.2 -15.8 -24.8 -8.9 1.7 1.6 -10.0 -4.8 -4.8 -12.2 -5.0
fable 3 (continued): Impact of Trade Reform and Combined NAFTA and Environmental Policy Reform on Health Endpoints for Santiago
*Reflects unilateral trade liberalization, NAFTA integration and MERCOSUR integration by 2010
with no explicit environmental policy reforms.
**Reflects combined policy reforms of NAFTA integration and aggregate abatement of 25% by type of effluent emission.
Note: All figures are percentage changes with respect to base trends in 2010.
KEY:
RHA = respiratory hospital admissions
ERV = emergency room visits
LRI = lower respiratory illness
RAD = restricted activity days
pphm = parts per hundred million
gg/m3 = micrograms per cubic meter
MRAD = minor restricted activity days
Health Endpoints
Trade
UNI
Policy Reform*
NAFTA MERCOSUR
Combined
BIOAIR
NAFTA and
S02
Environmental
N02
Policy
C02
Reform**
VOC PART
Premature Mortality/Year 24.8 3.2 2.0 3.7 -30.6 -30.6 -5.7 -11.4 -32.9
Premature Mortality of males age 40-59/Year 9.2 -0.6 8.4 -15.1 1.3 1.2 -11.6 -5.9 -5.9
RHA/Year 18.7 3.0 1.5 3.4 -18.8 -18.7 -3.0 -14.2 -20.4ERV/Year 24.2 3.2 1.9 3.4 -29.5 -29.4 -6.9 -10.9 -32.6
RAD/Year 24.2 3.2 1.9 3.4 -29.4 -29.4 -6.8 -10.9 -32.6LRI/Year (Children < age 17) 24.2 3.2 1.9 3.4 -29.4 -29.4 -6.8 -10.9 -32.6Asthma Attacks/Year (Asthmatics) 15.9 2.9 1.3 3.4 -13.3 -13.3 -1.0 -16.0 -14.1
Respiratory Symptoms/Year 20.7 3.1 1.6 3.4 -22.6 -22.6 -4.4 -13.0 -24.8
Chronic Bronchitis/Year 24.2 3.2 1.9 3.4 -29.4 -29.4 -6.8 -10.9 -32.6
MRAD/Year 13.5 2.7 1.1 3.4 -8.4 -8.4 0.8 -17.5 -8.5
Respiratory Symptoms/Year (Children) 26.4 3.3 2.2 4.5 -33.8 -33.7 -3.1 -12.6 -34.0Chest Discomfort Episodes/Year 26.3 3.3 2.2 4.5 -33.6 -33.6 -3.1 -12.6 -33.8
Respiratory Symptoms/Year (Adults) 25.8 3.3 2.1 4.4 -33.1 -33.1 -3.0 -12.2 -33.3
Eye Irritations/Year (Adults) 13.4 2.7 1.1 3.4 -8.4 -8.4 0.8 -17.5 -8.5
Headaches/Year 17.6 3.0 0.2 -5.1 -6.6 -6.5 -43.9 -4.6 -36.3I Q decrements 9.2 -0.6 8.4 -15.1 1.3 1.2 -11.6 -5.9 -5.9Cases of Hypertension/1 million males age >20 9.2 -0.6 8.4 -15.1 1.3 1.2 -11.6 -5.9 -5.9
Non-fatal Heart Attacks/1 million males age 40-59 9.2 -0.6 8.4 -15.1 1.3 1.2 -11.6 -5.9 -5.9

Table 3. (cont) Impact of Coordinated Trade and Environmental (Policy Reforms on Health Endpoints for Santiago. Unilateral Trade Liberalization
with Aggregate Abatement of 25 percent by Type of Effluent Emission
Note: All figures are percentage changes with respect to base trends in 2010.
Health Endpoints TOXAIR TOXWA
T
TOXSOL BIOAIR BIOWAT BIOSOL S02 N0 2 C02 VOC PART BOD TSS
Premature Mortality/I00,000/Year 25.2 22.3 25.6 26.9 6.0 26.9 -29.8 -29.7 5.1 0.5 -32.4 25.5 24.1
Premature Mortality/1 million males age 40-59 -5.9 -7.1 -5.2 -14.3 -24.5 0.9 12.4 12.2 -4.7 -1.4 2.5 -5.1 3.5
RHA/Year 18.9 16.8 19.2 20.2 4.9 20.3 -16.5 -16.4 5.8 -7.2 -18.3 1 9.1 1 8.2
ERV/Year 24.6 21.9 25.0 25.9 4.0 26.3 -28.5 -28.4 3.4 0.8 -32.3 24.9 22.8
RAD/Year 24.6 21.9 25.0 25.9 4.0 26.2 -28.5 -28.3 3.4 0.8 -32.3 24.9 22.8
LRI/Year (Children < age 17) 24.6 21.9 25.0 25.9 4.0 26.2 -28.5 -28.3 3.4 0.8 -32.3 24.9 22.8
Asthma Attacks/Year (Asthmatics) 1 5.9 1 4.2 1 6.2 17.3 5.3 17.2 -10.4 -10.3 7.1 -11.3 -11.1 1 6.1 1 5.8
Respiratory Symptoms/Year 20.9 1 8.6 21.3 22.3 4.6 22.5 -20.8 -20.7 5.0 -4.3 -23.3 21.2 1 9.9
Chronic Bronchitis/Year 24.6 21.9 25.0 25.9 4.0 26.2 -28.5 -28.3 3.4 0.8 -32.3 24.9 22.8
MRAD/Year 13.3 11.9 13.5 14.7 5.7 14.5 -4.9 -4.8 8.3 -15.0 -4.7 1 3.4 13.7
Respiratory Symptoms/Year (Children) 26.8 23.7 27.2 29.4 10.8 28.7 -33.3 -33.1 9.3 -0.2 -33.1 27.1 27.4
Chest Discomfort Episodes/Year 26.7 23.6 27.1 29.3 10.8 28.5 -33.2 -33.0 9.3 -0.2 -33.0 27.0 27.3
Respiratory Symptoms/Year (Adults) 26.1 23.1 26.5 28.5 10.7 27.8 -32.8 -32.7 9.0 -0.1 -32.6 26.4 26.7
Eye Irritations/Year (Adults) 13.3 11.9 1 3.5 1 4.6 5.7 1 4.5 -4.9 -4.8 8.2 -15.0 -4.7 13.4 13.7
headaches/Year 1 9.0 17.9 19.6 11.0 -49.7 20.4 0.4 0.7 -46.0 4.7 -39.0 1 9.6 -5.3
I Q decrements -5.9 -7.1 -5.2 -14.3 -24.5 0.9 1 2.4 12.2 -4.7 -1.4 2.5 -5.1 3.5
Cases of Hypertension/( million males age >20 -5.9 -7.1 -5.2 -14.3 -24.5 0.9 12.4 12.2 -4.7 -1.4 2.5 -5.1 3.5
Non-fatal Heart Attacks/I million males age 40-59 -5.9 -7.1 -5.2 -14.3 -24.5 0.9 1 2.4 1 2.2 -4.7 -1.4 2.5 -5.1 3.5

TABLE 4: IMPACT OF ENVIRONMENTAL POLICY REFORM ON MORTALITY AND MORBIDITY HEALTH DAMAGES FOR SANTIAGO (IN MILLIONS 1992 PPP$)
AGGREGATE ABATEMENT OF 25% BY TYPE OF EFFLUENT EMISSION
ote:
Note: values in parentheses represent welfare gains from policy reform relative to BAU in 2010. The figures are decreases in damages induced by policy reforms.
HEALTH DAMAGES TOXAIR TOXWAT TOXSOL BI0AIR BI0WAT BIOSOL S02 N02 C02222
VOC PART BOD TSS
Mortality (16) (44) (13) (13) (348) 9 (844) (844) (240) (375) (918) (13) (32
Morbidity (422) (467) (406) (530) (1,028) (286) (393) (396) (474) (397) (658) (407) (190
Total (438) (511) (418) (543) (1,376) (276) (1,237) (1,240) (714) (773) (1,576) (419) (222
Total (% Chile BALI (0 23) (0.27) (0.22) (0.28) (b.72) (0.14) (0.65) (0.65) (0.37) (0.40) (0.82) (0.22) (0.12

TABLE 4 (CONTINUED): IMPACT OF TRADE REFORM AND COMBINED NAFTA AND ENVIRONMENTAL POLICY REFORM ON MORTALITY ANDMORBIDITY HEALTH DAMAGES FOR SANTIAGO (IN MILLIONS 1992 PPP$)
*Reflects unilateral trade integration, NAFTA integration and MERCOSUR integration by 2010with no explicit environmental policy reforms.
"Reflects combined policy reforms of NAFTA integration and aggregate abatement of 25% by type of effluent emission.
Note: All mortality and morbidity figures are valued at a reference level of GDP/capita in 2010 under BAU (measured in 1992 PPP$).
Note: values in parentheses represent welfare gains from policy reform relative to BAU in 2010.
HEALTH DAMAGESTRADEUNI
POLICY REFORM*NAFTA MERCOSUR
COMBINED NAFTABIOAIR S0 2
AND ENVIRONMENTAL POLICYN0 2 C0 2
REFORM"VOC PART
Mortality 716 88 76 67 (853) (853) (187) (333) (935
Morbidity 703 34 317 (457) (405) (408) (494) (409) (699
Total 1,419 122 393 (389) (1,258) (1,262) (682) (743) (1,634
Total ( % Chile BAU GDP) 0.74- - 0-06- 0-21 - x. 20) (0.66) (0.66) (0.36) (0.39) (0.85

TABLE 4 (CONTINUED): IMPACT OF COORDINATED TRADE AND ENVIRONMENTAL POLICY REFORMS ON MORTALITY AND MORBIDITY HEALTH DAMAGESFOR SANTIAGO (IN 1992 PPP$)
AGGREGATE ABATEMENT OF 25% BY TYPE OF EFFLUENT EMISSION
Total (% Chile BAU)
0 46
0 37
0 48
0.34
(0 34)
0.63
(0.42)
(0.42)
0.02
(0.04)
(0.68)
0.48
0.61Note: All mortality and morbidity figures are valued at a reference level of GDP/capita income in 2010 under BAU (measured in 1992 PPP$).
Note: values in parentheses represent welfare gains from policy reform relative to BAU in
2010.
HEALTH DAMAGES TOXAIR TOXWA TOXSOL BIOAIR BIOWAT BIOSOL S0 2 N02 C02 VOC PART BOD TS
Mortality 691 607 704 718 109 755 (804) (802) 131 11 (901) 701 683
Morbidity 193 109 224 (71) (764) 452 (3) (6) (90) (79) (397) 225 488
Total 884 716 927 647 (656) 1,207 (806) (808) 41 (68) (1,297) 927 1,171