Trade Complexity and Productivity - CORE°HELYTANULMÁNYOK DISCUSSION PAPERS INSTITUTE OF ECONOMICS,...
36
MŰHELYTANULMÁNYOK DISCUSSION PAPERS INSTITUTE OF ECONOMICS, HUNGARIAN ACADEMY OF SCIENCES BUDAPEST, 2009 MT-DP – 2009/14 Trade Complexity and Productivity CARLO ALTOMONTE – GÁBOR BÉKÉS
Transcript of Trade Complexity and Productivity - CORE°HELYTANULMÁNYOK DISCUSSION PAPERS INSTITUTE OF ECONOMICS,...
MŰHELYTANULMÁNYOK DISCUSSION PAPERS
INSTITUTE OF ECONOMICS, HUNGARIAN ACADEMY OF SCIENCES BUDAPEST, 2009
MT-DP – 2009/14
Trade Complexity and Productivity
CARLO ALTOMONTE – GÁBOR BÉKÉS
Discussion papers MT-DP – 2009/14
Institute of Economics, Hungarian Academy of Sciences
KTI/IE Discussion Papers are circulated to promote discussion and provoque comments. Any references to discussion papers should clearly state that the paper is preliminary.
Materials published in this series may subject to further publication.
Trade Complexity and Productivity
Carlo Altomonte assistant professor
Department of Institutional Analysis and Public Management Università Bocconi
E-mail: [email protected]
Gábor Békés research fellow
Institute of Economics Hungarian Academy of Sciences
E-mail: [email protected]
July 2009
ISBN 978 963 9796 65 2 ISSN 1785 377X

A külkereskedelmi tevékenység komplexitása
és a vállalati termelékenység
Carlo Altomonte - Gábor Békés
Összefoglaló Az 1992 és 2003 közötti magyarországi vállalati és termékszintű külkereskedelmi
adatok felhasználásával megmutatjuk, hogy az import lényegesen nagyobb hatással van
a vállalati termelékenységre, mint az, hogy a vállalat exportál-e vagy sem. Megfordítva,
az is igaz, hogy az exporthatás becslésénél az import figyelmen kívül hatása jelentős
mérési torzítást okoz. A külkereskedelmi tevékenység elindításához szükséges
elsüllyedt költségek kifizetése fontos szerepet játszik a vállalati döntésekben, ezért a
legtermelékenyebb vállalatok szelekciója erős mind az exportáló, mind az importáló
vállalatok esetében. A költségek szintje eltér az egyes külkereskedelemi státuszok
között és azokon belül is. Ezen költségeket a külkereskedelmi tevékenység
kapcsolatspecifikus jellegéhez kötjük, amely a vállalatoknál bizonyos technológiai és
szervezeti komplexitást feltételez. A külkereskedelmi tevékenység komplexitását az
export-, illetve az importárukosarak jellemzői alapján számítjuk. Azt találtuk, hogy a
vállalati termelékenység pozitív kapcsolatban van a külkereskedelmi tevékenység
komplexitásával. Az export/import elkezdése előtti, ex-ante termelékenység
meghatározza azt is, hogy a külkereskedelmi aktivitás elkezdése után milyen
komplexitású lehet majd az export/import tevékenység.
Tárgyszavak: külkereskedelmi nyitottság, vállalati heterogenitás, termelékenység
JEL: F12, F14, L25

Trade Complexity and Productivity
Carlo Altomonte∗ Gabor Bekes†‡
This version: 2 July 2009
Abstract
1We exploit a panel dataset of Hungarian firms merged with product-level trade data forthe period 1992-2003 to investigate the relation between firms’ trading activities (importing,exporting or both) and productivity. We find important self-selection effects of the mostproductive firms induced by the existence of heterogeneous sunk costs of trade, for bothimporters and exporters. We relate these sunk costs of trade to the relationship-specificnature of the trade activities, entailing a certain degree of technological and organizationalcomplexity as measured by a number of proxies. We also show that, to the extent thatimports and exports are correlated within firms, failing to control for the importing activityleads to overstated average productivity premia of exporters.
JEL classification: F12, F14, L25Keywords: trade openness, firms’ heterogeneity, productivity
∗Bocconi University & FEEM, Milan†Institute of Economics, Hungarian Academy of Sciences. Corresponding author: IE-HAS, 1112 Budaorsi ut
45, Budapest, Hungary. Email: [email protected]‡Acknowledgements: Financial support from the Micro-Dyn project of the EU 6th RTD Framework Pro-
gramme is gratefully acknowledged. We wish to thank Peter Harasztosi for excellent research assistance and GaborKorosi for invaluable help in dataset management. Balazs Murakozy provided very helpful insights on drafts, andwe acknowledge helpful comments by Mark Roberts, Gianmarco Ottaviano, Davide Castellani, Stephanie Haller,Luigi Benfratello, Marcella Nicolini as well as seminar participants in IEHAS Budapest, Perugia University, FEEMMilano, ESRI Dublin, IAW Tubingen, KU Leuven, ETSG Warsaw, COST Edinburgh. This work is part of the”Center for Firms in the Global Economy (CEFIG)” network. The entire responsibility for errors and omissionsremains on us.
1 Introduction
In the last twenty years the organization of production worldwide has undergone a fundamen-
tal change, whereby production of individual goods is increasingly fragmented among di�erent
production sites, often in di�erent countries, as extensively discussed in Arndt and Kierzkowski
(2001). Moreover, such a larger array of intermediate inputs often entails signi�cant technology
transfer costs, because some of the technologies are relatively complex, and therefore might re-
quire extensive problem-solving communication between the supplier and the producer (Keller
and Yeaple, 2008).
In such a context it is not surprising to observe, at the aggregate level, a growing importance
of traded intermediate inputs (Feenstra, 1998; Hummels, Ishii, Yi, 2001; Yi, 2003), while at the
micro level we have evidence of manufacturing �rms facing positive and signi�cant sunk costs
of trade (SCT), �rst measured by Das, Roberts and Tybout (2007) in the case of Colombian
exporting �rms. The existence of signi�cant SCT is also consistent with an acknowledged feature
of trading �rms, that is only the most productive �rms self-select into trading activities, as
originally postulated in the seminal papers of Melitz (2003) and Bernard et al. (2003).
While the latter �nding has been con�rmed by a very large number of studies on exporters
starting with Pavcnik (2002), more recent evidence has shown that, as for the case of exporters,
also importers have a variety of positive attributes, being bigger, more productive and more
capital-intensive than nonimporters, with both imports and exports appearing to be highly
concentrated among few �rms1. Such new evidence on importers can be used in order to provide
further insights on the relationship between the productivity of a �rm, the sunk costs it faces
for the di�erent trade activities, and its self-selection into trade.
On the one hand, exporters are assumed to face sunk costs linked to the marketing of their
product and eventually the setup of a foreign distribution chain (Arkolakis, 2008). Importers,
on the other hand, do not typically face these costs. Moreover, in nowadays globalized markets
domestic �rms can access imported intermediates without directly trading them, buying these
inputs as standardized products from local distributors. Or they can import standardized goods
or commodities traded on organized (e-)markets. In both cases, these �rms would face zero or
very limited SCT due to the organizational modalities of their sourcing, i.e. irrespectively of the
traded product category2.
However, the more recent data matching product and �rm-speci�c trade transactions show
that, as for exporters, a non-negligible number of �rms import di�erentiated products through
direct, contractual-speci�c transactions. These �rms face the informational asymmetries linked
to the imperfect monitoring of the quality of the purchased good, and the cost of transferring
1See Bernard et al. (2005 and 2007) for US; Castellani et al. (2008) for Italy; Muuls and Pisu (2007) for Belgium;Andersson et al. (2007) for Sweden; Kasahara and Lapham (2008) for Chile.
2In other words, if imports are undertaken through organized markets or relate to homogeneous products, thenature of the traded good (e.g. consumption, intermediate, capital) would not a�ect the sunk cost of trade, butpossibly only the �xed ones.
2
the technology embedded into it. Moreover, to the extent that production of a given �nished
product requires the use of a relatively large number of specialized parts and components, even-
tually sourced from di�erent countries, importers might also face input-speci�c �xed costs linked
to the organizational aspects of the production process (di�erent legal procedures, language and
communication barriers, quality screening, etc.). As an example, Brembo, an italian multina-
tional company active in the automotive industry, screens prospective suppliers worldwide on
the basis of a 10-pages long questionnaire, involving detailed information on some 200 di�erent
items3.
As a result, both importers and exporters might end up facing important SCT, a feature
�rst detected by Kasahara and Laplam (2008) providing such evidence in the case of Chilean
exporting and importing �rms. If the nature of these sunk costs varies between the importing
and the exporting activity, to the extent that imports and exports are correlated within �rms,
failing to control for the importing activity might bias the magnitude/interpretation of the
detected productivity premium of exporters. Moreover, di�erent characteristics of the traded
bundle could generate di�erent sunk costs, and thus give raise to heterogeneous trading premia
across �rms.
In this paper we therefore explore in greater details the relationship between the productivity
premium of �rms, their di�erent trading activities and the sunk costs they might face. In
particular the paper capitalizes on a dataset matching, for the case of Hungary, information on
international transactions of �rms at the product level with �rm-level balance sheet data over
a long time period, from 1992 to 2003. The case of Hungary constitutes an interesting quasi-
natural experiment, since our data cover the decade in which the organization of production
has changed worldwide, together with a good control for initial conditions, given the positive
shock to trade and foreign investment ows which Hungary experienced after the signing of the
free trade agreements with the European Union and the other Central and Eastern European
countries in the early 1990s. Our data thus incorporates information on more than 6,500 cases of
�rms who switched their trade status during the considered period, over a total of some 192,000
�rm-level observations.
Overall, in line with the results of Kasahara and Lapham (2008), we �nd a self-selection
e�ect of the most productive �rms for both importing and exporting �rms. However, we also
�nd that, when taking into account the importing status of exporting �rms, the self-selection of
exporters is still present but it is greatly reduced, with the coe�cient related to the productivity
premium more than halved. In other words, failing to control for the importing activity, as a
large part of the literature has done insofar, leads to an overstated productivity premium of
3Brembo screens prospective suppliers not only in terms of prices, but also takes into account the quality, in-novation and service of the purchased product; the possibility to involve the suppliers in their EnvironmentalManagement System, in order to reduce the environmental impact of all their activities; the presence of aquality system certi�cation released by an accredited Certi�cation body; the technical characteristics of thepurchased product, etc. The details of Brembo purchasing policy, together with the questionnaire, are availableat: http://www.brembo.com/ENG/AboutBrembo/Suppliers/CriteriaBrakes/SuppliersCriteria.htm
3

exporters. As in Bernard and Jensen (1999) for the export case, we �nd that also for importers
productivity is a strong predictor of the probability of becoming a trader, with the coe�cient
higher for imports vs. exports, consistently with the previous result. We also show that there
seems to exist a clear ordering of �rms in terms of productivity driven by the import, not the
export status: �rms who never import are less productive then �rms switching into imports, who
are in turn less productive than �rms having always imported. Instead, the e�ect of exports on
productivity tends to be heterogeneous within each of these importing groups4.
In order to provide a rationale for the latter �nding, we discuss the possible origins of the
sunk costs of trade, and the resulting heterogeneous self-selection of �rms into di�erent trading
activities detected in our results. To this extent, we build various proxies of the complexity
associated to the trading activity (importing or exporting), considering for each �rm the hetero-
geneity in terms of number of traded products and destinations, the distance of each destination
combined with its institutional quality, the extent of relationship-speci�c intensity of the traded
bundle (measured through the Rauch index of product di�erentiation). We �nd all these indexes
to be strongly correlated to the �rm's productivity, but to a di�erent extent between importers
and exporters.
The paper is structured as follows. Section 2 presents data and preliminary evidence on
trading activity. Section 3 discusses some measures of TFP for trading �rms, while Section 4
presents the results of a number of models relating importing and exporting decisions to �rms'
productivity. Section 5 discusses the relationship between trade complexity, trade status and
productivity. Section 6 concludes.
2 Data and preliminary evidence
We use a large and comprehensive panel of Hungarian �rms obtained by merging tax and
customs data for the period 1992-2003. The �rst dataset contains accounting and �nancial data
of Hungarian �rms. The source of data is the Hungarian Tax Authority (APEH). This database
represents more than 90% of Hungarian employment, value added and exports and is almost
complete outside the scope of non-trading micro enterprises. To avoid a number of potential
problems in the calculation of �rms' performance, in this paper we have restricted the analysis
to manufacturing data only, with the Appendix reporting the number of �rms per year and by
NACE2 industry5.
The APEH dataset has then been merged at the �rm-level with a trade dataset, containing
transaction-level data as registered by the customs o�ce. The unit of observation in this trade
dataset is �rm-product-destination. The dataset includes information on both the dollar value
of shipments and their physical quantity. In this paper we de�ne the amount of trade as the
4The heterogeneous e�ect of the export treatment across di�erent groups of �rms goes along the same lines ofthe results obtained by Lileeva and Tre er (2007).5The dataset and features of various types of trading �rms is presented in B�ek�es et al (2008).
4
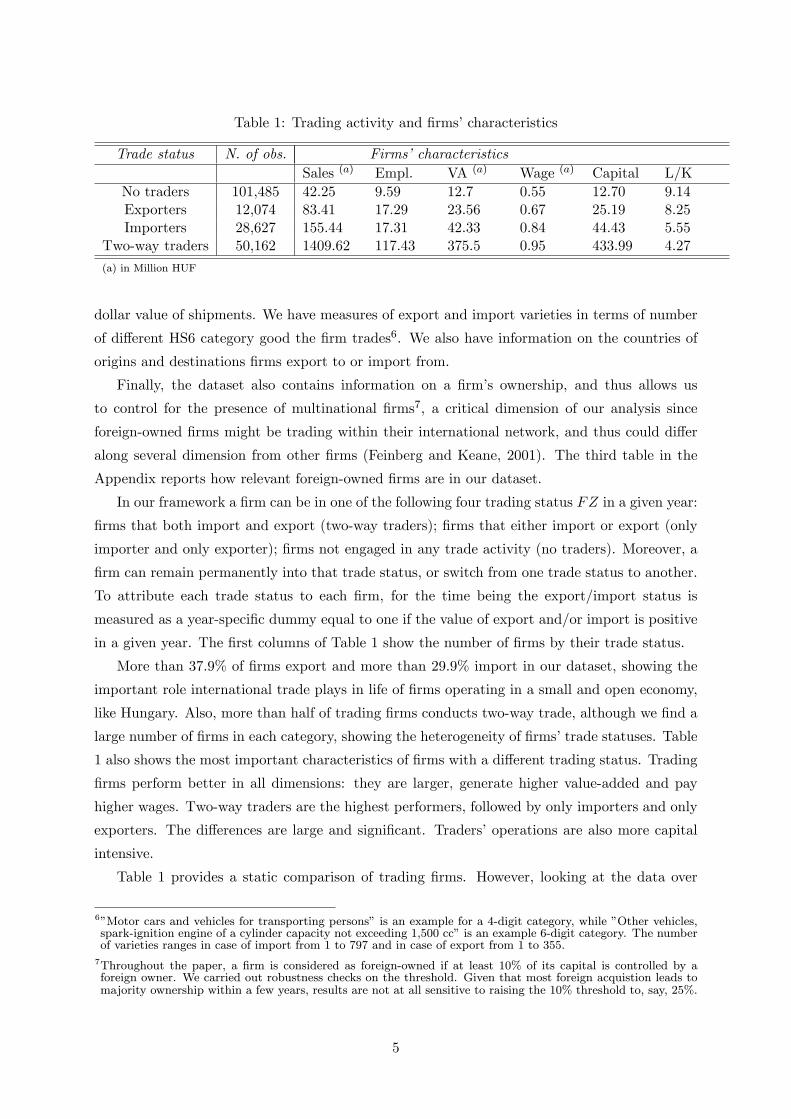
Table 1: Trading activity and �rms' characteristics
Trade status N. of obs. Firms' characteristics
Sales (a) Empl. VA (a) Wage (a) Capital L/K
No traders 101,485 42.25 9.59 12.7 0.55 12.70 9.14Exporters 12,074 83.41 17.29 23.56 0.67 25.19 8.25Importers 28,627 155.44 17.31 42.33 0.84 44.43 5.55
Two-way traders 50,162 1409.62 117.43 375.5 0.95 433.99 4.27
(a) in Million HUF
dollar value of shipments. We have measures of export and import varieties in terms of number
of di�erent HS6 category good the �rm trades6. We also have information on the countries of
origins and destinations �rms export to or import from.
Finally, the dataset also contains information on a �rm's ownership, and thus allows us
to control for the presence of multinational �rms7, a critical dimension of our analysis since
foreign-owned �rms might be trading within their international network, and thus could di�er
along several dimension from other �rms (Feinberg and Keane, 2001). The third table in the
Appendix reports how relevant foreign-owned �rms are in our dataset.
In our framework a �rm can be in one of the following four trading status FZ in a given year:
�rms that both import and export (two-way traders); �rms that either import or export (only
importer and only exporter); �rms not engaged in any trade activity (no traders). Moreover, a
�rm can remain permanently into that trade status, or switch from one trade status to another.
To attribute each trade status to each �rm, for the time being the export/import status is
measured as a year-speci�c dummy equal to one if the value of export and/or import is positive
in a given year. The �rst columns of Table 1 show the number of �rms by their trade status.
More than 37.9% of �rms export and more than 29.9% import in our dataset, showing the
important role international trade plays in life of �rms operating in a small and open economy,
like Hungary. Also, more than half of trading �rms conducts two-way trade, although we �nd a
large number of �rms in each category, showing the heterogeneity of �rms' trade statuses. Table
1 also shows the most important characteristics of �rms with a di�erent trading status. Trading
�rms perform better in all dimensions: they are larger, generate higher value-added and pay
higher wages. Two-way traders are the highest performers, followed by only importers and only
exporters. The di�erences are large and signi�cant. Traders' operations are also more capital
intensive.
Table 1 provides a static comparison of trading �rms. However, looking at the data over
6"Motor cars and vehicles for transporting persons" is an example for a 4-digit category, while "Other vehicles,spark-ignition engine of a cylinder capacity not exceeding 1,500 cc" is an example 6-digit category. The numberof varieties ranges in case of import from 1 to 797 and in case of export from 1 to 355.
7Throughout the paper, a �rm is considered as foreign-owned if at least 10% of its capital is controlled by aforeign owner. We carried out robustness checks on the threshold. Given that most foreign acquistion leads tomajority ownership within a few years, results are not at all sensitive to raising the 10% threshold to, say, 25%.
5

time, we �nd that 32% of our �rms have altered their trade status within four years. In order to
evaluate the persistency of the import and export status and the transition probabilities from
one type of trading activity to the other, we have constructed a transition matrix of the various
trade status FZ in which �rms are engaged. Table 17 in Appendix shows the transition matrix
of �rms observed from 1993 to 1997, the one for �rms observed from 1998 to 2003 being virtually
identical8. Two features characterize our transition matrixes. First of all, we �nd evidence of
the persistency of the two extremes in the trade status. Looking at the relative magnitude of
the �gures for non traders or two-way traders along the diagonal of the matrix, it is in fact true
that �rms who were in one of these two trade statuses at the beginning of the period (1993) are
likely to remain in the same trade status at the end of the period (1997).
Second, similarly to the results of Kasahara and Lapham (2008) for Chile, we �nd that �rms
who originally only import or export have a probability of remaining in the same trade status
comparable to the one of becoming either two-way traders or non traders9. Such persisting
turbulence in the o�-diagonal part of the transition matrix thus signals the fact that some �rms
have a transitory experience of trading, then reverting back to a non trading status, while some
others, once they start trading, tend to move to the full spectrum of the trading activities,
becoming two-way traders (the probability being the same whether they come from an import
or export status). It thus seems that -in a small and open economy- importing or exporting
only tends not to be a steady state equilibrium strategy for the majority of �rms.
The preliminary evidence thus shows that trading �rms seem to di�er in a number of char-
acteristics from non-traders, but also points to a certain heterogeneity both across the di�erent
trade statuses and over time. The next section tries to link these �ndings to �rms' productivity
premia.
3 TFP measurement in trading �rms
The measurement of �rm-level total factor productivity (TFP) for trading �rms is subject to a
number of econometric problems. There are several ways to measure total factor productivity,
and each methods o�er some advantage in treating endogeneity or being more adept to data
availability. In this exercise, we use a modi�ed version of the standard semiparametric TFP
measure of Olley and Pakes (1996, henceforth OP). The main reason for this is that OP treats
attrition explicitly, and for an economy, like Hungary, undergoing fundamental structural change,
exit is rather crucial.
8Additional evidence, available on request, also shows that the presence of switching �rms is balanced acrosssectors. The only relatively signi�cant di�erence in terms of timing is that no-traders are slightly less likely toremain in the same status in the second period of our analysis, with 79% of �rms not engaged in any tradeactivity in 1993 remaining such in 1997, compared to 68% for the period 1998-2003. The latter �ndings areconsistent with the increasing opening up of the Hungarian economy along the transition to the market.
9This is especially the case in the period 1993-1997, and, to a certain extent, also in the period 1998-2003 forexporting �rms. The importing status seem to persist more in the 1998-2003 period.
6
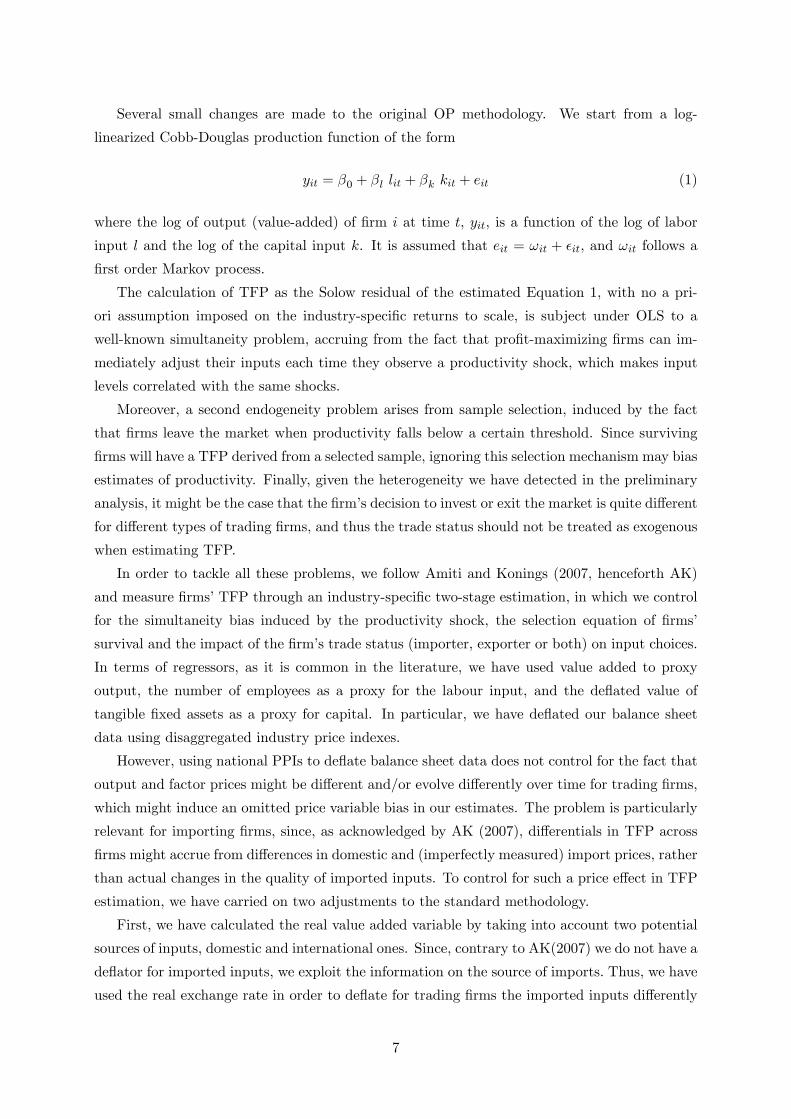
Several small changes are made to the original OP methodology. We start from a log-
linearized Cobb-Douglas production function of the form
yit = �0 + �l lit + �k kit + eit (1)
where the log of output (value-added) of �rm i at time t, yit, is a function of the log of labor
input l and the log of the capital input k. It is assumed that eit = !it + �it, and !it follows a
�rst order Markov process.
The calculation of TFP as the Solow residual of the estimated Equation 1, with no a pri-
ori assumption imposed on the industry-speci�c returns to scale, is subject under OLS to a
well-known simultaneity problem, accruing from the fact that pro�t-maximizing �rms can im-
mediately adjust their inputs each time they observe a productivity shock, which makes input
levels correlated with the same shocks.
Moreover, a second endogeneity problem arises from sample selection, induced by the fact
that �rms leave the market when productivity falls below a certain threshold. Since surviving
�rms will have a TFP derived from a selected sample, ignoring this selection mechanism may bias
estimates of productivity. Finally, given the heterogeneity we have detected in the preliminary
analysis, it might be the case that the �rm's decision to invest or exit the market is quite di�erent
for di�erent types of trading �rms, and thus the trade status should not be treated as exogenous
when estimating TFP.
In order to tackle all these problems, we follow Amiti and Konings (2007, henceforth AK)
and measure �rms' TFP through an industry-speci�c two-stage estimation, in which we control
for the simultaneity bias induced by the productivity shock, the selection equation of �rms'
survival and the impact of the �rm's trade status (importer, exporter or both) on input choices.
In terms of regressors, as it is common in the literature, we have used value added to proxy
output, the number of employees as a proxy for the labour input, and the de ated value of
tangible �xed assets as a proxy for capital. In particular, we have de ated our balance sheet
data using disaggregated industry price indexes.
However, using national PPIs to de ate balance sheet data does not control for the fact that
output and factor prices might be di�erent and/or evolve di�erently over time for trading �rms,
which might induce an omitted price variable bias in our estimates. The problem is particularly
relevant for importing �rms, since, as acknowledged by AK (2007), di�erentials in TFP across
�rms might accrue from di�erences in domestic and (imperfectly measured) import prices, rather
than actual changes in the quality of imported inputs. To control for such a price e�ect in TFP
estimation, we have carried on two adjustments to the standard methodology.
First, we have calculated the real value added variable by taking into account two potential
sources of inputs, domestic and international ones. Since, contrary to AK(2007) we do not have a
de ator for imported inputs, we exploit the information on the source of imports. Thus, we have
used the real exchange rate in order to de ate for trading �rms the imported inputs di�erently
7
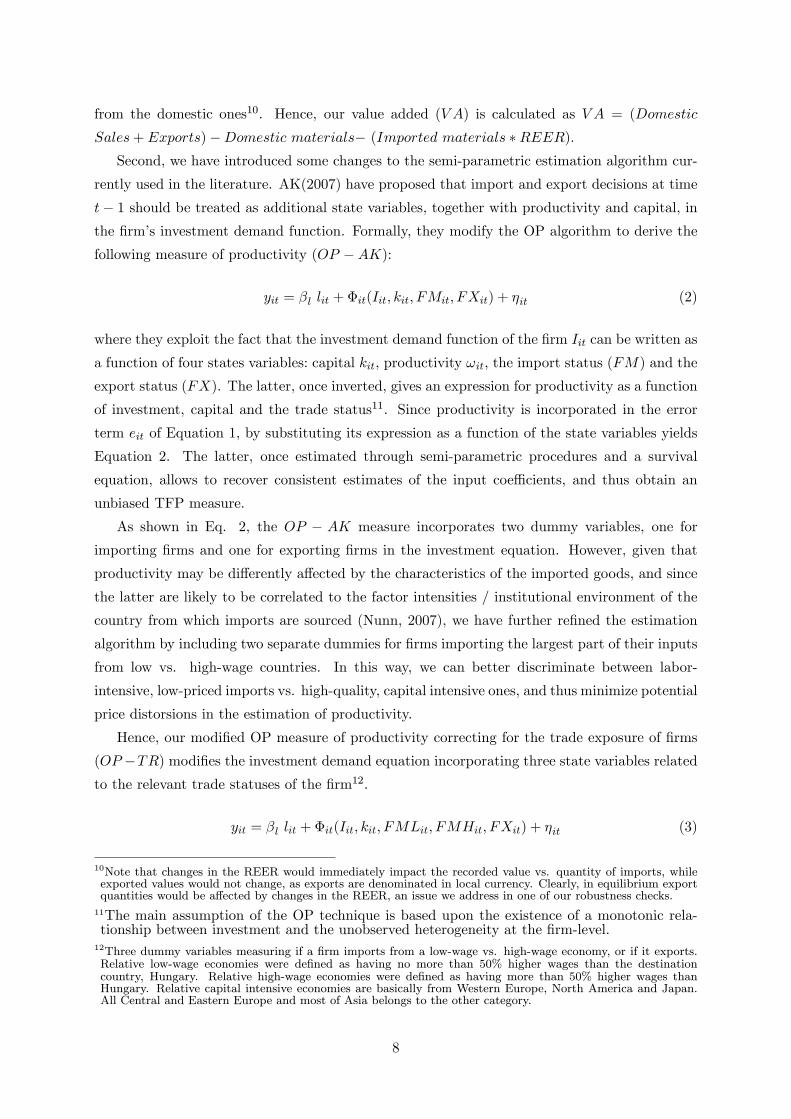
from the domestic ones10. Hence, our value added (V A) is calculated as V A = (Domestic
Sales+ Exports)�Domestic materials� (Imported materials �REER).Second, we have introduced some changes to the semi-parametric estimation algorithm cur-
rently used in the literature. AK(2007) have proposed that import and export decisions at time
t� 1 should be treated as additional state variables, together with productivity and capital, inthe �rm's investment demand function. Formally, they modify the OP algorithm to derive the
following measure of productivity (OP �AK):
yit = �l lit +�it(Iit; kit; FMit; FXit) + �it (2)
where they exploit the fact that the investment demand function of the �rm Iit can be written as
a function of four states variables: capital kit, productivity !it, the import status (FM) and the
export status (FX). The latter, once inverted, gives an expression for productivity as a function
of investment, capital and the trade status11. Since productivity is incorporated in the error
term eit of Equation 1, by substituting its expression as a function of the state variables yields
Equation 2. The latter, once estimated through semi-parametric procedures and a survival
equation, allows to recover consistent estimates of the input coe�cients, and thus obtain an
unbiased TFP measure.
As shown in Eq. 2, the OP � AK measure incorporates two dummy variables, one for
importing �rms and one for exporting �rms in the investment equation. However, given that
productivity may be di�erently a�ected by the characteristics of the imported goods, and since
the latter are likely to be correlated to the factor intensities / institutional environment of the
country from which imports are sourced (Nunn, 2007), we have further re�ned the estimation
algorithm by including two separate dummies for �rms importing the largest part of their inputs
from low vs. high-wage countries. In this way, we can better discriminate between labor-
intensive, low-priced imports vs. high-quality, capital intensive ones, and thus minimize potential
price distorsions in the estimation of productivity.
Hence, our modi�ed OP measure of productivity correcting for the trade exposure of �rms
(OP �TR) modi�es the investment demand equation incorporating three state variables relatedto the relevant trade statuses of the �rm12.
yit = �l lit +�it(Iit; kit; FMLit; FMHit; FXit) + �it (3)
10Note that changes in the REER would immediately impact the recorded value vs. quantity of imports, whileexported values would not change, as exports are denominated in local currency. Clearly, in equilibrium exportquantities would be a�ected by changes in the REER, an issue we address in one of our robustness checks.
11The main assumption of the OP technique is based upon the existence of a monotonic rela-tionship between investment and the unobserved heterogeneity at the �rm-level.
12Three dummy variables measuring if a �rm imports from a low-wage vs. high-wage economy, or if it exports.Relative low-wage economies were de�ned as having no more than 50% higher wages than the destinationcountry, Hungary. Relative high-wage economies were de�ned as having more than 50% higher wages thanHungary. Relative capital intensive economies are basically from Western Europe, North America and Japan.All Central and Eastern Europe and most of Asia belongs to the other category.
8
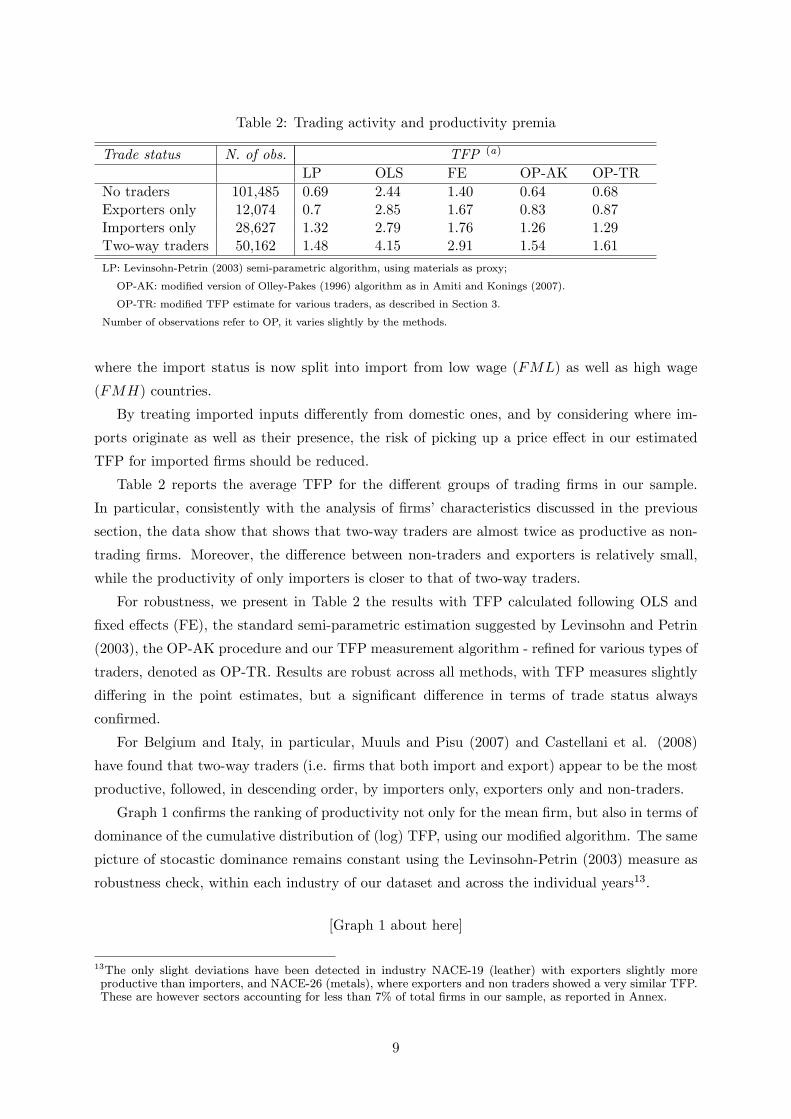
Table 2: Trading activity and productivity premia
Trade status N. of obs. TFP (a)
LP OLS FE OP-AK OP-TR
No traders 101,485 0.69 2.44 1.40 0.64 0.68Exporters only 12,074 0.7 2.85 1.67 0.83 0.87Importers only 28,627 1.32 2.79 1.76 1.26 1.29Two-way traders 50,162 1.48 4.15 2.91 1.54 1.61
LP: Levinsohn-Petrin (2003) semi-parametric algorithm, using materials as proxy;
OP-AK: modi�ed version of Olley-Pakes (1996) algorithm as in Amiti and Konings (2007).
OP-TR: modi�ed TFP estimate for various traders, as described in Section 3.
Number of observations refer to OP, it varies slightly by the methods.
where the import status is now split into import from low wage (FML) as well as high wage
(FMH) countries.
By treating imported inputs di�erently from domestic ones, and by considering where im-
ports originate as well as their presence, the risk of picking up a price e�ect in our estimated
TFP for imported �rms should be reduced.
Table 2 reports the average TFP for the di�erent groups of trading �rms in our sample.
In particular, consistently with the analysis of �rms' characteristics discussed in the previous
section, the data show that shows that two-way traders are almost twice as productive as non-
trading �rms. Moreover, the di�erence between non-traders and exporters is relatively small,
while the productivity of only importers is closer to that of two-way traders.
For robustness, we present in Table 2 the results with TFP calculated following OLS and
�xed e�ects (FE), the standard semi-parametric estimation suggested by Levinsohn and Petrin
(2003), the OP-AK procedure and our TFP measurement algorithm - re�ned for various types of
traders, denoted as OP-TR. Results are robust across all methods, with TFP measures slightly
di�ering in the point estimates, but a signi�cant di�erence in terms of trade status always
con�rmed.
For Belgium and Italy, in particular, Muuls and Pisu (2007) and Castellani et al. (2008)
have found that two-way traders (i.e. �rms that both import and export) appear to be the most
productive, followed, in descending order, by importers only, exporters only and non-traders.
Graph 1 con�rms the ranking of productivity not only for the mean �rm, but also in terms of
dominance of the cumulative distribution of (log) TFP, using our modi�ed algorithm. The same
picture of stocastic dominance remains constant using the Levinsohn-Petrin (2003) measure as
robustness check, within each industry of our dataset and across the individual years13.
[Graph 1 about here]
13The only slight deviations have been detected in industry NACE-19 (leather) with exporters slightly moreproductive than importers, and NACE-26 (metals), where exporters and non traders showed a very similar TFP.These are however sectors accounting for less than 7% of total �rms in our sample, as reported in Annex.
9
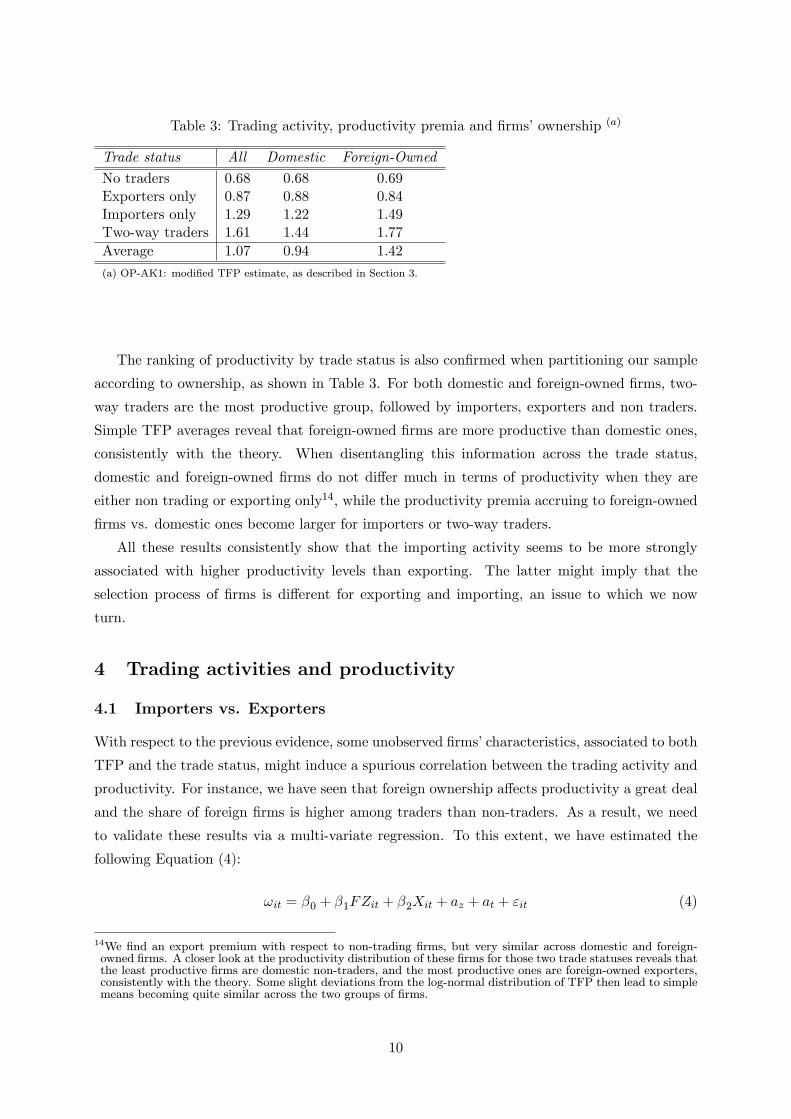
Table 3: Trading activity, productivity premia and �rms' ownership (a)
Trade status All Domestic Foreign-Owned
No traders 0.68 0.68 0.69Exporters only 0.87 0.88 0.84Importers only 1.29 1.22 1.49Two-way traders 1.61 1.44 1.77
Average 1.07 0.94 1.42
(a) OP-AK1: modi�ed TFP estimate, as described in Section 3.
The ranking of productivity by trade status is also con�rmed when partitioning our sample
according to ownership, as shown in Table 3. For both domestic and foreign-owned �rms, two-
way traders are the most productive group, followed by importers, exporters and non traders.
Simple TFP averages reveal that foreign-owned �rms are more productive than domestic ones,
consistently with the theory. When disentangling this information across the trade status,
domestic and foreign-owned �rms do not di�er much in terms of productivity when they are
either non trading or exporting only14, while the productivity premia accruing to foreign-owned
�rms vs. domestic ones become larger for importers or two-way traders.
All these results consistently show that the importing activity seems to be more strongly
associated with higher productivity levels than exporting. The latter might imply that the
selection process of �rms is di�erent for exporting and importing, an issue to which we now
turn.
4 Trading activities and productivity
4.1 Importers vs. Exporters
With respect to the previous evidence, some unobserved �rms' characteristics, associated to both
TFP and the trade status, might induce a spurious correlation between the trading activity and
productivity. For instance, we have seen that foreign ownership a�ects productivity a great deal
and the share of foreign �rms is higher among traders than non-traders. As a result, we need
to validate these results via a multi-variate regression. To this extent, we have estimated the
following Equation (4):
!it = �0 + �1FZit + �2Xit + az + at + "it (4)
14We �nd an export premium with respect to non-trading �rms, but very similar across domestic and foreign-owned �rms. A closer look at the productivity distribution of these �rms for those two trade statuses reveals thatthe least productive �rms are domestic non-traders, and the most productive ones are foreign-owned exporters,consistently with the theory. Some slight deviations from the log-normal distribution of TFP then lead to simplemeans becoming quite similar across the two groups of �rms.
10
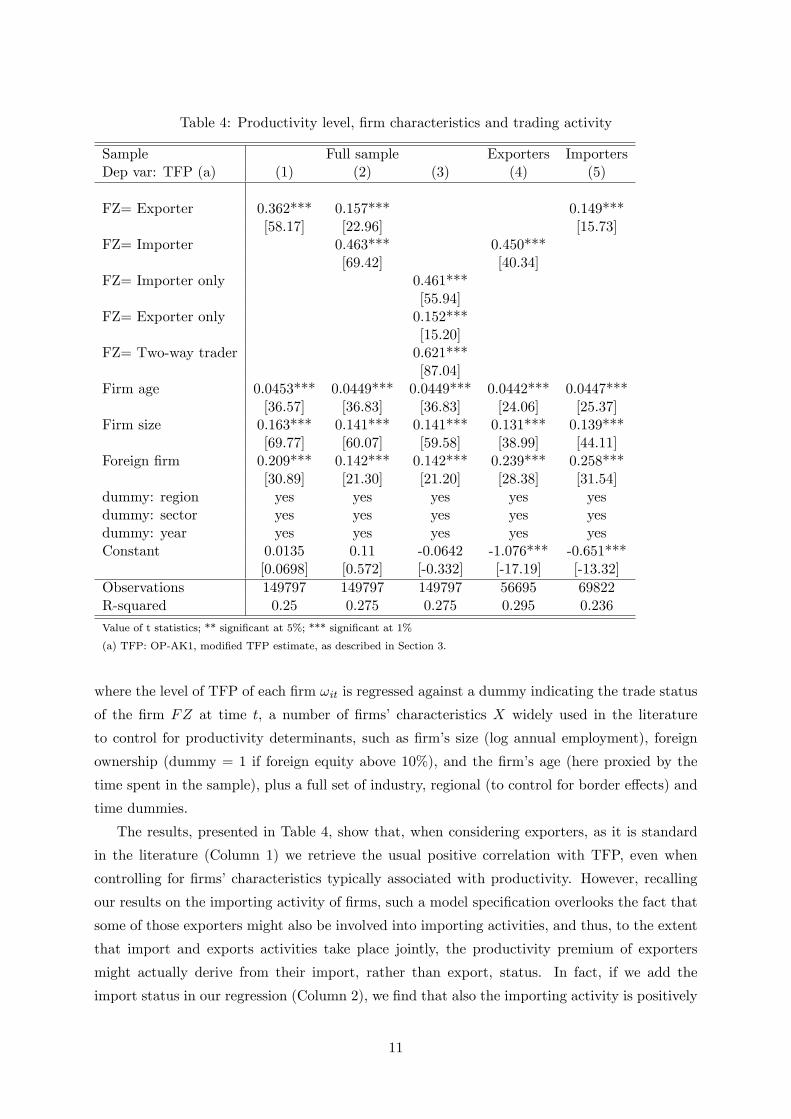
Table 4: Productivity level, �rm characteristics and trading activity
Sample Full sample Exporters ImportersDep var: TFP (a) (1) (2) (3) (4) (5)
FZ= Exporter 0.362*** 0.157*** 0.149***[58.17] [22.96] [15.73]
FZ= Importer 0.463*** 0.450***[69.42] [40.34]
FZ= Importer only 0.461***[55.94]
FZ= Exporter only 0.152***[15.20]
FZ= Two-way trader 0.621***[87.04]
Firm age 0.0453*** 0.0449*** 0.0449*** 0.0442*** 0.0447***[36.57] [36.83] [36.83] [24.06] [25.37]
Firm size 0.163*** 0.141*** 0.141*** 0.131*** 0.139***[69.77] [60.07] [59.58] [38.99] [44.11]
Foreign �rm 0.209*** 0.142*** 0.142*** 0.239*** 0.258***[30.89] [21.30] [21.20] [28.38] [31.54]
dummy: region yes yes yes yes yesdummy: sector yes yes yes yes yesdummy: year yes yes yes yes yesConstant 0.0135 0.11 -0.0642 -1.076*** -0.651***
[0.0698] [0.572] [-0.332] [-17.19] [-13.32]
Observations 149797 149797 149797 56695 69822R-squared 0.25 0.275 0.275 0.295 0.236
Value of t statistics; ** signi�cant at 5%; *** signi�cant at 1%
(a) TFP: OP-AK1, modi�ed TFP estimate, as described in Section 3.
where the level of TFP of each �rm !it is regressed against a dummy indicating the trade status
of the �rm FZ at time t, a number of �rms' characteristics X widely used in the literature
to control for productivity determinants, such as �rm's size (log annual employment), foreign
ownership (dummy = 1 if foreign equity above 10%), and the �rm's age (here proxied by the
time spent in the sample), plus a full set of industry, regional (to control for border e�ects) and
time dummies.
The results, presented in Table 4, show that, when considering exporters, as it is standard
in the literature (Column 1) we retrieve the usual positive correlation with TFP, even when
controlling for �rms' characteristics typically associated with productivity. However, recalling
our results on the importing activity of �rms, such a model speci�cation overlooks the fact that
some of those exporters might also be involved into importing activities, and thus, to the extent
that import and exports activities take place jointly, the productivity premium of exporters
might actually derive from their import, rather than export, status. In fact, if we add the
import status in our regression (Column 2), we �nd that also the importing activity is positively
11

and signi�cantly correlated with productivity and, most importantly, that the inclusion of the
import dummy lowers the magnitude of the productivity premium for exporters by more than
50%.
A possible explanation of this �nding is that the import and export dummies might be
correlated, to the extent that some 70% of our �rms are two-way traders. The latter correlation
would then be driving both results. To clarify things, in Column 3 we have thus partitioned our
sample in mutually exclusive categories (only importers, only exporters, two-way traders), always
controlling for �rms' characteristics, and thus keeping non traders as the control group. As it
can be seen, every trade activity is positively and signi�cantly associated to productivity, with
our ranking of productivity premia by trade status con�rmed. In particular, two-way traders
are on average 62% more productive than non-traders, followed by only-importers (46%), while
being only an exporter adds 15% to TFP with respect to non-trading �rms.
As a further check, in Columns (4) and (5) we have changed our control group, by running
the import and export dummies on the restricted sample of exporting �rms and importing
�rms, respectively (thus excluding non traders): again, we �nd that the premium in terms of
TFP accruing to two-way traders is larger when it comes from exporters adding the importing
activity, rather than importers which add export and become two-way traders, always controlling
for �rms' characteristics.
These preliminary results may depend on the de�nition of a trading �rm, which insofar
follows the standard in the literature: a year-speci�c dummy equal to one if the value of export
and/or import is positive in a given year. However, �rms might be heterogeneous in terms of the
timing of the trade exposure, with some �rms trading more regularly over time then others. As
a �rst robustness check, we have therefore checked our result against a more restrictive de�nition
of trading �rms, considering as exporters (importers) those �rms who have exported (imported)
at time t at least 0.5% of their sales for more than 50% of the time between t and exit/end
of sample15. Second, to the extent that some importing �rms might be substituting imported
intermediates with labor or capital, it could be that the former induce a correlation across inputs,
biasing our measure of TFP. Thus we have estimated our TFP using only domestic materials in
our calculations for value added. To control for potential impact of the real exchange rate on
exports, we have also calculated VA using Sales = Domestic Sales+Export�REER deflator.Finally, we have also experimented excluding micro �rms from our sample (�rms with less than
5 employees).
Table 5 reports the coe�cients obtained for our trade status dummies in regressions where
we have implemented our robustness checks always controlling for the same �rms' characteristics
and industry, regional and time dummies as in Equation (4)16. The �rst column reports our
baseline result (Table 4 - Column 3): as it can be seen, our ranking in terms of productivity
15This is the de�nition employed by Mayer and Ottaviano (2007) in their comparative study of the trade perfor-mances of European �rms.
12
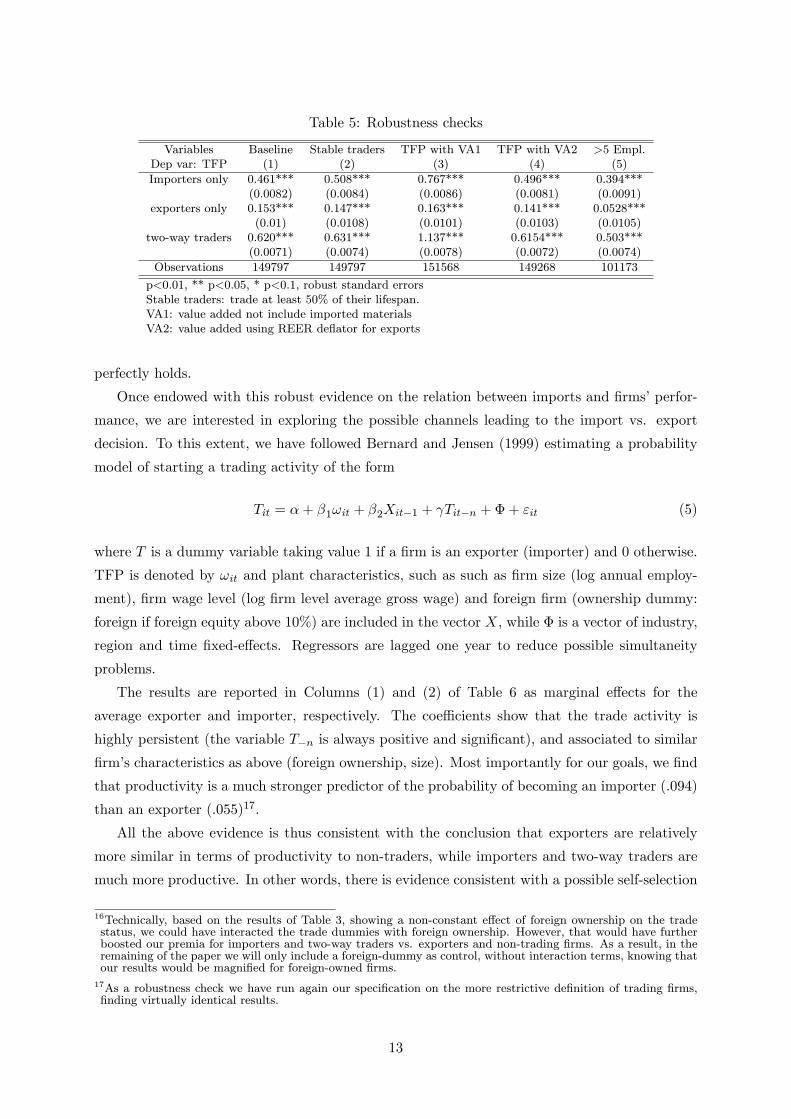
Table 5: Robustness checks
Variables Baseline Stable traders TFP with VA1 TFP with VA2 >5 Empl.Dep var: TFP (1) (2) (3) (4) (5)
Importers only 0.461*** 0.508*** 0.767*** 0.496*** 0.394***(0.0082) (0.0084) (0.0086) (0.0081) (0.0091)
exporters only 0.153*** 0.147*** 0.163*** 0.141*** 0.0528***(0.01) (0.0108) (0.0101) (0.0103) (0.0105)
two-way traders 0.620*** 0.631*** 1.137*** 0.6154*** 0.503***(0.0071) (0.0074) (0.0078) (0.0072) (0.0074)
Observations 149797 149797 151568 149268 101173
p<0.01, ** p<0.05, * p<0.1, robust standard errorsStable traders: trade at least 50% of their lifespan.VA1: value added not include imported materialsVA2: value added using REER de ator for exports
perfectly holds.
Once endowed with this robust evidence on the relation between imports and �rms' perfor-
mance, we are interested in exploring the possible channels leading to the import vs. export
decision. To this extent, we have followed Bernard and Jensen (1999) estimating a probability
model of starting a trading activity of the form
Tit = �+ �1!it + �2Xit�1 + Tit�n +�+ "it (5)
where T is a dummy variable taking value 1 if a �rm is an exporter (importer) and 0 otherwise.
TFP is denoted by !it and plant characteristics, such as such as �rm size (log annual employ-
ment), �rm wage level (log �rm level average gross wage) and foreign �rm (ownership dummy:
foreign if foreign equity above 10%) are included in the vector X, while � is a vector of industry,
region and time �xed-e�ects. Regressors are lagged one year to reduce possible simultaneity
problems.
The results are reported in Columns (1) and (2) of Table 6 as marginal e�ects for the
average exporter and importer, respectively. The coe�cients show that the trade activity is
highly persistent (the variable T�n is always positive and signi�cant), and associated to similar
�rm's characteristics as above (foreign ownership, size). Most importantly for our goals, we �nd
that productivity is a much stronger predictor of the probability of becoming an importer (.094)
than an exporter (.055)17.
All the above evidence is thus consistent with the conclusion that exporters are relatively
more similar in terms of productivity to non-traders, while importers and two-way traders are
much more productive. In other words, there is evidence consistent with a possible self-selection
16Technically, based on the results of Table 3, showing a non-constant e�ect of foreign ownership on the tradestatus, we could have interacted the trade dummies with foreign ownership. However, that would have furtherboosted our premia for importers and two-way traders vs. exporters and non-trading �rms. As a result, in theremaining of the paper we will only include a foreign-dummy as control, without interaction terms, knowing thatour results would be magni�ed for foreign-owned �rms.
17As a robustness check we have run again our speci�cation on the more restrictive de�nition of trading �rms,�nding virtually identical results.
13
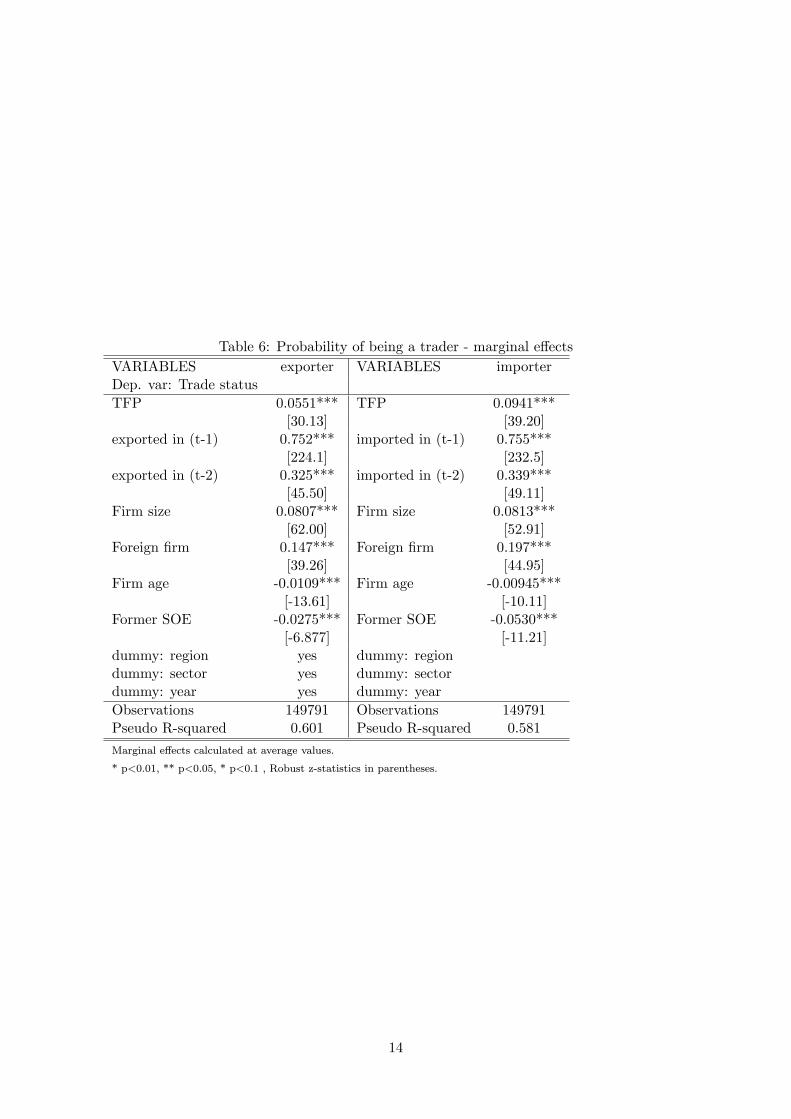
Table 6: Probability of being a trader - marginal e�ects
VARIABLES exporter VARIABLES importerDep. var: Trade status
TFP 0.0551*** TFP 0.0941***[30.13] [39.20]
exported in (t-1) 0.752*** imported in (t-1) 0.755***[224.1] [232.5]
exported in (t-2) 0.325*** imported in (t-2) 0.339***[45.50] [49.11]
Firm size 0.0807*** Firm size 0.0813***[62.00] [52.91]
Foreign �rm 0.147*** Foreign �rm 0.197***[39.26] [44.95]
Firm age -0.0109*** Firm age -0.00945***[-13.61] [-10.11]
Former SOE -0.0275*** Former SOE -0.0530***[-6.877] [-11.21]
dummy: region yes dummy: regiondummy: sector yes dummy: sectordummy: year yes dummy: year
Observations 149791 Observations 149791Pseudo R-squared 0.601 Pseudo R-squared 0.581
Marginal e�ects calculated at average values.
* p<0.01, ** p<0.05, * p<0.1 , Robust z-statistics in parentheses.
14

e�ect of importers and the associated productivity premium, an e�ect larger than the one
entailed by exports. Failing to control for the importing activity within the exporting �rms
might thus lead to an overstated productivity premia of exporters, a �nding insofar largely
neglected by the literature.
4.2 Switching �rms
Data reported in Section 2 showed that about one-third of �rms have altered their trade status
within four years, with many �rms switch from being a non-trader to importing or exporting
activity. A small but not negligible group of �rms switches from no trade to two-way trade in
the same year. Focusing on switching �rms allows to inspect how adding a trade activity alters
the performance of the �rm with respect to its pre-switch productivity, thus deriving insights
on the potential self-selection of �rms into the same trade activity.
In order to prevent the already discussed phenomenon of `occasional' traders to bias upwards
our count of �rms changing trade status, we de�ne as `switcher' a �rm which in a given year
starts to either import or export (or both) at least 0.5% of its output, and then does not revert
back to the previous status in the remaining of the time in which it is present in the data. Thus,
consistently with a self-selection hypothesis induced by �xed costs, we only consider `permanent'
switchers.
Table 7 summarizes the characteristics of switching �rms in terms of TFP, the latter being
always calculated following the AK1 modi�ed semi-parametric algorithm. In particular, Table
7 reports, for every type of switch and for non-switching �rms, the average level of TFP in the
year t in which the switch has taken place and the TFP at time t� 1.
Table 7: Switching into di�erent trading activities and productivity (a)
Num. Firms TFP (t) TFP (t-1)
New import (t) Total 3964 1.14 0.84o/w. no trade in (t-1) 3505 1.12 0.82o/w. exported in (t-1) 459 1.27 0.95
New export (t) Total 3662 1.19 0.92o/w. no trade in (t-1) 2448 1.01 0.70o/w. imported in (t-1) 1214 1.56 1.30
New two-way (t) no trade in (t-1) 1135 1.14 0.67
Never switchers Total 26320 1.01o/w. Nontraders 18236 0.71o/w. Importer only 2764 1.40o/w. Exporter only 1022 0.87o/w. Two-way trader 4298 1.63
(a) TFP: OP-AK1, modi�ed TFP estimate, as described in Section 3.
15

As it can be seen, the average ex-ante productivity of non-trading �rms who switch into
import is signi�cantly higher than the ex-ante TFP of non-trading �rms switching into export
(.82 vs. .70). However, if we just consider a generic `export-premium' in terms of productivity, as
much of the literature has been doing, we would (incorrectly) claim that switchers into exports
are ex-ante much more productive than non trading �rms (.92 vs. .71), but this is essentially
driven by the fact that, among the switchers into exports, there are very productive importing
�rms (ex-ante TFP of 1.30). Failing to account for the presence of importers thus largely
overstates the relevance of export switching in terms of productivity performance, consistently
with previous results.
We have also checked whether the stronger self-selection e�ect detected for importers might
be driven by some unobserved time-varying characteristic according to which �rms switching into
importing are located on ex-ante TFP growth trajectories higher than other �rms, as suggested
by Arnold-Javorcik (2005) when analysing the productivity gains of foreign-acquired �rms. In
particular, we control for the growth rates between t-2 and t+2 of the time t at which the switch
in status takes place. Controlling also for the TFP gains at t+2 allows us to verify whether
signi�cant di�erences exist between importers and exporters not only in the pre- but also in the
post-switch performance.
We have therefore calculated a TFP growth rate as D = [ln(TFP )t+2 + ln(TFP )t+1] �[ln(TFP )t�2 + ln(TFP )t�1], i.e. the average change in productivity obtained in the two years
after the switch with respect to the performance of the two years before the switch. To control for
possible common industry and time-speci�c shocks which, in a given industry/year might a�ect
productivity for all �rms (thus including the switchers), we have also constructed a variable D�
where the �rm-speci�c TFP of the switcher has been normalized for the industry mean in the
corresponding year used in the calculation. We have found a positive correlation between the
switch into a new trade activity and productivity growth at the �rm level for both importers
and exporters: both our variables D and D� are always positive and very similar, thus excluding
a potential special behaviour in TFP growth of our importing �rms18.
To investigate self-selection, we look at how switch in time t a�ects TFP (t� 1). A positivecoe�cient would suggest that switching �rms are ex-ante more productive. We run:
!it�1 = �0 + �1�FZit + �2Xit + aj + at + "it (6)
where we have regressed the level of TFP of each �rm !i at time t � 1 against the switch inthe trade status of the �rm, measured through a dummy variable �FZ taking value 1 if a �rm
permanently switched to a new status (export or import) at time t and 0 otherwise. In the
regression we control for a number of �rms' characteristics X (such as �rm size (log annual
18We also �nd that the ex-ante productivity of �rms switching into two-way trading (.68) is some 15% below theone of switchers into import or export status alone. However, around 50% of �rms switching to two-way tradeare part of multinational groups (i.e. they are likely to face lower barriers to internationalisation), while MNEa�liates represent only some 20% of switchers in the import or export-only case.
16
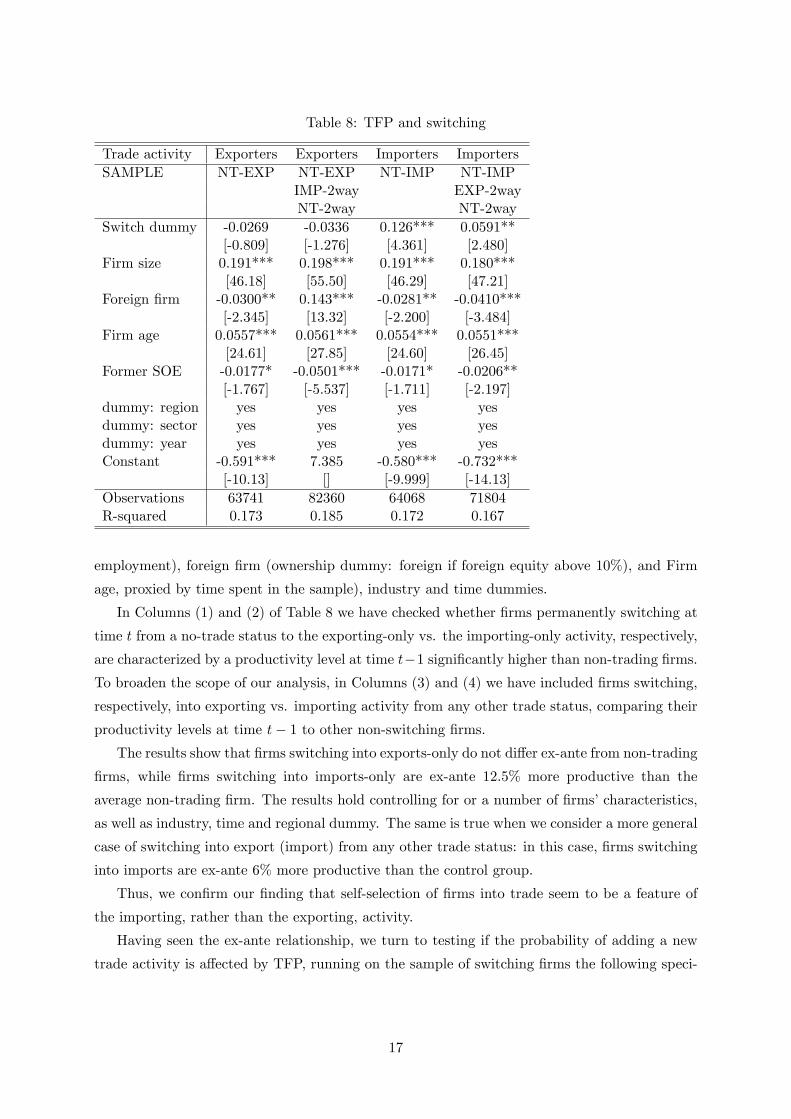
Table 8: TFP and switching
Trade activity Exporters Exporters Importers Importers
SAMPLE NT-EXP NT-EXP NT-IMP NT-IMPIMP-2way EXP-2wayNT-2way NT-2way
Switch dummy -0.0269 -0.0336 0.126*** 0.0591**[-0.809] [-1.276] [4.361] [2.480]
Firm size 0.191*** 0.198*** 0.191*** 0.180***[46.18] [55.50] [46.29] [47.21]
Foreign �rm -0.0300** 0.143*** -0.0281** -0.0410***[-2.345] [13.32] [-2.200] [-3.484]
Firm age 0.0557*** 0.0561*** 0.0554*** 0.0551***[24.61] [27.85] [24.60] [26.45]
Former SOE -0.0177* -0.0501*** -0.0171* -0.0206**[-1.767] [-5.537] [-1.711] [-2.197]
dummy: region yes yes yes yesdummy: sector yes yes yes yesdummy: year yes yes yes yesConstant -0.591*** 7.385 -0.580*** -0.732***
[-10.13] [] [-9.999] [-14.13]
Observations 63741 82360 64068 71804R-squared 0.173 0.185 0.172 0.167
employment), foreign �rm (ownership dummy: foreign if foreign equity above 10%), and Firm
age, proxied by time spent in the sample), industry and time dummies.
In Columns (1) and (2) of Table 8 we have checked whether �rms permanently switching at
time t from a no-trade status to the exporting-only vs. the importing-only activity, respectively,
are characterized by a productivity level at time t�1 signi�cantly higher than non-trading �rms.To broaden the scope of our analysis, in Columns (3) and (4) we have included �rms switching,
respectively, into exporting vs. importing activity from any other trade status, comparing their
productivity levels at time t� 1 to other non-switching �rms.The results show that �rms switching into exports-only do not di�er ex-ante from non-trading
�rms, while �rms switching into imports-only are ex-ante 12.5% more productive than the
average non-trading �rm. The results hold controlling for or a number of �rms' characteristics,
as well as industry, time and regional dummy. The same is true when we consider a more general
case of switching into export (import) from any other trade status: in this case, �rms switching
into imports are ex-ante 6% more productive than the control group.
Thus, we con�rm our �nding that self-selection of �rms into trade seem to be a feature of
the importing, rather than the exporting, activity.
Having seen the ex-ante relationship, we turn to testing if the probability of adding a new
trade activity is a�ected by TFP, running on the sample of switching �rms the following speci-
17

Table 9: Probability of adding a new trade function-marginal e�ects
NT to Export 0 to Import Imp to 2-WT Exp to 2-WTStarting to trade Second Trade Activity
TFP 0.00140*** 0.00616*** 0.00588*** 0.0267***[3.976] [11.84] [4.197] [8.253]
Firm size 0.00221*** 0.00182*** 0.0157*** 0.0190***[7.161] [4.453] [14.13] [9.365]
Foreign �rm 0.00322*** 0.00791*** 0.0296*** 0.0134**[3.079] [5.815] [8.804] [2.090]
Firm age -0.00163*** -0.00392*** -0.00832*** -0.0109***[-11.17] [-19.76] [-12.82] [-9.281]
Former SOE -0.00250** -0.00732*** -0.0204*** -0.0431***[-2.479] [-5.434] [-5.224] [-6.872]
dummy: region yes yes yes yesdummy: sector yes yes yes yesdummy: year yes yes yes yesConstant -1.597*** -1.882*** -1.009*** -1.581***
[-8.586] [-11.04] [-4.952] [-3.767]
Observations 76430 76955 21018 8519Pseudo R-squared 0.0779 0.0908 0.0969 0.108
Marginal e�ects calculated at average values.
* p<0.01, ** p<0.05, * p<0.1 , Robust z-statistics in parentheses.
NT: no traders; 2-WT: two-way traders
�cation:
Tit = �+ �1!it�1 + �2Xit�1 +�+ "it (7)
where T is a dummy variable taking value 1 if a �rm does take up a new trading mode and
0 otherwise. TFP at t � 1 is denoted by !it�1 and plant characteristics, such as �rm size
(log annual employment), �rm wage level (log �rm level average gross wage) and foreign �rm
(ownership dummy) are included in the vector Xit�1, while � is a vector of industry, region
and time �xed-e�ects. Regressors are lagged one year to reduce possible simultaneity problems.
Results are presented in Table 9. We consider two comparisons: non-trading �rms starting to
export (Column 1) vs. non trading �rms starting to import (Column 2); �rms that did import
starting to export (Column 3) vs. �rms that did export starting to import (Column 4).
Consistently with the previous results pointing at positive but heterogeneous �xed costs of
trade, possibly higher for importers, we �nd that, for both comparison, productivity is a much
stronger predictor of the probability of becoming an importer than an exporter (.006 vs. .001
and 0.027 vs. .006, respectively).
The relevance of the importing status in self-selecting �rms is also evident by looking at
Graph 2, where we show the average TFP premium of �rms categorized by trade status with
respect to the average TFP of the entire sample. As it can be seen, a change in the import
18
status clearly partitions the sample of �rms in three sub-groups, ranked in terms of TFP from no
importer (whose productivity is 21% below the average �rm in the sample) to new importer (14%
more productive) to permanent importer (42%). No such clear-cut selection can be obtained
looking at the export status only: as it can be seen, �rms who start exporting can be either
above or below the average TFP, depending on their import status19.
[Graph 2 about here]
All the evidence collected insofar is thus consistent with the idea that the actual self-selection
of Hungarian �rms in international markets takes place via the importing, rather than the
exporting, activity; we have also showed that such a self-selection e�ect seems to derive from
features linked to the importing rather than exporting activity. In the next section we argue
that the latter is due to the inherently higher complexity of the importing vs. the exporting
activity.
5 Complexity of trade
We have seen that the trade status partitions �rms in terms of ex ante productivity, an e�ect
likely driven by the existence of important sunk costs of trade for both the importing and
exporting activities. The latter �nding is consistent with the results of Kasahara and Lapham
(2008), who have provided such evidence in the case of Chile for both exporting and importing
�rms. We have also found that these sunk costs, to the extent that they drive self-selection,
seem to be more important in the case of importing and two-way trading �rms. We can thus
postulate that SCT are actually heterogeneous not only across �rms (as already detected by
Das, Roberts and Tybout, 2007 in the case of exporting activities), but most importantly across
trade statuses, and explore the possible sources of this heterogeneity.
Our working hypothesis is that, in a world characterized by complex production processes
of di�erentiated goods organized across borders, both importers and exporters face important
sunk costs of trade related to the organizational complexity of the trading activity. Moreover,
to the extent that each imported product would need to be tailored to the speci�c needs of the
�rm in a context of informational asymmetry, and because in general a larger variety of inputs
(among which those imported) would need to be used to produce one (possibly exportable)
output, it could be possible that the strategic choice of importing might require a more complex
(or contractual-intensive) organization of production than the choice of exporting only, thus
19We �nd changes in the export status to be correlated with the productivity of the considered �rm in line withprevious empirical evidence (e�ects grow larger from no exporter, to new exporter to permanent exporter);however, the e�ects in terms of productivity are of a second-order magnitude with respect to the partitioninggenerated by the import status. These results are con�rmed. These results are con�rmed by a multivariateregression, available on request, controlling for a number of �rms' characteristics, as well as industry, time andregional dummy and the average growth rate of TFP in the given industry/year.
19
inducing the seemingly stronger self-selection e�ect of importers detected in our results20.
Under the latter hypothesis, our previous �ndings would therefore imply that ex-ante more
productive �rms are active into more complex trade activities, and that this e�ect is stronger
for importing �rms. To test this, we employ a number of proxies for complexity, measurable for
both importers and exporters. The number of HS2 categories (HS2) of goods traded by each
�rm is used as proxy for technological complexity, the idea being that dealing with products
pertaining to di�erent HS2 industry entails the use of di�erent technologies and thus potentially
lower economies of scale/scope in the transfer of technology21. The Rauch index of product
di�erentiation (Rauch), constructed as a weighted average of each bundle of products traded
by the �rm, is used as a proxy for organizational complexity, the idea being that the more
di�erentiated the traded goods are, the more relationship-speci�c (thus involving higher sunk
costs) the trade transactions are likely to be (Nunn, 2007).
Finally, we construct a composite index of complexity (C I) encompassing the number of
countries the �rm trades with (a proxy for the transaction costs), weighted by their geographical
distance (a proxy for transport costs) and the quality of their institutions (a proxy of organiza-
tional costs), as a broader measure of trade complexity. In particular, the index is constructed
for each year t as follows:
C I =Xi
reldisti � relRoLi
where reldist is the relative distance (in logs) between country i and the closer country to
Hungary22, while relRoL is the yearly value of the World Bank indicator of institutional quality
(Rule of Law) for country i, rescaled on an index ranging from 1 (best institutional system) to 2
(worse)23. As a result, if a �rm trades only with the closest country to Hungary, which has also
the highest level of institutional quality, the C index of that �rm would be 1, which constitutes
the lower bound of this continuum index of complexity.
Table 10 reports some descriptive statistics on the average value of these measures of com-
plexity for our di�erent types of trading �rms. As it can be seen, importers tend to have a
larger complexity of their trade activities with respect to exporters as measured by our proxies,
in line with our claim; the picture gets instead less straightforward when two-way traders are
20Such an hypothesis is in line with the �ndings of Jorgensen and Schroder (2008) who, capitalizing on recentresults of the international organization literature, show in a theoretical model how marginal cost heterogeneity�a la Melitz (2003) would tend to re ect sectors dominated by traditional integrated �rms, while heterogeneous�xed cost models, possibly driving the self-selection of importers detected in this paper, would relate to situationsprevailing in industries featuring the existence of production networks.
21We have also experimented with the number of HS6 products, obtaining very similar results. However, a broaderrange of products traded by the �rm within the same industry might not proxy necessarily complexity, but rathera love for variety e�ect.
22The distance is constructed for each �rm as the sum of the volumes of the traded goods weighted by the relativedistance (in logs) between country i and the closer country to Hungary.
23The original Rule of Law indicator ranges from -2.5 to 2.5. Note that, since the closest country to Hungaryis at 114Km, while the furthest at some 18.000Km, taking the ratios of log distances implies that the distancevariable ranges from 1 to 2:06. Thus, rescaling the Rule of Law indicator implies that trading with the furthestcountry is roughly as complex as trading with the country with the worse institutional quality.
20
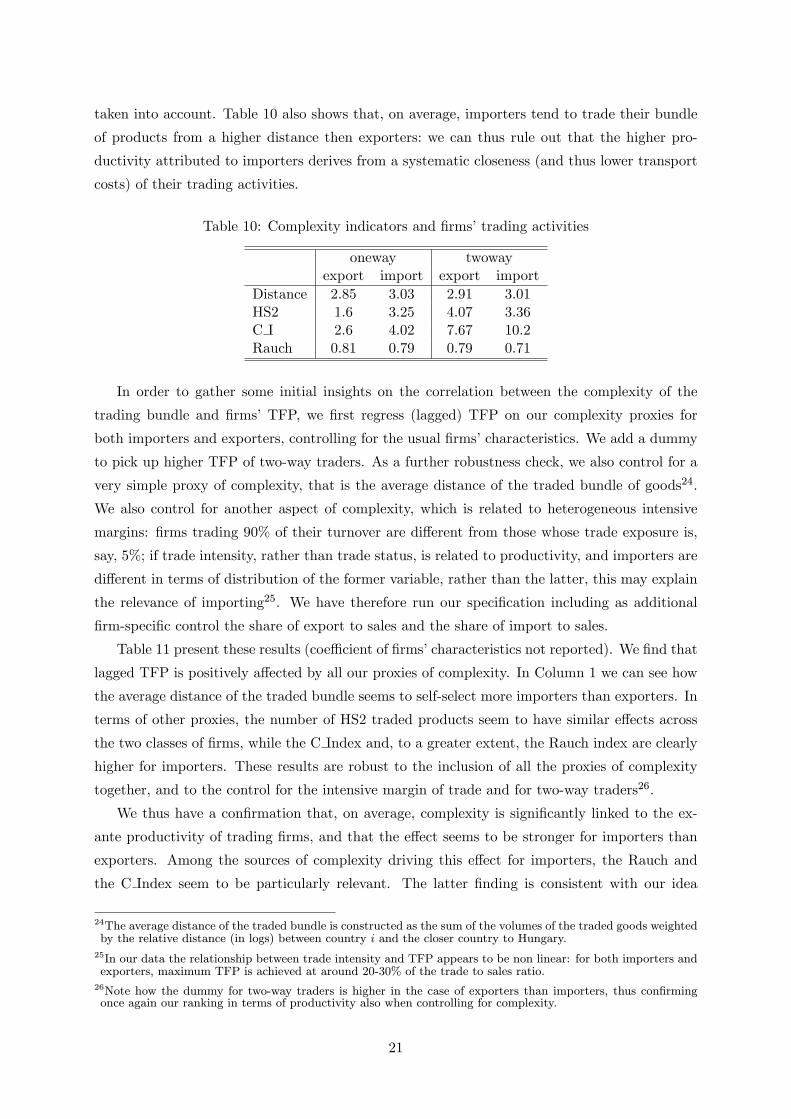
taken into account. Table 10 also shows that, on average, importers tend to trade their bundle
of products from a higher distance then exporters: we can thus rule out that the higher pro-
ductivity attributed to importers derives from a systematic closeness (and thus lower transport
costs) of their trading activities.
Table 10: Complexity indicators and �rms' trading activities
oneway twowayexport import export import
Distance 2.85 3.03 2.91 3.01HS2 1.6 3.25 4.07 3.36C I 2.6 4.02 7.67 10.2Rauch 0.81 0.79 0.79 0.71
In order to gather some initial insights on the correlation between the complexity of the
trading bundle and �rms' TFP, we �rst regress (lagged) TFP on our complexity proxies for
both importers and exporters, controlling for the usual �rms' characteristics. We add a dummy
to pick up higher TFP of two-way traders. As a further robustness check, we also control for a
very simple proxy of complexity, that is the average distance of the traded bundle of goods24.
We also control for another aspect of complexity, which is related to heterogeneous intensive
margins: �rms trading 90% of their turnover are di�erent from those whose trade exposure is,
say, 5%; if trade intensity, rather than trade status, is related to productivity, and importers are
di�erent in terms of distribution of the former variable, rather than the latter, this may explain
the relevance of importing25. We have therefore run our speci�cation including as additional
�rm-speci�c control the share of export to sales and the share of import to sales.
Table 11 present these results (coe�cient of �rms' characteristics not reported). We �nd that
lagged TFP is positively a�ected by all our proxies of complexity. In Column 1 we can see how
the average distance of the traded bundle seems to self-select more importers than exporters. In
terms of other proxies, the number of HS2 traded products seem to have similar e�ects across
the two classes of �rms, while the C Index and, to a greater extent, the Rauch index are clearly
higher for importers. These results are robust to the inclusion of all the proxies of complexity
together, and to the control for the intensive margin of trade and for two-way traders26.
We thus have a con�rmation that, on average, complexity is signi�cantly linked to the ex-
ante productivity of trading �rms, and that the e�ect seems to be stronger for importers than
exporters. Among the sources of complexity driving this e�ect for importers, the Rauch and
the C Index seem to be particularly relevant. The latter �nding is consistent with our idea
24The average distance of the traded bundle is constructed as the sum of the volumes of the traded goods weightedby the relative distance (in logs) between country i and the closer country to Hungary.
25In our data the relationship between trade intensity and TFP appears to be non linear: for both importers andexporters, maximum TFP is achieved at around 20-30% of the trade to sales ratio.
26Note how the dummy for two-way traders is higher in the case of exporters than importers, thus con�rmingonce again our ranking in terms of productivity also when controlling for complexity.
21
that importers face a more complex (or contractual-intensive) organization of the production
process, since the ex-ante TFP of importers is higher the more numerous, distant and legally
uncertain are the number of transactions, and the higher the level of product di�erentation of the
imported bundle27. This is to a lesser extent the case for exporting �rms, since trade contracts
are asymmetric: exporters face some uncertainties, but they have a perfect monitoring of the
quality of the goods sold, which implies the C I and Rauch indexes are in general also positive
and signi�cant, but with a smaller e�ect on lagged TFP.
.
To shed more light on these issues, we focus once again our attention on switching �rms.
Table 12 reports the result of a multivariate regression in which (lagged) TFP of a given category
of switching �rms !it�1j�FZ is regressed against our three measures of complexity plus our �rm-
speci�c controls and industry and time dummies:
!it�1j�FZ = �0 + �1Complexityit + �2Xit + aj + at + "it
Results show that the ex-ante productivity of �rms switching into imports is positively
and signi�cantly associated to higher values of the complexity measure, while the latter is not
necessarily true for exporting �rms. We thus have again some evidence consistent with the idea
that di�erent trade statuses entail a di�erent complexity of the traded goods. In particular, we
�nd that �rms switching into importing end up being not only ex-ante more productive but also
ex-post active into more complex trade activities, while the latter is not necessarily the case for
�rms who start exporting.
Finally, to provide another validation of the relationship between trade complexity and the
importing activity, we have used our sample of two-way traders as a sort of natural experiment.
If any measure of complexity drives self-selection, we should observe the more productive �rms
operating the most complex activities. Moreover, if complexity matters more on the importing
vs. the exporting side, we should observe, within two-way traders, the ratio of exported /
imported complexity measures decrease with productivity: the more productive you are, the
more complex products you import rather than export. According to our priors, one would
thus expect a negative correlation between a two-way trader TFP and the ratio of exported
/ imported complexity indexes. Since identi�cation takes place within the same �rm (two-
way trader), we can exclude that our results are driven by some unobserved �rm heterogeneity
a�ecting exporters di�erently than importers in terms of complexity.
To this extent, denote CX the complexity measure of exports and CM the complexity
of imports as measured by our proxies. For two-way traders, we can then de�ne a relative
complexity measure, itjz=XM = CX=CM as the ratio of exports to imports' complexity. We
27We have also tried to interact the C I index and the Rauch measure: in the case of importers both e�ects remainpositive and signi�cant, with a negative sign of the interaction. The latter is consistent with the idea that pro�tmaximising �rms ceteris paribus try to reduce the degree of product di�erentiation for a given average distanceof the supplier, and vice versa, in order to reduce the overall informational uncertainty of the imported bundle.
22
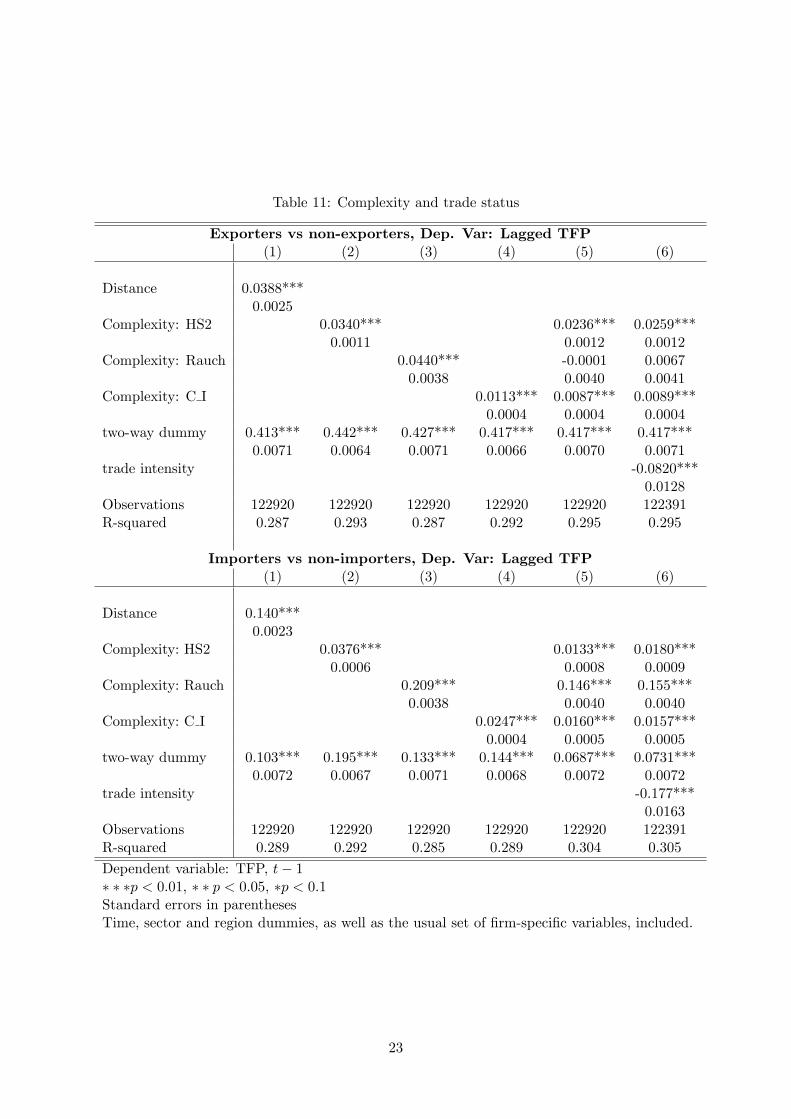
Table 11: Complexity and trade status
Exporters vs non-exporters, Dep. Var: Lagged TFP(1) (2) (3) (4) (5) (6)
Distance 0.0388***0.0025
Complexity: HS2 0.0340*** 0.0236*** 0.0259***0.0011 0.0012 0.0012
Complexity: Rauch 0.0440*** -0.0001 0.00670.0038 0.0040 0.0041
Complexity: C I 0.0113*** 0.0087*** 0.0089***0.0004 0.0004 0.0004
two-way dummy 0.413*** 0.442*** 0.427*** 0.417*** 0.417*** 0.417***0.0071 0.0064 0.0071 0.0066 0.0070 0.0071
trade intensity -0.0820***0.0128
Observations 122920 122920 122920 122920 122920 122391R-squared 0.287 0.293 0.287 0.292 0.295 0.295
Importers vs non-importers, Dep. Var: Lagged TFP(1) (2) (3) (4) (5) (6)
Distance 0.140***0.0023
Complexity: HS2 0.0376*** 0.0133*** 0.0180***0.0006 0.0008 0.0009
Complexity: Rauch 0.209*** 0.146*** 0.155***0.0038 0.0040 0.0040
Complexity: C I 0.0247*** 0.0160*** 0.0157***0.0004 0.0005 0.0005
two-way dummy 0.103*** 0.195*** 0.133*** 0.144*** 0.0687*** 0.0731***0.0072 0.0067 0.0071 0.0068 0.0072 0.0072
trade intensity -0.177***0.0163
Observations 122920 122920 122920 122920 122920 122391R-squared 0.289 0.292 0.285 0.289 0.304 0.305
Dependent variable: TFP, t� 1� � �p < 0:01, � � p < 0:05, �p < 0:1Standard errors in parenthesesTime, sector and region dummies, as well as the usual set of �rm-speci�c variables, included.
23

Table 12: Complexity and switching �rms
SWITCHERS Non trader to Importer Non trader to ExportersDep. var.: TFP (1) (2) (3) (4) (5) (6)
Complexity: HS2 0.0329** 0.0328(0.0130) (0.0269)
Complexity: Rauch 0.176** -0.177(0.0851) (0.108)
Complexity: C I 0.0288*** 0.0123(0.0108) (0.0243)
Firm size t� 1 0.131*** 0.130*** 0.133*** 0.116*** 0.0986*** 0.0983***(0.0259) (0.0259) (0.0259) (0.0325) (0.0319) (0.0319)
Foreign �rm, t� 1 0.205** 0.209** 0.218** -0.101 -0.112 -0.114(0.0906) (0.0905) (0.0906) (0.109) (0.104) (0.104)
Firm age, t� 1 0.0512*** 0.0525*** 0.0503*** 0.0911*** 0.0936*** 0.0948***(0.0135) (0.0135) (0.0135) (0.0156) (0.0156) (0.0156)
Former SOE, t� 1 0.112 0.118 0.112 -0.00594 -0.00820 -0.0124(0.117) (0.117) (0.118) (0.128) (0.123) (0.123)
Constant -0.430 -0.362 -0.437 -1.178* -2.156*** -1.976***(0.455) (0.453) (0.458) (0.667) (0.553) (0.560)
Observations 1424 1424 1424 814 859 859R-squared 0.134 0.135 0.133 0.246 0.228 0.230Log likelihood -2155 -2155 -2156 -1129 -1204 -1203
Dependent variable: TFP, t� 1� � �p < 0:01, � � p < 0:05, �p < 0:1Standard errors in parenthesesModels include time, sector and county dummies
24

then run the following regression:
!it�1 = �0 + �1itjz=XM + �2Xit + at + "it (8)
where we have regressed the level of lagged TFP of each �rm !i against the relative complexity
measure it, and usual controls.
Table 13 shows the results of this multivariate regression for two-way traders, always control-
ling for �rms' characteristics, industry and time �xed e�ects. As it can be seen, we always �nd
that the complexity of the imported products increases with productivity proportionally more
than the one for exporting products, since the ratio between the measures is always negative
and signi�cant. Once again, the ratio is particularly signi�cant for the Rauch index, in line with
our previous results pointing to the prevalence of organizational complexity as a driver of sunk
costs for importers28.
Table 13: Complexity and Productivity for Two-way traders
Dep. V.: lag TFP OLS OLS OLS OLS OLS Panel: FE Panel: BECX/CM: HS2 -0.090*** -0.081*** -0.085*** -0.0049 -0.105***
0.0099 0.0098 0.0101 0.0071 0.0141CX/CM: Rauch -0.101*** -0.105*** -0.111*** -0.014 -0.080**
0.0265 0.027 0.027 0.0214 0.038CX/CM: C I -0.036*** -0.023** -0.023*** -0.0014 -0.039***
0.0094 0.0088 0.0089 0.0058 0.0101import share -0.042***
0.012export share -0.063**
0.0286Firm size 0.137*** 0.138*** 0.138*** 0.138*** 0.140*** 0.033** 0.141***
0.0081 0.00791 0.0079 0.00811 0.0082 0.0167 0.0071Foreign �rm. 0.260*** 0.267*** 0.264*** 0.258*** 0.281*** 0.104*** 0.221***
0.0182 0.0179 0.0179 0.0181 0.019 0.0194 0.022Firm size 0.050*** 0.050*** 0.050*** 0.049*** 0.048*** 0.048*** 0.107***
0.0043 0.0044 0.0044 0.0043 0.0043 0.0028 0.0058Former SOE -0.012 -0.01 -0.010 -0.011 -0.017 -0.047
0.0255 0.0252 0.0252 0.0255 0.0254 0.0303Constant -0.35*** -0.26* -0.33** -0.24** 0.12 0.37*** -0.99***
0.115 0.145 0.141 0.116 0.143 0.0784 0.16Observations 37767 40086 40086 37767 37762 37767 37767R-squared 0.293 0.283 0.284 0.294 0.299 0.062 0.353Number of id 7064 7064
Pooled OLS with �rm clusters. Robust standard errors in brackets*** p < 0:01, ** p < 0:05, * p < 0:1
28We have also run our estimates using the simple average distance of the traded bundle, with similar results.Moreover, we have incorporated square terms of the CX=CM variables, �nding that, not surprisingly, therelationship tends to be non-linear, with marginally decreasing e�ects in terms of added import complexity asproductivity increases.
25
6 Conclusions
This paper derives a picture in which importing �rms seem to implement more complex strate-
gies than exporting �rms. It then follows that the importing strategy per se might generate
a selection process of �rms of an inherently di�erent nature than the simple sunk costs ap-
proach traditionally associated to the exporting activity. In other words, we do �nd evidence
of sunk costs of exports leading to self-selection of �rms; however, we �nd evidence that the
strategic choice of importing seems to require a more complex organization of production than
the choice of exporting, especially from an organizational point of view related to the informa-
tional asymmetry faced by importers, thus inducing a (stronger) self-selection e�ect in terms of
productivity.
Since the available empirical evidence points to the fact that, across countries, the importing
and exporting activity tend to be highly correlated within �rms, one general implication of our
results is that failing to control for the importing activity, as a large part of the literature has
done insofar, might lead to an overstated average productivity premium of exporters.
Our paper thus o�ers a possible channel through which open the export-productivity `black
box'. Clearly, this is one of a number of possible directions of research. As theoretically shown
by Costantini and Melitz (2008), in fact, the exporting activity may be correlated with other
important �rm-level decisions (e.g. innovation), and these combined interactions might be the
reasons behind di�erences in the performance of exporters, as well as behind the timing of their
decision. Roberts et al. (2009), for example, show in the case of Taiwan electronic industry that
exporting �rms are among the most productive only when jointly undertaking R&D activities,
while exporting only, per se, would not entail a large productivity premium.
We believe that more work is due along these interesting lines of research.
Moreover, our �ndings are valid for Hungary, a small open economy, in which it is rela-
tively more likely that importers are part of international production networks (although we
always control for foreign ownership), and therefore more likely to face a complex organisation
of production of their imported bundle, generating the detected self-selection e�ect. It would
be interesting to compare these results in a large, relatively more closed economy, in which the
nature of the organization of production of importing �rms might be altogether di�erent.
26

References
Amiti, M. and J. Konings (2007) \Trade liberalization, intermediate inputs and productivity: evidence from
Indonesia", American Economic Review 97: 1611-1638.
Arndt S.W. and H. Kierzkowski, eds. (2001), Fragmentation: New Production Patterns in the World Econ-
omy, Oxford University Press, Oxford.
Arkolakis, C. (2008) \Market Penetration Costs and the New Consumers Margin in International Trade",
NBER Working Paper No. 14214, Washington, D.C.
Andersson, M., S. Johansson, and H. Loof (2007) \Firm performance and international trade - evidence from
a small open economy", ElectronicWorking Paper Series 99, CESIS
B�ek�es, G, Harasztosi, P. and Murakozy, B. (2008) \Hungarian manufacturing �rms in trade", mimeo IEHAS
2008 June
B�ek�es, G - Murak:ozy, B. (2008) Firm Performance and Switching to Export, mimeo, IEHAS 2008 June
Bernard, A., J. Eaton, J.B. Jensen and S. Kortum (2003) \Plants and Productivity in International Trade",
American Economic Review 93: 1268-1290.
Bernard, A., J. B. Jensen and P.K. Schott, (2005) \Importers, Exporters and Multinationals: A Portrait of
Firms in the U.S. that Trade Goods", in T. Dunne, J.B. Jensen and M.J. Roberts (eds.), Producer Dynamics:
New Evidence from Micro Data (University of Chicago Press, forthcoming).
Bernard, A., J. B. Jensen and P.K. Schott (2006) \Trade Costs, Firms and Productivity", Journal of Monetary
Economics 53(5).
Bernard, A., J. B. Jensen, S. Redding and P.K. Schott (2007) \Firms in International Trade", Journal of
Economic Perspectives 21: 105-130.
Castellani, D., F. Serti and C. Tomasi (2008) \Firms in International Trade: Importers and Exporters Het-
erogeneity in Italian Manufacturing Industry", mimeo.
Costantini, J. and M. Melitz (2008) \The Dynamics of Firm-Level Adjustment to Trade Liberalization", in
The Organization of Firms in a Global Economy, E. Helpman, D. Marin, and T. Verdier (eds.), Harvard University
Press.
Das, S., M. Roberts and J. Tybout (2007) \Market Entry Costs, Producer Heterogeneity and Export Dy-
namics", Econometrica 75(3): 837{873.
De Loecker, J. (2007) \Do Exports Generate Higher Productivity? Evidence from Slovenia", Journal of
International Economics 73: 69-98.
Feenstra, R. (1998) \Integration of Trade and Disintegration of Production in the Global Economy", Journal
of Economic Perspectives 12(4): 31-50.
Feinberg, S. and M.P. Keane (2001) \US-Canada Trade Liberalization and MNC Production Location", The
Review of Economics and Statistics 83: 118-132.
Halpern, L., M. Koren, and A. Szeidl (2005) \Imports and productivity", CEPR Working Paper No. 5139,
London.
Hummels, D., J. Ishii and K.-M. Yi (2001) \The Nature and Growth of Vertical Specialization in World
Trade", Journal of International Economics 54(1): 75-96.
27
Kasahara, H. and J. Rodrigue (2005) \Does the Use of Imported Intermediates Increase Productivity?", RBC
Financial Group Economic Policy Research Institute Working Paper No. 20057, London, Ontario.
Kasahara, H. and Lapham, B. (2008) \Productivity and the Decision to Import and Export: Theory and
Evidence", Journal of International Economics, forth.
Keller, W. and S.R. Yeaple (2008) \Global Production and Trade in the Knowledge Economy", NBER
Working Paper No. 14626, Washington, D.C.
Lawrence, R. Z. (2000) \Does a kick in the pants get you going or does it just hurt? The impact of international
competition on technological change in US manufacturing", in R. E. Feenstra (editor), The Impact of International
Trade on Wages, University of Chicago Press for the National Bureau of Economic Research, 197-224.
Lileeva, A. and D. Tre er (2007) \Improved Access to Foreign Markets Raises Plant-Level Productivity ...
for Some Plants", NBER Working Papers No. 13297, Washington D.C.
Levinsohn, J. and A. Petrin (2003) \Estimating Production Functions Using Inputs to Control for Unobserv-
ables", Review of Economic Studies 70: 317-342.
Mayer T. and G.. Ottaviano (2007) \The happy few: new facts on the internationalisation of European
�rms", Bruegel-CEPR EFIM2007 Report, Bruegel Blueprint Series
Melitz, M. (2003) \The impact of trade on intraindustry reallocations and aggregate industry productivity",
Econometrica 71: 1695-1725.
Milgrom, P. and J. Roberts (1990) \The Economics of Modern Manufacturing: Technology, Strategy, and
Organization", American Economic Review 80: 511-528.
Muuls, M. & M. Pisu (2005) \Imports and Exports at the Level of the Firm: Evidence from Belgium",
Working Paper No. 114, National Bank of Belgium.
Nunn, N. (2007) \Relationship-Speci�city, Incomplete Contracts and the Pattern of Trade", Quarterly Journal
of Economics 122(2): 569-600.
Pavcnik, N. (2002), \Trade Liberalization, Exit, and Productivity Improvements: Evidence from Chilean
Plants", Review of Economic Studies 69: 245-76.
Olley, S. and A. Pakes (1996) \The dynamics of productivity in the telecommunications equipment industry\,
Econometrica 64: 1263-1298.
Tybout, J. (2003) \Plant- and Firm-level Evidence on the 'New' Trade Theories" in E. Kwan Choi and James
Harrigan, ed., Handbook of International Trade, Oxford: Basil-Blackwell.
J�rgensen, J. and P. Schr�oder (2008) \Fixed export cost heterogeneity, trade and welfare", European Economic
Review 52(7): 1256-1274
Roberts, M., Aw, B.Y. and Xu, D.Y. (2009) \ R&D Investment, Exporting, and Productivity Dynamics",
NBER Working Paper No. 14670, Washington, D.C.
Yi, K.-M. (2003) \Can Vertical Specialization Explain the Growth of World Trade?", Journal of Political
Economy 111(1): 52-102.
28

Appendix
Table 14: Number of �rms in sample per year
Year N. of �rms
1992 11,0361993 12,8321994 14,2071995 15,6861996 17,7411997 19,8961998 20,9741999 21,0632000 14,8152001 14,7232002 14,8892003 14,486
Total 192,348

Table 15: Number of �rms in sample by NACE2 industry / year
NACE2 1992 1997 2002
N. % N. % N. %
17 Textiles 465 4.21% 944 4.74% 683 4.59%18 Clothes 761 6.90% 1155 5.81% 979 6.58%19 Leather 271 2.46% 411 2.07% 345 2.32%20 Wood 651 5.90% 1387 6.97% 1096 7.36%21 Paper 124 1.12% 262 1.32% 258 1.73%22 Publishing 1545 14.00% 2954 14.85% 1474 9.90%23 Coke, Petroleum 8 0.07% 18 0.09% 9 0.06%24 Chemicals 395 3.58% 649 3.26% 523 3.51%25 Rubber, Plastic 610 5.53% 1141 5.73% 1046 7.03%26 Non-metallic minerals 455 4.12% 835 4.20% 665 4.47%27 Basic metals 148 1.34% 235 1.18% 195 1.31%28 Fabricated metals 1554 14.08% 2895 14.55% 2356 15.82%29 Machinery 1765 15.99% 2704 13.59% 1848 12.41%30 O�ce equipment 117 1.06% 226 1.14% 134 0.90%31 Electric 452 4.10% 865 4.35% 619 4.16%32 Audio, Video 374 3.39% 639 3.21% 473 3.18%33 Medical, precision 488 4.42% 926 4.65% 687 4.61%34 Motor Vehicles 148 1.34% 246 1.24% 241 1.62%35 Other transport 75 0.68% 152 0.76% 130 0.87%36 Furniture 590 5.35% 1139 5.72% 1029 6.91%37 Recycling 39 0.35% 113 0.57% 99 0.66%
Total 11035 100% 19896 100% 14889 100%
30
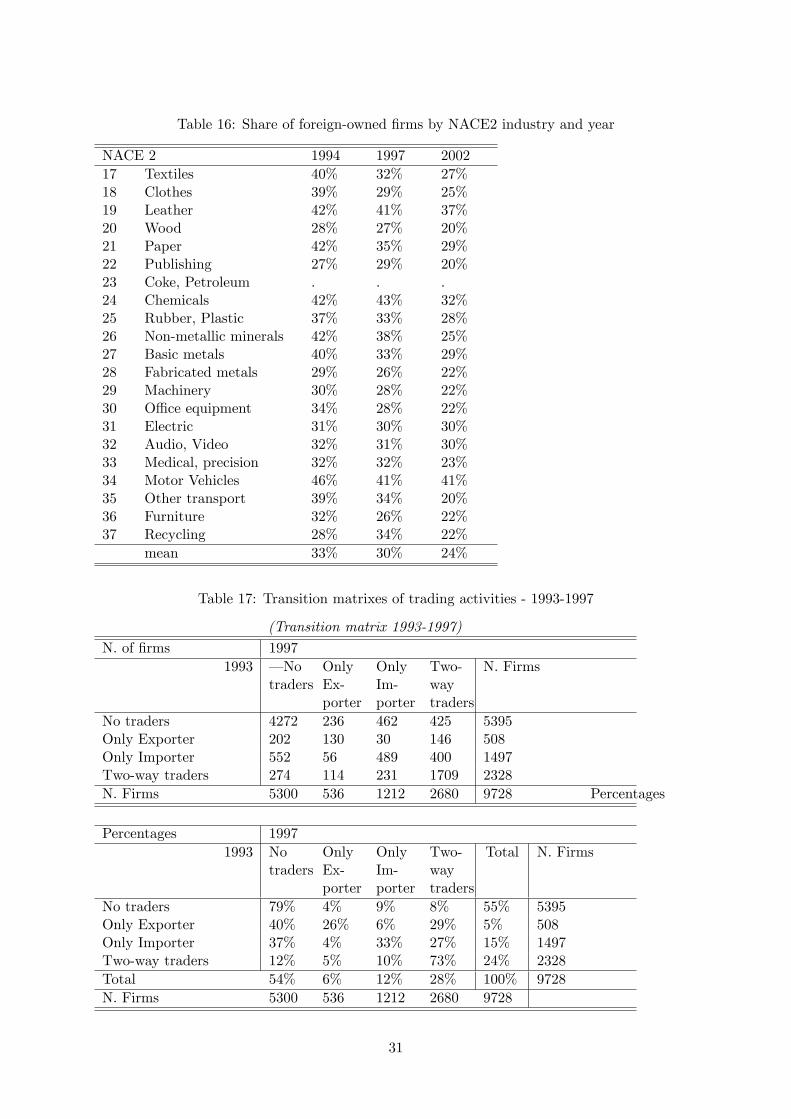
Table 16: Share of foreign-owned �rms by NACE2 industry and year
NACE 2 1994 1997 2002
17 Textiles 40% 32% 27%18 Clothes 39% 29% 25%19 Leather 42% 41% 37%20 Wood 28% 27% 20%21 Paper 42% 35% 29%22 Publishing 27% 29% 20%23 Coke, Petroleum . . .24 Chemicals 42% 43% 32%25 Rubber, Plastic 37% 33% 28%26 Non-metallic minerals 42% 38% 25%27 Basic metals 40% 33% 29%28 Fabricated metals 29% 26% 22%29 Machinery 30% 28% 22%30 O�ce equipment 34% 28% 22%31 Electric 31% 30% 30%32 Audio, Video 32% 31% 30%33 Medical, precision 32% 32% 23%34 Motor Vehicles 46% 41% 41%35 Other transport 39% 34% 20%36 Furniture 32% 26% 22%37 Recycling 28% 34% 22%
mean 33% 30% 24%
Table 17: Transition matrixes of trading activities - 1993-1997
(Transition matrix 1993-1997)
N. of �rms 1997
1993 |Notraders
OnlyEx-porter
OnlyIm-porter
Two-waytraders
N. Firms
No traders 4272 236 462 425 5395Only Exporter 202 130 30 146 508Only Importer 552 56 489 400 1497Two-way traders 274 114 231 1709 2328
N. Firms 5300 536 1212 2680 9728 Percentages
Percentages 1997
1993 Notraders
OnlyEx-porter
OnlyIm-porter
Two-waytraders
Total N. Firms
No traders 79% 4% 9% 8% 55% 5395Only Exporter 40% 26% 6% 29% 5% 508Only Importer 37% 4% 33% 27% 15% 1497Two-way traders 12% 5% 10% 73% 24% 2328
Total 54% 6% 12% 28% 100% 9728
N. Firms 5300 536 1212 2680 9728
31
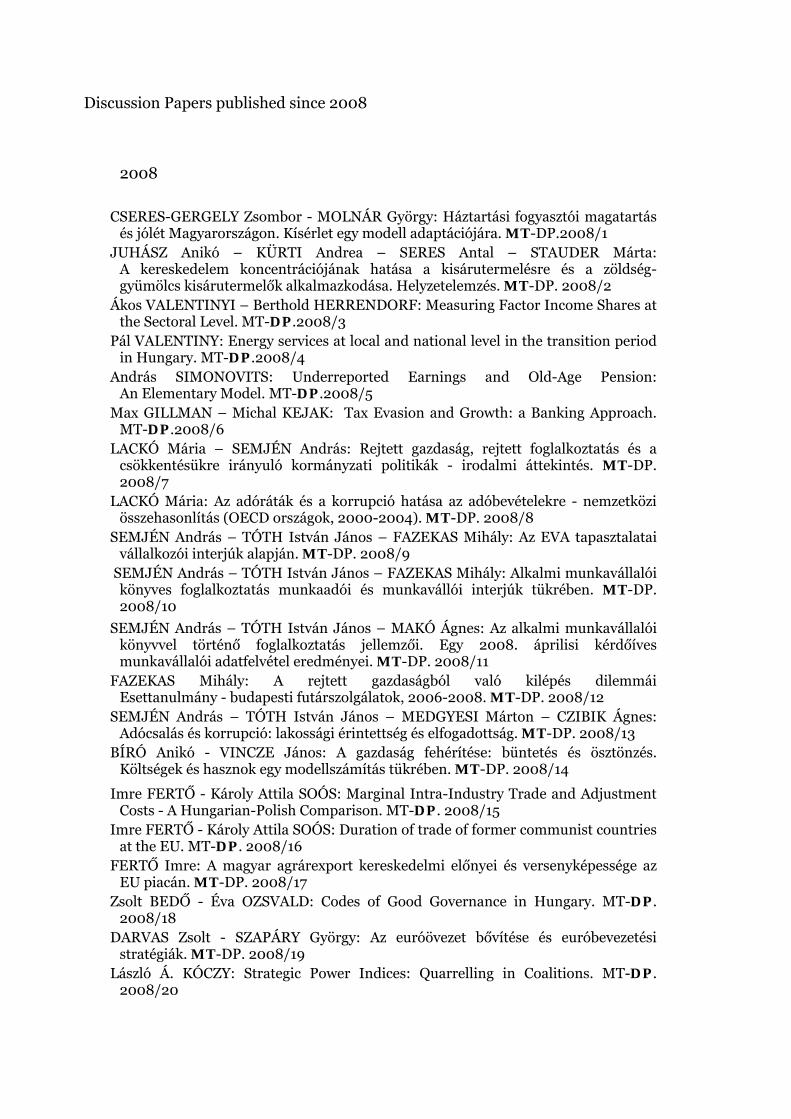
Discussion Papers published since 2008
2008
CSERES-GERGELY Zsombor - MOLNÁR György: Háztartási fogyasztói magatartás
és jólét Magyarországon. Kísérlet egy modell adaptációjára. MT-DP.2008/1 JUHÁSZ Anikó – KÜRTI Andrea – SERES Antal – STAUDER Márta:
A kereskedelem koncentrációjának hatása a kisárutermelésre és a zöldség-gyümölcs kisárutermelők alkalmazkodása. Helyzetelemzés. MT-DP. 2008/2
Ákos VALENTINYI – Berthold HERRENDORF: Measuring Factor Income Shares at the Sectoral Level. MT-DP.2008/3
Pál VALENTINY: Energy services at local and national level in the transition period in Hungary. MT-DP.2008/4
András SIMONOVITS: Underreported Earnings and Old-Age Pension: An Elementary Model. MT-DP.2008/5
Max GILLMAN – Michal KEJAK: Tax Evasion and Growth: a Banking Approach. MT-DP.2008/6
LACKÓ Mária – SEMJÉN András: Rejtett gazdaság, rejtett foglalkoztatás és a csökkentésükre irányuló kormányzati politikák - irodalmi áttekintés. MT-DP. 2008/7
LACKÓ Mária: Az adóráták és a korrupció hatása az adóbevételekre - nemzetközi összehasonlítás (OECD országok, 2000-2004). MT-DP. 2008/8
SEMJÉN András – TÓTH István János – FAZEKAS Mihály: Az EVA tapasztalatai vállalkozói interjúk alapján. MT-DP. 2008/9
SEMJÉN András – TÓTH István János – FAZEKAS Mihály: Alkalmi munkavállalói könyves foglalkoztatás munkaadói és munkavállói interjúk tükrében. MT-DP. 2008/10
SEMJÉN András – TÓTH István János – MAKÓ Ágnes: Az alkalmi munkavállalói könyvvel történő foglalkoztatás jellemzői. Egy 2008. áprilisi kérdőíves munkavállalói adatfelvétel eredményei. MT-DP. 2008/11
FAZEKAS Mihály: A rejtett gazdaságból való kilépés dilemmái Esettanulmány - budapesti futárszolgálatok, 2006-2008. MT-DP. 2008/12
SEMJÉN András – TÓTH István János – MEDGYESI Márton – CZIBIK Ágnes: Adócsalás és korrupció: lakossági érintettség és elfogadottság. MT-DP. 2008/13
BÍRÓ Anikó - VINCZE János: A gazdaság fehérítése: büntetés és ösztönzés. Költségek és hasznok egy modellszámítás tükrében. MT-DP. 2008/14
Imre FERTŐ - Károly Attila SOÓS: Marginal Intra-Industry Trade and Adjustment Costs - A Hungarian-Polish Comparison. MT-DP. 2008/15
Imre FERTŐ - Károly Attila SOÓS: Duration of trade of former communist countries at the EU. MT-DP. 2008/16
FERTŐ Imre: A magyar agrárexport kereskedelmi előnyei és versenyképessége az EU piacán. MT-DP. 2008/17
Zsolt BEDŐ - Éva OZSVALD: Codes of Good Governance in Hungary. MT-DP. 2008/18
DARVAS Zsolt - SZAPÁRY György: Az euróövezet bővítése és euróbevezetési stratégiák. MT-DP. 2008/19
László Á. KÓCZY: Strategic Power Indices: Quarrelling in Coalitions. MT-DP. 2008/20

Sarolta LACZÓ: Riskiness, Risk Aversion, and Risk Sharing: Cooperation in a Dynamic Insurance Game. MT-DP. 2008/21
Zsolt DARVAS: Leveraged Carry Trade Portfolios. MT-DP. 2008/22 KARSAI Judit: "Az aranykor vége" - A kockázati- és magántőke-ágazat fejlődése
Közép- és Kelet-Európában. MT-DP. 2008/23 Zsolt DARVAS - György SZAPÁRY: Euro Area Enlargement and Euro Adoption
Strategies. MT-DP. 2008/24 Helmuts ĀZACIS - Max GILLMAN: Flat Tax Reform: The Baltics 2000 – 2007.
MT-DP. 2008/25 Ádám SZENTPÉTERI - Álmos TELEGDY: Political Selection of Firms into
Privatization Programs. Evidence from Romanian Comprehensive Data. MT-DP. 2008/26
DARVAS Zsolt - SZAPÁRY György: Az új EU-tagországok megfelelése az optimális valutaövezet kritériumainak. MT-DP. 2008/27
CSATÓ Katalin: Megjegyzések Navratil Ákos elmélettörténetéhez. MT-DP. 2008/28
2009
Judit KARSAI: The End of the Golden Age - The Developments of the Venture
Capital and Private Equity Industry in Central and Eastern Europe. MT-DP. 2009/1
András SIMONOVITS: When and How to Subsidize Tax-Favored Retirement Accounts? MT-DP.2009/2
Mária CSANÁDI: The "Chinese Style Reforms" and the Hungarian "Goulash Communism". MT-DP. 2009/3
Mária CSANÁDI: The Metamorphosis of the Communist Party: from Entity to System and from System towards an Entity. MT-DP. 2009/4
Mária CSANÁDI – Hairong LAI – Ferenc GYURIS: Global Crisis and its Implications on the Political Transformation in China. MT-DP. 2009/5
DARVAS Zsolt - SZAPÁRY György: Árszínvonal-konvergencia az új EU tagországokban: egy panel-regressziós modell eredményei. MT-DP. 2009/6
KÜRTI Andrea - KOZAK Anita - SERES Antal - SZABÓ Márton: Mezőgazdasági kisárutermelők nagy kereskedelmi láncooknak történő beszállítása a nagyvevői igények alapján a zöldség-gyümölcs ágazatban. MT-DP.2009/7
András SIMONOVITS: Hungarian Pension System and its Reform. MT-DP.2009/8 Balázs MURAKÖZY - Gábor BÉKÉS: Temporary Trade. MT-DP. 2009/9 Alan AHEARNE - Herbert BRÜCKER - Zsolt DARVAS - Jakob von WEIZSÄCKER:
Cyclical Dimensions of Labour Mobility after EU Enlargement. MT-DP. 2009/10 Max GILLMAN - Michal KEJAK: Inflation, Investment and Growth: a Money and
Banking Approach. MT-DP. 2009/11 Max GILLMAN - Mark N. HARRIS: The Effect of Inflation on Growth: Evidence
from a Panel of Transition Countries. MT-DP. 2009/12 Zsolt DARVAS: Monetary Transmission in Three Central European Economies:
Evidence from Time-Varying Coefficient Vector Autoregressions. MT-DP. 2009/13
Discussion Papers are available at the website of Institute of Economics Hungarian Academy of Sciences: http://econ.core.hu