High Concurrent R-tree Operations when Tracking Continuous Movement
Tracking movement into employment for half a million low income families
21
Giovanni Tonutti Policy in Practice Tracking movement into employment for half a million low income families
-
Upload
policy-in-practice -
Category
Data & Analytics
-
view
52 -
download
1
Transcript of Tracking movement into employment for half a million low income families

Giovanni TonuttiPolicy in Practice Tracking movement into
employment for half a million
low income families
Agenda
1 Introduction to Policy in Practice and the project
2 Findings movements into work amp barriers to work
3 How to tackle the disability employment gap
4 QampA
We make the welfare system simple to understand so that people can make the decisions that are right for them
bull 27 of the total population in participating boroughs
Large scale data analysis
Your Housing Benefit
Council Tax data
Our Universal Benefit
Calculator
Rich detailed impact
assessment who is
impacted and what are the
Council-wide effects
Our approach
666
The findings
The static picture
bull Working-age households in work 42
bull Average number of hours worked 25
bull 80 of households earn below living wage
A constant churn of households
Dynamic analysis
bull 12 of households moved into or out of work in the last 12 months
bull 8 of out of work households moved into work
By shifting the focus from the aggregate figures to dynamic analysis a
picture of constantly changing employment patterns emerges
Benchmark across different geographies
Drill down to micro-areasstreet level
Track how circumstances change
111111
This approach captures the dynamics effects of different policy interventionshellip
hellipand can help policy makers answer a whole different set of questions
1 Is the benefit cap helping people into work or pushing them into high-cost temporary accommodation
2 What are the causal drivers of financial risk
3 Are local interventions (DHPs employment support) achieving their objectives
4 Which factors determine the likelihood of workless families to move into employment
Policy makers should want to knowhellip
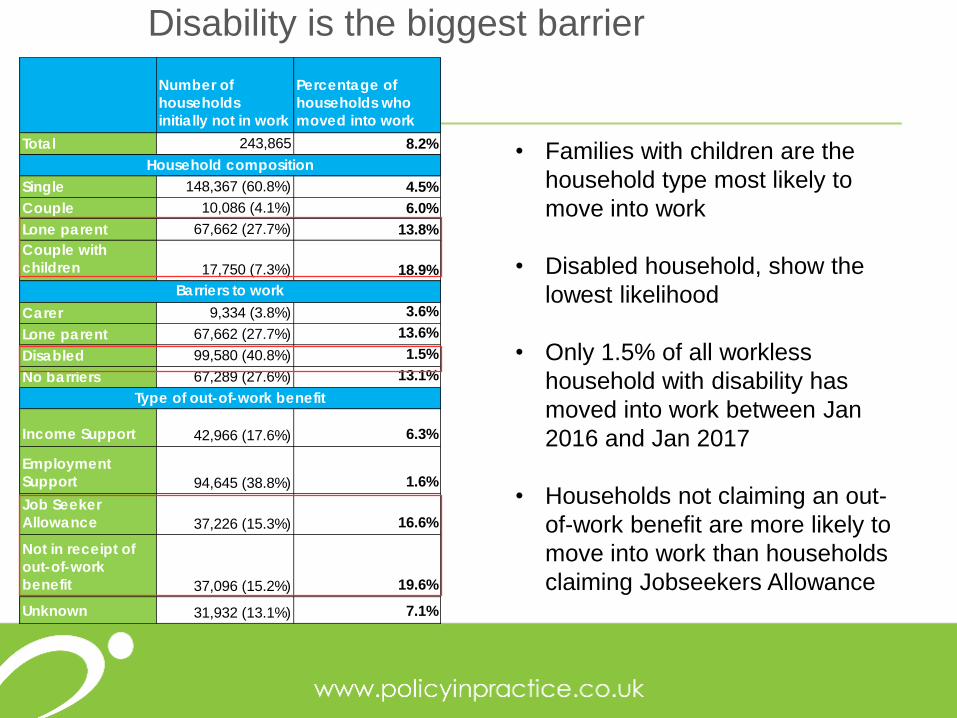
Disability is the biggest barrier
Number of
households
initia lly not in work
Percentage of
households who
moved into work
Total 243865 82
Single 148367 (608) 45
Couple 10086 (41) 60
Lone parent 67662 (277) 138
Couple with
children 17750 (73) 189
Carer 9334 (38) 36
Lone parent 67662 (277) 136
Disabled 99580 (408) 15
No barriers 67289 (276) 131
Income Support 42966 (176) 63
Employment
Support 94645 (388) 16
Job Seeker
Allowance 37226 (153) 166
Not in receipt of
out-of-work
benefit 37096 (152) 196
Unknown 31932 (131) 71
Household composition
Barriers to work
Type of out-of-work benefit
bull Families with children are the
household type most likely to
move into work
bull Disabled household show the
lowest likelihood
bull Only 15 of all workless
household with disability has
moved into work between Jan
2016 and Jan 2017
bull Households not claiming an out-
of-work benefit are more likely to
move into work than households
claiming Jobseekers Allowance
Profile of disabled workless households
The 91 receive ESA 25 receive both ESA and DLA 9 DLA only
151515
What can be done to reduce this gap
Look at improvements made with lone parents
bull In 1996 51 of all lone parents households were out of work
bull This figure dropped to 37 in 2015 a 41 reduction
Resolution Foundation (2016) Employing new tactics
ldquoThe success in increasing rate of employment among parents and single parents especially is down to a series of government policies implemented since 1997 until today ldquo
Financial Support
Working Tax Credit
Free Childcare for 3amp4
yr old
Conditionality
Requirement for lsquojob-
seeking activityrsquo for
single parents
Regulation
Extension of
maternity leave
periods to 52 weeks
181818
Disability is the toughest barrier to overcome
Efforts to close the gap focused primarily on the supply side
bull Financial support is there Permitted work under ESA work allowances under UC Are these communicated to claimants
bull Conditionality has been introduced under ESA and WampH adds an element to this
bull Regulation is lacking
bull Focus should also be on the demand side-Incentives for private employers to hire disabled employees
-Provide more guarantees to employees who fall sick (extend Statutory Sick Pay to 52 weeks)
-Wage subisdies
202020
WampH Programe represents a unique opportunity to trial innovative solutions to this issue at the local level (London amp Manchester)
Monitoring the progress of programme will be critical
Longitudinal analysis of household-level data allows to assess the success of these interventions
Policy in Practicersquos approach shows that this can be done at scale We welcome any suggestions on how we could apply it to the context of the Work amp Programme
Next Steps
1 Second round of data collection (July)
2 Preliminary publication of the findings available here
3 To find out more about our work and our services please contact us at hellopolicyinpracticecouk
Thanks
Giovanni Tonutti
giovannipolicyinpracticecouk

Agenda
1 Introduction to Policy in Practice and the project
2 Findings movements into work amp barriers to work
3 How to tackle the disability employment gap
4 QampA
We make the welfare system simple to understand so that people can make the decisions that are right for them
bull 27 of the total population in participating boroughs
Large scale data analysis
Your Housing Benefit
Council Tax data
Our Universal Benefit
Calculator
Rich detailed impact
assessment who is
impacted and what are the
Council-wide effects
Our approach
666
The findings
The static picture
bull Working-age households in work 42
bull Average number of hours worked 25
bull 80 of households earn below living wage
A constant churn of households
Dynamic analysis
bull 12 of households moved into or out of work in the last 12 months
bull 8 of out of work households moved into work
By shifting the focus from the aggregate figures to dynamic analysis a
picture of constantly changing employment patterns emerges
Benchmark across different geographies
Drill down to micro-areasstreet level
Track how circumstances change
111111
This approach captures the dynamics effects of different policy interventionshellip
hellipand can help policy makers answer a whole different set of questions
1 Is the benefit cap helping people into work or pushing them into high-cost temporary accommodation
2 What are the causal drivers of financial risk
3 Are local interventions (DHPs employment support) achieving their objectives
4 Which factors determine the likelihood of workless families to move into employment
Policy makers should want to knowhellip
Disability is the biggest barrier
Number of
households
initia lly not in work
Percentage of
households who
moved into work
Total 243865 82
Single 148367 (608) 45
Couple 10086 (41) 60
Lone parent 67662 (277) 138
Couple with
children 17750 (73) 189
Carer 9334 (38) 36
Lone parent 67662 (277) 136
Disabled 99580 (408) 15
No barriers 67289 (276) 131
Income Support 42966 (176) 63
Employment
Support 94645 (388) 16
Job Seeker
Allowance 37226 (153) 166
Not in receipt of
out-of-work
benefit 37096 (152) 196
Unknown 31932 (131) 71
Household composition
Barriers to work
Type of out-of-work benefit
bull Families with children are the
household type most likely to
move into work
bull Disabled household show the
lowest likelihood
bull Only 15 of all workless
household with disability has
moved into work between Jan
2016 and Jan 2017
bull Households not claiming an out-
of-work benefit are more likely to
move into work than households
claiming Jobseekers Allowance
Profile of disabled workless households
The 91 receive ESA 25 receive both ESA and DLA 9 DLA only
151515
What can be done to reduce this gap
Look at improvements made with lone parents
bull In 1996 51 of all lone parents households were out of work
bull This figure dropped to 37 in 2015 a 41 reduction
Resolution Foundation (2016) Employing new tactics
ldquoThe success in increasing rate of employment among parents and single parents especially is down to a series of government policies implemented since 1997 until today ldquo
Financial Support
Working Tax Credit
Free Childcare for 3amp4
yr old
Conditionality
Requirement for lsquojob-
seeking activityrsquo for
single parents
Regulation
Extension of
maternity leave
periods to 52 weeks
181818
Disability is the toughest barrier to overcome
Efforts to close the gap focused primarily on the supply side
bull Financial support is there Permitted work under ESA work allowances under UC Are these communicated to claimants
bull Conditionality has been introduced under ESA and WampH adds an element to this
bull Regulation is lacking
bull Focus should also be on the demand side-Incentives for private employers to hire disabled employees
-Provide more guarantees to employees who fall sick (extend Statutory Sick Pay to 52 weeks)
-Wage subisdies
202020
WampH Programe represents a unique opportunity to trial innovative solutions to this issue at the local level (London amp Manchester)
Monitoring the progress of programme will be critical
Longitudinal analysis of household-level data allows to assess the success of these interventions
Policy in Practicersquos approach shows that this can be done at scale We welcome any suggestions on how we could apply it to the context of the Work amp Programme
Next Steps
1 Second round of data collection (July)
2 Preliminary publication of the findings available here
3 To find out more about our work and our services please contact us at hellopolicyinpracticecouk
Thanks
Giovanni Tonutti
giovannipolicyinpracticecouk

Next Steps
1 Second round of data collection (July)
2 Preliminary publication of the findings available here
3 To find out more about our work and our services please contact us at hellopolicyinpracticecouk
Thanks
Giovanni Tonutti
giovannipolicyinpracticecouk
