
Tracking Membrane Receptor Dynamics Using Quantum Dot-labeled Ligands and Quantitative Fluorescence...
22
Tracking Membrane Receptor Dynamics Using Quantum Dot-labeled Ligands and Quantitative Fluorescence Microscopy Diane Lidke UK-German Frontiers of Science
-
Upload
felicity-kelley -
Category
Documents
-
view
216 -
download
2
Transcript of Tracking Membrane Receptor Dynamics Using Quantum Dot-labeled Ligands and Quantitative Fluorescence...

Tracking Membrane Receptor Dynamics Using Quantum Dot-labeled Ligands and
Quantitative Fluorescence Microscopy
Diane LidkeUK-German Frontiers of Science

The erbB family of Receptor Tyrosine Kinases
Overexpression (and/or mutation) cancer
EGF – erbB1Neuregulin – erbB3/4No ligand for erbB2
erbB1 domainstructure
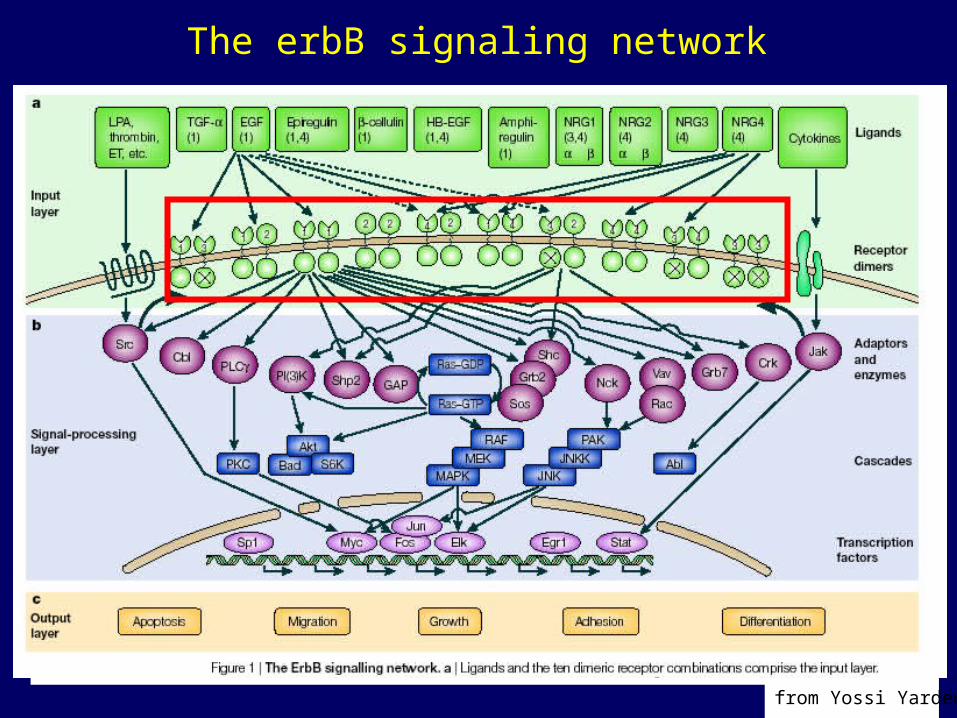
The erbB signaling network
from Yossi Yarden

EGFR (erbB1/HER1) + EGF
EGF EGF
Domain I
Domain II
Domain III
1ivo H.Ogiso et al., Cell, 110, 775-787 ( 2002)
dimerizationloops
Domain IV
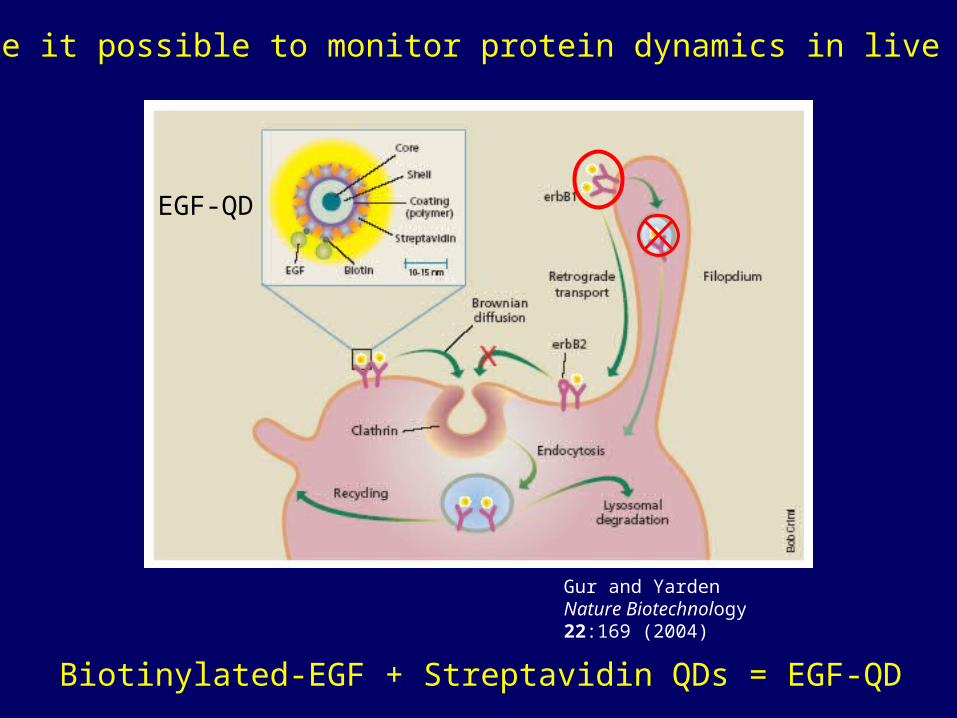
Gur and Yarden Nature Biotechnology 22:169 (2004)
EGF-QD
QDs make it possible to monitor protein dynamics in live cells…
Biotinylated-EGF + Streptavidin QDs = EGF-QD

Quantum Dots
Commercial sources: Quantum Dot Inc., Evident Technologies
Biomolecule (SA)
Polymer Coating
Passivation Shell (ZnS)
SemiconductorNanocrystal (CdSe)
• Broad excitation spectrum • Narrow emission band• Brightness• Photostability• Single molecule sensitivity• Bioconjugates (Streptavidin, Protein A, IgG...)• Non-toxic• Donors for FRET
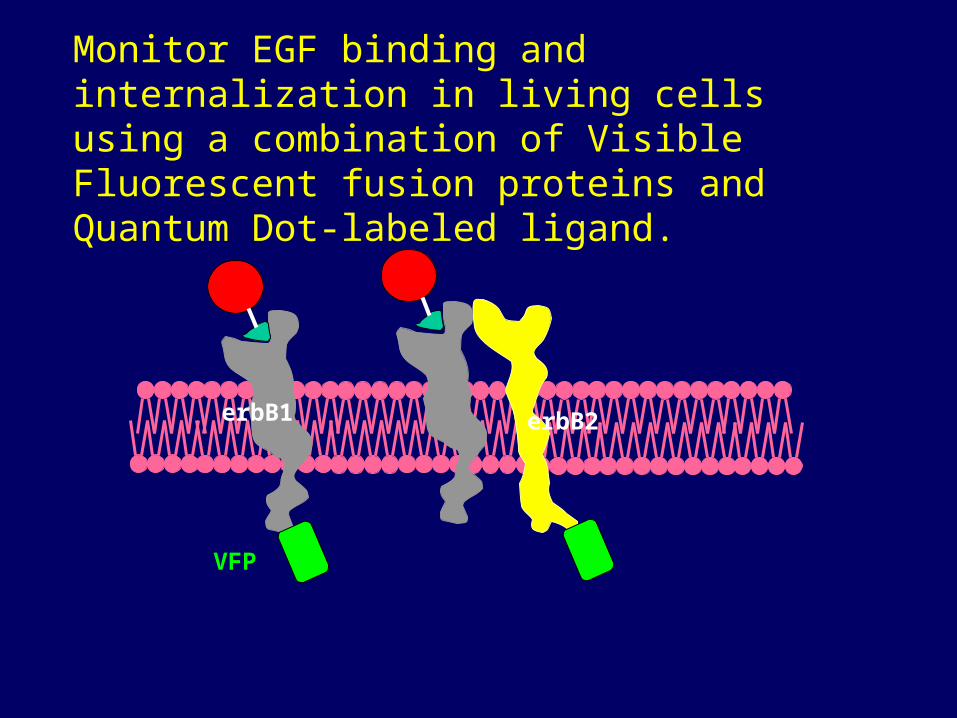
Monitor EGF binding and internalization in living cells using a combination of Visible Fluorescent fusion proteins and Quantum Dot-labeled ligand.
erbB1
VFP
erbB2

Live cell activation by EFF-QDfunction as “single-molecule” multivalent ligands
Binding leads to uptake
No non-specific binding
Binding leads to activation

Internalization of EGF-QD by erbB1-eGFP CHO cells
• Add EGF-QDs during imaging
• Binding of EGF-QDs induces membrane ruffling and EGF-QD-erbB1 internalization

Kinetics of EGF-QD Binding and Internalization
Binding at plasma membrane reaches a steady-state
Internalization continueslinearly with time
Internalization through clathrin coated pits is rate-limiting step.

erbB3-mCitrine A431 cells
• The EGF-QD binds to the endogenous erbB1 and is internalized
• The erbB1-EGF-QD moves down the filopodia
• The erbB3 remains on the cell surface – it is not internalized with the erbB1

A431-erbB1-eGFP
A431-erbB3-mCitrine
0 50 100 150 200 250Intensity Ch2-T1
0
50
100
150
200
250
Intensity Ch3-T2
Absolute Frequency0 50 100 150 200 250
Scatter R egion123
N um ber P ixels55273928120
Area [ µm x µm ]112.748.00165.63
R elative Area [ % ]8.40.612.4
M ean Intensity C h2-T1452781
M ean Intensity C h3-T2132458
Standard D eviation C h2-T113438
Standard D eviation C h3-T23438
C olocalization C oeffic ient C h2-T1
0.595
C olocalization C oeffic ient C h3-T2
0.954
W eighted C oloc. C oeffic ient C h2-T1
0.865
W eighted Coloc. C oeffic ient C h3-T2
0.984
O verlap C oeffic ient
1.0
C orrelation R
0.85
C orre lation R x R
0.72
0 50 100 150 200 250Intensity Ch2-T1
0
50
100
150
200
250
Intensity Ch3-T2
Absolute Frequency0 50 100 150 200 250
Detection of Hetero-associationDoes erbB2 or erbB3 internalize with EGF activation of
erbB1?
High Colocalization
Low Colocalization
Green
Green
Red
Red

CH
O-e
rbB
1-eG
FPA
431-
erbB
1-eG
FPA
431-
erbB
2-m
YFP
A43
1-er
bB3-
mC
itrin
eA
431-
erbB
2-m
YFP
+ 2C
4
VF
Pn
orm
/QD
no
rm
ErbB2, but not ErbB3, co-internalizes with ErbB1 upon EGF activation
Quantification of Hetero-association
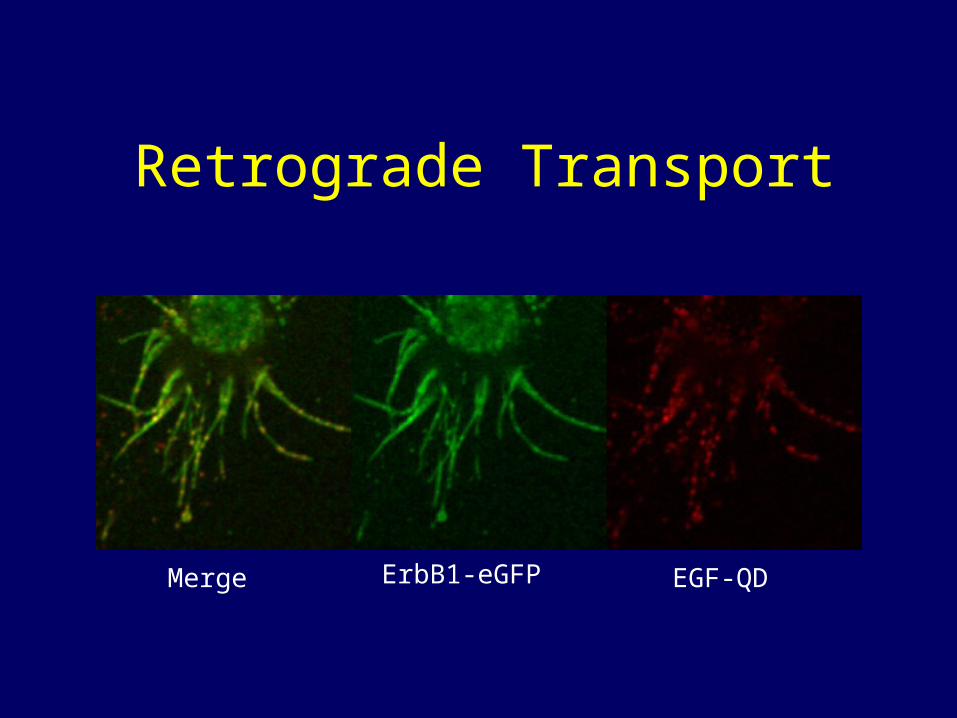
Retrograde Transport
Merge ErbB1-eGFP EGF-QD
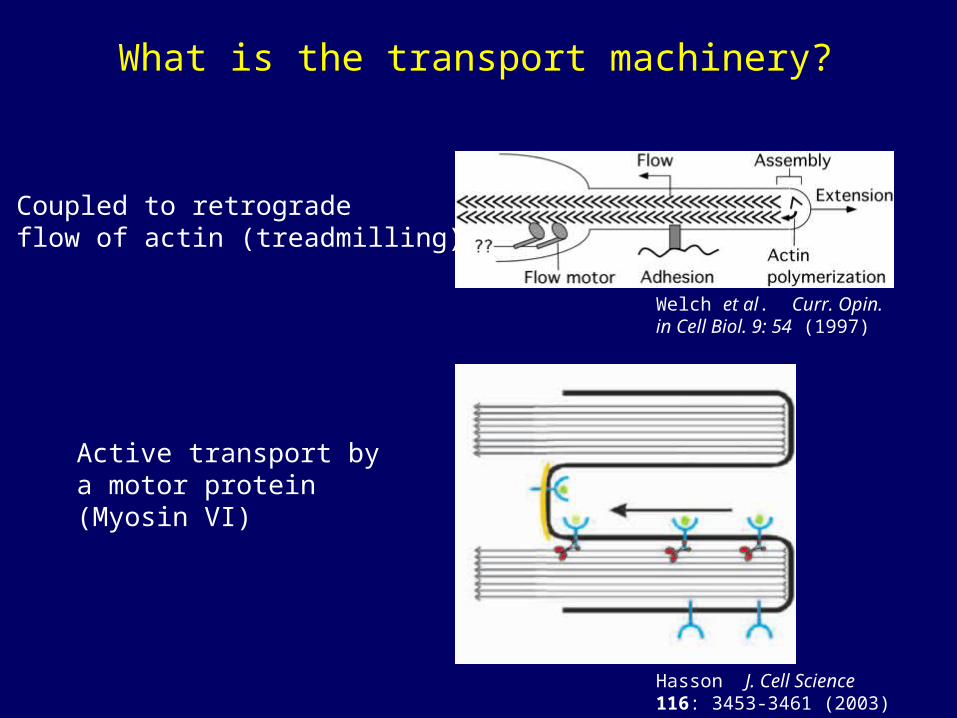
What is the transport machinery?
Coupled to retrogradeflow of actin (treadmilling)
Active transport bya motor protein(Myosin VI)
Hasson J. Cell Science 116: 3453-3461 (2003)
Welch et al. Curr. Opin. in Cell Biol. 9: 54 (1997)

Retrograde Transport
A431 cell expressing erbB1-GFP (green) after addition of EGF-QD (red)

Tracking Retrograde Transport
Track loci over time using the “5D Viewer” (Image J plug-in developed by Dr. Rainer Heintzmann) or Matlab/DIPimage routine, which calculates the center of intensity in a region around the maximum in each time step

Typical MSD plots of QD-EGF-ErbB1 retrograde transport on A431 cells under different conditions
These plots can be fit to determine diffusion coefficients and velocities...
time (s)
MS
D (
pixe
ls2
= 0
.01
µm
2 )
Normal
Nocodazole (microtubule disruption)
Cytochalasin D (actin disruption)
PD153035 (erbB1 kinase inhibitor)
MSD = 4D(Δt) + v2(Δt)2

Isolated EGF-QD-erbB1 complexes do not transport
10 nm
A431 cells expressing erbB1-eGFPRoom temperature5 pM EGF-QDExcess unlabeled EGF added after 300 s
activetransport
diffusion
+EGF

Minimum requirement for transport is a liganded dimer
EGF-QD525 (green) and EGF-QD605 (red) are added simultaneously to A431 cells at room temperature.
One green QD and one red QD are seen to merge and then transport together.
Single molecule sensitivityWhen imaged with a CCD camera.
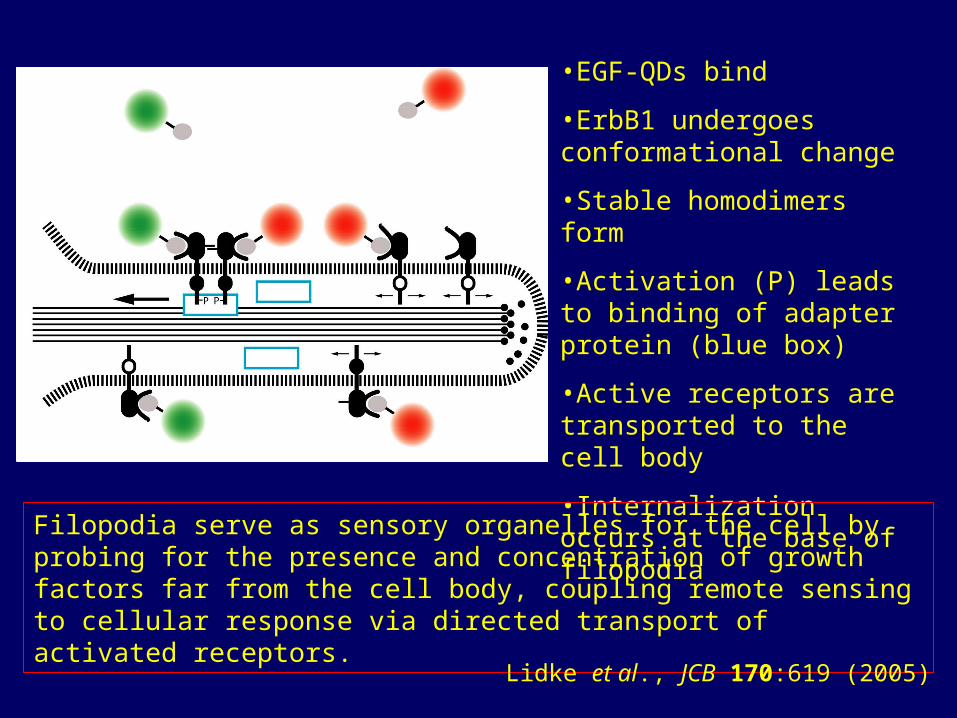
•EGF-QDs bind
•ErbB1 undergoes conformational change
•Stable homodimers form
•Activation (P) leads to binding of adapter protein (blue box)
•Active receptors are transported to the cell body
•Internalization occurs at the base of filopodia
Filopodia serve as sensory organelles for the cell by probing for the presence and concentration of growth factors far from the cell body, coupling remote sensing to cellular response via directed transport of activated receptors.
Lidke et al., JCB 170:619 (2005)

Department of Molecular Biology Max Planck Institute for Biophysical Chemistry
Göttingen, Germany
• Thomas Jovin, Director• Donna Arndt-Jovin, Group Leader• Keith Lidke• Bernd Rieger• Peter Nagy• Janine Post• Rainer Heintzmann


