
Interleukins (IL) : cytokines that are secrected by leukocytes and act upon other leukocytes.

TRACKING LEUKOCYTES IN VIVO WITH SHAPE AND SIZE CONSTRAINED ACTIVE
CONTOURS
Nilanjan Ray1, Scott T. Acton1 and Klaus Ley2
1Department of Electrical and Computer Engineering 2Department of Biomedical Engineering and Cardiovascular Research Center
University of Virginia, Charlottesville VA 22904 Abstract– Inflammatory disease is initiated by leukocytes (white blood cells) rolling along the inner surface lining of small blood vessels called postcapillary venules. Studying the number and velocity of rolling leukocytes is essential to understanding and successfully treating inflammatory diseases. Potential inhibitors of leukocyte recruitment can be screened by leukocyte rolling assays and successful inhibitors validated by intravital microscopy. In this paper we present an active contour or snake-based technique to automatically track the movement of the leukocytes. The novelty of the proposed method lies in the energy functional that constrains the shape and size of the active contour. This paper introduces a significant enhancement over existing gradient-based snakes in the form of a modified gradient vector flow. Using the gradient vector flow, we can track leukocytes rolling at high speeds that are not amenable to tracking with the existing edge-based techniques. We also propose a new energy based implicit sampling method of the points on the active contour that replaces the computationally expensive explicit method. To enhance the performance of this shape and size constrained snake model we have coupled it with Kalman filter, so that during coasting (when the leukocytes are completely occluded or obscured), the tracker may infer the location of the center of the leukocyte. Finally we have compared the performance of the proposed snake tracker with that of the correlation and centroid-based trackers. The proposed snake tracker results in superior performance measures such as reduced error in locating the leukocyte under tracking and improvements in the percentage of frames successfully tracked. For screening and drug validation, the tracker shows promise as an automated data collection tool. Index terms– Video microscopy, cell tracking, active contours, leukocytes, inflammatory disease. Accepted to IEEE Transactions on Medical Imaging, Special Issue on Image Analysis in Drug Discovery and Clinical Trials. This material is based upon work supported in part by the Whitaker Foundation Corresponding Author:
Scott T. Acton Dept. of Electrical and Computer Engineering 351 McCormick Road University of Virginia Charlottesville, Virginia 22904 Phone (434) 982-2003, Fax (434) 924-8818, [email protected]
I. INTRODUCTION Tracking leukocytes in vivo is becoming increasingly important among medical research groups that are studying inflammatory disease [1],[2]. Leukocyte rolling is largely mediated by the selectin family of adhesion molecules with contributions from α4 integrins and β2 integrins [1]. Analysis of leukocyte rolling is an important tool in discovering potential novel anti-inflammatory treatments. For example, E-selectin inhibitors have been shown to reduce the number and increase the velocity of rolling leukocytes in a model of inflammation in living animals [3]. Increased rolling velocity under otherwise identical hemodynamic conditions is indicative of weaker, fewer or shorter-lived bonds between the rolling cell and the endothelial lining of the inflamed blood vessel. Currently the analysis of rolling velocities is laborious and requires tens of hours of user-interactive image processing work after each experiment. Rolling velocity is a key predictor of inflammatory cell recruitment [4]. The most powerful description of leukocyte rolling velocities is a velocity distribution, preferably for hundreds of cells [5]. In addition to its use in intravital microscopy, a robust and automatic tracking algorithm would also expand the scope of flow chamber assays. A flow chamber [6] consists of a transparent parallel-plate apparatus perfused at low Reynolds numbers to match wall shear stresses observed in blood vessels in vivo. The vessel wall is modeled as an isolated protein supporting leukocyte rolling in a planar lipid bilayer [7] or directly immobilized on glass or plastic [8] or by endothelial cells grown on the lower plate of the flow chamber [9]. Centroid trackers are successful at tracking leukocytes rolling on transparent substrata like protein-coated plastic [8], but when rolled over endothelial cells the tracking becomes difficult [10]. This difficulty is due to the structural clutter and obstructions introduced by the optical properties of the endothelial cells. Flow chamber experiments are widely used to screen for compounds that may inhibit leukocyte interaction with inflamed blood vessels. Glycotech, Inc. (Rockville, MD) offers a single-channel flow chamber for such uses in drug screening. More recently high-throughput approaches are being developed by using hydrodynamic focusing (CelTor, Inc., Santa Clara, CA). In these systems, cells are visualized using phase contrast microscopy, a technique that can yield a “bright” or “dark” image of the cell, dependent on the position of the focus of the objective relative to the rolling cell. These and other approaches would benefit from a robust tracking algorithm that can track leukocytes even in the presence of clutter, obstruction and change of focus. The most challenging application is intravital microscopy where

rolling cells are observed in living microvessels (in vivo) under conditions of inflammation. These experiments add motion artifacts to the challenge of image processing, and no currently existing algorithm is successful at tracking rolling leukocytes in vivo. In this paper we present an active contour or snake [11] based tracking of the leukocytes from video sequences. As an example, a portion of a video sequence is shown in Figure 1. The imaging technology and the in vivo experimental setup have been described in [12]. As a result of the mismatch of refractory indices of the rolling cell and the surrounding plasma, contrast/intensity change/reversal occurs quite often in such video sequences. For example a rolling leukocyte appearing bright in one frame might appear dark in a subsequent frame. This is a difficult situation to tackle as both the contrast and the brightness change simultaneously. In such situations it is not even feasible to depend on the illumination invariant statistical moments [13]. So, we pursue an edge-based model here. The model exploits the fact that the cell shapes are approximately circular/elliptic and the scale of the leukocytes does not change significantly during the course of a video sequence. We have adopted an active contour based technique with shape and size constraints on the contour model.
(a) (b) (c)
(d) (e) (f)
Figure 1. (a)-(f) Consecutive image sub-frames from a video sequence showing leukocyte movement in a mouse venule. The contributions of this work are as follows: 1. An energy functional has been designed for shape and size
constraints, and the constraints have been derived through the energy minimization principle for the active contours in terms of geometric primitives such as circles and ellipses from the basic principles of the calculus of variations [14],[15]. We have also shown that these constraints easily fit the conventional contour evolution techniques without any additional computational burden. The motivation behind the inclusion of the geometric primitive-like shape constraint is that the leukocytes are approximately circular or elliptic in shape. It has been shown experimentally that these constraints prove to be quite useful in the tracking application at hand that involves severe image clutter, occlusion and jitter due to the motion of the living specimen.
2. A new energy minimization based technique has been proposed to handle the sampling and re-sampling of the discrete contour points for the shape- and size-constrained model. The proposed sampling technique is implicit in the snake model so that one does not need to explicitly sample the contour under evolution intermittently as is presently done in conventional method of contour evolution. This implicit sampling technique saves an O(n) number of operations that are required in re-sampling explicitly a contour with n points.
3. The existing edge-based active contour tracking poses a limit on the speed of the leukocytes for a given video frame rate. We have introduced a technique by which we can track leukocytes moving at twice the speed previously possible. Starting with the partial differential equation (PDE) based generalized gradient vector flow (GGVF) snake evolution [16],[17], we have shown that adding a Dirichlet type boundary condition [18] on the basic GGVF-PDE makes it possible to increase the maximum speed for successful tracking. This enhancement is particularly suitable for tracking cells that exhibit microbursts in velocity [19].
We compare the performance of tracking with the proposed method to that of centroid [20] and correlation [21],[22] based tracker to show that tracking performance by the proposed method improves upon that of the existing methods. To compute the accuracy of the trackers, the leukocyte positions computed by the automated trackers are compared to the manually determined positions given by a single observer. The organization of the paper is as follows. In Section II we describe the necessary background for an active contour model employed in tracking leukocytes in vivo. We derive Euler equations for different shape-size constrains in the active contour and describe the energy minimization for the sampling of the contour points. In Section III we describe the use of Euler equations for the constraints in the conventional snake evolution paradigm. In Section IV we present certain properties of the proposed snake model with shape/size constraints that are required in the leukocyte tracking application at hand. We also compare these properties with snakes without constraints. In Section V we have discussed two different useful enhancements. In Section VI we illustrate the capability of tracking leukocytes with the proposed snake model coupled with Kalman filtering technique. In Section VII we compare the performance of the proposed snake-based tracker to that of the correlation and centroid tracker. Section VIII concludes this work.
II. BACKGROUND Active contours or snakes are parametric or non-parametric, closed or open curves that can move on the image plane and capture an object boundary [11]. Snakes have been employed for object tracking [23],[24],[25]. Other significant tracking work includes “Kalman snakes” [26] and another more general snake technique that handles non-Gaussian models [27]. Constraints for general shape have been introduced for active contour evolution by Lai and Chin in a statistical framework [28]. In this paper we introduce circularity/elliptic shape and size constraints and incorporate the constraint into an active contour model. The active contour energy is minimized using standard steepest descent method and avoids computationally expensive techniques such as dynamic programming [29]. As an application, we employ a primitive (geometric) shaped snake to track the leukocytes in vivo in venules found in the mouse cremaster (Figure 1).
A. Snake Energy The snake evolution technique centers on minimizing an energy functional (a cost functional) that is defined in terms of
the coordinates of the snake or the active contour and the image data. Minimizing the energy functional, one obtains the snake position that is desirable with respect to the defined constraints. The proposed snake used for tracking leukocytes is a parametric snake [11] with specialized shape constraints tailored to the application at hand. The total energy of the proposed snake can be written as follows:
sampling6pos5size4
shape3ext2int1snake
EEE
EEEE
λλλλλλ
++
+++= (1)
where Eint is the conventional internal energy of the snake, Eext is the external or image energy [11],[16],[17],[30], Eshape, Esize, Epos and Esampling are respectively the shape, size, position and sampling constraints and are defined in the subsequent sections. The non-negative λ terms give the relative strengths of the respective energy components and are selected empirically. The exact weights used in our experiments are given in Section VII. Methods from variational calculus [14],[15] are employed to obtain Euler equations from (1) and then those equations are used to obtain the solution i.e., the contour location.
B. Internal and External Energy For the internal energy of the snake we have chosen the "bending / stretching" energy term as described by Kass et al. [11]. For the external energy we have adopted the GGVF field introduced by Xu and Prince [16],[17]. GGVF snakes have some advantages such as the ability (a) to move the active contour into thin and long object cavities, (b) to attract the active contour towards object edges from a sufficiently large distance and (c) to stop at the weak object edges. Other snakes such as the pressure force snake [31] and the distance potential type snake [32] do not exhibit these desirable properties [16]. In the following subsection we introduce different constraints required for our application.
C. Shape, Size, Position and Sampling Constraints
The leukocytes to be tracked maintain an approximately elliptic shape [10], which is circular in the simplest case. In addition, the leukocytes do not vary significantly in size from image frame to frame in the video sequences. These facts call for certain shape and size constraints on the snake that can be used to capture the cells in each of the frames. In the process of tracking, the cells often are occluded by tissue or by other cells. For this reason we need to predict the cell (leukocyte) center in the frames under coasting (when we have temporarily "lost" the cell). Along with the shape/size constraints we need a predicted position for the snake during coasting, which is embedded in the snake position constraint. As for a comparison, in a previous work by Sato et al. the leukocyte tracking is performed by leukocyte trace determination through the generation of spatiotemporal images by background subtraction, then the broken leukocyte trace is interpolated with valid motion constraint [33], instead here we use the direct motion information (available from tracker) for motion prediction in case of coasting. One important aspect of parametric snake evolution is the discretization of the continuous contour. These discrete points on the snake are called snaxels. During the course of evolution the
snaxels either grow apart or come close to each other. To avoid nonuniform sample spacing, one needs to resample the contour intermittently during the evolution. Unfortunately the re-sampling process represents a significant computational expense (often exceeding that of the snake evolution). We have introduced an active contour model that eliminates the need for the explicit re-sampling and re-parameterization of the snaxels. The resultant addition to the snake energy functional is referred to as the sampling constraint. We now present the shape, size and position constraints in continuous framework. Let us require that the snake is a closed contour characterized by the continuous valued parameter s ∈ [0,1], which is a reasonable assumption for a cell. (Note: the energy functional developed in this paper is not valid for open contours.) A snaxel within this snake has the coordinates (x(s), y(s)). Let us further incorporate a term x that denotes the ensemble of x-coordinates of all the snaxels, i.e., x=[x(s)]T, s ∈ [0,1]. Similarly we use y to denote all the y-coordinates of all the snaxels. We can represent a snake with the compact notation (x, y), and we now proceed to introduce the constraints and the corresponding Euler equations.
D. Shape Constraint Let Eshape specify the energy term for shape constraint. If we utilize a circular shape for the cells, Eshape is expressed as:
( )( )
( )( ) ,2sin),())(,(21
2cos),())(,(21),(
1
0
2
1
0
2shape
∫
∫
−
+−=
dssRsysR
dssRsxsRE
y
x
π
π
yx
yxyx (2)
where Rx(s,x(s)), Ry(s,y(s)) and ),( yxR are defined as:
.))(,())(,(),(
,)()())(,(,)()())(,(
1
0
22
1
0
1
0
∫
∫∫
+=
−=−=
dssysRsxsRR
drrysysysRdrrxsxsxsR
yx
yx
yx
(3)
The energy term (2) penalizes the deviation of the curve from a circle, which has a mean radius ),( yxR and a center at the CM (center of mass) of the curve. The energy functional expressed is indeed amenable to the analysis in a continuous framework given the assumptions of the continuity on the curve, and all the integrands defined in (2) and (3) are continuous and integrable. To obtain the snake position that minimizes the constraint energy (2), we use the calculus of variations [15] and arrive at the following two Euler equations (see Appendix for the derivation):
0,)2sin(),())(,(,0)2cos(),())(,( =−=− sRsysRsRsxsR yx ππ yxyx or equivalently as:
0.)2sin(),()()(
,0)2cos(),()()(
1
0
1
0
=−−
=−−
∫
∫
sRdrrysy
sRdrrxsx
π
π
yx
yx (4)
Solving (4) for x(s) and y(s) one obtains the snake position that
minimizes (2).

E. Size Constraint The shape constraint alone does not adequately describe the leukocytes. We will show experimentally, in a subsequent section, that both the size and the shape constraints are necessary for the tracking application. The size constraint is incorporated as the deviation of the average radius ),( yxR from the initial radius. The energy functional is as follows:
( ) ,),(21),( 2
size KRE −= yxyx (5)
where K is the initial radius and ),( yxR is as defined in (3). The Euler equations that characterize the solution (x,y) to minimize (5) are given below (derivation given in Appendix):
.0))(,())(,(
))()()(),((,0
))(,())(,(
))()()(),((
22
1
0
22
1
0 =+
−−=
+
−− ∫∫sysRsxsR
drrysyKR
sysRsxsR
drrxsxKR
yxyx
yxyx
(6)
F. Elliptic Shape Constraint Using an elliptic shape model results in a more versatile shape model at the cost of a more complicated energy term. An ellipse has an orientation, whereas a circle has no orientation. Here, we do not allow the snake shape to deviate significantly from an ellipse. This naturally gives rise to the following energy functional:
],)2sin()cos())((
)sin())((
)2cos()sin())(()cos())((
21[min),(
2
2
1
0
2
1,,,,ellipse21
dssrcsy
csx
srcsycsx
E
y
x
y
x
RRcc yx
−−−
+−−+
−−−
+−= ∫
θπθθ
θπθθ
θyx (7)
where θ is the orientation of the semi-major axis of the ellipse with the x-axis, r1 and r2 are the two radii of the ellipse, and cx and cy are the center coordinates. So it is clear from the formulation that we penalize the snake if it deviates from the best-fitted ellipse. Now the obvious question arises: how do we compute the best-fitted ellipse? Finding the best-fitted ellipse for a set of data points is a classical problem in pattern recognition and can be handled in a number of ways [34],[35],[36]. A previous work [10] fits ellipse to the edge points (chosen by thresholding the gradient magnitude) in detecting leukocytes in vivo. Instead, we employ the non-iterative, fast, direct least square method of Fitzgibbon et al. [36]. Once we obtain the
values of the intermediate parameters [ 21 ,,,, rrcc yxθ ] as
[*
2
*
1
***,,,, rrcc yxθ ] by the direct least squares technique, the next
task is to obtain Euler equations from the functional (7) and we give them below (see derivation in Appendix):
.0)cos()2sin()sin()2cos()(
,0)sin()2sin()cos()2cos()(***
2***
1*
***2
***1
*
=−−−−−
=−+−−−
θθπθθπθθπθθπ
srsrcsy
srsrcsx
y
x (8)
If r1=r2, i.e. if the ellipse is a circle, then (8) reduces to the already derived equation (4) for circular shapes.
G. Position Constraint As discussed, we want the CM of the evolving snake to be close to a predicted center position (Px, Py). So the deviation of the snake center from this desired center is penalized and hence the contribution to the snake energy functional is:
.)(21)(
21),(
21
0
21
0pos
−+
−= ∫∫ yx PdssyPdssxE yx (9)
And the corresponding Euler equations are as follows (derivation given in Appendix):
.0)(and0)(1
0
1
0
=−=− ∫∫ yx PdssyPdssx (10)
H. Sampling Constraint To implement active contour evolution, one needs to derive the discrete model from the continuous framework of contours. Implementation in the discrete domain is performed by choosing a number of ordered points from the contour, so that these points can approximately represent the entire continuous contour. The continuous parameter s used so far to denote the snake point position (x(s), y(s)) is indexed by i∈ {0,1,…n-1}, with n being the total number of snaxels in the snake. So, we have a discrete contour point or snaxel as (xi, yi). Employing vector notation we can write the snaxel positions collectively as (x, y), where this time for the discrete version, x=[x0,…xn-1]T and y=[y0,…yn-1]T. In general, during the snake evolution, some portion of the snake will be stretched while the other portion will be shortened. So compression as well as rarefaction of the snaxels occurs during evolution. These actions require a resampling of the contour under evolution. This resampling is usually done explicitly by choosing sample points uniformly during the snake evolution [16]. The cost of such explicit sampling is O(n), with n being the number of snaxels. In this paper we propose an implicit sampling technique for the parameterization of contours in contrast to the explicit parameterization method in practice. The idea of implicit parameterization is merely to keep approximately uniform contour sampling along the snake. For the application at hand this is quite suitable as the target shape for the snake is approximately circular/elliptic. So we introduce a term in the energy functional that makes a snaxel maintain equal distance from its immediate left and right neighboring snaxels on the contour. The advantage of such a technique is avoiding the resampling intermittently during snake evolution. The energy functional will now force the snake to maintain proper distance between sampled snaxels. So far we have defined all the energy terms in the continuous framework. Sampling, however, requires the associated energy functional to be defined on a discrete framework. For samples (snaxels) on a circular contour, the ith and (i+1)th snaxel maintain the following relationships:

,1,,0
),)1(2sin()2sin(
),)1(2cos()2cos(
1
1
−=
+−=−
+−=−
+
+
niniR
niRyy
niR
niRxx
ii
ii
K
ππ
ππ
(11)
where R is the average radius of the snake, as already defined in (3). Also, we note that xn=x0 and yn=y0. We now introduce the following energy functional:
( ) ( ) ,21 2
1
1
0
21sampling
yiii
n
i
xiii dyydxxE −−+−−= +
−
=+∑ (12)
where the vectors xid and y
id are shorthand for the right hand sides of (11) and are written as:
).)1(2sin()2sin(
),)1(2cos()2cos(
niR
niRd
niR
niRd
yi
xi
+−=
+−=
ππ
ππ (13)
Equation (12) can be written in the following matrix-vector form:
( ) ( ) ,21
21
21
21 TTTTTT
samplingyyxxyx dddddydxyyxx ++−−+= GGHHE
(14)
where xd and yd are defined as: T
110T
110 ],,,[,],,,[ yn
yyxn
xx dddddd −− == KK yx dd , (15) and H and G are n-by-n matrices as follows:
,
211121
121112
−−−−
−−−−
= OOOH .
1111
1111
−−
−−
= OOOG (16)
The energy is in the quadratic form, so one can now easily obtain the gradient of the energy functional as follows:
( ).,., samplingsamplingyx dydx
yxGHGHEE −−=
∂∂
∂∂=∇ (17)
III. DISCRETIZATION AND IMPLEMENTATION OF THE EULER
EQUATIONS We show that the derived Euler equations for different constraints fit the conventional snake implementation seamlessly. It is indeed an interesting point to note that all the Euler equations derived so far are linear. This is in agreement with the spirit of the original snake evolution equation derived by Kass et al. [11]. This property makes it very easy to incorporate all the constraints stated so far in the conventional snake evolution technique. The steepest descent technique for evolving snakes gives the following equations:
snakett
snakett EE
yyy
xxx
∂∂−=−
∂∂−=− ++ 11 and , (18)
where the superscript t and t+1 denote the successive time steps. Following an implicit or backward time difference discretization
method for numerical stability [18] on (18) one obtains the update or evolution equation as [11],[30]:
)),,(()()),,(()( 1111 tttttttt IAIA yxqyyyxpxx ++=++= −+−+ (19) where (xt, yt) denote n snaxels of the snake at iteration t, I is the n-by-n identity matrix, A is a n-by-n penta-diagonal, positive definite stiffness matrix. For a closed snake it takes the form [30]:
,
=
cbaabbcbaaabcba
abcbaaabcbbaabc
A OOOOO
(20)
and (p(xt,yt),q(xt,yt)) is the external force vector at the snaxel locations (xt,yt) at the tth iteration. The external force is obtained typically from image gradient or GGVF [17]. To incorporate the shape, size and position constraints merely the following changes are made to the snake evolution equation (19): 1. Once the parameter s is indexed by i, (4) can be discretized
for the ith snaxel. As there are n such equation pairs for n snaxels, we can write them out in the matrix-vector form and compute the gradient for the shape constraint energy:
.1,0 where)()(and
1with)]2[sin(and)]2[cos(
,1,1,],,[,],,[
where),,(
22
1
0
1
0
1
0
Shape
−=−+−=
===
====
−−−−=∇
∑
∑∑−
=
−
=
−
=
niyyxxR
Rn
Rn
in
i
yn
yxn
xyyxx
RRE
iii
n
ii
TT
n
ii
n
ii
TT
L
LL
ππ sc
yx
syycxx
By a similar implicit method of discretization as performed obtaining (19) from (18), we incorporate the shape constraint in the snake evolution equation (19) as outlined here − λ3 is added to each of the diagonal elements of A of equation (19),
and ))2cos((*3 niRx πλ + is added to the ith element of p in
equations (19) and ))2sin((*3 niRy πλ + is added to the ith
element of q in equations (19). 2. For the size constraint equations (6),
ii RKRxx /)(*)(*4 −−λ and ii RKRyy /)(*)(*4 −−λ are added to the ith element of p and q respectively.
3. For position constraint equation (10), )(*5 xPx −λ and
)(*5 yPy −λ are added to each of the elements of p and q respectively.
4. The elliptic constraint (8) is incorporated in a similar way – the relative weight of the energy functional λellipse is added to each of the diagonal elements of A of (19),
))sin()2sin()cos()2cos((* ***2
***1
*ellipse θθπθθπλ −−−+
nir
nircx
is added to the ith element of p and
))cos()2sin()sin()2cos((* ***2
***1
*ellipse θθπθθπλ −+−+
nir
nircy
is added to the ith element of q of equation (19). 5. Finally, we incorporate the parameterization energy term
very easily in the snake evolution equation. Equations (17)
(19)
and (18) suggest that we add the matrix λ6H (H defined in (16)) to the positive definite matrix A of (19) following an implicit method of discretization [18]. It is interesting to note that addition of λ6H still leaves A as a positive definite matrix as H itself is a non-negative definite matrix. This guarantees the stability in the matrix inversion involved in the evolution equations (19). Further we add the vector
xdG6λ to the vector p and similarly ydG6λ to q. It is indeed interesting to note that steps 1 through 5 do not change the positive definite property of the matrix (A+I), so that one can invert it by making use of Cholesky decomposition [37] for solving the snake equations (19). Furthermore, as the number of snaxels remains constant during the snake evolution (because of the implicit sampling constraint) the matrix needs to be inverted just one time.
IV. PROPERTIES OF THE PROPOSED SNAKE MODEL
This section describes certain properties of the proposed snake model. These properties prove to be quite useful for the leukocyte tracking application. We start with the comparison with snakes with no shape or size constraints. We also show experimentally that both the shape and the size constraints are necessary for tracking leukocytes. It is also demonstrated that the snake initialization does not have to be very close to the leukocyte boundary to capture the cell.
A. Comparison With Snakes Having No Constraints
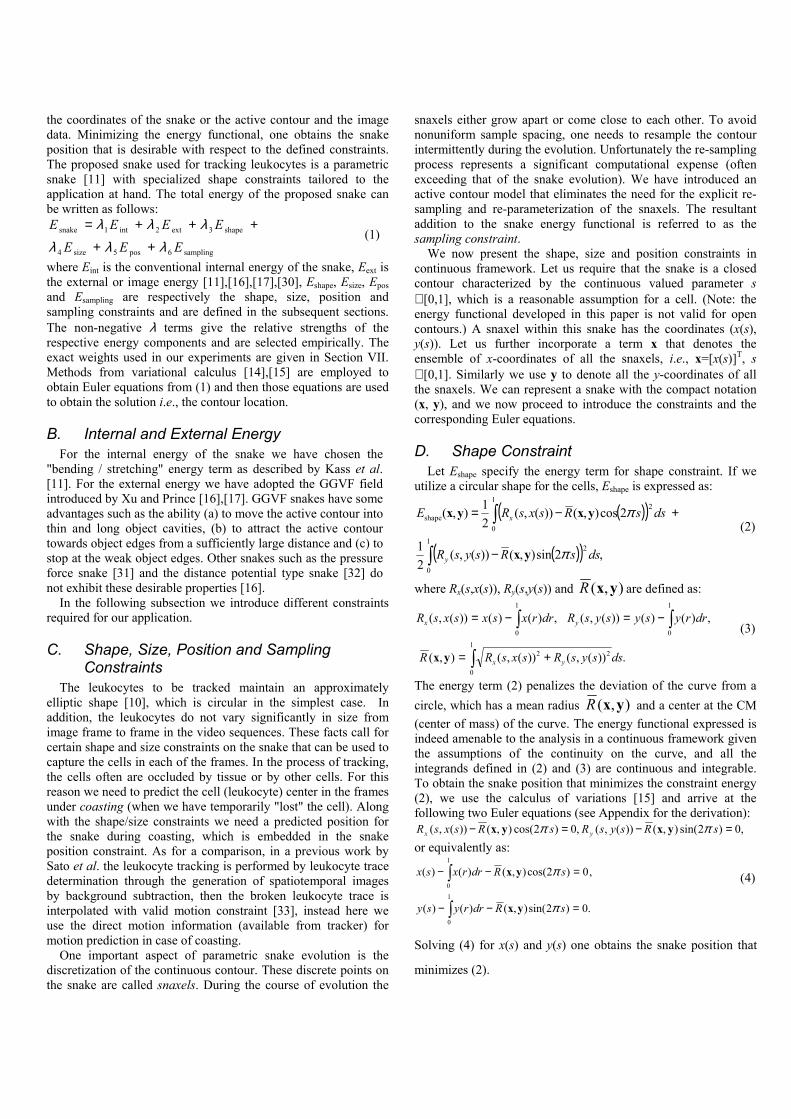
With experimental results, we show here that for the application at hand, the shape and size constraints are requisite. This model makes use of the a priori knowledge about the size and the shape of the leukocytes. Xu and Prince have established that the GGVF type snake outperforms many other kinds of external energy models such as the gradient, pressure force [31] and distance force [32] snakes in capturing objects shapes [16]. So we select (p(xt,yt), q(xt,yt)) appearing in (19) as the GGVF type external force in the proposed snake model. The synthetic experimental results show that the shape and size constraints are very much required in capturing a leukocyte in vivo. Figures 2 and 3 illustrate the potential of the shape and size constraints, respectively, in a synthetic and in a real environment. Figure 2a and 2b, are respectively, the synthetic circle and the occluded circle image. Figure 2c shows that without the constraints the GGVF snake fails to form a round shape from the part of the existing round shape. Figure 2d shows that with shape and size constraints the round shape is correctly recovered. The next set of figures proves the same point in reality. Figure 3a shows several rolling leukocytes in vivo. The GGVF snakes without shape and size constraints cannot recover the cell shape (Figure 3b). On the other hand when coupled with shape and size constraints the cell-shape is correctly recovered (Figure 3c).
(a) (b) (c) (d)
Figures 2. (a) A synthetic circle. (b) The same image showing a portion of the full circle. (c) Result (in white) of GGVF snake evolution on (b). (d) Result (in white) of GGVF snake evolution along with shape and size constraints.
(a) (b) (c)
Figures 3. (a) Leukocytes in vivo. (b) Result of GGVF snake evolution on (a). (c) Result of GGVF snake evolution along with shape and size constraints on (a). The initial and the final snakes are shown in white and black.
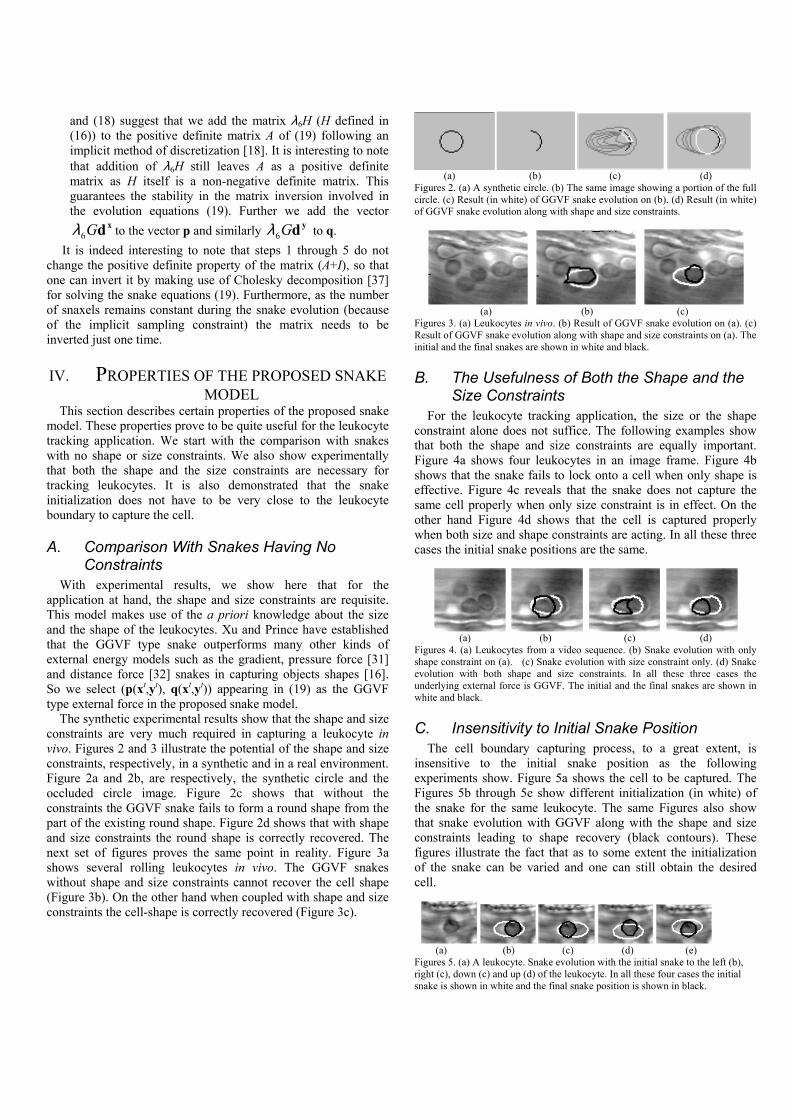
B. The Usefulness of Both the Shape and the Size Constraints
For the leukocyte tracking application, the size or the shape constraint alone does not suffice. The following examples show that both the shape and size constraints are equally important. Figure 4a shows four leukocytes in an image frame. Figure 4b shows that the snake fails to lock onto a cell when only shape is effective. Figure 4c reveals that the snake does not capture the same cell properly when only size constraint is in effect. On the other hand Figure 4d shows that the cell is captured properly when both size and shape constraints are acting. In all these three cases the initial snake positions are the same.
(a) (b) (c) (d)
Figures 4. (a) Leukocytes from a video sequence. (b) Snake evolution with only shape constraint on (a). (c) Snake evolution with size constraint only. (d) Snake evolution with both shape and size constraints. In all these three cases the underlying external force is GGVF. The initial and the final snakes are shown in white and black.
C. Insensitivity to Initial Snake Position The cell boundary capturing process, to a great extent, is insensitive to the initial snake position as the following experiments show. Figure 5a shows the cell to be captured. The Figures 5b through 5e show different initialization (in white) of the snake for the same leukocyte. The same Figures also show that snake evolution with GGVF along with the shape and size constraints leading to shape recovery (black contours). These figures illustrate the fact that as to some extent the initialization of the snake can be varied and one can still obtain the desired cell.
(a) (b) (c) (d) (e)
Figures 5. (a) A leukocyte. Snake evolution with the initial snake to the left (b), right (c), down (c) and up (d) of the leukocyte. In all these four cases the initial snake is shown in white and the final snake position is shown in black.

V. ENHANCEMENTS Certain enhancements prove to be quite useful for the application of tracking leukocytes in vivo. This section describes the techniques that aid in the capture of leukocyte boundaries.
A. Multistage Snake Evolution Approach Figure 6a demonstrates the failure of the snake to capture the cell when the initial snake is away from the actual boundary. The evolution sequence (with initial contours shown in white in Figure 6a) shows that final evolved circle is formed near the initial contour CM. This bias towards the initial CM can be overcome by a multistage snake evolution. In the multistage snake evolution process, the snake is evolved in the first stage according to the GGVF forces. After the snake evolution in the first stage, the snake clings to the object boundary and possibly to some clutter. In the next stage, the relative weights for the shape and size constraints are increased. In summary the multistage algorithm for an image frame may be stated as follows: Step 1: Compute GGVF field for the current frame within a window around the center of the cell in the previous frame. Step 2 (stage one): Eliminate shape and size constraint from the snake model and evolve the snake only using the GGVF field until convergence. Step 3: Reinstate the shape and the size constraint in the snake model and evolve the snake on the GGVF field until convergence starting from the snake position obtained at the end of Step 2. Step 4: Increase the shape and size weight in the snake model and evolve the snake until convergence on the GGVF force field starting from the position obtained at the end of Step 3. The effectiveness of the approach is illustrated in Figure 6. In Figure 6b, the snake starts with the same initial condition as in Figure 6a shown in white. Figure 6b also shows the end of stage 1 in black. In Figure 6c the start (white) and end (black) of second stage evolution is shown where the snake starts with its position taken from Figure 6b. Similarly in Figure 6d, the third and final stage of evolution result is shown. We now observe in Figure 6d that the snake has correctly locked onto the cell, as shown by the black contour.
(a) (b) (c) (d) Figures 6. (a) Evolving a snake on Figure 5a with final and initial snakes shown in black and white colors respectively. (b) After Step 2 of multi-stage snake evolution. (c) After Step 3. (d) After Step 4.
B. Increasing the Maximum Allowed Speed of Cells in Tracking
We have chosen GGVF [16] as the external force for the snake based tracking, as GGVF allows the initial contour position to deviate from the cell edge position. One of the shortcomings of the GGVF external force is that unless the initial snake includes
the medial axis of the object, the snake does not capture the object [38]. Figure 7(a) shows the initial snake (white circular contour) and a synthetic rolling leukocyte (solid black) with an arrow giving the direction of the cell movement. Corresponding to this cell the GGVF force is shown in the Figure 7(b). We notice that the GGVF is directed towards the boundary of the synthetic cell. If the initial snake does not contain the medial axis, which, in this case, is the center of the circle (as in Figure 7(b)), the external force field will force the snake to collapse on one side of the cell boundary.
(a) (b)
Figure 7. (a) Maximum frame-to-frame displacement of a leukocyte under GGVF snake tracking. (b) The GGVF field. A common practice in active contour based tracking is to use the position of the captured object from the previous frame as the initial snake for the subsequent frame [27]. So if one uses GGVF for the external force in object edge-based tracking with this initialization strategy, then the maximum cell movement from one frame to the next frame is less than the radius of the leukocyte. Beyond this maximum displacement the GGVF snake will fail to capture the object. To overcome this difficulty we have imposed a Dirichlet type boundary condition (BC) on the GGVF-PDE. Let the region be bounded by the initial snake, C with boundary, ∂C and let the rectangular image domain be D, with boundary ∂D. If the estimated leukocyte center velocity direction is v then the GGVF-PDE along with our proposed BC can be written as follows:
( )( ) ,),(when,),(),,(
,),(when,),(),,(
)(),(
0)),())(/exp(1(
),()/exp(
,0)),())(/exp(1(
),()/exp(
2
2
DyxyxvyxuCyxyxvyxu
CDyx
yfyxvkf
yxvkfxfyxukf
yxukf
∂∈=∂∈=
−∈
=∂∂−∇−−
−∇∇−
=∂∂−∇−−
−∇∇−
0v
(21)
where (u,v) is the GGVF field to be solved from (21), f is the edgemap for the image I [16]: If ∇= , k is a positive parameter controlling the smoothness [17]. Adding the boundary condition based on the initial position of the snake to the PDE makes it possible to capture the cell in cases where the initial snake that does not encompass the cell center. In doing so, we assume that the size of the leukocyte does not significantly decrease from frame to frame, as this condition could lead to missing a smaller cell that is contained inside the initial snake. A synthetic example is given in Figure 8(a), showing a synthetic cell (solid black), an initial snake (white circular contour) and the direction of cell movement. Figure 8(b) shows the corresponding GGVF obtained from (21). As seen in Figure 8(b), the force field directs the snake towards the cell

boundary. Figure 9 illustrates the efficacy of this Dirichlet type BC on capturing the leukocyte in an in vivo image.
(a) (b) Figure 8. (a). Maximum displacement in tracking with the proposed BC. (b) Corresponding external force field.
(a) (b)
Figure 9. (a) GGVF snake is drifting away from the cell and getting stuck in clutter. (b) The snake with Dirichlet BC is approaching and capturing the leukocyte (b). In both these cases, the initial snake positions are the same, the initial and the final positions are shown in black and the intermediate positions are shown in gray.
VI. METHODS: TRACKING LEUKOCYTES IN VIVO
We now give the procedure for tracking leukocytes in vivo with the proposed snake. In a given frame of a video sequence, a user selects a leukocyte he/she wishes to track over the rest of the sequence. This is the only point where the user interaction is required. Experimentally, for most leukocytes, if the user-selected center is within 3-4 pixels of the actual leukocyte center then the snake captures the leukocyte correctly. The user actually places a small circular contour (typically a circle with half the cell radius) on the leukocyte to be tracked. This initial contour is then allowed to evolve on the first image frame with the elliptic or circular shape and size constraints. In addition for capturing the leukocyte in the first frame an enhanced GGVF as described in Section V is utilized. This time the GGVF is obtained by setting the Dirichlet BC as the unit outward normal to the initial contour. This makes the tracking procedure quite robust to the initial user interaction, as the initial contour placed by the user does not necessarily have to include the cell center; instead the initial contour should only be within the leukocyte boundary [38]. In the next frame we use this computed snake position for initialization. However, from the second frame onwards for a fast rolling leukocyte the velocity direction becomes the Dirichlet BC as described previously. The rolling leukocytes often are occluded for a number reasons. For a few frames, the cell may be hidden under other leukocytes and tissue structures, or it may leave the focal plane. Given possible occlusion and given that there are other cells/clutter present near the rolling leukocyte being tracked, the snake may encompass the incorrect object. So we need to validate the resultant snake on each frame. Such a validation technique
has another very important use. The proposed method utilizes gradient descent and thus can become locked onto the local minima in the energy functional. These suboptimal solutions may, in some cases, correspond to false acquisition of leukocytes. We employ a straightforward technique for the purpose of validation: matching the shape of the present snake with that of the snake on the previous frame. Our experiments have shown that for the particular application at hand, graylevel matching/correlation fails as the cells and the surrounding have similar graylevel values. There is another technical difficulty with graylevel matching for this particular application. As the change in refractive index between the surrounding flow and the cells is being used to encode the graylevel, a cell may transform from brighter to darker in appearance or vice-versa instantaneously. Such changes render graylevel correlation ineffective. We use “shape correlation” between a shape template and the acquired active contour. The shape template is formed from the shape of the snake that encompasses the cell in the previous frame. Let (x, y) denote the evolved snake position in the previous frame. We can draw a closed polygon on a plane with (x,y), which results in a binary image. The shape template is simply the gradient of this binary image. So the shape template is a vector, not a scalar, template. We correlate the normalized (unit magnitude) GGVF field of the current frame with the shape template. For example, Figure 10a shows a leukocyte, and Figure 10b shows the snake from the previous frame overlaid on the image of Figure 10a. The shape template for the overlaid snake is shown in Figure 10c. Figure 10d reveals the normalized GGVF field arising from Figure 10a that is to be correlated with the shape template.
(a) (b)
0 5 10 15 20 25
5
0
5
0
5 (c) (d)
Figure 10. (a) A leukocyte from a video sequence. (b) The same leukocyte with the snake from previous frame overlaid. (c) Shape template corresponding to the overlaid snake of (b). (d) GGVF of (a).
(a) (b) (c) (d)
(e) (f) (g)
Figure 11. (a)-(g). A video sequence showing seven frames. In each frame white contour is the initial snake and black contour is the final snake or the captured leukocyte. This is an example where the snake tracks a partially occluded cell.

(a) (b) (c)
(d) (e)
Figure 12: A video sequence. (a) Normal tracking; (b) coasting starts; (c) coasting continues; (d) coasting terminates. (e) The snake re-acquires the cell after coasting. White and black contours show initial and final snakes, respectively, in each frame. Dotted lines depict coasting. In the example shown in Fig. 11, we demonstrate that the proposed snake can track a partially occluded rolling leukocyte. Here, the shape and size constraints facilitate the inference of an occluded cell boundary. Another implementation concern in tracking is the coasting phase. If a cell coasts for quite a few frames, then the snake may finally lose track. To tackle this situation we utilize of a Kalman filter [39]. The filter that is employed here uses the constant velocity assumption. In case of coasting, the Kalman filter predicts the snake position in the next frame. We place the previous snake in the next frame as predicted by the Kalman filter. Kalman filter gains are experimentally set for the leukocyte tracking application by means of extensive training on such sequences. A coasting example is shown in Figures 12a through 12e, where the effectiveness of the Kalman filter is demonstrated. The leukocyte observed here coasts for three consecutive frames. Dotted black contours show coasting, and solid black contours show that the snake has locked onto the cell when it is no more coasting. Once coasting commences, we want CM of the final snake not to be much deviated from the position predicted by the Kalman filter. So, the position constraint is used here.
VII. TRACKING RESULTS
In this section we give the results of tracking with the proposed shape/size constrained snake model. We also compare these results with correlation and centroid trackers. To compute the error in tracking we utilize interactively determined cell positions. Next we apply all three trackers on the same video sequences to track the same cell and compare to the stored cell center positions. The video frames were recorded at a spatial resolution of 320x240 pixels (where the pixel-to-micron ratio is 3.11 pixels/micron in the horizontal direction and 3.10 pixels/micron in the vertical direction) and a temporal resolution of 30 frames per second. No preprocessing was performed on the frames before tracking. We provide two types of error measures for tracking: 1. Root mean square error (RMSE) of the tracked cell center
positions in microns. The RMSE is computed over all the frames in a tracking video sequence. Manually determined cell positions are used to compute the position error.
2. Percentage of frames tracked. If a computed cell center is within one cell radius of the manually observed cell center,
then we consider that frame as "tracked." The percentage is computed as the ratio of number of frames tracked to the total number of frames in the sequence.
Figure 13. Comparison of the position RMSE’s in tracking the treated vessel sequences with the three trackers.
Figure 14. Comparison of the percentages of frames tracked in the treated sequences.
We have tracked two types of sequences – TNF-α-treated and untreated sequences. The sequences with TNF-α treated vessels exhibit slower rolling (slower cell velocities). The untreated vessels contain leukocytes rolling rapidly (up to 100µm/s) and are thus more challenging to track. These sequences are 31 to 167 frames in duration at 30 frames per second. We set a maximum number of frames based on the maximum cell velocity and the available field of view. Our experience shows that typical rolling leukocytes that are not adherent are visible for 1 to 3 s with a fixed field of view of approximately 100µm in width. The values of the weight parameters used in (1) for the experiments are set as: 01 =λ , 22 =λ , 43 =λ , 44 =λ , 2.05 =λ , 106 =λ . Figure 13 shows the comparison of RMSE in all three methods on 16 treated video sequences. RMSE values with snake tracker are seen to be quite low compared to the RMSE with the other two trackers. Figure 14 shows the percentage of frames tracked in the 16 treated vessel sequences. The snake tracker is seen to have tracked 100% of the frames in all but one sequence where the resulting percentage is 98.89%. Our current implementation requires a maximum of 1 s per video frame in computational expense using a 1.5 GHz, Pentium IV PC.
Figure 15. Position RMSE in sequences obtained from untreated venules.
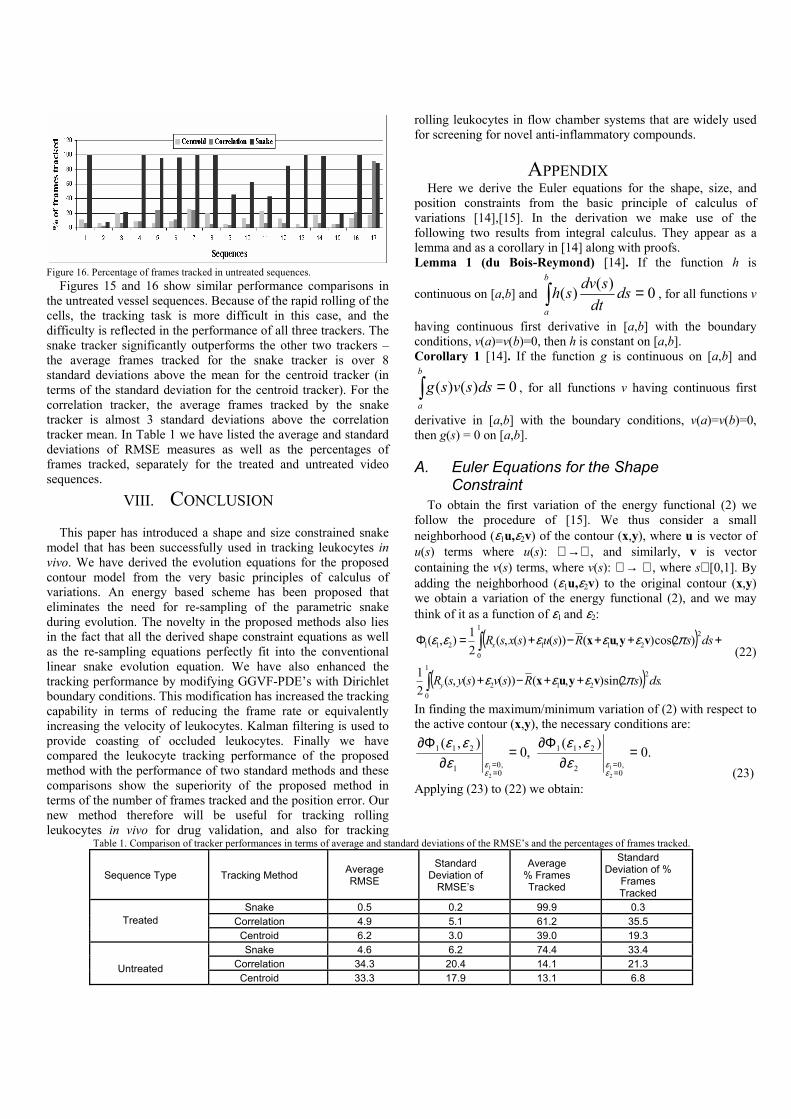
Figure 16. Percentage of frames tracked in untreated sequences. Figures 15 and 16 show similar performance comparisons in the untreated vessel sequences. Because of the rapid rolling of the cells, the tracking task is more difficult in this case, and the difficulty is reflected in the performance of all three trackers. The snake tracker significantly outperforms the other two trackers – the average frames tracked for the snake tracker is over 8 standard deviations above the mean for the centroid tracker (in terms of the standard deviation for the centroid tracker). For the correlation tracker, the average frames tracked by the snake tracker is almost 3 standard deviations above the correlation tracker mean. In Table 1 we have listed the average and standard deviations of RMSE measures as well as the percentages of frames tracked, separately for the treated and untreated video sequences.
VIII. CONCLUSION This paper has introduced a shape and size constrained snake model that has been successfully used in tracking leukocytes in vivo. We have derived the evolution equations for the proposed contour model from the very basic principles of calculus of variations. An energy based scheme has been proposed that eliminates the need for re-sampling of the parametric snake during evolution. The novelty in the proposed methods also lies in the fact that all the derived shape constraint equations as well as the re-sampling equations perfectly fit into the conventional linear snake evolution equation. We have also enhanced the tracking performance by modifying GGVF-PDE’s with Dirichlet boundary conditions. This modification has increased the tracking capability in terms of reducing the frame rate or equivalently increasing the velocity of leukocytes. Kalman filtering is used to provide coasting of occluded leukocytes. Finally we have compared the leukocyte tracking performance of the proposed method with the performance of two standard methods and these comparisons show the superiority of the proposed method in terms of the number of frames tracked and the position error. Our new method therefore will be useful for tracking rolling leukocytes in vivo for drug validation, and also for tracking
rolling leukocytes in flow chamber systems that are widely used for screening for novel anti-inflammatory compounds.
APPENDIX Here we derive the Euler equations for the shape, size, and position constraints from the basic principle of calculus of variations [14],[15]. In the derivation we make use of the following two results from integral calculus. They appear as a lemma and as a corollary in [14] along with proofs. Lemma 1 (du Bois-Reymond) [14]. If the function h is
continuous on [a,b] and 0)()( =∫b
a
dsdt
sdvsh , for all functions v
having continuous first derivative in [a,b] with the boundary conditions, v(a)=v(b)=0, then h is constant on [a,b]. Corollary 1 [14]. If the function g is continuous on [a,b] and
0)()( =∫b
a
dssvsg , for all functions v having continuous first
derivative in [a,b] with the boundary conditions, v(a)=v(b)=0, then g(s) = 0 on [a,b].
A. Euler Equations for the Shape Constraint
To obtain the first variation of the energy functional (2) we follow the procedure of [15]. We thus consider a small neighborhood (ε1u,ε2v) of the contour (x,y), where u is vector of u(s) terms where u(s): ℜ→ℜ , and similarly, v is vector containing the v(s) terms, where v(s): ℜ→ ℜ , where s∈ [0,1]. By adding the neighborhood (ε1u,ε2v) to the original contour (x,y) we obtain a variation of the energy functional (2), and we may think of it as a function of ε1 and ε2:
( )
( ) .)2sin(),())()(,(21
)2cos(),())()(,(21),(
1
0
2212
1
0
2211211
∫
∫
++−+
+++−+=Φ
dssRsvsysR
dssRsusxsR
y
x
πεεε
πεεεεε
vyux
vyux
(22)
In finding the maximum/minimum variation of (2) with respect to the active contour (x,y), the necessary conditions are:
.0),(
,0),(
0,02
211
0,01
211
21
21
=∂
Φ∂=
∂Φ∂
==
==
εε
εε ε
εεε
εε
(23)
Applying (23) to (22) we obtain:
Table 1. Comparison of tracker performances in terms of average and standard deviations of the RMSE’s and the percentages of frames tracked.
Sequence Type Tracking Method Average RMSE
Standard Deviation of
RMSE’s
Average % Frames Tracked
Standard Deviation of %
Frames Tracked
Snake 0.5 0.2 99.9 0.3 Correlation 4.9 5.1 61.2 35.5 Treated Centroid 6.2 3.0 39.0 19.3 Snake 4.6 6.2 74.4 33.4
Correlation 34.3 20.4 14.1 21.3 Untreated Centroid 33.3 17.9 13.1 6.8

( )
[ ]
[ ] )},)2sin()2sin(),())(,(
)2cos()2cos(),())(,((
)),({()()2cos(),())(,(0
1
0
1
0
0,01
211
021
∫
∫
∫
−
+−
∂++∂−−=
==
dsssRsysR
dsssRsysR
RdsdsdwsRsxsR
y
y
x
ππ
ππ
εεεπ
εε
yx
yx
vyuxyx
(24)
where the function w(s) is defined via
constant.)()()(,)()()( 1
00
1
0
+−=−= ∫∫∫ drrusdrruswdrrusuds
sdw s (25)
To obtain the Euler equations, we first prove that the sum of 2nd and the 3rd integrals in (24) is zero. Let us rewrite ),( yxR as
,))(),(,(),(1
0∫= dssysxsRR yx where R(s,x(s),y(s)) is defined by
))(,())(,())(),(,( 22 sysRsxsRsysxsR xx += or equivalently by
)2cos())(),(,())(,( ssysxsRsxsRx π= and
)2sin())(),(,())(,( ssysxsRsysRy π= .
With this redefinition, the sum of the last two integrals of (24) can be written as:
.0),())(),(,(
)2(sin)),())(),(,((
)2(cos)),())(),(,((
1
0
1
0
2
1
0
2
=−
=−
+−
∫
∫
∫
yx
yx
yx
RdssysxsR
dssRsysxsR
dssRsysxsR
π
π
So equation (24) takes a simplified form: ( ) .0)()2cos(),())(,(
1
0
=−∫ dsdsdwsRsxsRx πyx (26)
At this point we are able to apply Lemma 1 to (26) if we let )2cos(),())(,()( sRsxsRsh x πyx−= and )()( swsv =
provided the function w(s) meets the prescribed conditions in the Lemma 1. (25) indeed suggests that w(s) is continuous and WLOG: .0)1()0( == ww Thus we apply Lemma 1 to find that
)2cos(),())(,( sRsxsRx πyx− is a constant, yielding the first Euler equation in (4). The second equation in (4) is found in a similar way.
B. Euler Equations for the Size Constraint To obtain the Euler equation for equation (5) we proceed the same way as we have done before for the shape constraint. Considering the variation of the contour (x,y) in a small neighborhood characterized by (ε1u,ε2v), we derive a new function of ε1 and ε2 as,
( ) ( )KR −++=Φ ),(21, 21212 vyux εεεε (27)
Applying a similar strategy, the necessary conditions for obtaining Euler equations are
.0),(,0),(
0,02
212
0,01
212
21
21
=∂
Φ∂=
∂Φ∂
==
==
εε
εε ε
εεε
εε (28)
Now applying (28) to (27) one finds that
( ) ( ) .),(
),(,
0,01
21
0,01
212
21
21
==
== ∂
++∂−=
∂Φ∂
εε
εε ε
εεε
εε vyuxyx
RKR (29)
From (29) we find that
,))()(,())()(,(
)())()(,(),( 1
0 22
12
1
1
21 dssvsysRsusxsR
dssdwsusxsRR
yx
x
∫ +++
+=
∂++∂
εε
ε
εεε vyux (30)
where all terms in (30) are already defined in (3) and (25). Finally imposing the conditions ε1=0 and ε2=0, we obtain
.))(,())(,(
)())(,(),( 1
022
0,01
21
21
dssysRsxsR
dssdwsxsRR
yx
x
∫ +=
∂++∂
==
εεε
εε vyux (31)
Now substituting (31) into (29) we obtain
( ) ( ) ).))(,())(,(
)())(,((),(, 1
022
0,01
212
21
dssysRsxsR
dssdwsxsR
KRyx
x
∫ +−=
∂Φ∂
==
yxεεε
εε (32)
At this point by applying Lemma 1 we can obtain one Euler equation. The other Euler equation is derived in a similar way to complete (6).
C. Euler Equations for the Elliptic Shape constraint
For the derivation of the Euler equations of (7) we form the following new function taking into account the variation of the contour (x, y) in a small neighborhood characterized by (ε1u, ε2v):
.])2sin()cos()(
)sin()(
)2cos()sin()(
)cos()(21),(
2
**2
**2
**1
1
0
2
**1
**2
**1
214
dssrcvy
cux
srcvy
cux
y
x
y
x
−−−+
+−+−
+
−−−+
+−+=Φ ∫
θπθεθε
θπθεθε
εε (33)
As before, the necessary conditions for the existence of extrema are as follows:
.0),(,0),(
0,02
214
0,01
214
21
21
=∂
Φ∂=
∂Φ∂
==
==
εε
εε ε
εεε
εε (34)
Applying condition (34) on (33), we obtain the two Euler equations in (8).
D. Euler Equations for the Position Constraint Applying the same kind of variation on (9) we compute a function of ε1 and ε2 as before:
( ) .)()(21)()(
21,
21
02
21
01213
−++
−+=Φ ∫∫ yx PdssvsyPdssusx εεεε
(27)

(35)
For an extremum, the necessary conditions are:
.0),(
,0),(
0,02
213
0,01
213
21
21
=∂
Φ∂=
∂Φ∂
==
==
εε
εε ε
εεε
εε (36)
Applying (36) on (35) we obtain:
.0))()()((),(
,0))()()((),(
1
0
1
00,02
213
1
0
1
00,01
213
21
21
=−=∂
Φ∂
=−=∂
Φ∂
∫∫
∫∫
==
==
dssvPdssy
dssuPdssx
y
x
εε
εε
εεε
εεε
(37)
The application of Corollary 1 to (37) leads to the Euler equations in (10).
REFERENCES
[1] K. Ley, “Leukocyte recruitment as seen by intravital microscopy,” In Physiology of Inflammation. K. Ley, ed., New York: Oxford University Press, pp. 303-337, 2001.
[2] N. Manjunath, P. Shankar, B. Stockton, P.D. Dubey, J. Lieberman, U.H. von Andrian, “A transgenic mouse model to analyze CD8+ effector T cell differentiation in vivo,” Proceedings of the National Academy of Sciences USA, vol. 96, pp. 13932-13937, 1999.
[3] K.E. Norman, G.P. Anderson, H.C. Kolb, K. Ley, B. Ernst, “Sialyl Lewisx (sLex) and an sLex mimetic, CGP69669A, disrupt E-selectin-dependent leukocyte rolling in vivo,” Blood, vol. 91(2), pp. 475-83, 1998.
[4] U. Jung, K.E. Norman, C.L. Ramos, K. Scharffetter-Kochanek, A.L. Beaudet, K. Ley, “Transit time of leukocytes rolling through venules controls cytokine-induced inflammatory cell recruitment in vivo,” J. Clin. Invest., vol. 102, pp. 1526-1533, 1998.
[5] K. Ley, D. Vestweber, eds., The selectins: Initiators of leukocyte endothelial adhesion. Amsterdam, The Netherlands: Harwood Academic Publishers, pp. 63-104, 1997.
[6] M.B. Lawrence, L.V. McIntire, S.G. Eskin, “Effect of flow on polymorphonuclear leukocyte/endothelial cell adhesion,” Blood, vol. 70, pp. 1284-90, 1987.
[7] M.B. Lawrence, T.A. Springer, “Leukocytes roll on a selectin at physiologic flow rates: Distinction from and prerequisite for adhesion through integrins,” Cell, vol. 65, pp. 859-73, 1991.
[8] J.A. DiVietro, M.J. Smith, B.R. Smith, L. Petruzzelli, R.S. Larson, M.B. Lawrence, “Immobilized IL-8 triggers progressive activation of neutrophils rolling in vitro on P-selectin and intercellular adhesion molecule-1,” J. Immunol., vol. 167, pp. 4017-4025, 2001.
[9] F.W. Luscinskas, G.S. Kansas, H. Ding, P. Pizcueta, B. Schleiffenbaum, T.F. Tedder, M.A. Gimbrone Jr., “Monocyte rolling, arrest and spreading on IL-4-activated vascular endothelium under flow is mediated via sequential action of L-selectin, β1-integrins, and β2-integrins,” J. Cell Biol., vol.125, pp. 1417-1427, 1994.
[10] M. Egmont-Petersen, U. Schreiner, S.C. Tromp, T. Lehmann, D.W. Slaaf, T. Arts, “Detection of leukocytes in contact with the vessel wall from in vivo microscope recordings using a neural network,” IEEE Transactions on Biomedical Engineering, vol. 47, pp.941-951, 2000.
[11] M. Kass, A. Witkin and D. Terzopoulos, “Snakes: Active contour models,” International Journal of Computer Vision, pp. 321-331, 1987.
[12] E. J. Kunkel, and K. Ley, “Distinct phenotype of E-selectin deficient mice: E-selectin is required for slow leukocyte rolling in vivo,” Circ. Res., vol.79, pp. 1196-1204, 1996.
[13] M. Sonka, V. Hlavac, R. Boyle, Image processing, analysis, and machine vision, 2nd ed., PWS Publishing, Pacific Grove, 1999.
[14] J.L. Troutman, Variational calculus with elementary convexity, New York: Springer-Verlag, 1983.
[15] R. Courant and D. Hilbert, Methods of mathematics physics, vol. 1, New York: Interscience Publishers, Inc., 1953.
[16] C. Xu and J.L. Prince, “Snakes, shapes, and gradient vector flow,” IEEE Trans. Image Processing vol. 7, pp. 359-369, 1998.
[17] C. Xu and J.L. Prince, “Generalized gradient vector flow external force for active contours,” Signal Processing, vol. 71, pp. 131-139, 1998.
[18] C.A. Hall and T.A. Porsching, Numerical analysis of partial differential equations. Englewood Cliffs, New Jersey: Prentice Hall, Inc., 1990.
[19] A. Hafezi-Moghadam and K. Ley, “Relevance of L-selectin shedding for leukocyte rolling in vivo,” J. Exp. Med., vol. 189, pp. 939-948, 1999.
[20] R.N. Ghosh and W.W. Webb, “Automated detection and tracking of individual and clustered cell surface low density lipoprotein receptor molecules,” Biophysical Journal, vol. 66, pp.1301-1318, 1994.
[21] G.J. Schütz, H. Schindler, and Th. Schmidt, “Single-molecule microscopy on model membranes reveals anomalous diffusion,” Biophysical Journal, vol. 73, pp.1073-1080, 1997.
[22] C.M. Anderson, G.N. Georgiou, I.E.G. Morrison, G.V.W. Stevenson, and R.J. Cherry, “Tracking of cell surface receptors by fluorescence digital imaging microscopy using a charge-coupled device camera,” Journal of Cell Science, vol.101, pp.415-425, 1992.
[23] F. Leymarie and M.D. Levine, “Tracking deformable objects in the plane using an active contour model,” IEEE Trans. on Pat. Ana. Mach. Intell., vol. 15, pp. 617-634,1993.
[24] S. Logbregt and M. A. Viergever, “A discrete dynamic contour model,” IEEE Transactions on Medical Imaging, vol. 14, pp.12-14, 1995.
[25] C. Vieren, F. Cabestaing, and J.-G. Postaire, “Catching moving objects with snakes for motion tracking,” Pattern Recognition Letters, vol. 16, pp. 679-685, 1995.
[26] D. Terzopolous and R. Szeliski, “Tracking with kalman snakes,” in Active Vision, A. Blake and A. Yuille, Eds. Cambride, MA: MIT Press, pp. 3-20, 1992.
[27] A. Blake and M. Isard, Active contours: The application of techniques from graphics, vision, control theory and statistics to visual tracking of shapes in motion. Berlin: Springer-Verlag, 1998.
[28] K.F. Lai and R.T. Chin, “Deformable contours: Modeling and extraction,” Int. Conf. Vis. Patt. Recog, pp. 601-608, 1994.
[29] A.A. Amini, T.E. Weymouth and R.C. Jain, “Using dynamic programming for solving variational problems in vision,” IEEE Trans. PAMI, vol. 12, no. 9, pp. 855-867, 1990.
[30] N. Ray, B. Chanda and J. Das, “A fast and flexible multiresolution snake with a definite termination criterion,” Pattern Recognition, vol. 34, pp. 1483-1490, 2001.
[31] L.D. Cohen, “On active contour models and balloons.” CVGIP: Image Understanding, vol. 53, pp. 211-218, 1991.
[32] L.D. Cohen and I. Cohen, “Finite-element methods for active contour models and balloons for 2-D and 3-D images,” IEEE Trans. on Pattern Analysis and Machine Intelligence, vol. 15, no. 11, pp. 359-369, 1993.
[33] Y. Sato, J.Chen, R.A. Zoroofi, N. Harada, S. Tamura, and T. Shiga, “Automatic extraction and measurement of leukocyte motion in microvessels using spatiotemporal image analysis,” IEEE Transactions on Biomedical Engineering, vol.44, pp. 225-236, 1997.
[34] V.F. Leaves, Shape detection in computer vision using the hough transform, New York: Springer-Verlag, 1992.
[35] W. Gander, G.H. Golub and R. Strebel, “Least square fitting of circles and ellipses,” BIT no. 43, pp. 558-578, 1994.
[36] A. Fitzgibbon, M. Pilu and R.B. Fisher, “Direct least square fitting of ellipses,” IEEE Trans. PAMI, vol. 21, no. 5, pp. 477-480, 1999.
[37] G. H. Golub and C. F. Van Loan, Matrix computations, 3rd ed. Baltimore, MD: Johns Hopkins University Press, 1996.
[38] N. Ray, S. T. Acton, T. Altes and E. E. de Lange, “MRI ventilation analysis by merging parametric active contours,” In Proceedings of IEEE International Conference on Image Processing, pp. 861-864, 2001.
[39] H.V. Poor, An introduction to signal detection and estimation. New York: Springer, 1998.


