Tracking intended nationally determined contributions ... · 3 Tracking intended nationally...
19
Tracking intended nationally determined contributions: what are the implications for greenhouse gas emissions in 2030? Rodney Boyd, Joe Cranston Turner and Bob Ward Policy paper August 2015 ESRC Centre for Climate Change Economics and Policy Grantham Research Institute on Climate Change and the Environment
Transcript of Tracking intended nationally determined contributions ... · 3 Tracking intended nationally...
Tracking intended nationally determined
contributions: what are the implications for
greenhouse gas emissions in 2030?
Rodney Boyd, Joe Cranston Turner and Bob Ward
Policy paper
August 2015
ESRC Centre for Climate Change Economics and
Policy
Grantham Research Institute on Climate Change and
the Environment
2
The ESRC Centre for Climate Change Economics and Policy (CCCEP) was established in 2008 to advance public and private action on climate change through rigorous, innovative research. The Centre is hosted jointly by the University of Leeds and the London School of Economics and Political Science. It is funded by the UK Economic and Social Research Council and Munich Re. More information about the Centre for Climate Change Economics and Policy can be found at: http://www.cccep.ac.uk The Grantham Research Institute on Climate Change and the Environment was established in 2008 at the London School of Economics and Political Science. The Institute brings together international expertise on economics, as well as finance, geography, the environment, international development and political economy to establish a world-leading centre for policy-relevant research, teaching and training in climate change and the environment. It is funded by the Grantham Foundation for the Protection of the Environment, which also funds the Grantham Institute for Climate Change at Imperial College London. More information about the Grantham Research Institute can be found at: http://www.lse.ac.uk/grantham/ The Authors Rodney Boyd is a Policy Analyst and Research Advisor to Nicholas Stern at the Grantham Research Institute on Climate Change and the Environment and ESRC Centre for Climate Change Economics and Policy at London School of Economics and Political Science. Joe Cranston Turner is a Visiting Fellow at the Grantham Research Institute on Climate Change and the Environment and ESRC Centre for Climate Change Economics and Policy at London School of Economics and Political Science. Bob Ward is Policy and Communications Director at the Grantham Research Institute on Climate Change and the Environment and ESRC Centre for Climate Change Economics and Policy at London School of Economics and Political Science. This policy paper is intended to inform decision-makers in the public, private and third sectors. It has been reviewed by at least two internal referees before publication. The views expressed in this paper represent those of the author(s) and do not necessarily represent those of the host institutions or funders.
3
Tracking intended nationally determined contributions: what
are the implications for greenhouse gas emissions in 2030?
Rodney Boyd, Joe Cranston Turner and Bob Ward
August 2015
1. Introduction and context
Parties to the United Nations Framework Convention on Climate Change (UNFCCC)
agreed at the 20th session of the Conference of the Parties (COP20) in Lima, Peru, in
December 2014 to set out their “intended nationally determined contributions” (INDCs)
ahead of COP21 in Paris, France, in December 2015. It was further agreed that each of
these INDCs will “represent a progression beyond the current undertaking of that
Party”.1
The INDCs that were submitted by 20 July 2015 included an indication of expected
annual greenhouse gas emissions beyond 2020 (many Parties provided information
about their expected annual emissions in 2020 following COP15 in Copenhagen,
Denmark, in December 20092). Hence, these INDCs can be analysed to provide an
indication of whether intended action by countries is collectively consistent with the
decision, agreed at COP16 in Cancún, Mexico, in 2010, which states it “recognizes that
deep cuts in global greenhouse gas emissions are required according to science, and as
documented in the Fourth Assessment Report of the Intergovernmental Panel on
Climate Change, with a view to reducing global greenhouse gas emissions so as to hold
the increase in global average temperature below 2°C above preindustrial levels, and
that Parties should take urgent action to meet this long-term goal, consistent with
science and on the basis of equity”.3
A previous paper by Boyd et al. (2015) concluded that, based on announcements by the
European Union, China and United States, the INDCs submitted ahead of COP21 are
unlikely to be collectively consistent with the goal of having a reasonable chance of
avoiding a rise in global average temperature of more than 2°C above its pre-industrial
level.
The analysis presented here considers whether the INDCs that were submitted by 20
July 2015 are consistent with the 2°C limit. As of that date, 46 Parties to the UNFCCC,
including the 28 Member States of the European Union, had submitted INDCs,4 These 46
Parties were together responsible for 58 per cent of global annual emissions of
1 UNFCCC (2014; p.3). 2 A list of the country submissions are available at: http://unfccc.int/meetings/copenhagen_dec_2009/items/5276.php 3 UNFCCC (2011; p.3). 4 INDCs that have been submitted to the secretariat of the UNFCCC are published at: http://www4.unfccc.int/submissions/indc/Submission%20Pages/submissions.aspx.
4
greenhouse gases in 2011.5 We compare a ‘snapshot running total’ in 2030 of the level of
annual global emissions implied by these INDCs with pathways for both ‘business as
usual’ (BAU) consistent with a reasonable chance of not breaching the 2°C limit.
Our conclusions are provided in the final section of this paper. Based on our analysis of
the INDCs for the 46 Parties that had submitted INDCs by 20 July 2015, we conclude
that, while there has been progress compared with a ‘business as usual’ global emissions
pathway, there is a gap between the emissions pathway that would result from current
ambitions and plans, including those goals outlined by the submitted INDCs, and a
pathway that is consistent with a reasonable chance of limiting the rise in global average
temperature to no more than 2°C above pre-industrial levels. Consequently, countries
should be considering opportunities to narrow the gap before and after the COP21
summit in Paris, including (Boyd et al., 2015):
i. hard work over the next few months by all countries to find credible ways of
achieving bigger emissions reductions which can be included in INDCs to be
submitted to the UNFCCC secretariat, and/or achieved through additional efforts
by partnerships (e.g. through specific decarbonisation initiatives among willing
countries);
ii. an intensification of efforts to increase investment and innovation, particularly
in relation to the development of cities, energy systems and land use, that could
help to close the gap between intentions and the goal before and after 2030;
iii. the creation of a mechanism, to be included in the agreement emerging from
COP21 in Paris in December 2015, for countries to review their efforts and to
find ways of ramping up the ambition of their emissions reductions by 2030 and
beyond; and
iv. concerted efforts by all countries to build strong and transparent domestic bases
for the implementation of their INDCs, setting countries on a path to
decarbonisation and enabling them to ramp up their ambitions.
Many other countries are expected to submit INDCs before COP21, and this analysis will
be updated during 2015 based on the implications for projected global emissions in
2030.
5 World Resources Institute (2014a, b).
5
2. Evaluation of post-2020 emissions reduction pledges in INDCs
We have assessed greenhouse gas emissions in 2030 based on INDCs that were
submitted by 46 Parties to the UNFCCC by 20 July 2015.6 We used these 2030 emissions
estimates to create a ‘snapshot running total’ of annual global emissions in 2030, which
was compared with two ‘business as usual’ scenarios. For those Parties that had not
submitted INDCs by 20 July 2015, we made an estimate of what their emissions would
be in 2030, a Reference Scenario, based on actions and plans that had been introduced
by mid-2014, and as assessed by the International Energy Agency. One ‘business as
usual’ scenario was originally described by the United Nations Environment Programme
(UNEP, 2014) for an extrapolation of current economic, social and technological trends,
and takes into account climate policies implemented up to about 2005–2010 (i.e. what
would happen to emissions if planned climate mitigation policies were not
implemented). The other ‘business as usual’ scenario is an aggregate of the Reference
Scenarios for every Party to the UNFCCC, including those that had submitted an INDC by
20 July 2015. Details of our approach to the evaluation of post-2020 emissions reduction
pledges in INDCs is described in detail in Appendix 1.
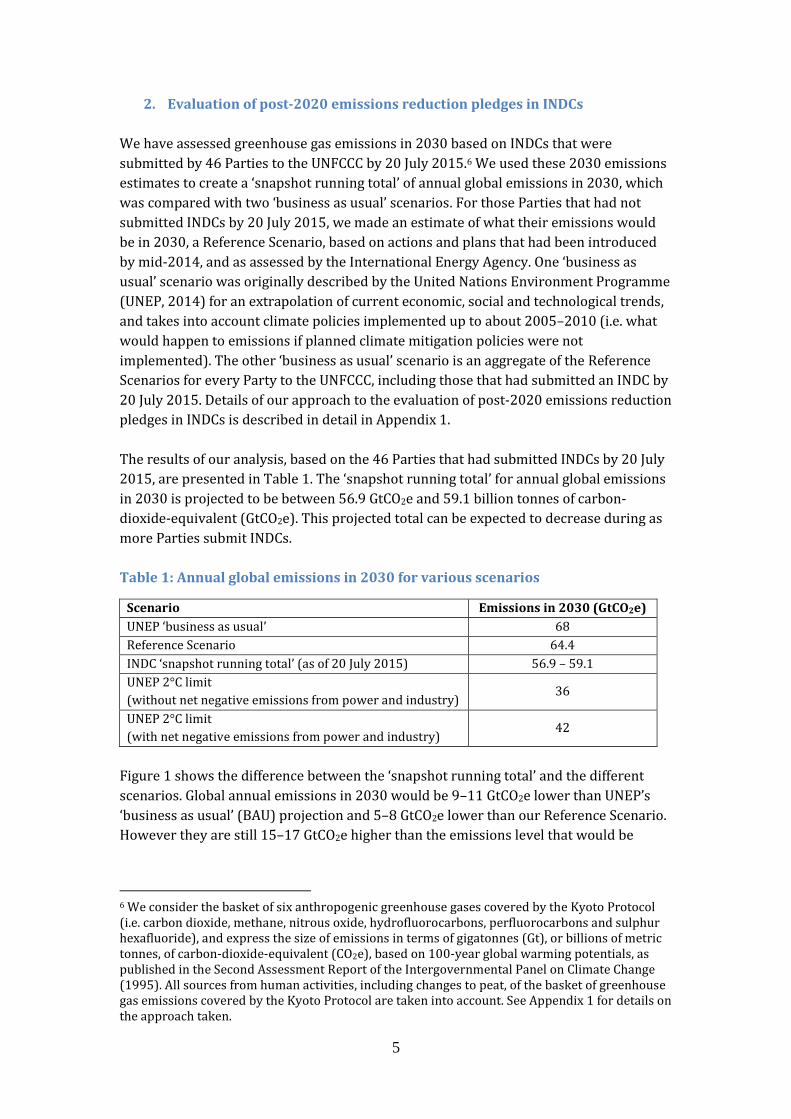
The results of our analysis, based on the 46 Parties that had submitted INDCs by 20 July
2015, are presented in Table 1. The ‘snapshot running total’ for annual global emissions
in 2030 is projected to be between 56.9 GtCO2e and 59.1 billion tonnes of carbon-
dioxide-equivalent (GtCO2e). This projected total can be expected to decrease during as
more Parties submit INDCs.
Table 1: Annual global emissions in 2030 for various scenarios
Scenario Emissions in 2030 (GtCO2e)
UNEP ‘business as usual’ 68
Reference Scenario 64.4
INDC ‘snapshot running total’ (as of 20 July 2015) 56.9 – 59.1
UNEP 2°C limit
(without net negative emissions from power and industry) 36
UNEP 2°C limit
(with net negative emissions from power and industry) 42
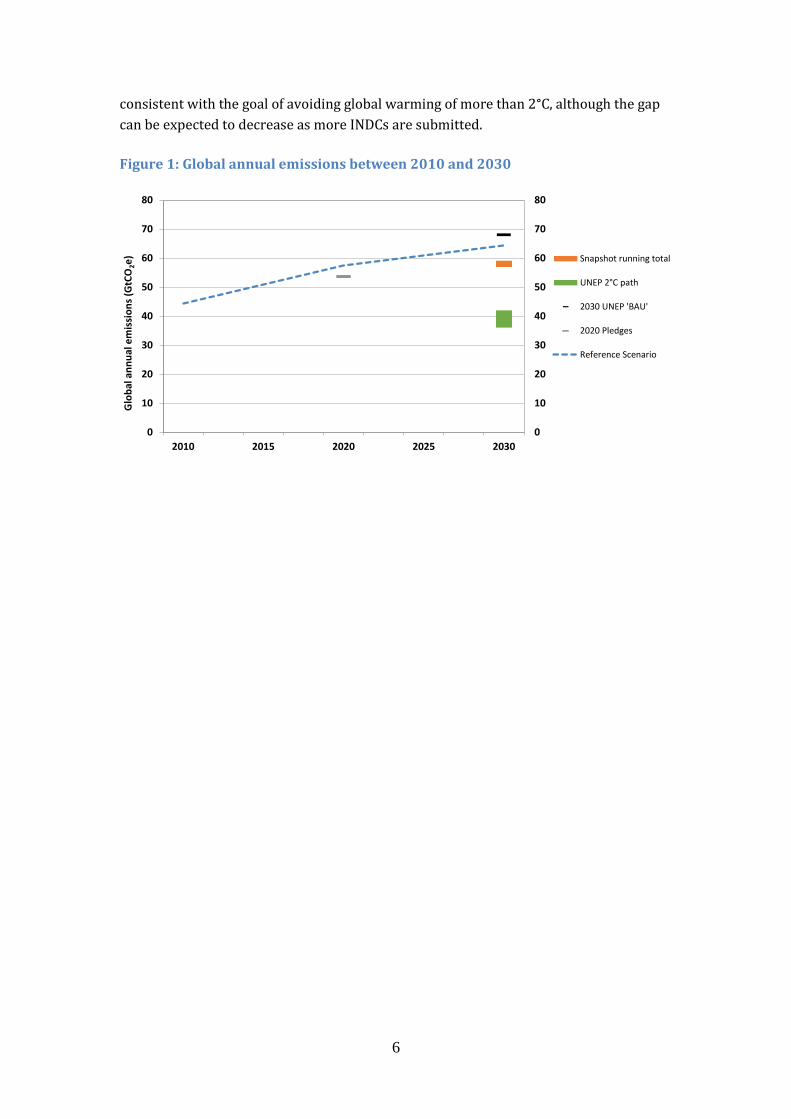
Figure 1 shows the difference between the ‘snapshot running total’ and the different
scenarios. Global annual emissions in 2030 would be 9–11 GtCO2e lower than UNEP’s
‘business as usual’ (BAU) projection and 5–8 GtCO2e lower than our Reference Scenario.
However they are still 15–17 GtCO2e higher than the emissions level that would be
6 We consider the basket of six anthropogenic greenhouse gases covered by the Kyoto Protocol (i.e. carbon dioxide, methane, nitrous oxide, hydrofluorocarbons, perfluorocarbons and sulphur hexafluoride), and express the size of emissions in terms of gigatonnes (Gt), or billions of metric tonnes, of carbon-dioxide-equivalent (CO2e), based on 100-year global warming potentials, as published in the Second Assessment Report of the Intergovernmental Panel on Climate Change (1995). All sources from human activities, including changes to peat, of the basket of greenhouse gas emissions covered by the Kyoto Protocol are taken into account. See Appendix 1 for details on the approach taken.
6
consistent with the goal of avoiding global warming of more than 2°C, although the gap
can be expected to decrease as more INDCs are submitted.
Figure 1: Global annual emissions between 2010 and 2030
0
10
20
30
40
50
60
70
80
0
10
20
30
40
50
60
70
80
2010 2015 2020 2025 2030
Glo
bal
an
nu
al e
mis
sio
ns
(GtC
O2e) Snapshot running total
UNEP 2°C path
2030 UNEP 'BAU'
2020 Pledges
Reference Scenario
7
3. Conclusions
The results of our analysis show that the INDCs submitted by 20 July 2015 by the 46
Parties to the UNFCCC would result in a reduction in global emissions in 2030 relative to
UNEP’s ‘business as usual’ pathway and our Reference Scenario.
Nevertheless, the ‘snapshot running total’ of 56.9-59.1 CO2e indicates that the INDCS
that have so far been submitted are not consistent with the total of 36 GtCO2e in 2030
calculated by UNEP (2014) as being on a global emissions pathway that would offer a
50–66 per cent chance of avoiding global warming of more than 2°C above the pre-
industrial global average temperature. The ‘snapshot running total’ is also higher than
the 42 GtCO2e total which UNEP (2014) suggests would be consistent with a 50-66 per
cent chance of not breaching the 2°C limit, assuming significant amounts of ‘negative
emissions’ through, for instance, the utilisation of bioenergy and carbon capture and
storage (BECCS).
As has been stressed by Boyd et al. (2015), the mismatch between the ambitions
embodied by the INDCs and the overall objective of having a reasonable chance of
avoiding global warming of more than 2°C means that Parties to the UNFCCC should
undertake additional action, including (Boyd et al., 2015):
i. hard work over the next few months by all countries to find credible ways of
achieving bigger emissions reductions which can be included in INDCs to be
submitted to the UNFCCC secretariat, and/or achieved through additional efforts
by partnerships (e.g. through specific decarbonisation initiatives among willing
countries);
ii. an intensification of efforts to increase investment and innovation, particularly
in relation to the development of cities, energy systems and land use, that could
help to close the gap between intentions and the goal before and after 2030;
iii. the creation of a mechanism, to be included in the agreement emerging from
COP21 in Paris in December 2015, for countries to review their efforts and to
find ways of ramping up the ambition of their emissions reductions by 2030 and
beyond; and
iv. concerted efforts by all countries to build strong and transparent domestic bases
for the implementation of their INDCs, setting countries on a path to
decarbonisation and enabling them to ramp up their ambitions.
We intend to publish updated versions of this analysis on the websites of the Grantham
Research Institute on Climate Change and the Environment
(http://www.lse.ac.uk/grantham) and the ESRC Centre for Climate Change Economics
and Policy (http://www.cccep.ac.uk) periodically during 2015 ahead of COP21 to
account for new INDCs as they are submitted.
8
References
Boyd, R., N. Stern and B. Ward, 2015. What will global annual emissions of
greenhouse gases be in 2030, and will they be consistent with avoiding global
warming of more than 2°C? Policy Paper. Centre for Climate Change
Economics and Policy and Grantham Research Institute on Climate Change
and the Environment, London, UK. Available at:
http://www.lse.ac.uk/GranthamInstitute/wp-content/uploads/2015/05/
Boyd_et_al_policy_paper_May_2015.pdf
Green, F., and N. Stern, 2015. China’s “new normal”: structural change, better
growth, and peak emissions. Policy Brief. ESRC Centre for Climate Change
Economics and Policy and Grantham Research Institute on Climate Change
and the Environment, London, UK. Available at:
http://www.lse.ac.uk/GranthamInstitute/wp-
content/uploads/2015/06/China_new_normal_web1.pdf
International Energy Agency [IEA], 2014. World Energy Outlook 2014. IEA/
Organisation for Economic Cooperation and Development (OECD), Paris,
France. Available at: http://www.worldenergyoutlook.org/
IEA, 2015. Emissions Database. IEA/OECD, Paris, France. Available at:
http://data.iea.org/
International Monetary Fund [IMF], 2014. World Economic Outlook Database
October 2014. Washington DC, USA. Available at:
www.imf.org/external/pubs/ft/weo/2014/02/weodata/index.aspx.
Intergovernmental Panel on Climate Change [IPCC], 1995. Climate Change 1995:
The Science of Climate Change. Contribution of Working Group I to the
Second Assessment Report of the Intergovernmental Panel on Climate Change
[Houghton, J.T., L.G. Meira Filho, B.A. Callander, N. Harris, A. Kattenberg and
K. Maskell (eds.)]. Cambridge University Press, Cambridge, United Kingdom
and New York, NY, USA. Available at:
https://www.ipcc.ch/ipccreports/sar/wg_I/ipcc_sar_wg_I_full_report.pdf
Joosten, H., 2010. The Global Peatland CO2 Picture: Peatland status and drainage
related emissions in all countries of the world. Wetlands International,
Wageningen, Netherlands. Available at:
http://www.wetlands.org/Portals/0/publications/Report/The%20Global
%20Peatland%20CO2%20Picture_web%20Aug%202010.pdf.
Kindermann, G., Obersteiner, M., Sohngen, B., Sathaye, J., Andrasko, K.,
Rametsteiner, E., Schlamadinger, B., Wunder, S. and Beach, R., 2008. Global
cost estimates of reducing carbon emissions through avoided deforestation.
9
Proceedings of the National Academy of Sciences of the United States of
America, 105(30), pp.10302-10307.
Lucas, P.L., van Vuuren, D.P., Olivier, J.G.J. and den Elzen, M.G.J., 2007. Long-term
reduction potential of non-CO2 greenhouse gases. Environmental Science &
Policy, 10(2), pp.85-103.
National Climate Strategy Centre [NCSC], 2015. Commentary on the Chinese
INDC. NCSC/National Development and Reform Commission, Beijing, China.
Available at [in Chinese]:
http://files.ncsc.org.cn/www/201507/20150702114814244.pdf.
Organisation for Economic Cooperation and Development [OECD], 2014. OECD
Economic Outlook: Long-term Baseline Projections (No. 95, Edition 2014).
Paris, France. Available at: http://www.oecd-
ilibrary.org/economics/data/oecd-economic-outlook-statistics-and-
projections/long-term-baseline-projections-no-95_data-00690-en.
People's Republic of China, 2012. Second National Communication on Climate
Change. National Development and Reform Commission, Beijing, China.
Available at: http://unfccc.int/resource/docs/natc/chnnc2e.pdf.
Republic of Korea, 2008. Third National Communication under the United
Nations Framework Convention on Climate Change. Korea. Available at:
http://unfccc.int/resource/docs/natc/kornc3.pdf.
Stern, N. & C. Taylor, 2010. What do the Appendices to the Copenhagen Accord
tell us about global greenhouse gas emissions and the prospects for
avoiding a rise in global average temperature of more than 2°C? Policy
Paper. Centre for Climate Change Economics and Policy and Grantham
Research Institute on Climate Change and the Environment, London, UK.
Available at: http://www.lse.ac.uk/GranthamInstitute/wp-
content/uploads/2014/02/PPCOPAccordSternTaylorMarch10.pdf
United Nations Environment Programme [UNEP], 2013. The Emissions Gap
Report 2013. UNEP, Nairobi, Kenya. Available at:
http://www.unep.org/pdf/UNEPEmissionsGapReport2013.pdf
UNEP, 2014. The Emissions Gap Report 2014. UNEP, Nairobi, Kenya. Available at:
http://www.unep.org/publications/ebooks/emissionsgapreport2014/port
als/50268/pdf/EGR2014_LOWRES.pdf
United Nations Framework Convention on Climate Change [UNFCCC], 2011.
Report of the Conference of the Parties on its sixteenth session, held in
Cancún from 29 November to 10 December 2010—Addendum Part Two:
Action taken by the Conference of the Parties at its sixteenth session. Bonn,
10
Germany. Available at:
http://unfccc.int/resource/docs/2010/cop16/eng/07a01.pdf
UNFCCC, 2014. Report of the Conference of the Parties on its twentieth session,
held in Lima from 1 to 14 December 2014—Addendum Part Two: Action
taken by the Conference of the Parties at its twentieth session. Bonn,
Germany. Available at:
http://unfccc.int/resource/docs/2014/cop20/eng/10a01.pdf
World Resources Institute [WRI], 2014a. Climate Analysis Indicators Tool (CAIT
Version 2.0): Climate Data Explorer, Country Emissions. World Resources
Institute, Washington, DC. Available at:
http://www.wri.org/resources/data-sets/unfccc-annex-i-ghg-emissions-0
WRI, 2014b. Climate Analysis Indicators Tool (CAIT Version 2.0): UNFCCC Annex I
GHG Emissions Data. World Resources Institute, Washington, DC. Available
at: http://www.wri.org/resources/data-sets/unfccc-annex-i-ghg-
emissions-0
11
Appendix 1: Approach to evaluating post-2020 emissions reduction pledges in
INDCs
Our approach to evaluating post-2020 emissions reduction pledges in INDCs consists of
four main steps:
i. estimating annual emissions of greenhouse gases in 2030 from the INDCs that
had been submitted by 46 Parties to the UNFCCC by 20 July 2015;
ii. estimating a Reference Scenario for each Party based on policies that had been
implemented by mid-2014;
iii. calculating a ‘snapshot running total’ for the projected annual global emissions
of greenhouse gases in 2030, based on submitted INDCs; and
iv. quantifying the gaps between the ‘snapshot running total’ and
a. a UNEP ‘business as usual’ pathway and an aggregate of the Reference
Scenarios; and
b. an aggregate total for global emissions in 2030 that is projected to be
consistent with a reasonable chance of avoiding global warming of more
than 2°C above pre-industrial levels.
We consider the basket of six anthropogenic greenhouse gases covered by the Kyoto
Protocol (i.e. carbon dioxide, methane, nitrous oxide, hydrofluorocarbons,
perfluorocarbons and sulphur hexafluoride), and express the size of emissions in terms
of gigatonnes (Gt), or billions of metric tonnes, of carbon-dioxide-equivalent (CO2e),
based on 100-year global warming potentials, as published in the Second Assessment
Report of the Intergovernmental Panel on Climate Change (1995). All sources from
human activities, including changes to peat, of the basket of greenhouse gas emissions
covered by the Kyoto Protocol are taken into account.
Estimating 2030 emissions from INDCs
We have based our calculations on INDCs that have been posted on the website of the
UNFCCC.7 Details of how emissions in 2030 are calculated from each INDC are listed in
Appendix 2. The INDCs for the 28 Member States of the European Union are considered
together. In some cases, the INDCs imply a range within which emissions will lie in 2030.
In these cases we have calculated the upper and lower limits to the ranges and therefore
created two INDC scenarios: INDC Low Ambition and INDC High Ambition. This range
does not include the conditional offers submitted by some Parties; only the
unconditional parts of targets have been included in our analysis.
We use the total for annual emissions of greenhouse gases in 2030 where it is explicitly
stated in an INDC. Where it is implied, we have undertaken a calculation based on
information provided by the Party that submitted the INDC. Our general approach has
been to take INDCs and other information at face value. We have not conducted a
detailed assessment of the different approaches to accounting for emissions from the
land sector that have been adopted by Parties.
7 See: http://www4.unfccc.int/submissions/indc/Submission%20Pages/submissions.aspx.
12
Where, for instance, an INDC expresses emissions in 2030 as a percentage of an earlier
year’s emissions (e.g. 40 per cent below 1990 levels), we calculate the total based on the
emissions data submitted by that Party to the UNFCCC.8 Where the INDC for a Party is
less specific about emissions in 2030, we make simple and reasonable assumptions to
estimate the total, with details provided in Appendix 2.
For INDCs that do not explicitly state a level of emissions in 2030, we calculate the total
based on the most up-to-date and reliable information about past and future emissions,
as well as relevant data about other relevant factors, such as economic growth rates. In
some cases this included referring to published analyses. Were any INDCs to include a
target measured as a reduction compared with ’business as usual’, but without
specifying a ’business as usual’ projection, we would use the Reference Scenario outlined
below. However, so far all INDCs that have included a ’business as usual’ target have also
included a ’business as usual’ projection.
In addition to the analysis of emissions in 2030 based on INDCs, we provide projections
of annual emissions in 2020 for the 13 individual countries and 11 regional blocs, based
on submissions by Parties to the secretariat of the UNFCCC after COP15, including both
conditional and unconditional pledges.9 These totals are updates on the figures first
published by Stern and Taylor (2010), and subsequent submissions by the Grantham
Research Institute on Climate Change and the Environment to the United Nations
Environment Programme for its annual reports on the gap between emissions
commitments and targets (e.g. UNEP, 2013). The totals allow a comparison between
projected emissions in 2020 and 2030.
Reference Scenario emissions for countries without INDCs
The UNEP ‘Emissions Gap Report 2014’ presented a ‘business as usual’ pathway based
on an extrapolation of current economic, social and technological trends. This scenario
only takes into account climate policies implemented up to around 2005–2010 and
therefore serves as a reference point for what would happen to emissions without more
recent pledges and policies. In this scenario, global annual emissions of greenhouse
gases would rise from 54 GtCO2e in 2012 to 68 GtCO2e in 2030.
While this provides one benchmark against which to judge the progress represented by
the INDCs, we have also sought to determine a Reference Scenario pathway based on
policies that had been implemented by mid-2014. This provides a better estimate of
what emissions would be as a result of current policies without additional action. The
Reference Scenario emissions for countries that have not submitted INDCs are also used
to calculate the ‘snapshot running total’.
The Reference Scenario draws on the following data sources:
8 For Annex I countries: National Communication Reports submitted to the UNFCCC by Parties, compiled by the World Resources Institute (WRI, 2014b). For non-Annex I countries: data from the World Resources Institute’s CAIT 2.0 dataset (WRI, 2014a). 9 A list of the country submissions are available at: http://unfccc.int/meetings/copenhagen_dec_2009/items/5276.php
13
i. emissions of carbon dioxide from all sources other than land use, land-use
change and forestry (LULUCF), provided by Enerdata, using the POLES model
calibrated for the data from the Current Policies Scenario in the World Energy
Outlook (2014) published by the International Energy Agency;10
ii. emissions of carbon dioxide from LULUCF, from the International Institute for
Applied Systems Analysis (IIASA);11 and
iii. emissions of greenhouse gases covered by the Kyoto Protocol, other than carbon
dioxide, from the Netherlands Environmental assessment Agency (PBL)12.
The Reference Scenario totals are calculated for 26 separate blocs:
- 13 individual countries (Brazil, Canada, China, India, Indonesia, Japan, Mexico,
Russia, South Africa, South Korea, Turkey, Ukraine, United States);
- 11 regional blocs (European Union, Middle East, Oceania, Northern Africa, Rest
of Central America, Rest of Europe, Rest of the Former Soviet Union, Rest of
South America, Rest of South Asia, Rest of South East Asia, Rest of Sub-Saharan
Africa); and
- two international fuel bunkers (aviation and maritime) which cannot be
assigned to any individual countries or regional blocks so are treated as regions
in their own right.
To project the level of emissions of smaller countries in the regional blocs that have not
submitted INDCs, we assume that the percentage of emissions produced by a country
within each region stays the same between 2010 and 2030 (even if the total absolute
emissions for the bloc changes). This is a simplifying assumption; in reality, each
country’s share of emissions may change over time due to differences in economic
growth rates, climate policies, and so on. However, the impact of these trends is likely to
be small relative to the global emissions level reported in the results13.
In addition, we considered that the aggregate sum of annual emissions for the 13
individual countries, 11 regional blocs and 2 international bunkers was likely to under-
estimate global emissions by not fully including carbon dioxide emissions from peat. We
have taken into account emissions from peat in the final total for the Reference Scenario
by adding a further 1.5 GtCO2e per year14. The data used for the Reference Scenario was
procured thought open tender by the UK Government’s Department of Energy and
Climate Change (DECC) for use in its Global Carbon Finance Model (GLOCAF).
10 IEA (2014). 11 Kindermann et al. (2008). 12 Lucas et al. (2007). 13 We conducted a sensitivity analysis around this assumption, using the alternative assumption that each country’s share of it region’s emissions changes at the same rate as that between 2000 and 2010. This alternative assumption increases projected global emissions by around 0.01 GtCO2e, a difference which is too small to show up in the results presented here. 14 Research suggests global emissions from drained peatland were 1.3 GtCO2e in 2008, although this does include emissions caused by peat fires (for which conservative estimates are at least 400 MtCO2e) (Joosten, 2010). We have increased the total annual emission from peat to 1.5 GtCO2e to account for these additional emissions.
14
The Reference Scenario provides a useful indication of the likely level of emissions in
2030, based on the assessment of the International Energy Agency of current policies
and socio-economic trends. Nonetheless, projecting economic growth, demographic
changes and technological development 15 years into the future inherently results in a
significant level of uncertainty. The Reference Scenario should, therefore, be regarded as
a reasonable estimate of what emissions will be, based on current evidence and
expectations.
For comparison purposes, alongside the estimates of future emissions for each bloc, we
also provide the details of annual emissions in 1990, 2005 and 2010. These data are for
illustration purposes and were not used in the projections of future emissions. In most
cases, these figures are based on official national inventory submissions of emissions
from Annex I Parties to the UNFCCC, and the WRI CAIT database15 for other parties (i.e.
Non-Annex I Parties to the UNFCCC).
Snapshot running totals
In order to assess the overall impact of the INDCs on global annual emissions in 2030,
we create a ‘snapshot running total’. This is calculated by starting with the Reference
Scenario and replacing the emissions total for each Party that has made a submission to
the UNFCCC with an estimate based on its INDC. Two ‘snapshot running total’ scenarios
(INDC High Ambition and INDC Low Ambition) are provided to take account of the
target ranges implied by some INDCs. We only include unconditional contributions from
INDCs. The ‘snapshot running totals’ can be compared with:
i. The UNEP (2014) ‘business as usual’ global total, to assess what progress will be
made by existing climate policies and the delivery of the INDCs;
ii. The Reference Scenario, to assess the additional impact of INDCs on top of
policies implemented since mid-2014; and
iii. The UNEP estimates of the pathway for annual global emissions that is
consistent with a 50–66 per cent chance of limiting the rise in global average
temperature to no more than 2°C above pre-industrial level.
As UNEP (2014) makes clear, there is significant uncertainty around both what ‘business
as usual’ emissions would be, and what level of emissions would be consistent with the
2°C warming limit. We follow the UNEP approach of using a median value from its
ranges for emissions in order to make comparisons.
This paper will be updated throughout 2015 as new INDCs are submitted by Parties to
the UNFCCC. In addition, UNEP is currently updating its analysis of what level of
emissions would be consistent with the 2°C limit which, once published, will be used to
update the comparative analysis in this paper.
15 A previous paper, Boyd et al. (2015), employs the IEA Emissions Dataset for historic emissions (IEA, 2015). However the regional bloc country breakdowns differ from those used to generate the Reference Scenario, with no official sources available from one source such as the UNFCCC. We thus used WRI CAIT database to ensure a high level of consistency and accuracy (WRI, 2014a).
15
Appendix 2: Details of calculation of 2030 emissions from each INDC as of 20 July
2015.16
Announced INDCs Low Announced INDCs High
OECD
Canada Headline 30% reduction on 2005 target (on an excluding LULUCF baseline)
translates to 28% reduction compared to an including LULUCF baseline.
European Union Headline 40% reductions against 1990 level (on an excluding LULUCF 1990
baseline) translates to 41% compared to 1990 including LULUCF baseline.
Japan
26% reduction against 2013 baseline excluding LULUCF, translating to 20.3%
reduction on 2005 level with an including LULUCF baseline.
Further technical information: Japan’s target emissions level expressed in the
INDC includes removals from LULUCF; the 26% reduction is expressed
against a baseline excluding LULUCF.
Japan’s INDC target emissions level uses the latest global warming potentials
from the Fourth IPCC report. For consistency we have applied the same
20.3% reduction on 2005 to Japan’s UNFCCC inventory data17.
Mexico
Unconditional 22% reduction on 2030 ’business as usual’. Does not count
‘black carbon’ as GHGs. ‘Business as usual’ in INDC for 2030 is 987 million
tonnes (Mt) CO2e. INDC target emissions 770 MtCO2e.
Oceania
Includes New Zealand's INDC of a 30% reduction by 2030 on a 2005 baseline
excluding LULUCF (77 MtCO2e), translating to 42% reduction compared to
2005 baseline including LULUCF.
Reference Scenario used for rest of the region as no other INDCs have been
submitted.
16 Unless otherwise stated, source of baseline emissions used in calculations are explained under Appendix 1. 17 See Appendix 1 for data source.
16
Rest of Europe
Includes INDCs from Norway, Iceland, Serbia and Switzerland, Reference
Scenario for others.
Norway: 40% reduction on 1990 emissions level provided in INDC (52
MtCO2e, excluding LULUCF). This gives 31.2 MtCO2e. Projected net removals
in 2030 constitute 21.2 MtCO2e from Norway’s INDC, bringing net emissions
including LULUCF to 10 MtCO2e. Norway states that only removals beyond
the level in the base year and the projected level will count towards the 40%
commitment.
Switzerland: 50% reduction of emissions against 1990 baseline. 1990
baseline provided in INDC (53.3 MtCO2e).
Iceland: 40% reduction of emissions against 1990 is 3 MtCO2e by 2030.
Serbia: 73 MtCO2e allowed emissions, a 10% reduction against 1990 levels by
2030 incl. LULUCF.
South Korea
37% reduction of emissions against ‘business as usual’ in 2030. ‘Business as
usual’ given in INDC as 850.6 MtCO2e, excluding LULUCF. LULUCF emissions
in 2030 are estimated to be -23 MtCO2e (based on 2020 LULUCF projections
from the 3rd National Communications report.18
Turkey Reference Scenario as no INDC submitted.
USA
2025 target of 26% reduction on
2005 baseline emissions including.
LULUCF. 2030 based on linear
trajectory from 2020 target of 17%
reduction on 2005 level, leading to
2030 emissions 35% below 2005.
2025 target of 28% reduction on
2005 baseline emissions including.
LULUCF, straight line trajectory from
2020 target of 17% reduction on
2005 level, leading to 2030 emissions
39% below 2005.
BASICS
Brazil Reference Scenario as no INDC submitted.
18 Republic of Korea (2008).
17
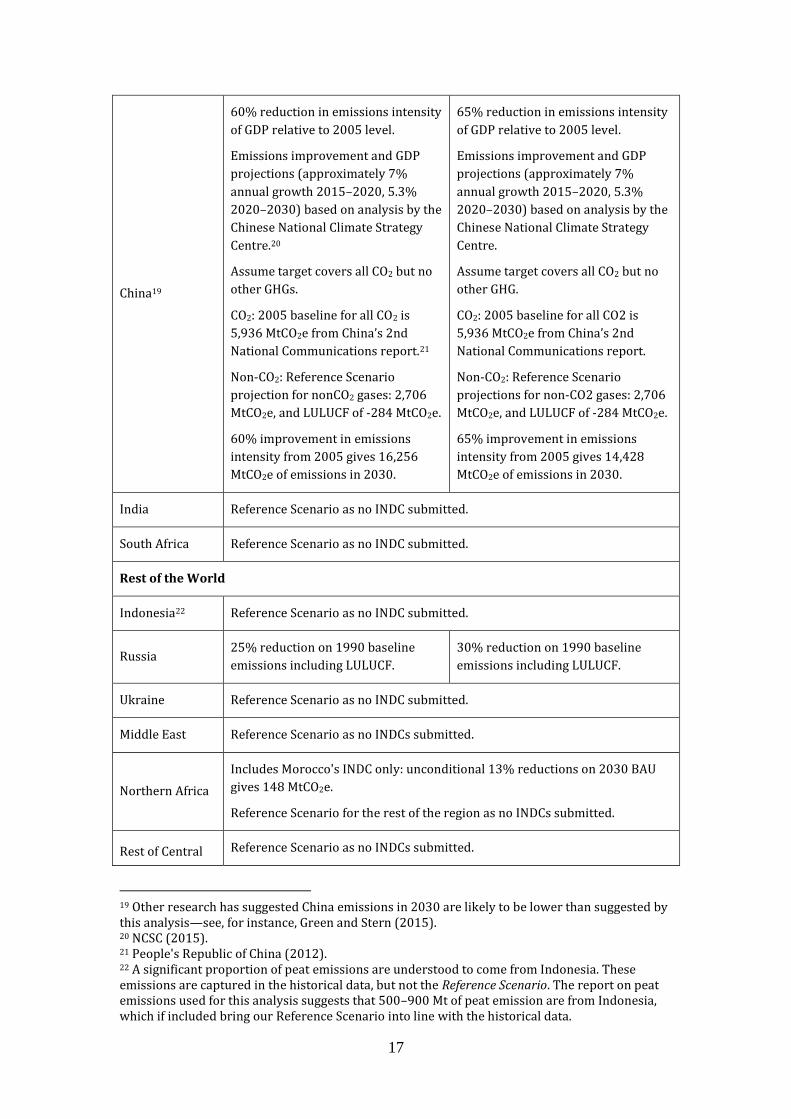
China19
60% reduction in emissions intensity
of GDP relative to 2005 level.
Emissions improvement and GDP
projections (approximately 7%
annual growth 2015–2020, 5.3%
2020–2030) based on analysis by the
Chinese National Climate Strategy
Centre.20
Assume target covers all CO2 but no
other GHGs.
CO2: 2005 baseline for all CO2 is
5,936 MtCO2e from China’s 2nd
National Communications report.21
Non-CO2: Reference Scenario
projection for nonCO2 gases: 2,706
MtCO2e, and LULUCF of -284 MtCO2e.
60% improvement in emissions
intensity from 2005 gives 16,256
MtCO2e of emissions in 2030.
65% reduction in emissions intensity
of GDP relative to 2005 level.
Emissions improvement and GDP
projections (approximately 7%
annual growth 2015–2020, 5.3%
2020–2030) based on analysis by the
Chinese National Climate Strategy
Centre.
Assume target covers all CO2 but no
other GHG.
CO2: 2005 baseline for all CO2 is
5,936 MtCO2e from China’s 2nd
National Communications report.
Non-CO2: Reference Scenario
projections for non-CO2 gases: 2,706
MtCO2e, and LULUCF of -284 MtCO2e.
65% improvement in emissions
intensity from 2005 gives 14,428
MtCO2e of emissions in 2030.
India Reference Scenario as no INDC submitted.
South Africa Reference Scenario as no INDC submitted.
Rest of the World
Indonesia22 Reference Scenario as no INDC submitted.
Russia 25% reduction on 1990 baseline
emissions including LULUCF.
30% reduction on 1990 baseline
emissions including LULUCF.
Ukraine Reference Scenario as no INDC submitted.
Middle East Reference Scenario as no INDCs submitted.
Northern Africa
Includes Morocco's INDC only: unconditional 13% reductions on 2030 BAU
gives 148 MtCO2e.
Reference Scenario for the rest of the region as no INDCs submitted.
Rest of Central Reference Scenario as no INDCs submitted.
19 Other research has suggested China emissions in 2030 are likely to be lower than suggested by this analysis—see, for instance, Green and Stern (2015). 20 NCSC (2015). 21 People's Republic of China (2012). 22 A significant proportion of peat emissions are understood to come from Indonesia. These emissions are captured in the historical data, but not the Reference Scenario. The report on peat emissions used for this analysis suggests that 500–900 Mt of peat emission are from Indonesia, which if included bring our Reference Scenario into line with the historical data.
18
America
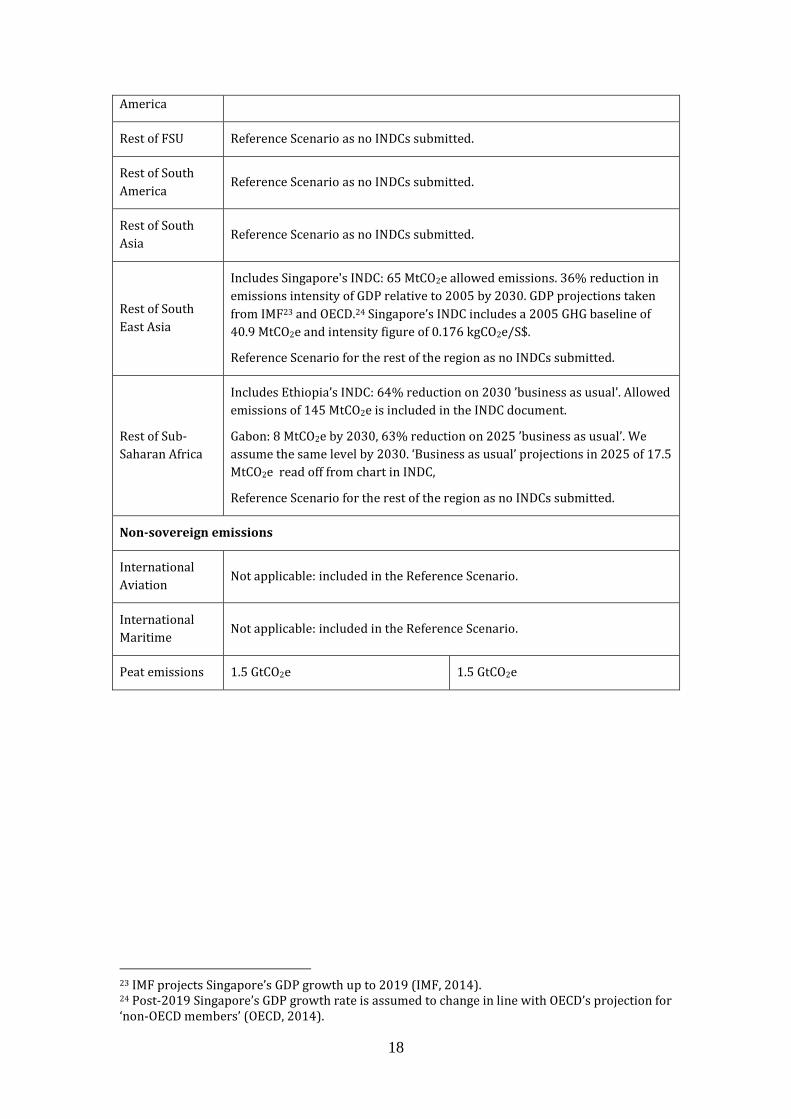
Rest of FSU Reference Scenario as no INDCs submitted.
Rest of South
America Reference Scenario as no INDCs submitted.
Rest of South
Asia Reference Scenario as no INDCs submitted.
Rest of South
East Asia
Includes Singapore's INDC: 65 MtCO2e allowed emissions. 36% reduction in
emissions intensity of GDP relative to 2005 by 2030. GDP projections taken
from IMF23 and OECD.24 Singapore’s INDC includes a 2005 GHG baseline of
40.9 MtCO2e and intensity figure of 0.176 kgCO2e/S$.
Reference Scenario for the rest of the region as no INDCs submitted.
Rest of Sub-
Saharan Africa
Includes Ethiopia’s INDC: 64% reduction on 2030 ’business as usual’. Allowed
emissions of 145 MtCO2e is included in the INDC document.
Gabon: 8 MtCO2e by 2030, 63% reduction on 2025 ’business as usual’. We
assume the same level by 2030. ‘Business as usual’ projections in 2025 of 17.5
MtCO2e read off from chart in INDC,
Reference Scenario for the rest of the region as no INDCs submitted.
Non-sovereign emissions
International
Aviation Not applicable: included in the Reference Scenario.
International
Maritime Not applicable: included in the Reference Scenario.
Peat emissions 1.5 GtCO2e 1.5 GtCO2e
23 IMF projects Singapore’s GDP growth up to 2019 (IMF, 2014). 24 Post-2019 Singapore’s GDP growth rate is assumed to change in line with OECD’s projection for ‘non-OECD members’ (OECD, 2014).
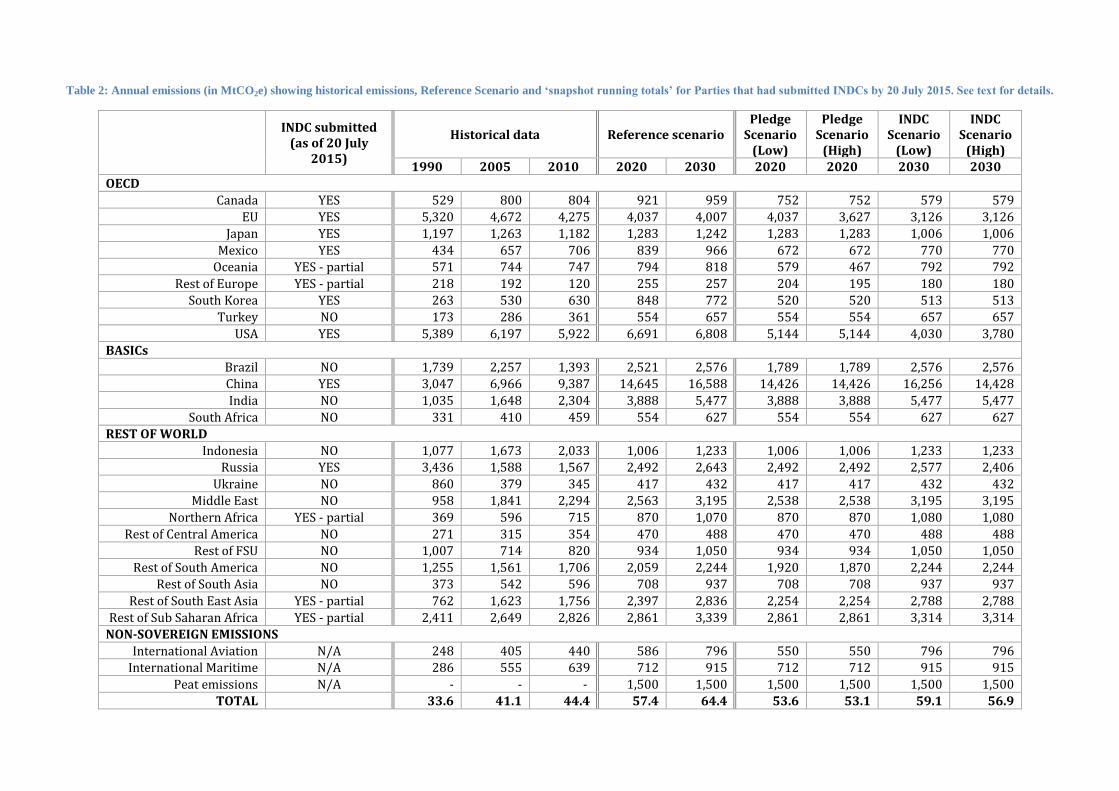
Table 2: Annual emissions (in MtCO2e) showing historical emissions, Reference Scenario and ‘snapshot running totals’ for Parties that had submitted INDCs by 20 July 2015. See text for details.
INDC submitted (as of 20 July
2015)
Historical data Reference scenario Pledge
Scenario (Low)
Pledge Scenario
(High)
INDC Scenario
(Low)
INDC Scenario
(High) 1990 2005 2010 2020 2030 2020 2020 2030 2030
OECD
Canada YES 529 800 804 921 959 752 752 579 579
EU YES 5,320 4,672 4,275 4,037 4,007 4,037 3,627 3,126 3,126
Japan YES 1,197 1,263 1,182 1,283 1,242 1,283 1,283 1,006 1,006
Mexico YES 434 657 706 839 966 672 672 770 770
Oceania YES - partial 571 744 747 794 818 579 467 792 792
Rest of Europe YES - partial 218 192 120 255 257 204 195 180 180
South Korea YES 263 530 630 848 772 520 520 513 513
Turkey NO 173 286 361 554 657 554 554 657 657
USA YES 5,389 6,197 5,922 6,691 6,808 5,144 5,144 4,030 3,780
BASICs
Brazil NO 1,739 2,257 1,393 2,521 2,576 1,789 1,789 2,576 2,576
China YES 3,047 6,966 9,387 14,645 16,588 14,426 14,426 16,256 14,428
India NO 1,035 1,648 2,304 3,888 5,477 3,888 3,888 5,477 5,477
South Africa NO 331 410 459 554 627 554 554 627 627
REST OF WORLD
Indonesia NO 1,077 1,673 2,033 1,006 1,233 1,006 1,006 1,233 1,233
Russia YES 3,436 1,588 1,567 2,492 2,643 2,492 2,492 2,577 2,406
Ukraine NO 860 379 345 417 432 417 417 432 432
Middle East NO 958 1,841 2,294 2,563 3,195 2,538 2,538 3,195 3,195
Northern Africa YES - partial 369 596 715 870 1,070 870 870 1,080 1,080
Rest of Central America NO 271 315 354 470 488 470 470 488 488
Rest of FSU NO 1,007 714 820 934 1,050 934 934 1,050 1,050
Rest of South America NO 1,255 1,561 1,706 2,059 2,244 1,920 1,870 2,244 2,244
Rest of South Asia NO 373 542 596 708 937 708 708 937 937
Rest of South East Asia YES - partial 762 1,623 1,756 2,397 2,836 2,254 2,254 2,788 2,788
Rest of Sub Saharan Africa YES - partial 2,411 2,649 2,826 2,861 3,339 2,861 2,861 3,314 3,314
NON-SOVEREIGN EMISSIONS
International Aviation N/A 248 405 440 586 796 550 550 796 796
International Maritime N/A 286 555 639 712 915 712 712 915 915
Peat emissions N/A - - - 1,500 1,500 1,500 1,500 1,500 1,500
TOTAL 33.6 41.1 44.4 57.4 64.4 53.6 53.1 59.1 56.9