TRACKING EGRESS OF DOUBLY ENCAPSULATED CELLS · Rushi Panchal and Michel Godin, USING DROPLET-BASED...
109
TRACKING EGRESS OF DOUBLY ENCAPSULATED CELLS RUSHI PANCHAL Thesis is submitted to the Faculty of Engineering in partial fulfillment of requirements for the degree of Master of Applied Science in Biomedical Engineering Ottawa Carleton Institute for Biomedical Engineering University of Ottawa Ottawa, Ontario © Rushi Panchal, Ottawa, Canada, 2019
Transcript of TRACKING EGRESS OF DOUBLY ENCAPSULATED CELLS · Rushi Panchal and Michel Godin, USING DROPLET-BASED...

TRACKING EGRESS OF DOUBLY ENCAPSULATED
CELLS
RUSHI PANCHAL
Thesis is submitted to the Faculty of Engineering in partial
fulfillment of requirements for the degree of
Master of Applied Science
in
Biomedical Engineering
Ottawa Carleton Institute for Biomedical Engineering
University of Ottawa
Ottawa, Ontario
© Rushi Panchal, Ottawa, Canada, 2019

ii
ABSTRACT
Droplet-based microfluidics can be used to enhance stem cell-based therapy by creating cell-laden
hydrogel encapsulations to increase engraftment and retention while providing protection from
immune responses caused by the host environment. Current research involves gaining better control
over therapeutic mechanisms and one focus is to understand the mechanisms behind cell egress.
Control over egress is vital to determining how long cells remain in proximity to the therapeutic target.
We propose a microfluidic platform capable of encapsulating cells in two subsequent steps in order
to create a double emulsion structure around the cell. In this project, hydrogel-in-hydrogel
microdroplets are successfully manufactured without the presence of an intermediate oil layer and are
used to observe model NIH 3T3 cell egress. In studying cell egress from singly or doubly encapsulated
microcapsules, we are able to better understand the mechanisms that drive egress. Specifically, we
hypothesize that cells egress when close to the edge of the microcapsule. In a double emulsion, cells
are naturally located away from the edge and closer to the center. Results show that double emulsion
microdroplets significantly reduce cell egress but do not eliminate it.

iii
STATEMENT OF ORIGINALITY
The content presented in this body of work is original and the product of work done under the
supervision of Dr. Michel Godin at the University of Ottawa in Ottawa, Ontario.
As partial requirement for the degree of Master of Science (Biomedical Engineering) at the
University of Ottawa, research on the creation of double emulsion microdroplets using a microfluidic
platform to understand cell egress has been presented at the Ottawa Carleton Institute of Biomedical
Engineering symposium:
Rushi Panchal and Michel Godin, USING DROPLET-BASED MICROFLUIDICS TO
CREATE HYDROGEL-IN-HYDROGEL DOUBLE EMULSIONS FOR THE PURPOSE OF
STUDYING CELL EGRESS. Ottawa Carleton Institute for Biomedical Engineering, 20-March 2018.
Posters on the same topic were also presented at the following:
1) MDII and NSERC CREATE BEST Poster Day. Ottawa, Ontario 14-September 2018.
2) Annual SCORR Scientific Research Day. Ottawa, Ontario. 22-March 2018.
3) 10th Annual Graduate Student Poster Competition. Ottawa, Ontario. 27-March 2018.
4) The 2nd Annual Eastern Ontario Canadian Biomaterials Society Symposium. Ottawa, Ontario.
11-May 2018.
Talks on the same topic were also presented at the following:
1) The 2nd Annual Eastern Ontario Canadian Biomaterials Society Symposium. Ottawa, Ontario.
11-May 2018.

iv
STATEMENT OF CONTRIBUTIONS
Text present in this document is an original body of work written by the author. Figures and tables
presented were designed and created by the author unless stated otherwise in the caption. All data
acquisition and analysis was performed by the author. Single emulsions microfluidic devices were
adapted by Ainara Benavente-Babace, PhD and originally designed by Nicolas Cataford, MASc.
Double emulsion microfluidic devices were created by the author. Fabrication of devices was done by
the author. Programs developed in LabVIEW intended for temperature and pressure control was
developed by Michel Godin, PhD and adapted by Ainara Benavente, PhD. Cells were cultured by the
author.

v
ACKNOWLEDGEMENTS
I would like to thank my supervisor, Dr. Michel Godin, for his support throughout my time at the
University of Ottawa. He provided a positive working environment which encouraged critical
thinking, discussion, collaboration and the pursuit of knowledge. I consider myself lucky to have had
the opportunity to work in his lab and I am grateful for his positive impact on my academic and
professional career.
Dr. Ainara Benavente-Babace provided continued support during my time in the Godin Lab. Her
contribution to my project cannot be understated as she spent countless hours teaching, challenging
and encouraging me about all things microfluidics.
While Dr. Godin and Dr. Benavente-Babace were the members of our group involved in my
project - the support, advice and encouragement of all Godin Lab members is of note. Thank you to
Dr. Ali Najafi Sohi, Eric Beamish, Enas Azhari, Adefemi Adeyami, Karan Dhingra, Nicholas Soucy,
and Kaitlyn Kean.
I’d like to especially thank my mother, Chhaya Panchal, for her unconditional love and support
through all my endeavors. Her support and guidance means the world to me. I’ve been lucky to have
an amazing family and I’d like to thank them here as well– કાાંતિભાઈ પાંચાલ, રતિલાબેન પાંચાલ,
Kalpesh Panchal, Vaishali Panchal, and the best brother and sister – Jay and Adya Panchal.

vi
LIST OF FIGURES
Figure 1. Schematic of a microfluidic device creating droplets using a flow focusing geometry, discussed in the coming sections. The yellow represents material, referred to as the dispersed phase, that will turn into a droplet, while the blue represents an immiscible fluid, referred to as the continuous phase, which ‘cleaves’ the droplets into spheres without mixing. Objects, such as cells and polystyrene beads, mixed in with the dispersed phase are incorporated into the droplets. 3
Figure 2. Laminar flow versus turbulent flow. Laminar Flow has smooth flow patterns with no chaotic mixing at any point. Should there be a multiphasic flow, mixing will only take place through diffusion at the fluid to fluid interfaces. Turbulent flow contains more chaotic flow patterns. Fluids often mix at random points and there are eddies which cause disturbance in the flow. 7
Figure 3. Visual representation of flow patterns around an object when operating in a flow-regime described by stokes flow, or creeping flow. Viscous fluids tend to wrap around an object and revert back to their initial positioning, much like the behavior of molasses or honey. 9
Figure 4. Common microdroplet production geometries. 10
Figure 5. Droplet production in a system with low capillary number versus high capillary number. Surface tension forces dominate flow regimes with a low Ca and lead to a jetting regime while viscous forces dominate regimes with a high Ca and it forms droplets. 13
Figure 6. Schematic of autologous stem cell therapy versus allogenic stem cell therapy. Autologous methods culture cells from the patients before re-implanting them for therapeutic purposes whereas allogenic methods acquire cells from a donor. Donor cells are then cultured and implanted into the patient. 17
Figure 7. Example of an encapsulated cell. The blue surroundings represent a material used for encapsulation, generally a hydrogel material. For this project, a agarose hydrogel at various concentrations was used. Inside the microdroplet is a cell, here represented in red. Microdroplet sizes can vary depending on the application, as can the size of the cell depending on the cell line. Figure 7 is not to scale but simply a representation of an encapsulated cell. Furthermore, cell-laden microdroplets are not limited to simply one cell, but can have more than one cell. 18
Figure 8. Schematic of the benefits of cell encapsulation on cells intended to be injected into a patient for therapeutic purposes. Cells are protected from immune responses caused by foreign cells due to the inert and non-bioactive nature of selected hydrogels. Additionally, the porous nature of the hydrogel allows for cell wastes and secretions to diffuse out while allow nutrients and cell signalling molecules in. 19
Figure 9. Schematic of a typical double emulsion containing an oil layer. The schematic on the left represents a typical water-in-oil (W/O) emulsion whereas the schematic on the right shows a water-in-oil-in-water (W/O/W) emulsion. Typical emulsions done on a single chip have a layer of oil. 21
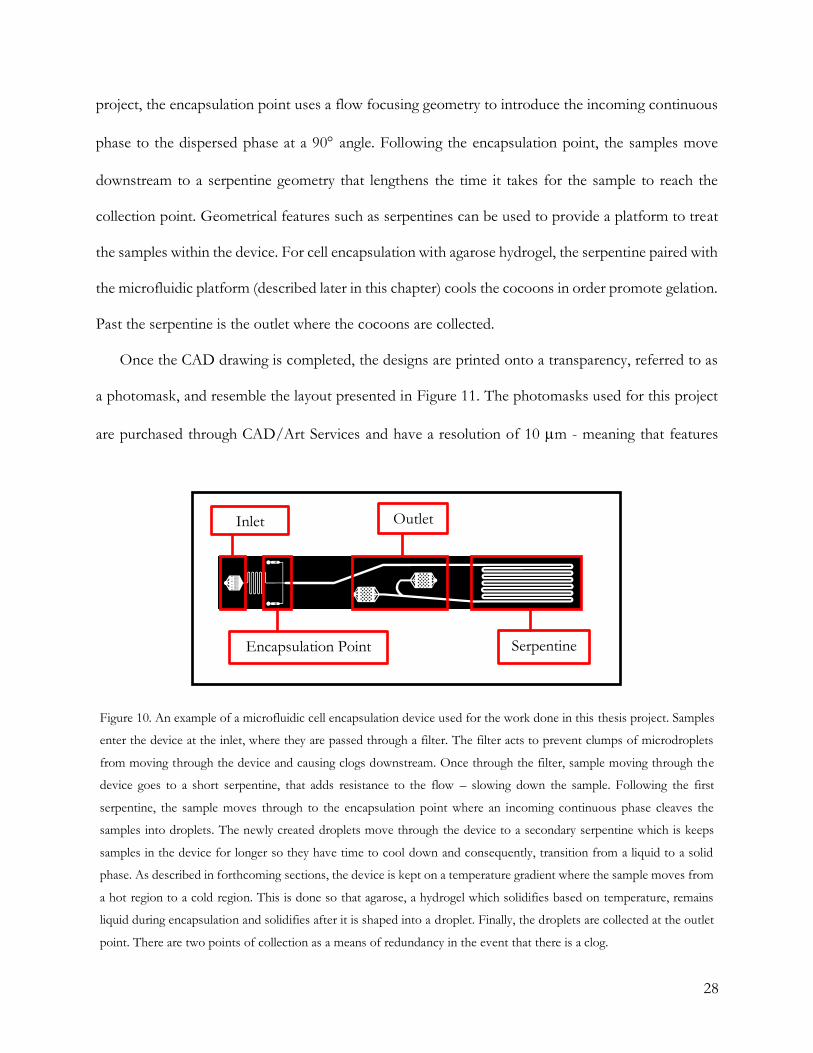
Figure 10. An example of a microfluidic cell encapsulation device used for the work done in this thesis project. Samples enter the device at the inlet, where they are passed through a filter. The filter acts to prevent clumps of microdroplets from moving through the device and causing clogs downstream. Once through the filter, sample moving through the device goes to a short serpentine, that adds resistance to the flow – slowing down the sample. Following the first serpentine, the sample moves through to the encapsulation point where an incoming continuous phase cleaves the samples into droplets. The newly created droplets move through the device to a secondary serpentine which is keeps samples in the device for longer so they have time to cool down and consequently, transition from a liquid to a solid phase. As described in forthcoming sections, the device is kept on a temperature gradient where the sample moves from a hot region to a cold region. This is done so that agarose, a hydrogel which solidifies based on temperature, remains liquid during encapsulation and solidifies after it is shaped into a droplet. Finally, the droplets are collected at the outlet point. There are two points of collection as a means of redundancy in the event that there is a clog. 27

vii
Figure 11. Photomask of microfluidic cell encapsulation devices. Microfluidic devices are designed using 2D CAD software. The design are printed onto a photomask which can then be used in a soft photolithography process to create a master mold, described in the following section. 28
Figure 12. Image of a microfluidic encapsulation device at the encapsulation point. Here, the dispersed phase arrives at the encapsulation point and is cleaved into microdroplets while the continuous phase fills the surrounding space. The two materials are immiscible so they do not mix. 28
Figure 13. Image of a silicon wafer onto which a SU-8 layer is deposited and polymerized. The photograph of the wafer has been edited to be black because the actual wafer is almost perfectly smooth and reflective, making it hard to photograph. 29
Figure 14. Overview of the soft-photolithography process. The black ellipse object represents the silicon wafer. Firstly, the wafer is cleaned and then heated. Next, using a plasma machine, the clean wafer is plasma treated. Upon plasma treating, SU-8 photoresist is added atop the wafer and it is placed in the spin-coater at a rotational speed set based on the desired height of the encapsulation device. After the spin coating process, the silicon wafer is heated and then exposed using a mask-aligner machine. A photomask is placed between the UV light and the wafer. UV light from the mask aligner will polymerize the features on the wafer and a final baking process is done to promote polymerization after exposure to UV light. SU-8 developer is used to wash the wafer in order to rinse away the photoresist that did not polymerize. Finally, the wafer is dried and ready to be used. Rationale behind the steps is described in text. 31
Figure 15. NIH 3T3 Mouse Embryo Fibroblasts. Used courtesy of Wikimedia commons. 34
Figure 16. Cell encapsulation of single emulsions with polystyrene beads and cells. 16a depicts single cell encapsulation with polystyrene beads. 16b shows single cell encapsulation with NIH 3T3 cells. 38
Figure 17. Overview of cell encapsulation. 17a describes the birds eye view of cell encapsulation. A microscope connected with a camera is used to monitor the cell encapsulation process which takes place on a pressure and temperature gradient. As the sample moves from the inlet to the outlet, the temperature goes from hot to cold – hot to maintain the hydrogel in liquid phase and cold to gel the formed droplets. In terms of pressure, the device uses a zone of high pressure to push the sample from the inlet to the outlet, which has lower pressure. The pressure gradient is set using pressure regulators that pressurize the inlet and oil channels. 17b zooms in on the cell encapsulation process. The cells suspended in a hydrogel mixture enter the encapsulation phase where they are met with immiscible oil and surfactant mixture. The hydrogel and cell sample are cleaved to create droplets, some of which are cell laden, while others are empty. Encapsulation occupancy rates are dependent on the Poisson distribution. 39
Figure 18. Microdroplet samples on a hemocytometer for microdroplet and cell counting. Figure 18 represents a quadrant of the hemocytometer slide. Four quadrants are counted and averaged, multiplied by the dilution factor and then again multiplied by 10,000 to get the total number of cells. Additionally, the sample has been mixed with a trypan blue stain, which is a dye taken up by dead cells. When taken up, the dye looks dark blue. Live cells look like a glowing white. 41
Figure 19. Creating double emulsion microdroplets. Single emulsions are purified and then mixed in with agarose hydrogels prior to being reinserted into a microfluidic cell encapsulation device. Double emulsions are again purified to get the final sample. 42
Figure 20. Double emulsion microdroplet formation. 19a depicts single emulsions with polystyrene beads whereas 19b shows double emulsions with cells. 42
Figure 21. Average cell occupancy based on cocoon diameter. As the size of the cocoons change, so does the probability of finding a certain number of cells within the droplet. The smaller droplets have a higher chance of holding 1-3 cells, while the larger droplets tend to contain more cells. The numbers in the legend list the size
of the microdroplet, thus 45 implying 45 m, and so forth. 45

viii
Figure 22. Example of timepoint photography comparing the differences between single emulsions and double emulsions over a 48 hour period. The images are used to measure viability and occupancy. One can observe, qualitatively, that there are more free cells in the single emulsion images than there are for the double emulsion images. 47
Figure 23. LIVE/DEAD stain of single emulsion cocoons. The image is a composite of a brightfield image, along with lasers illuminating fluorescent dyes taken up by the cells. The green cells indicate live cells while the red indicates dead cells. 48
Figure 24. Geometry of a microfluidic device intended to create single emulsions of 40-50 m. 50
Figure 25. Example of microdroplets being created using a single emulsion microfluidic device. The
geometry used is presented in Figure 24. The dispersed phase channel has a width of 50 m, while the
continuous phase channel has width of 30 m. The encapsulation point width is 30 m and the post-
encapsulation channel is 360 m. 51
Figure 26. Double emulsion microdroplets created using the device intended to create single emulsions. While double emulsions are created, there was little control over the sizes (the double emulsion microdroplets
averaged a size of ~90 m, while intended size was between 100 m and 120 m. 52
Figure 27. Double emulsion microdroplets created using a microfluidic device whose encapsulation point
is set 110 m as opposed to the 30 m for the single emulsion devices. Here, the droplets created are within
the intended size range of 110 m to 130 m. 53
Figure 28. First iteration of a microfluidic encapsulation device intended to create double emulsion microdroplets. 53
Figure 29. Double emulsion microdroplets created using a microfluidic device whose encapsulation point
is set to 110 m and continuous phase channel width set to 90 m. The benefit of this device is in addition to being able to produce microdroplets in the intended size range, it can be operated at a higher pressure range than the previous iteration. 54
Figure 30. Second iteration of a microfluidic encapsulation device intended to create double emulsion microdroplets. 54
Figure 31. Average size of microdroplets containing polystyrene beads and cells, where (S) refers to single emulsions and (D) refers to double emulsions. 31a. Average microdroplet size for emulsions containing polystyrene beads. Single emulsions exhibit more monodispersity than their double emulsion counterparts and the control microdroplet. 31b. Average microdroplet size containing cells. Smaller single emulsions exhibit more monodispersity than their double emulsion counterparts and the control microdroplet. 31c. Average size for microdroplets composed of 1.5% agarose. There is no difference between single or double emulsion
microdroplets containing 7.5 x 10⁶ 𝑐𝑒𝑙𝑙𝑠𝑚𝐿 versus 10 x 106 𝑐𝑒𝑙𝑙𝑠𝑚𝐿 . 31d. Average microdroplet size for microdroplets composed of 2% agarose. There is no difference between single or double emulsion
microdroplets containing 7.5 x 10⁶ 𝑐𝑒𝑙𝑙𝑠𝑚𝐿 and 10 x 106 𝑐𝑒𝑙𝑙𝑠𝑚𝐿 . 56
Figure 32. Throughput between single (S) and double (D) emulsion microdroplets. Discriminating between single emulsion and double emulsion microdroplets did little to provide a different trend in throughput. 61

ix
Figure 33. Viability of cells over 48H. 33a. Viability of 1.5% single and double emulsion microdroplets over 48H. There is no significant difference between the single and double emulsion samples at any of the time points, nor is there a significant difference within each type of microdroplet at any of the timepoints. 33b. Viability of 2% single and double emulsions over 48H. There is no significant difference between the single and double emulsion samples at any of the time points and the double emulsion samples do not show a significant difference within the samples at any time points. A difference does arise in the 2% single emulsion between 0H and 48H. There is no significant difference between 0H - 24H or 24H – 48H, however, over the duration of the experiment, the viability drops a statistically significant amount. 62
Figure 34. Viability of cells within microdroplets over a 48H period of time. 34a, 34b, and 34c show the viability over time for 1.5%, 1.75% and 2% agarose microdroplets respectively. Over time, viability dropped for all samples except for 1.5% double emulsion microdroplets. Poor viability puts into question further data points collected for egress studies and therefore these initial experiments were discarded and redone, the results of which are shown In Figure 33. 62
Figure 35. Representation of the XY, ZY and XZ planes shown in the orthogonal images. This figure aims to help visualize the planes presented in the orthogonal views. 62
Figure 36. Orthogonal view of a 2% double emulsion microdroplet. Images of the three planes helps to visualize the microdroplets in 3D space and identify their structure. 62
Figure 37. Orthogonal view of a cell-laden 2% single emulsion microdroplet. 62
Figure 38. Double emulsion microdroplet with an inner cell-laden 1.5% microdroplet that has taken up both the red and green stain from the LIVE/DEAD kit, implying an inviable cell. However, due to the brightness of the sample, it illustrates the cell position clearly. Objects within the blue box indicates it belongs to the 1.5% inner microdroplet, while the yellow boxes all indicate an outer emulsion. 62
Figure 39. Cell egress from single emulsion microdroplets at 1.5% agarose and 2% agarose concentrations,
with a cell concentration of 10 x 106 𝑐𝑒𝑙𝑙𝑠𝑚𝐿. Samples did not show a significant difference from one another, with (p=0.3 at 24H) and (p=0.07 at 48H), there was a continuous trend of cells egressing more for 2% agarose microdroplets compared to 1.5% agarose microdroplets. These results do not line up with published findings and therefore must be further investigated. 62
Figure 40. Egress of cells from double emulsion microdroplets using the adjusted and unadjusted methods. 40a. demonstrates egress of 1.5% double emulsions. There is no significant difference between the two methods (p=0.14 at 24H) and (p=0.50 at 48H). 40b. demonstrates egress of 2% double emulsions. There is no significant difference between the two methods (p=0.97 at 24H) and (p=0.32 at 48H). As there is no difference between the two methods of measurements, we can conclude that the data Is not altered using the adjusted egress counting method. 62
Figure 41. A comparison of cell egress out of double emulsion microdroplets of 1.5% and 2% inner shell concentration using the adjusted egress method. There is no significant difference in cell egress at 24H (p=0.75) and at 48H (p=0.51). 62
Figure 42. Comparison of egress between single emulsions and double emulsions at two different inner microdroplet concentrations. 42a. depicts egress between 1.5% single and double emulsions. There is a significant difference between the samples at both timepoints 24H (p= 0.04) and 48H (p=0.01). 42b. depicts egress between 2% single and double emulsions. There is a significant difference between samples at both timepoints 24H (p=0.01) and 48H (p=0.005). 62

x
LIST OF TABLES
Table 1. Types of flow given a range of the Reynolds Number. Flow regimes are considered turbulent when the Re is greater than 4000, transitional when the Re is between 2300 and 4000, and laminar when below 2300. In microfluidic systems, the Re is generally considered to be Re<<1. 7
Table 2. Average number of cells per droplet. Assuming a cell concentration of 7.5 x 10⁶ 𝑐𝑒𝑙𝑙𝑠𝑚𝐿 for single
emulsions and a cocoon concentration of 1.5 x 10⁶ 𝑐𝑜𝑐𝑜𝑜𝑛𝑠𝑚𝐿 for double emulsions, the average number of cells expected for a certain diameter is shown in Table 2. The larger the cocoon, the more likely it is that it is occupied, and this holds true for both the single and double emulsions. More so, the larger the cocoon, the higher the likelihood that it is more than one cocoon. The values in bold are the theoretical values of the sizes of microdroplets created for this project, while the other values are present to illustrate the trend. 44
Table 3. Average size and coefficient of variation of agarose microdroplet sizes containing polysstyrene beads and cells. (S) denotes single emulsion microdroplets, whereas (D) denotes double emulsion microdroplets. While figure 1 visually demonstrates the level of monodispersity, this table provides numerical values. 57

xi
TABLE OF CONTENTS
ABSTRACT ii
STATEMENT OF ORIGINALITY iii
STATEMENT OF CONTRIBUTIONS iv
ACKNOWLEDGEMENTS v
LIST OF FIGURES VIi
LIST OF TABLES x
TABLE OF CONTENTS xi
INTRODUCTION 1
Background 1
Benefits and Applications of Microfluidics 2
Single Emulsions 3
Double Emulsions 5
Microfluidics Theory 6
Reynolds Number 6
Stokes Flow 8
Droplet Formation 9
Capillary Number 11
Stem Cell Based Therapy 13
Cell Encapsulation 17
Agarose 19
Double Emulsion for Cell Encapsulation 20
Objective Statement 25
METHODS 26
Device Fabrication 26
Design 26
Master Mold 29
PDMS Casting 31

xii
Bonding 33
Cell Culturing 33
Initial Culturing 34
Sub-culturing 34
Cell Maintenance 35
Agarose Preparation 35
Cell Encapsulation 36
Single Emulsion 36
Sample Purification 40
Quantification 40
Double Emulsion 42
Poisson Distribution 43
Timepoint Imaging 45
Confocal Microscopy 47
RESULTS & DISCUSSION 49
Creating Double Emulsions 50
Size 54
Throughput 58
Viability 61
Microdroplet Structure 65
Egress 71
CONCLUSION 80
FUTURE WORK 83
REFERENCES 87

1
INTRODUCTION
Background
Advances and innovations in technologies often aim to miniaturize tools, improve cost efficiency,
and ease of use while maintaining or improving output quality. The medical field is not exempt from
this. Tools including bioreactors, implants, sensors, and imaging modalities have decreased in size
over time [1].
One such field is microfluidics, which uses chips containing channels on the order of microns to
provide an easy to use and low-cost platform to carry out biological and chemical processes.
Microfluidics can be considered both a science and a subtype of technology. The science of
microfluidics deals with pico-liter sized samples [2]. While the volumes may seem limiting in the
information they are able to provide, the forthcoming section on the applications of microfluidics will
demonstrate that, on the contrary, it is a beneficial feature that can be exploited for many purposes.
Intuition derived from working with fluids on the macro-scale may not align with the fluid
mechanics that govern a microfluidic system. For example, fluids traveling in macro-channels are
affected by both viscous and inertial forces[3]. Viscous forces are caused by shear stresses on particles
within a fluid moving against one another [4]. Resistance can be supplied from adjacent fluid particles,
the surfaces of the channels or features within the channels. Inertial forces, on the other hand, are
forces that exist due to a resistance to change in momentum [3]. In micro-channels, the flow regimes
are far more influenced by viscous forces and leave the inertial forces negligible [4]. Behaviors of
viscous-heavy flows can be studied through the Reynolds Number and Stokes flow, which will be
discussed in the upcoming sections. Principles of surface tension can be studied to understand how
fluids create droplets. An insight in the aforementioned fundamental principles aids in understanding

2
device geometries, strengths and weaknesses of microfluidic systems, and most importantly, the
applications for which they are suitable. Prior to detailing relevant microfluidic fundamentals, some
applications will be provided to explain how microfluidic technologies fit into the world of medicine
and biochemical devices.
To serve as a point of reference and orient the reader, the goal of this project is to use a droplet-
based microfluidic system to create hydrogel-in-hydrogel double emulsion microdroplets. Work done
in the Godin lab explores the benefits of encapsulating stem cells within agarose hydrogel
microdroplets with the aim of enhancing stem cell therapy. This project aims to understand how cells
behave within the confines of a microdroplet – specifically in terms of egress.
Benefits and Applications of Microfluidics
Understanding and exploiting the science within a microfluidic flow regime has led to the creation
of many technologies that propel and supplement the fields of chemistry, biology and medicine. Small
form factored microchips give way to parallelize operations for high throughput and provide a
modular platform with a diverse range of applications. Both features lead to a technology that can
save time and money while creating an uncompromised output.
Progress in soft-lithography techniques has also aided the field of microfluidics by allowing for
the fabrication and reproduction of designed devices in a short period of time (within a day). The
small form factor also creates a platform with low sample consumption rates and the close proximity
of different molecules in the channels can shorten reaction times for certain biochemical assays [5].
Microfluidic devices provide a platform for the study of individual cells by trapping them within
droplets that closely mimic their native environment – an interesting contrast to liquid cell cultures in
flasks [5]. Devices have been fabricated to perform biochemical analysis work such as polymerase
chain reactions (PCR), or to study the kinetics of enzyme assays with the goal of shortening reaction

3
times and reducing the volume of sample used [6], [7]. For example, the mixing, reacting and separating
of samples in certain immunoassays can all be done on a single chip. Cytometric alternatives to
Fluorescent Activated Cell Sorting (FACS) systems have also been developed along with biosensors,
three-dimensional cell cultures, and more [8], [9]. As a technology, microfluidic devices comfortably
find a home within the worlds of biology, chemistry and medicine, however, a review of all
microfluidic systems is beyond the scope of this work and can be found in some of the cited works
[2], [4], [5], [9], [10].
Single Emulsions
One specific use of microfluidic technology is to produce microdroplets, as seen in Figure 1.
Droplet-based microfluidics, just like the field of microfluidics at large, has found a home within many
biochemical applications. Though low sample consumption is a benefit to most microfluidic
Figure 1. Schematic of a microfluidic device creating droplets using a flow focusing geometry, discussed in the coming
sections. The yellow represents material, referred to as the dispersed phase, that will turn into a droplet, while the
blue represents an immiscible fluid, referred to as the continuous phase, which ‘cleaves’ the droplets into spheres
without mixing. Objects, such as cells and polystyrene beads, mixed in with the dispersed phase are incorporated into
the droplets.

4
applications, droplet-based devices have the advantage of creating microcompartments separated by
immiscible phases allowing each droplet to act as an individual unit. Depending on the type of channel
configurations, droplet-sized bioreactors can be used to carry out replicate experiments or a variety of
experiments – allowing for a flexible platform [11].
Work done by Emilie Mercey et al. demonstrates that using droplet-based microfluidic devices,
nano- to picoliter sized droplets containing a specific digestive enzyme and its target protein can be
created, processed by means of mixing, incubated, and then analyzed all on-chip [12]. The study was
able to demonstrate the ability of microfluidics to carry out assays rapidly due to the low sample
volumes. Detection of specific bovine biomarkers was possible with sample volumes of less than 1
nanoliter using fully integrated microfluidic devices [13]. By incorporating different solutions, spacers
between the droplets made of immiscible fluids prevented mixing of samples and contaminants.
Additionally, isolated droplets were able to provide statistical power as each droplet could be counted
as an individual experiment/data-point.
Within the scope of drug delivery systems, versatility of microfluidic devices can be exemplified
through a study which created monodisperse droplets that solidified through the exposure of UV light
and then later released the contents over time as the polymerization process began to reverse [14].
Finally, in the field of biological sciences, droplet-based microfluidics have been used to study a
population of nematodes, Caenorhabditis elegans, a species often studied in the field of developmental
neurobiology [15]. Researchers were interested in imaging their first larval stage, referred to as L1,
however the species is highly mobile which made them particularly difficult to handle and manipulate
while taking quality images. Using droplet-based microfluidics in conjunction with a hydrogel that gels
and melts at specific temperatures, researchers were able to encapsulate the nematodes inside of a

5
droplet, solidify the droplet, and then image the otherwise hard to image sample [15]. Further work
with droplet-based microfluidics can be found in reviews cited in this work [16], [17].
One specific use of microfluidic devices is to encapsulate cell populations. Droplets can be used
to isolate single cells and the process has found applications within biochemical and medical research.
Encapsulation of single cells using microfluidic devices has been used to isolate cells and study their
secreted metabolites, as described in the manuscript by Yin & Marshall [18]. Their work takes isolated
cells and provides each sample with various concentrations of drugs using the laminar flows present
in a microfluidic channel while studying the effects of each individual cell. Another study used
microfluidic devices to encapsulate cells within an agarose hydrogel microdroplet to study their
genomic and proteomic outputs by supplementing agarose with markers to indicate antibody secretion
[19].
Double Emulsions
To create a double emulsion, the initial microdroplet must be encapsulated again, leading to a
droplet-in-droplet sphere. Double emulsion microdroplets have been used for drug delivery systems,
as well as in the make-up and food industries [20]. Common double emulsion configurations include
alternating immiscible fluids such as water-in-oil-in-water (w/o/w) or oil-in-water-in-oil (o/w/o).
Benefits of using a second emulsion is that the product is able to have previously incompatible
features. Immiscibility of oil and water leads to isolated compartments that can prevent inter-
compartmental transfer and contamination. In pharmaceuticals, the outer layer is used as a means to
protect drugs from the biological environment, mask unpleasant flavors of certain drug ingredients
and create coatings that dissolve at the presence of molecules found in specific target locations, leading
to a targeted drug [21]. Markers or stains that could otherwise be toxic to cells can be incorporated
into an outer layer, successfully separating the two components [22]. Using multiple channels
controlled by valves, the outer emulsion can be tuned and the effects of a different surrounding

6
microenvironment can be studied with cells [23]. Similar to cell studies using single emulsions, double
emulsions would be able to monitor the effects of different external environments on a single cell, as
opposed to with a 2D petri dish. Uses of double emulsions, especially in terms of cell encapsulation,
will be expanded upon in upcoming sections.
Microfluidics Theory
Behavior of fluids in a microchannel is largely governed by viscous flow – flow that is influenced
by shear stresses applied to the particles of the fluid [24]. Such a flow regime leaves inertial effects
negligible and the behaviors can thus be understood through the concepts of the Reynolds Number,
Re, Stokes Flow and the capillary number, Ca [24].
Reynolds Number
Intuitively, the Reynolds number is the ratio of inertial forces to viscous forces. If inertial forces
dominate a system, then the Reynolds number will be large; if viscous forces dominate a system, the
Reynolds number will be small [25].
𝑅𝑒 = 𝐹𝑖𝑛𝑒𝑟𝑡𝑖𝑎𝑙
𝐹𝑣𝑖𝑠𝑐𝑜𝑢𝑠
Formally, the Reynolds number is a dimensionless value defined by the product of the density (𝜌),
speed (𝑢), and travelled length (𝐿) over the viscosity of the fluid (𝜂) [25].
𝑅𝑒 = 𝜌𝑢𝐿
𝜂
Flow is considered laminar when the Re is less than 2300, in transition when the values are between
2300 and 4000, and turbulent when the number is greater than 4000, shown in

7
Table 1 [26]. Turbulent flow is identified through chaotic fluctuations in velocity, pressure, and
density, and has the presence of random eddies and irregularities that lead to random spatio-temporal
variations as shown in Figure 2 [27]. Mixing of flow streams takes place in turbulent flows. In a laminar
flow regime, there are no fluctuations that arise from the time dependent and independent variables.

8
Lack of fluctuations leads to a smooth flow with no random or chaotic mixing in the system but rather
through diffusion at the fluid-to-fluid interfaces in a multiphasic flow [28].
Flow regimes within droplet-based microfluidic devices are by and large laminar in nature.
Multiphasic flows do not mix outside of surface diffusion and the movement of particles is fairly
predictable.
Table 1. Types of flow given a range of the Reynolds Number. Flow regimes are considered turbulent when the Re is
Figure 2. Laminar flow versus turbulent flow. Laminar Flow has smooth flow patterns with no chaotic mixing at any
point. Should there be a multiphasic flow, mixing will only take place through diffusion at the fluid to fluid interfaces.
Turbulent flow contains more chaotic flow patterns. Fluids often mix at random points and there are eddies which
cause disturbance in the flow.

9
greater than 4000, transitional when the Re is between 2300 and 4000, and laminar when below 2300. In microfluidic
systems, the Re is generally considered to be Re<<1.
Type of Flow Reynolds Number (Re)
Laminar < 2300
Transitional 2300 < Re < 4000
Turbulent > 4000
Stokes Flow
As mentioned in the previous section, fluids are almost exclusively influenced by viscous forces
rather than inertial forces at the microfluidic scale and thus attributed with a low Re [29]. Transitioning
from turbulent to laminar flow is considered to be when the Reynolds number is less than 2300,
however, flows in microfluidic channels are assumed to have Re << 1 [30]. With a significantly small
Re, the flow within a microchannel operates under parameters described by the Stokes Flow equation,
also referred to as the creeping flow. Stokes Flow is an interpretation of Newton’s second law which
states that the net force acting on an object is equal to the product of its mass and acceleration, with
the terms swapped out for forces and accelerations present in a microfluidic channel. Change in
pressure across an area, such as within a microfluidic channel, can be referred to as a pressure gradient.
While pressure is described as force per unit area, a change in pressure in a gradient over a constant
area suggests a change in force, which can only come about given an acceleration. This force moves

10
from the region of high pressure towards the region of lower pressure. The equation for Stokes flow
looks as such:
where P is the pressure gradient, is the viscosity, and u the velocity. On a macroscopic scale,
Stokes Flow can be seen in highly viscous fluids such as honey or molasses, shown in Figure 3.
Movement of these highly viscous fluids are so strongly impacted by the frictional forces that the
inertial effects are almost wholly ignored, leading to a laminar flow. Such imagery can also accurately
describe how fluid might move around obstacles in a microfluidic channel [31].
Droplet Formation
Microfluidic devices containing a biphasic flow can generate droplets using specific geometries.
Biphasic flows consist of two immiscible fluids, one referred as the continuous phase and the other
the dispersed phase. The continuous phase is the fluid that acts as a ‘cleaving agent’ in order to create
{{m • a
Product of mass &
acceleration Sum of forces acting on an
incompressible fluid
ΣF
{pressure
gradient
viscous
force{
Figure 3. Visual representation of flow patterns
around an object when operating in a flow-regime
described by stokes flow, or creeping flow. Viscous
fluids tend to wrap around an object and revert back
to their initial positioning, much like the behavior of
molasses or honey.

11
droplets and the dispersed phase is the substance which is shaped into the droplets [32]. Often times,
as is the case for this project, the continuous phase is an oil that may be paired with a surfactant to
prevent coalescence, and the dispersed phase is a liquid that is immiscible to the oil such as water and
agarose hydrogel. Surfactants are amphiphilic in nature, meaning they have a polar and non-polar side,
which allows them to reduce surface tension at the oil-droplet interface [33].
Formation of droplets in a microfluidic regime is based on the interfacial tension between the two
fluids, the surface chemistry and the geometry of the device [34]. Co-flow, flow-focusing or T-junction
geometries are most commonly used for droplet formation, and each geometry can be seen in Figure
4.
Co-flow geometries contain two coaxial channels, with an inner channel generally made of a glass
capillary tube and an outer channel made of polydimethylsiloxane (PDMS). If the outer flow and inner
flow move in the same direction, the contents of the inner channel become droplets; if the flows move
in opposite directions, the outer fluid material is cleaved into a droplet [20]. Co-flow geometries have
been found useful in many industrial microfluidic applications that require the creation of especially
small droplets, down to 10 μm in size. Additionally, because the channel orifices are not in contact
with the walls, the devices are safe to use for a prolonged period of time without worry of
Figure 4. Common microdroplet production geometries.

12
contamination. Disadvantages of co-flow geometries include difficulties in fabrication and a time-
consuming preparation process [35].
T-junctions work by squeezing the dispersed phase against the continuous phase. Here, the size
of the microdroplet formed is based on the ratio of the flows rates and the widths of the channels.
Although surfactants help stabilize droplets, it has been found that droplets can be formed simply by
properly balancing the flow rates [36]. Droplets formed using a T-junction geometry can be configured
to act as a droplet or a plug based on the surface tension [37].
A flow focusing geometry operates on similar principles as the T-junction, however, it has two
channels that intersect the dispersed phase at the encapsulation point, leading to a higher droplet
throughput, and allowing for the production of tunable droplets without depending on the specific
channel size [38], [39]. More so, the flow focusing geometry is better equipped to more easily change
droplet sizes using pressure regulators [40]. Flow focusing geometry can create both droplets and jets
depending on the flow stability. A stable flow will produce jets, which are elongated microdroplets,
while unstable flows will immediately break up at the phase junction, leading to the production of
droplets. Because inertial effects are negligible in microfluidic devices, the major factor of droplet
production in a flow-focusing junction is the capillary number.
Capillary Number
The capillary number, Ca, is a dimensionless number that describes the effects of viscous forces
and surface tensions acting at the interface of two fluids. Intuitively, the Ca can be thought of as the
ratio of viscous forces to the surface tension.
𝐶𝑎 =𝑣𝑖𝑠𝑐𝑜𝑢𝑠 𝑓𝑜𝑟𝑐𝑒𝑠
𝑠𝑢𝑟𝑓𝑎𝑐𝑒 𝑡𝑒𝑛𝑠𝑖𝑜𝑛

13
Surface tension effects at a flow focusing junction aim to create a shape with the lowest possible
surface energy and effectively describe the formation of microdroplets. Polydispersity in the size of
the formed droplets is based on the viscosities of the fluids in the continuous and dispersed flow
regimes [41]. The size of the droplet is related only to the ratio of the flow rates in the dispersed and
continuous phases, which can be demonstrated in our systems [34]. Using physical terms, Ca is then
defined as:
𝐶𝑎 =𝜇𝑉
𝜎
where 𝜇 is the dynamic viscosity, 𝑉 is the velocity and 𝜎 is the surface tension between the fluid
interfaces. At the encapsulation point, one can assume a constant viscosity and velocity, thus the
production of microdroplets are dependent on surface tension. When the surface tension is low, the
molecules of the flowing material will have a tendency to break up from contact with the interjecting
continuous flow, and thus lead to droplet formation. When the surface tension is high, the molecules
will a tendency to stick together and fight against the forces of the incoming continuous phase. Low
Ca implies an increased presence of surface tension forces, suggesting that droplets are unlikely to
form. Bonds between the droplets favour ‘staying together’ while a high Ca puts focus on the viscous

14
forces and consequently encourages the break-up of streams into droplets. High and low Ca can be
correlated to jetting and droplet regimes as shown in Figure 5.
To further promote the formation of droplets, surfactants are mixed in with the oil. Surfactants
are amphiphilic substances, meaning they have a hydrophilic and hydrophobic side, that are
responsible for reducing the surface tension and consequently promoting droplet formation [42].
Stem Cell Based Therapy
One specific application of droplet-based microfluidics is in the context of stem cell-based
therapy, or cell therapy. In short, cell therapy aims to provide a therapeutic effect to damaged tissue
via the presence of therapeutic cells such as stem cells, progenitor cells and others [43]. This method
of therapy certainly has advantages as illustrated by its growing use, but it is not without limitation
such as the need for continuous immunosuppression, potential for graft rejection and a lack of cell
Figure 5. Droplet production in a system with low capillary number versus high capillary number. Surface tension
forces dominate flow regimes with a low Ca and lead to a jetting regime while viscous forces dominate regimes with
a high Ca and it forms droplets.

15
retention [44]. Microfluidic devices that encapsulate the stem cells in a protective microdroplet can be
used to offset some of the inherent limitations and increase the therapeutic outcome.
Cell therapy aims to forego the management approach of pharmaceuticals and instead treat the
underlying cause to restore lost functionality by supplying the target location with functional stem cells
that work through engraftment and paracrine signaling mechanisms [45], [46]. The principle for cell
therapy is to use adult undifferentiated cells, which are cells that have yet to develop into a specialized
cell line, and implant them at the target location [17]. Adult stem cells are obtained from postnatal
subjects, pluripotent in nature and have been found to play a crucial role in maintaining tissues during
regular cell regeneration cycles [47]. The adult undifferentiated cells offer three main advantages.
Firstly, the stem cells can be harvested and cultured, which means that upon collection from a patient
or donor, the cell line can be cultured in a lab and kept frozen to be re-cultured when needed. Secondly,
stem cells are mobile within the body and can move to neighboring regions post-implantation. Finally,
stem cells are able to carry out normal metabolic functions and act as native cells to the damaged tissue
[48].
Various forms of stem cell therapy exist at both the research and clinical stage. Stem cell therapy
has been used in many clinical applications. For example, a study on mice with regions of infarcted
myocardium found that the presence of bone marrow derived stem cells provided a therapeutic effect
by reducing the size of the damaged tissue while also regenerating myocardial functions [45]. Human
Mesenchymal Stem Cells (hMSCs) are used in a variety of applications for therapeutic outcomes in
cardiovascular diseases, in neurological system injuries, as well as damages to bones, tendons, cartilage
and meniscus [49], [50]. Therapeutic outcomes are thought to be caused by the secretion of trophic
factors, which are chemicals with anti-inflammatory and angiogenesis promoting effects that reduce
the likelihood of apoptosis in cells [51]. Clinical trials are ongoing with cardiac stem cells for the use
of ischemic heart failure treatments [52]. Although the exact mechanisms for stem cell therapy are not

16
fully understood for each application, it is widely accepted that a significant amount of benefits come
from the presence of stem cells and allowing said cells to undergo their normal functions [53].
Cell therapies can be differentiated into two overall categories, autologous and allogenic,
depending on where the cells are harvested from [54]. A schematic of autologous and allogenic method
is shown in Figure 6. Autologous approaches involve taking adult stem cells from the patients,
harvesting the cells, and reintroducing them at the target location; allogenic approaches take cells from
a donor source [54]. There are many factors that go into selecting which approach is appropriate.
Autologous cells are convenient because the process forgoes the need for tests ensuring cell
compatibility. Survival rates from autologous cell therapy treatments are greater than 95% in a majority
of the studies and are not significantly affected by the age of the patient, which can be an issue in the
allogenic approach [55]. Unfortunately, samples collected from the patient may not be of usable
quality. Other ailments the patient may be experiencing in addition to the disease in question may
harm the viability and usability of the stem cells. Outcome of the autologous approach is also
dependent on previous treatments the patient has undergone [55]. It has been found that the relapse
rate of the disease is greater in autologous stem cell therapy than the allogenic counterpart [55][10].
Stem cells taken from a donor ensure a lack of malignant cells that can otherwise be found in the
patient. Cells harvested in a bank are generally well preserved and selected for the best phenotypical
traits, therefore the quality is often better than stem cells collected for autologous therapies [53].
Cardiovascular, neurological, and orthopedic disease recurrences are also lower in allogenic
approaches, and because of stem cell banks, cells are more readily available [53]. Much like its
autologous counterparts, allogenic cell therapy approaches have their share of issues. First and most
importantly, allogenic cell therapy involves using foreign cells in a biological system which has inherent
immune risks, the most fatal being graft versus host disease (GVHD), an ailment in which the patient’s
immune system rejects the donor cells [55]–[57]. To prevent GVHD, the patient has to undergo pre-

17
treatment immune suppression which may not be suitable for older patients and consequently,
allogenic methods are most generally reserved for younger patients in otherwise good health [55], [56].
Regardless of the type of cell therapy, there are still risks associated with the approach as well as
points where improvement is needed. One point of focus is on the issue of cell retention. Of all the
cells injected into a sample, only a small amount remains at the intended target location. A study
published in Nature Communications found that in some cases there is less than 10% retention hours
after injection [58]. As the effectiveness of cell therapy is thought to be based on the presence of stem
cells at the target location, losing a significant number of cells is problematic. Although a work around
to this issue could be solved by increasing the number of cells that are injected, a greater number of
injected cells, especially when coming from a foreign host, can lead to a higher chance of GVHD [59].
Therapeutic effects of stem cell presence at the target location is limited by the metabolic output,
which takes place when the cell has access to the appropriate nutrients (i.e. oxygen). It has been
reported that in the standard cell-based therapy method, there is issue with a sufficient amount of
oxygen reaching the cells [58], [60]. Another major issue is that, because the majority of cells are from
a donor sample, GVHD may occur if the stem cells has not been purified [56].
Advances in microfluidic technologies and droplet formations have shown great potential in the
aid of stem cell-based therapies. Stem cells used in the treatment of isolated tumors have benefited
from the long-term protection provided by a hyaluronic acid (HA) hydrogel shell, enabling the release
of beneficial proteins over time [61]. Embryonic stem cells (ESCs) used in heart cell replacement
therapies were found to express beneficial biomarkers and proliferate at a higher rate when cultured

18
after being encapsulated in a hydrogel [62]. For further applications of cell encapsulation in cell
therapy, a review is provided [63].
Cell Encapsulation
The process of cell encapsulation involves placing therapeutic cells within a microdroplet prior to
delivery – and is done so to enhance the therapeutic efficacy by ensuring viability, promoting
engraftment and enhancing retention [64]. Generally, the microdroplet is composed of a hydrogel
polymeric matrix. Such matrices provide a semi-permeable structure from which waste products from
the cell are able to leave and nutrients such as oxygen and cell signaling molecules are able to enter.
Materials chosen for the polymer are also selected to be inert and biocompatible so as to not trigger
Figure 6. Schematic of autologous stem cell therapy versus allogenic stem cell therapy. Autologous methods
culture cells from the patients before re-implanting them for therapeutic purposes whereas allogenic methods
acquire cells from a donor. Donor cells are then cultured and implanted into the patient.

19
an immune response from the patient and prevent adverse effects to the cell [65]. A schematic of a
cell encapsulation can be seen in Figure 7 while the benefits are shown in Figure 8.
Encapsulation can be done using two methods. Vortex-based encapsulation involves mixing cells,
the hydrogel polymer and oil on a vortex machine [66]. While this method does indeed encapsulate
therapeutic cells, the microdroplets created are highly polydisperse in size. Depending on the
application, such as lung therapy where the channels are small, polydisperse samples need to be filtered
for size. Doing so eliminates the larger droplets which are more likely to contain cells [22]. Creating
polydisperse samples also reduces the ability to control the approximate cell distribution within the
droplets. One might desire such control when cells are limited and need to be distributed.
The second method of cell encapsulation is through the use of microfluidic devices, which offers
clear advantages to the vortex-based method. First, and arguably the most important, is that the
microdroplets created are monodisperse in size – sometimes with a polydispersity range of between
1% to 3% [67]. This is significant as it allows studies to hold the volume of the microenvironment
relatively constant between experiments while giving the operator the ability to change sizes rather
quickly by changing pressure ratios. Secondly, controlling the environment of microfluidic devices
Figure 7. Example of an encapsulated cell. The blue
surroundings represent a material used for
encapsulation, generally a hydrogel material. For
this project, a agarose hydrogel at various
concentrations was used. Inside the microdroplet is
a cell, here represented in red. Microdroplet sizes
can vary depending on the application, as can the
size of the cell depending on the cell line. Figure 7
is not to scale but simply a representation of an
encapsulated cell. Furthermore, cell-laden
microdroplets are not limited to simply one cell, but
can have more than one cell.

20
with regards to temperature is far quicker, on the timescales of 10-3 seconds to 1 seconds compared
to bulk samples which can take as long as 104 seconds [68]. Devices are made to function specific so
the opportunity for sample manipulation is extensive. For example, through minor modifications in
the form of addition/subtraction or reorientation of microchannels, a polydimethylsiloxane (PDMS)
based microfluidics chip can be quickly fabricated to incorporate hydrogels that work based on
different gelation and melting principles such as agarose hydrogels, which work based on a
temperature gelling regime, to say alginate, which requires the presence of calcium carbonate to begin
gelling instead of temperature [69]. Finally, the number of cells that end up in the agarose
microdroplets can be approximated and controlled using statistical models, in particular microfluidics
cell encapsulation follows a Poisson distribution, a concept elaborated on in the methods section [70].
Agarose
Agarose is a fairly stable hydrogel that has been extensively studied for applications in the food
industry, separation of DNA in gel-based electrophoresis, as well as for cell culturing purposes [71]–
[74]. As a biomedical material, it has been FDA approved and used as a biocompatible, inert, and
non-cytotoxic platform for work with cells, with the additional benefits of being soft as to stimulate a
natural cell environment while being transparent, allowing for easy visualization of cells [74]. The
Lymphocytes
Nutrients
Cell waste
Figure 8. Schematic of the benefits of cell
encapsulation on cells intended to be injected
into a patient for therapeutic purposes. Cells
are protected from immune responses
caused by foreign cells due to the inert and
non-bioactive nature of selected hydrogels.
Additionally, the porous nature of the
hydrogel allows for cell wastes and secretions
to diffuse out while allow nutrients and cell
signalling molecules in.

21
gelling kinetics of agarose hydrogels are temperature based, which make it possible to easily control
on a microfluidic platform with heating and cooling elements. Ultra-low gelling point agarose
transitions from solid to liquid at 37 C and gels at around 15 C [75], a range of temperatures well
tolerated by therapeutic stem cells [76]. The porosity and rigidity of the hydrogel can also be controlled
using agarose concentration. Porosity is ideal for allowing cells to undergo normal metabolism
functions, allowing the metabolites to leave the encapsulation, and receive nutrients such as oxygen
and cell signaling molecules from neighboring cells and native biology.
More so, each microcapsule can only hold a certain number of cells based on volume and thus the
competition for nutrients in the microenvironment is far less than it would be under standard
conditions where cells are injected together into the target location [77]. Rigidity of the agarose
provides adherent cells a three-dimensional platform as opposed to the 2D platform of cell culture –
more closely mimicking a natural biological environment. Cells within a microdroplet also benefit
from the inert nature of agarose, as it helps prevent immune responses caused by the presence of
foreign bodies within the patient’s internal biology, leading to major benefits such as the reduction in
the likelihood of GVHD. Finally, perhaps due to the sticky nature of hydrogel, encapsulated stem cells
have a much higher rate of retention at target locations [78], [79].
Double Emulsion for Cell Encapsulation
Using microdroplets in conjunction with cell therapy provides an effective approach to enhancing
treatment efficacy, however, not all is known about how cells behave post-encapsulation.
Investigations into cell viability, presence or absence of specific extracellular matrix (ECM) proteins
are on-going for therapeutic cells inside of microdroplets [80]. Understanding the mechanisms of cell
egress is also subject to investigation as it has been found that for each injected sample, some cells
exit the microdroplets [81]. It is still unclear as to what causes the cells to egress out. Knowledge of

22
cell behavior allows for clinicians to tune whether the therapeutic cells leave the microdroplet and
move towards the target location, or if the therapeutic cells stay within microdroplet for their
therapeutic effect. Certain therapies may require the direct contact between the therapeutic cell and
the target tissue, while other times, the therapeutic outcome is dependent on the cell secretions that
take place from within the protection of the microdroplet [82].
It is hypothesized that it is more likely the cells at the edges of the cocoons that tend to leave,
while the cells positioned away from the edges of the cocoons remain inside. To test this hypothesis,
this project aims to create double emulsions in order to push the cells away from the edges of a
microdroplet. The second emulsion will be made of an identical material and simply extend the pre-
existing droplet. Concentration of the outer hydrogel shell will not change and there will be no barrier
between the inner and outer shell.
Double emulsions, for cell encapsulation and otherwise, generally have an in-between oil layer
which limits their application, as shown in Figure 9. Microfluidic devices with a T-junction geometry
were used as far back in 2004 to create double emulsions [83]. Double emulsion microdroplets
Figure 9. Schematic of a typical double emulsion containing an oil layer. The schematic on the left represents a typical
water-in-oil (W/O) emulsion whereas the schematic on the right shows a water-in-oil-in-water (W/O/W) emulsion.
Typical emulsions done on a single chip have a layer of oil.

23
produced by the group Okushima et al was done as a proof of concept and had the water-in-oil-in-
water (W/O/W) and oil-in-water-in-oil (O/W/O) configuration [83]. A review of double emulsions
presented by Wang et al. describes an ample amount of ways that double emulsions are created [21]
and the information that follows will be adapted from said review in the subsequent paragraph.
Production of double emulsions initially started via a whole batch mixing method, much like for
single emulsions. Droplets would be created in a two-stage process with an initial mixing followed by
a gentler mixing stage to create the inner and outer emulsion respectively. The mixing approach
suffered from a reduced occupancy load due to the shear stress causing cells to pop out.
To address the limitations of the mixing method, a membrane emulsification method was created
which involved letting droplets pass through a membrane of a specific size and exploiting properties
of surface tension to create droplets. Membrane emulsification created reasonably sized microdroplets
and reduced the shear stresses placed on the droplet but was more difficult to control in terms of
occupancy.
It was then that the droplet microfluidics was used to create double emulsions. The benefits of
using microfluidics was that the designs intended for single emulsions could easily be translated to
double emulsions. Co-axial, T-junction and flow focusing geometries all worked to create double
emulsions and have been demonstrated. It brings with it the advantages of microfluidic systems as
well such as highly monodisperse samples, scalability and control over both the inner and outer droplet
volumes.
Outside of being a technological achievement, double emulsion microdroplets have found many
applications. One such use of double emulsions was demonstrated by Martinez et al. in 2012 with an
early use of double emulsion microdroplets for cell encapsulations [84]. Cell laden alginate hydrogel,
which requires the presence of Ca2+ to cross link, was carried in a secondary oil shell to an off chip
CaCl2 solution, where the inner alginate shell had time to cross link before it exited the double emulsion

24
droplet. As a drug carrier, alginate double emulsions have been created in an O/W/O configuration
whose phase properties are controlled via the presence of crosslinking molecules. This property has
been used to allow drugs to be loaded after the capsules are created to protect drugs from the capsule
preparation process [85][93]. Another use of double emulsions is to use the capsule as a bioreactor.
Engineered bacteria encapsulated inside the inner droplet of a double emulsion system was monitored
for gene activity and fluctuations in cell secretions as the outer shell was created with engineered
fluorinated oil that allowed for nutrients to enter while keeping the cell secretions in place over time
to be monitored [86].
The aforementioned examples all tend to exploit a significant characteristic of double emulsions
– compartmentalization. Outer shells, especially when made of oil do an excellent job of keeping
diffusive transport low. In fact, bioreactors, such as in the work mentioned in the previous paragraph
[86], have to modify the oil used in order to allow for diffusivity of molecules such as oxygen. Double
emulsions created in this project are unique compared to what is found in literature because they are
hydrogel-in-hydrogel with a lack of oil layer in-between. While this eliminates the benefit of
compartmentalization presented in the previous works, it offers a set of new advantages. Hydrogel-
in-hydrogel microdroplets offer the same benefits to encapsulated cells as their single emulsion
counterpart in terms of protection from immune responses, ability expel cell secretions, which can
aide in paracrine responses, while receiving nutrients such as oxygen and larger molecules needed for
viability. Function-based modularity is another useful feature of double emulsion droplets. As seen in
the previous examples of double emulsion microdroplets, each shell can be designed based on a
desired function. Outer shells might act as a means of protection for cells from things such as
fluorescent dyes which are cytotoxic, or from shear forces that could damage the viability of cell lines
or the molecular integrity of drugs. There are a plethora of examples in which hydrogels are modified

25
based on their usage and creating a hydrogel in hydrogel double emulsion opens up the possibility of
using different types of hydrogels based on application [87].
Studies which explore tuning cell egress in single emulsions have recently been published in which
agarose hydrogels are imbued with ECM proteins to change the behavior of cells [82]. While the work
in the previously mentioned paper explores tuning egress using biocompatible chemicals, double
emulsions provide a platform which does not change any of the hydrogel properties, outside of size.

26
Objective Statement
Work done towards the completion of this project is carried out in three steps. Firstly, a process
of creating hydrogel-in-hydrogel double emulsion microdroplets is established and characterized. The
double emulsion microdroplets will not contain an intermediate oil layer or shell and the
characterization process will identify the level of polydispersity and throughput. Secondly, NIH 3T3
cells are incorporated into the double emulsion microdroplets platform in order to test the impact on
cell viability. Finally, the hypothesis on cell egress is tested using the developed system. Successful
completion of this project will not only provide a means of controlling cell egress, it will also establish
a proof of concept method to creating modular double emulsion platform which can incorporate
multiple materials based on intended functionality.

27
METHODS
Device Fabrication
Microfluidics has often followed trends in microelectronics and fabrication techniques are no
exception. Initially, to create microfluidic devices, one would use the method of photolithography and
etching. Despite the precision of the techniques, they were found too expensive and
unaccommodating for exploratory purposes. For these reasons, soft-lithography was developed. Soft-
lithography offers a method to create replicable microfluidic devices using soft biocompatible
polymers such as polydimethylsiloxane (PDMS) [88]. Previous work done in the lab had produced
microfluidic devices capable of effectively and consistently creating droplets within the range of 40-
50 micron in diameter. The devices were, however, not suitable for creating double emulsions given
the height and width of the channels at the encapsulation point – points discussed in the results. Work
on this project explored adapting the existing single emulsion microfluidic device geometries to suit
the creation of hydrogel-in-hydrogel double emulsion microdroplets.
Design
Microfluidic devices are designed using computer-aided drawings (CAD). Designs for this project
are created in AutoCAD ® software, an example of which is shown in Figure 10. Cell encapsulation
devices can vary in finer details but all possess an inlet, an encapsulation point and an outlet. The inlet
of a microfluidic device is the point at which the sample is introduced into the device. Due to potential
impurities in the sample, the inlet is equipped with an array of posts which act as a filter to block large
contaminants from moving through the device and causing a clog downstream. The encapsulation
point is where the sample, referred to as the dispersed phase, meets the incoming immiscible fluid,
referred to as the continuous phase, as illustrated in Figure 12. At this point, the two fluids meet and
the continuous phase acts as a cleaving agent of sorts and creates microdroplets or ‘cocoons’. In this
28
project, the encapsulation point uses a flow focusing geometry to introduce the incoming continuous
phase to the dispersed phase at a 90 angle. Following the encapsulation point, the samples move
downstream to a serpentine geometry that lengthens the time it takes for the sample to reach the
collection point. Geometrical features such as serpentines can be used to provide a platform to treat
the samples within the device. For cell encapsulation with agarose hydrogel, the serpentine paired with
the microfluidic platform (described later in this chapter) cools the cocoons in order promote gelation.
Past the serpentine is the outlet where the cocoons are collected.
Once the CAD drawing is completed, the designs are printed onto a transparency, referred to as
a photomask, and resemble the layout presented in Figure 11. The photomasks used for this project
are purchased through CAD/Art Services and have a resolution of 10 m - meaning that features
Inlet
Encapsulation Point
Outlet
Serpentine
Figure 10. An example of a microfluidic cell encapsulation device used for the work done in this thesis project. Samples
enter the device at the inlet, where they are passed through a filter. The filter acts to prevent clumps of microdroplets
from moving through the device and causing clogs downstream. Once through the filter, sample moving through the
device goes to a short serpentine, that adds resistance to the flow – slowing down the sample. Following the first
serpentine, the sample moves through to the encapsulation point where an incoming continuous phase cleaves the
samples into droplets. The newly created droplets move through the device to a secondary serpentine which is keeps
samples in the device for longer so they have time to cool down and consequently, transition from a liquid to a solid
phase. As described in forthcoming sections, the device is kept on a temperature gradient where the sample moves from
a hot region to a cold region. This is done so that agarose, a hydrogel which solidifies based on temperature, remains
liquid during encapsulation and solidifies after it is shaped into a droplet. Finally, the droplets are collected at the outlet
point. There are two points of collection as a means of redundancy in the event that there is a clog.

29
smaller than 10 m cannot be used in the design. Once the photomask is acquired, a master mold
can be created.
Dispersed Phase
Continuous Phase
Figure 12. Image of a microfluidic encapsulation device at the encapsulation point. Here, the dispersed phase arrives
at the encapsulation point and is cleaved into microdroplets while the continuous phase fills the surrounding space.
The two materials are immiscible so they do not mix.
Figure 11. Photomask of microfluidic cell encapsulation devices. Microfluidic devices are designed using 2D CAD
software. The design are printed onto a photomask which can then be used in a soft photolithography process to
create a master mold, described in the following section.

30
Master Mold
A significant advantage of using soft lithography in microfluidic device fabrication is that once the
master mold is created, it can be used repeatedly to create replicate devices. Due to the size of
microfluidic device features, small contaminants can have big impacts, and therefore, it is necessary
to create the master mold in a clean room which controls for temperature, humidity, pressure as well
as dust and debris [88]. For this reason, all steps associated with creating a master mold are done
within the confines of a clean room and the operator is equipped with a headcover, face mask, coverall,
gloves and shoe covers.
The master mold itself is created on the surface of a clean silicon wafer with a nearly flat surface,
as shown in Figure 13, and the entire process is described at a high level in Figure 14. Cleaning is
done by rinsing the silicon wafer with acetone, then ethanol and finally isopropyl alcohol. Once the
wafer has been cleaned with all three chemicals, the chemicals are blown off using clean N2 air after
which the wafer is dehydrated on a hot plate set to 115 °C for 2 minutes. After heating, the silicon
wafer is oxidized via plasma treatment at 150 W for 5 minutes in order to increase the spreading of
the negative photoresist, SU-8 in this case. Plasma treatment aides in wetting the surface and thus
Figure 13. Image of a silicon wafer onto which a SU-8 layer is deposited and polymerized. The photograph of the
wafer has been edited to be black because the actual wafer is almost perfectly smooth and reflective, making it hard
to photograph.

31
promotes adhesion of hydrophobic SU-8 photoresist on the silicon wafer [89]. SU-8 photoresist coats
the silicon wafer and polymerizes when exposed to UV light [90].
Creating a thin film on the silicon wafer requires the use of a spin coater, which creates an even
layer of photoresist atop the silicon wafer at a height determined by the user. Spinning the silicon
wafer on the spin coater spreads the SU-8 wafer at a height inversely proportional to the spin speed.
A protocol provided by MicroChem® is used for the creation of our master molds [91]. For the
purposes of this study, devices intended for single emulsions were fabricated at a height of
approximately 60 m while devices intended for use in double emulsions were fabricated at a height
of 160 m. Here, the height of the photoresist set by the spin coating phase determines the height of
the microfluidic devices. After spin coating, the SU-8 coated wafer is heated in a phase called the “pre-
bake” where it is first heated to 65 °C and then to 95 °C. The pre-bake method evaporates the solvents
present in the photoresist and allows the material to harden while the gradual increase in temperature
prevents cracking [92]. The duration of the baking is dependent on the height of the film. After
heating, the wafer must be cooled down to room temperature.
Next, the wafer must be exposed to UV light using a mask aligner. Prior to placing the wafer onto
the mask aligner, the photomask is fixed onto a clear glass window on the machine that lets the UV
light through. Placing the photomask in-between the UV light lamp and the wafer will allow only the
features on the photoresist to be imprinted. Interaction between UV light and the negative photoresist
causes a polymerization in the photoresist, leading to a solidified structure on the wafer. Exposure
time is dependent on the height of the channels as well as the power of the UV lamp, and can be
calculated using the SU-8 2000 data sheet provided by MicroChem [93]. After exposure, the wafer has
to be heated again in the “post-bake” process at 65 °C and 95 °C for a time determined through the
datasheet and again cooled to room temperature for approximately 5 minutes. Post-exposure bake is
done to continue supplying energy to the photoactive reaction that takes place in the photoresist after

32
being exposed to UV light [92]. While the UV light starts the polymerization reaction, the post-
exposure bake heating finishes it. Once the wafer has cooled, SU-8 developer is used to remove the
unpolymerized deposits of photoresist in a process referred to as development. After the unwanted
SU-8 photoresist has been washed away with the SU-8 developer, isopropyl alcohol is used to wash
the wafer. The isopropyl alcohol must be air dried away using compressed N2 air and then heat dried
at 150 °C for 5 minutes before being cooled to room temperature again.
Finally, the wafer undergoes silanization in order to prevent PDMS from adhering to the master
mold surface during the subsequent casting process. Silanization introduces the silanizing agent
trichlorosilane to the surface of the master mold inside of a desiccator, which creates a vacuum, for
30 minutes as suggested by the Harvard Medical School protocol [94], [95]. Using the desiccator allows
for faster evaporation of the trichlorosilane droplet and promotes vapor-based deposition that creates
a monolayer on the silicon wafer [95]. Use of trichlorosilane prevents PDMS residue from sticking to
the wafer after curing, lessening the likelihood of damaged or improperly cured devices.
Figure 14. Overview of the soft-photolithography
process. The black ellipse object represents the silicon
wafer. Firstly, the wafer is cleaned and then heated. Next,
using a plasma machine, the clean wafer is plasma
treated. Upon plasma treating, SU-8 photoresist is added
atop the wafer and it is placed in the spin-coater at a
rotational speed set based on the desired height of the
encapsulation device. After the spin coating process, the
silicon wafer is heated and then exposed using a mask-
aligner machine. A photomask is placed between the UV
light and the wafer. UV light from the mask aligner will
polymerize the features on the wafer and a final baking
process is done to promote polymerization after
exposure to UV light. SU-8 developer is used to wash
the wafer in order to rinse away the photoresist that did
not polymerize. Finally, the wafer is dried and ready to
be used. Rationale behind the steps is described in text.

33
PDMS Casting
Microfluidic devices can be fabricated using many different types of polymers, however the most
common materials are glass and polydimethylsiloxane (PDMS). Glass is compatible with biological
samples as it is generally inert and can be formed using standard etching and soft lithography methods
[96]. Unfortunately, glass microfluidic devices need to be fabricated using a wet etching method which
is isotropic in nature and spreads in all directions and makes it difficult to control channel sizes
dimensions and cannot create deep narrow groves, are more costly to work with than PDMS devices,
require very specialized fabrication environments that require the use of dangerous chemicals such as
hydrofluoric acid and the use of elastomeric materials for the incorporation of valves - which may not
be easily available [97], [98]. Microfluidic chips used in the Godin Lab, and specifically for this project,
are made with PDMS because of low material cost, the transparent properties which allow active
monitoring of on-chip happenings with an optical microscope, biocompatibility, low surface energy
which allows easy peeling from molds and elasticity that creates a natural seal with solid tubing [88],
[99]. In terms of fabrication, PDMS is also easily bonded to a glass microscope slide by oxidizing the
surface using a plasma treatment [100].
The master mold created in the previous step gives the operator a platform onto which liquid
PDMS can be poured and cured in order to create the body of a microfluidic device. PDMS can be
purchased as a kit from Sigma Aldrich consisting of a base and curing agent. Both chemicals are mixed
at a 10:1 ratio of PDMS polymer to curing agent. The mixed product must then be degassed to remove
the air bubbles formed in the mixing step by being put in a vacuum chamber. It is imperative that the
mixture be free of air bubbles as negligence at this step can lead to unusable devices later in the process.
The PDMS mixture can then be poured onto the master molds. If more bubbles arise in the pouring
process, the master mold with PDMS must again be put into the vacuum chamber, otherwise, it can
go in an oven set to 70 °C and cured for at least 2 hours. Cured PDMS can be cut into pieces small

34
enough to fit onto a standard glass microscope slide (75 mm x 25 mm). Once the pieces of PDMS are
cut, the final step before bonding is to create the holes at the inlet, oil channels and outlets using a
biopsy punch compatible with the outer diameter of tubing used. For this project, a bioposy punch of
0.75 mm is used
Bonding
The final step in creating a PDMS-based microfluidic device is bonding the cured PDMS piece to
a glass microscope. Glass microscope slides must be cleaned thoroughly as improper cleaning can lead
to poor bonding. To clean the microscope slides for bonding, they must be sonicated with acetone,
then ethanol and finally isopropyl alcohol for 10 minutes each. Upon completion, the slides can be
dried using clean N2 air and stored in a dust free environment until they’re ready to be used for
bonding.
In order to bond PDMS to glass microscope slides, clean PDMS pieces and microscope slides are
plasma treated at ~30-50 W for 0.8 seconds. Plasma treatments is done with the feature side facing
up. Doing so creates an active SiO group on the exposed surface of the PDMS and an oxidized surface
of glass. Plasma activated faces of the PDMS piece is brought into contact with the activated side of
the glass slide. Contact between the two materials leads to a permanent Si-O-Si covalent bond [101].
After bonding the PDMS to a glass microscope slide, the device has to be placed in an oven set
to 70 C to alter the PDMS channel chemistry from hydrophilic to hydrophobic and complete
bonding. A hydrophobic microfluidic device will prevent the aqueous phase from wetting the channels
and promote the formation of microdroplets.

35
Cell Culturing
In order to understand cell behavior within the microdroplets, a NIH 3T3 cell line was chosen as
a model. cells are robust adherent fibroblasts derived from mice and can be seen in Figure 15.
Culturing protocols followed were given by the cell line distributors [102].
Initial Culturing
NIH 3T3 cells are delivered frozen so they can be kept in -80 C conditions until ready for usage.
To start the first cell line, the cells must undergo a quick thaw to 37 C. Once the cells are thawed,
the contents are transferred into a sterile centrifuge tube with 9.0 mL of growth medium. The cell
solution is then centrifuged at 125xg for 5-7 minutes. The centrifuged cells can then be seeded into a
culture flask containing cell media at a pH of 7-7.6 and incubated in an incubator set to 37 C with a
5% CO2 air atmosphere. The cells must undergo at least two subcultures after the thawing process to
be usable for experimental purposes.
Figure 15. Mouse Embryo Fibroblasts. Used courtesy of Wikimedia commons.

36
Sub-culturing
To continue the cell line, cells are sub-cultured when the petri dish is at 80% confluency, meaning
that the adherent cells cover 80% of the petri dish floor. Sub-culturing is done by aspirating the media
present and washing the culture dish with phosphate-buffered saline (PBS). PBS is aspirated out and
replaced with 3 mL of Trypsin-EDTA solution and then incubated for ~5 minutes. Incubation with
trypsin cues the adherent cells to release from the base of the petri dish. It is important to monitor
the incubation time as prolonged exposure to trypsin can be cytotoxic. After incubation, the cell-
trypsin solution is diluted with 6 mL of cell media to deactivate the effects of trypsin and a
hemocytometer is used to count the number of cells present. Apart from the cells used in counting,
the remainder of the solution is centrifuged down and resuspended in 1 mL of cell culture media
before being seeded into a culture dish of 10-12 mL of fresh cell media. Information on the passage
number, number of cells and date are noted.
Cell Maintenance
Sub-culturing of cells is important when the cell culture dish reaches 80% confluency, however, it
is important to refresh the cell media every 3 days. This is done by aspirating all the media in the
culture dish and replacing it with 12 mL of fresh media.
Agarose Preparation
Cell encapsulation is carried out using Type IX Ultra Low Gelling Temperature Agarose provided
by Sigma Aldrich as the dispersed phase. The preparation process is fairly simple and adapted from
the datasheet provided by the manufacturers [75]. For the purposes of cell encapsulation, it is easiest
to make stock agarose samples at a higher concentration so it can be diluted down with a component
such as cells or polystyrene beads. Therefore, a stock agarose sample is prepared at 2.7% w/v in sterile
PBS. The appropriate amount of agarose is mixed in with PBS and heated in a microwave until just

37
before it reaches a boil. Prepared agarose stocks can be stored at 4 C until ready to be used, at which
point it can be heated up past the melting point of 65 C.
Cell Encapsulation
Single Emulsion
Cell encapsulation can be broken down into five essential components as described in Figure 17a.
Temperature to control the state of agarose (38 C for liquid phase and 4 C for solid phase) and
pressure, provided by compressed gas fed to a pressure regulator meant to move substances from the
inlet to the outlet of the microfluidic device, during encapsulation are controlled through a custom
LABVIEW program [103]. Additionally, the microscope is equipped with the BlackFly camera from
FLIR for live visual feedback of the encapsulation process. SPINVIEW imaging software by
Spinnaker is used to image and film the encapsulation process while monitoring average cocoon
diameter.
It is important that the size of the cocoons fall into the desired range and using images taken from
the microscope along with FIJI, a NIH software, we can check the sizes while the encapsulation
process is taking place [104]. An image taken from the cocooning process is shown in Figure 17b.
Two pressure regulators pressurize the sample and oil/surfactant vials. Materials within the vials
are sent to the microfluidic device through polyetheretherketone (PEEK) tubing with an outer
diameter of 1/32” and an inner diameter of 0.007”. Pressure regulators are turned on and off via
LabVIEW and the amount of pressure is controlled via a valve on the regulators. Pressurizing the
sample and oil channels creates a pressure gradient in the device which pushes the cocoons
downstream towards the outlets where they leave the device through another set of PEEK tubing into
the collection vial. One tube goes from the sample to the inlet, two from the oil vial to the two oil
channels and two tubes run from the outlet to the sample collection vial. Due to two channel
38
continuous phase design of flow focusing geometry-based devices, two PEEK tubes are required for
the oil channel. Two tubes are also used for the outlet in order to accept samples from the two outlets.
As shown in Figure 10, it can be observed that the channel splits into two. This is done to prevent
total sample loss in the event of clogging – the second channel acts as a backup.
Sample from the inlet and oil from the oil channels travel to meet at the encapsulation point. Here,
the oil and span mixture acts as a cleaving agent and creates the spherical microdroplets. Oil/span and
the agarose/cell sample are immiscible, so they do not mix. Once the spheres have been created, the
oil acts as the surrounding medium of transport for the microdroplets. Occupancy of the
microdroplets can be estimated using the Poisson Distribution and is dependent on the concentration
of cells in the sample and the size of the droplets. Encapsulated microspheres, both cell-laden and
empty, travel downstream through the serpentine, where the microspheres are exposed to 4 C that
promote on-chip gelling. Functionally, the serpentine section of the microfluidic device holds the
microspheres on-chip for approximately 50 seconds of its total encapsulation time, increasing the time
they’re exposed to cool temperatures and consequently, increasing the time they have to gel. Following
the serpentine segment of the microfluidic device, the microdroplets travel to the outlets where they
are collected into a centrifuge tube containing 0.5 mL of cell media on ice. Collecting the sample on

39
ice further promotes gelling of the microdroplets, while the cell media provides a nutrient rich
environment for the cells. An overview of the cell encapsulation process is described in Figure 17.
As a proof of concept, single and double emulsion agarose microdroplets were also created
containing 11.8 m polystyrene beads as a way to emulate the future cell encapsulations. Unlike cells,
polystyrene beads have a higher tolerance for temperatures, with polystyrene possessing a melting
point of ~240 C and are far more monodisperse in their sizes [105]. Highly viscous samples tend to
create clogging in the devices and prior work done with cell encapsulation has found that 7.5 x 10⁶
𝑐𝑒𝑙𝑙𝑠
𝑚𝐿 is an ideal concentration. Single emulsions created in this project use polystyrene beads at 7.5 x
106 𝑐𝑒𝑙𝑙𝑠
𝑚𝐿. Cells were tested at 7.5 x 10⁶
𝑐𝑒𝑙𝑙𝑠
𝑚𝐿 as well as 10 x 106
𝑐𝑒𝑙𝑙𝑠
𝑚𝐿 in order to increase the number
Figure 16. Cell encapsulation of
single emulsions with
polystyrene beads and cells. 16a
depicts single cell encapsulation
with polystyrene beads. 16b
shows single cell encapsulation
with NIH 3T3 cells.

40
of cell laden microspheres. Figure 16a and Figure 16b illustrates the process of creating a single
emulsion microdroplets with both polystyrene beads and cells.
Figure 17. Overview of cell encapsulation. 17a describes the birds eye view of cell encapsulation. A microscope
connected with a camera is used to monitor the cell encapsulation process which takes place on a pressure and
temperature gradient. As the sample moves from the inlet to the outlet, the temperature goes from hot to cold –
hot to maintain the hydrogel in liquid phase and cold to gel the formed droplets. In terms of pressure, the device
uses a zone of high pressure to push the sample from the inlet to the outlet, which has lower pressure. The pressure
gradient is set using pressure regulators that pressurize the inlet and oil channels. 17b zooms in on the cell
encapsulation process. The cells suspended in a hydrogel mixture enter the encapsulation phase where they are met
with immiscible oil and surfactant mixture. The hydrogel and cell sample are cleaved to create droplets, some of
which are cell laden, while others are empty. Encapsulation occupancy rates are dependent on the Poisson
distribution.

41
Sample Purification
Initially, the sample collection tube contains the initial media, microspheres and the immiscible oil
used to cleave the microdroplets. In order to use the microdroplets for therapeutic purposes or double
emulsions, the sample must be purified by removing the oil. The sample is centrifuged at 0.3xG for 3
minutes, the supernatant is removed, and this process is repeated. After the second oil removal step,
the sample is transferred into a new centrifuge tube while avoiding the residual oil and new Dulbecco’s
modified eagle medium (DMEM) is added until the sample volume is 1 mL.
Quantification
With the purified sample, output of the microfluidic device can be quantified with throughput,
total cell count, and cell viability using a hemocytometer and a trypan blue stain. It is necessary to
incubate the trypan blue infused sample for 3-5 minutes in an incubator so as to give the dye enough
time to be taken up by cells. After incubation, the number of empty cocoons, occupied cocoons,
number of live cells and dead cells are counted. Single emulsions placed in a hemocytometer quadrant
can be seen in Figure 18. The total number of microdroplets were measured using a hemocytometer
using the following formula [106]:
𝑡𝑜𝑡𝑎𝑙 𝑚𝑖𝑐𝑟𝑜𝑑𝑟𝑜𝑝𝑙𝑒𝑡𝑠 = 𝑡𝑜𝑡𝑎𝑙 𝑚𝑖𝑐𝑟𝑜𝑑𝑟𝑜𝑝𝑙𝑒𝑡𝑠 𝑖𝑛 𝑓𝑜𝑢𝑟 𝑞𝑢𝑎𝑑𝑟𝑎𝑛𝑡𝑠
4 × 𝐷𝑖𝑙𝑢𝑡𝑖𝑜𝑛 𝐹𝑎𝑐𝑡𝑜𝑟 × 10,000
Once the total number of microdroplets have been calculated, divide the value by the time
duration of the encapsulation process, in minutes, and then again 60 to get the throughput in droplets
per second, or in other words, Hz. Cell viability is simply the number of live cells divided by the
number of total cells.

42
Figure 18. Microdroplet samples on a hemocytometer for microdroplet and cell counting. Figure 18 represents a
quadrant of the hemocytometer slide. Four quadrants are counted and averaged, multiplied by the dilution factor
and then again multiplied by 10,000 to get the total number of cells. Additionally, the sample has been mixed with
a trypan blue stain, which is a dye taken up by dead cells. When taken up, the dye looks dark blue. Live cells look
like a glowing white.

43
Double Emulsion
The process of creating double emulsions is nearly identical to that of creating single cell
encapsulations in every way except for the geometry of the microfluidic device used, as described in
Figure 19. To accommodate for the larger incoming cocoons, the encapsulation nozzle has been
enlarged, and because a larger amount of agarose mixture is entering the encapsulation point, the oil
channels have, too, been widened. Increasing the width of the oil channels allows for a lower resistance
in the oil channels and therefore increases the amount of the oil that reaches the encapsulation point.
Agarose samples contain 1.5 x 10⁶ 𝑚𝑖𝑐𝑟𝑜𝑑𝑟𝑜𝑝𝑙𝑒𝑡𝑠
𝑚𝐿, and the encapsulation process is shown in Figure 20.
Figure 19. Creating double emulsion microdroplets. Single emulsions are purified and then mixed in with agarose
hydrogels prior to being reinserted into a microfluidic cell encapsulation device. Double emulsions are again purified to
get the final sample.
Figure 20. Double emulsion microdroplet formation. 19a depicts single emulsions with polystyrene beads whereas 19b
shows double emulsions with cells.

44
Once the double emulsions are created, the sample purification process is identical to that of the single
emulsion process.
Poisson Distribution
Theoretically, the number of cells encapsulated within a droplet can be predicted using statistical
models. Ideas presented here are based on the review paper by Collins et al. [70]. The Poisson
distribution is the probability of events randomly occurring in a fixed time or space under the
assumption that the events are random and independent of each other [107]. Therapeutic cells in the
agarose hydrogel are suspended heterogeneously and thus arrive at the nozzle in a random order.
Furthermore, the arrival of one cell does not impact the arrival of the subsequent cells. While the cells
enter the encapsulation point randomly, the sample that contains them and consequently the
production of droplets (with or without cells) is continuous. From this, it can be implied that it is
impossible to guarantee that all droplets will contain a cell but the number of cell-laden microdroplets
can be estimated using the Poisson distribution. In the context of microfluidics, the Poisson
distribution equation is described as such
𝑝(𝑘, 𝜆) = 𝜆𝑘𝑒−𝜆
𝑘!
Where 𝜆 is the average number of cells per droplet volume and 𝑘 is the number of particles in an
object. To utilize the formula for the Poisson distribution, we must select a cell density, the radius of
the droplet and the volume of the droplet. Using the Poisson distribution and an assumption that the
cell density used for encapsulation is 7.5 x 10⁶ 𝑐𝑒𝑙𝑙𝑠
𝑚𝐿for single emulsions and 1.5 x 10⁶
𝑐𝑜𝑐𝑜𝑜𝑛𝑠
𝑚𝐿for double
emulsions, the average number of cells found in the droplet volume () for different diameters of

45
microdroplets is shown in Table 2, and the likelihood of a cocoon containing a specific number of
cells is shown in Figure 21.
Using the Poisson distribution gives a theoretical number for benchmarking the efficiency of the
cocooning platform, however, there is a lot that can alter the actual output. For example, the cells may
settle to the bottom of the vial, changing the instantaneous concentration and violating one of the
Poisson distribution assumptions. Clumping of cells or microdroplets can lead to occupancy values
that are not in line with the Poisson distribution predictions. Actual output values not matching the
theoretical values is an issue indeed, however, it does point to factors that might be addressed. For
this reason, it is important to keep the Poisson distribution values in mind when analyzing the output
from an encapsulation experiment.
Table 2. Average number of cells per droplet. Assuming a cell concentration of 7.5 x 10⁶ 𝑐𝑒𝑙𝑙𝑠
𝑚𝐿 for single emulsions and a
cocoon concentration of 1.5 x 10⁶ 𝑐𝑜𝑐𝑜𝑜𝑛𝑠
𝑚𝐿 for double emulsions, the average number of cells expected for a certain diameter
is shown in Table 2. The larger the cocoon, the more likely it is that it is occupied, and this holds true for both the single
and double emulsions. More so, the larger the cocoon, the higher the likelihood that it is more than one cocoon. The
values in bold are the theoretical values of the sizes of microdroplets created for this project, while the other values are
present to illustrate the trend.
Expected Occupancy
Diameter (um) 40 45 50 100 110 120 130
Expected Occupancy
(7.5x10^6 cells/mL) 22.22% 30.08% 38.79% 97.31% 95.38% 85.04% 63.62%
Expected Occupancy
(10x10^6 cells/mL) 28.47% 37.94% 48.03% 95.35% 83.27% 58.10% 82.20%

46
Timepoint Imaging
Quantifying cell egress can be done in a few ways, and one such method is time point imaging,
which involves samples being seeded into DMEM filled 12 well-plates (22.1 mm diameter) and imaged
periodically. For this project, samples are incubated for duration of 48 hours (H) and imaged at time
points 0H, 24H and 48H. Time point is a valuable tool because it can be used to gather not only egress
data but viability as well. At each time point, information is collected on cell viability via the trypan
1 2 3 4 5 6 7 8 9
0
10
20
30
40
Average Cell Occupancy Based on Size
# of cells per cocoon
% li
kelih
ood
45
50
100
110
Figure 21. Average cell occupancy based on cocoon diameter. As the size of the cocoons change, so does the
probability of finding a certain number of cells within the droplet. The smaller droplets have a higher chance of
holding 1-3 cells, while the larger droplets tend to contain more cells. The numbers in the legend list the size of the
microdroplet, thus 45 implying 45 m, and so forth.

47
blue exclusion method using a 1:0.5 ratio of sample to stain followed by a period of brief incubation.
Trypan blue exclusion stains use a negatively charged dye that penetrates compromised cell
membranes [108]. Generally, trypan blue requires a mixture of 1:1, however, doing so at a volume of
1 mL leads to poor visibility. The lower volume of stain is compensated through an extended
incubation time. Egress data is collected by counting cell occupancy at each time point. For the
timepoint experiments, a 12-well plate was used with 1 mL of DMEM and 20,000 microdroplets in
each well. To get sufficient statistical powers, 10 images were taken and counted for each time point.
Occupancy, using a timepoint imaging technique, is done similarly for single and double
emulsions, with a few key differences. For each image of taken for single emulsion cocoons, empty
microdroplets, microdroplets with 1 cell, microdroplets with 2 cells, and microdroplets with >2 cells
are counted. Cell-laden microdroplets are considered occupied while microdroplets with no cells are
considered empty. Then, occupancy is a measurement of occupied microdroplets divided by empty
microdroplets. Measuring occupancy for double emulsion was done similarly, with the difference
being that production of double emulsion can lead to a completely empty microdroplet, which is
similar to an empty single emulsion, a double emulsion occupied with empty single emulsions, or a
double emulsion occupied with cell-laden microdroplet. Two levels of occupancy are calculated for
double emulsion. First is regular occupancy, which is the number of cell-laden double emulsion
divided by the total number of microdroplets present. The second is the adjusted occupancy, which
is the number of cell-laden double emulsion divided by occupied double emulsions.
Egress measurements are treated as a function of the percent change in occupancy over time.
Timepoint 0H for all egress is treated as 0% and considered a baseline. Egress at timepoint 24H is
calculated by the percentage change between 24H and 0H using the following equation:
𝐸24𝐻 = (𝑂0𝐻 − 𝑂24𝐻)
𝑂0𝐻

48
Where E is egress and O is occupancy. Similarly, egress at timepoint 48H is calculated using the
following equation:
𝐸48𝐻 = (𝑂0𝐻 − 𝑂48𝐻)
𝑂0𝐻
Confocal Microscopy
Brightfield microscopy is a practical, quick and accessible means to image cells for egress and
viability, however, there are benefits to using the more advanced confocal microscopy. Firstly,
confocal microscopy can use lasers that activate fluorescent dyes such as the Live/Dead kit. Unlike a
trypan blue stain, live/dead staining kits identify live cells using a dye that binds to intact cell
membranes and another dye to bind to the DNA of dead cells – which is more accurate and
Figure 22. Example of timepoint photography comparing the differences between single emulsions and double
emulsions over a 48 hour period. The images are used to measure viability and occupancy. One can observe, qualitatively,
that there are more free cells in the single emulsion images than there are for the double emulsion images.

49
reproducible than the trypan blue stain [108]. An example of the live/dead stain can be seen in Figure
23.
The second advantage of confocal microscopy that brightfield images do not offer is the ability to
image in a 3D space. Brightfield images in a timepoint or time lapse experiment provide insight into
occupancy, egress and viability, however, they do not reveal the three-dimensional structure of the
single and double droplet. Cells within single emulsions are easier to identify using bright field images
because cells lack their standard protrusions seen in culture and remain in a spherical morphology.
Double emulsions seen through a brightfield microscope on the other-hand show a convincing inner
core but leave the outer core in a questionable state. It is challenging to show that the inner core is
actually within the outer core and not simply stacked on top of one another. Confocal microscope
images are taken using the z-stack method to identify the structure in a three-dimensional
configuration.
Figure 23. LIVE/DEAD stain of single emulsion cocoons. The image is a composite of a brightfield image, along with
lasers illuminating fluorescent dyes taken up by the cells. The green cells indicate live cells while the red indicates dead
cells.

50
RESULTS & DISCUSSION
The goal of this research project is to further the understanding of cell egress. We hypothesize
that it is the cells on the edge of microdroplets that leave the sphere [82]. In order to test the
hypothesis, a secondary emulsion layer is created to push cells in a droplet towards the center. Given
the objective, the goals of this project involve creating hydrogel-in-hydrogel double emulsion
microdroplets, confirming their structure, characterizing the creation process of said double emulsions
and finally using the double emulsion microdroplet structure to carry out cell egress studies. Firstly,
single emulsion and double emulsion microdroplets are created. The process of creating double
emulsions is explored and contrasted with the single emulsion counterpart. Device geometries are
discussed and compared for the two emulsion configurations. Second, the structure of the double
emulsion is confirmed using 3D imaging with a confocal microscope, followed by characterizing some
of the parameters required for creating double emulsions and finally, cell studies are carried out to
understand the effects of double emulsions on cell egress.
Note: When this document references single emulsions with an agarose concentration, it suggests that the concentration of the
whole microdroplet is the stated agarose concentration. For example, “1.5% single emulsion” suggests that the microdroplet is
composed of 1.5% agarose solution. In the case of double emulsions, however, the percentage value is only referring to the inner
microdroplet of the double emulsion. In this study, all double emulsions have an outer agarose concentration
of 2%. Therefore, a 1.5% double emulsion implies that the inner spheres are made of 1.5% agarose hydrogel and the outer sphere
is 2% agarose. Similarly, a 1.75% agarose double emulsion implies that the inner sphere is made of 1.75% agarose hydrogel whi le
the outer shell is 2%. Finally, a 2% agarose double emulsion implies that both the inner and outer shells are made of 2% agarose
hydrogels.

51
Creating Double Emulsions
Single emulsion droplets, be it for encapsulating cells or polystyrene beads, were made using a
device with the geometry detailed in Figure 24. Work done by Chen et al identified that, while it is
indeed the capillary number that plays a role in droplet formation, the size of formed droplets within
a microchannel can be controlled by the flow rate and width of the channels [109]. The same study
found that, given a constant flow rate in the dispersed phase, increasing the flow rate of the continuous
phase leads to smaller droplets while decreasing the flow rate leads to larger droplets. More so, the
width of the dispersed phase channel was largely responsible for the sizes of droplets a microfluidic
device was able to produce, with the most stable sizes being a close approximation to the width of the
feature labeled as the ‘encapsulation point’ [110], [111]. Experimentally, it was observed that the
encapsulation process was the most stable, or monodisperse, when the pressurized channels of the
50 um
Figure 24. Geometry of a microfluidic device intended to create single emulsions of 40-50 m.
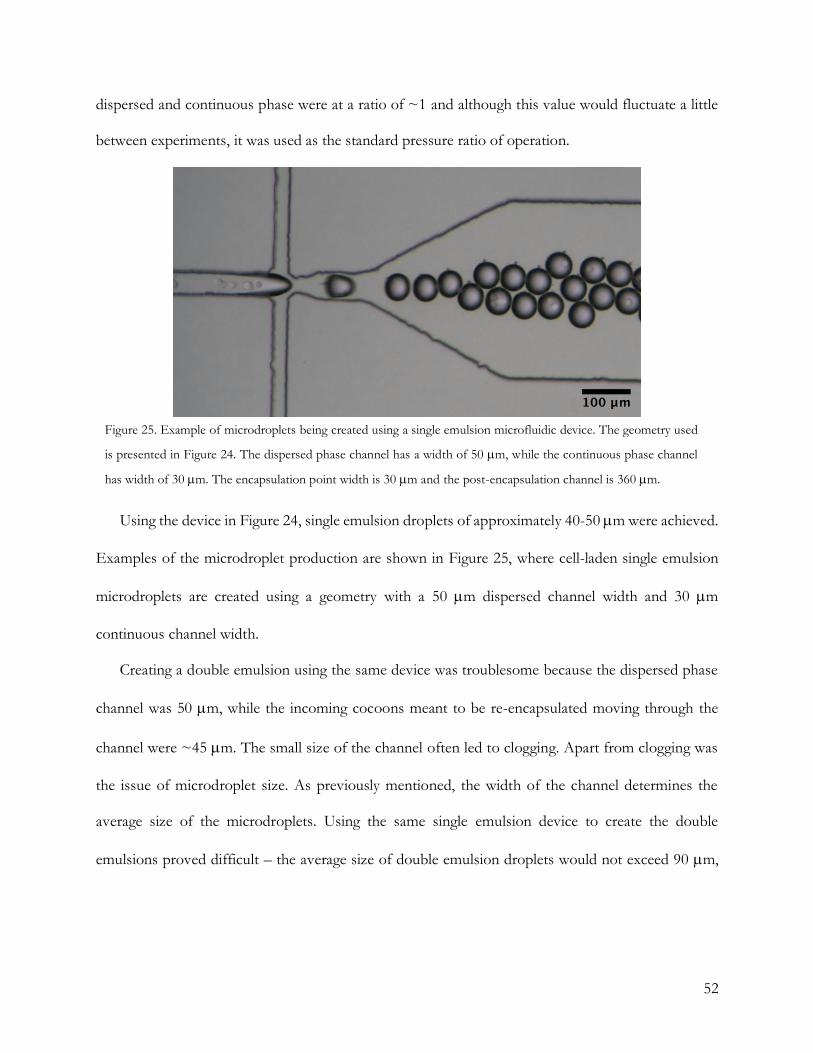
52
dispersed and continuous phase were at a ratio of ~1 and although this value would fluctuate a little
between experiments, it was used as the standard pressure ratio of operation.
Using the device in Figure 24, single emulsion droplets of approximately 40-50 m were achieved.
Examples of the microdroplet production are shown in Figure 25, where cell-laden single emulsion
microdroplets are created using a geometry with a 50 m dispersed channel width and 30 m
continuous channel width.
Creating a double emulsion using the same device was troublesome because the dispersed phase
channel was 50 m, while the incoming cocoons meant to be re-encapsulated moving through the
channel were ~45 m. The small size of the channel often led to clogging. Apart from clogging was
the issue of microdroplet size. As previously mentioned, the width of the channel determines the
average size of the microdroplets. Using the same single emulsion device to create the double
emulsions proved difficult – the average size of double emulsion droplets would not exceed 90 m,
Figure 25. Example of microdroplets being created using a single emulsion microfluidic device. The geometry used
is presented in Figure 24. The dispersed phase channel has a width of 50 m, while the continuous phase channel
has width of 30 m. The encapsulation point width is 30 m and the post-encapsulation channel is 360 m.

53
and the ones that did exceed 90 m came about rather uncontrollably, shown in Figure 26. For this
reason, it was decided that a new device must be made with a larger dispersed phase channel width.
To accommodate more than one single emulsion droplet flowing through the dispersed phase
channel, the width of the dispersed phase channel was set to 130 m, while the width of the post
encapsulation point was set to 110 m, the middle point between the intended droplet size of 100 m
– 120 m. A marked-up drawing can be seen in Figure 28. While this device was an improvement and
led to monodisperse droplets, as seen in Figure 27, the ratio of the pressures was imbalanced due to
the continuous phase channel being so much smaller than the dispersed phase channel. In order to
control the dispersed channel at a low flow rate, the aqueous channel would have to be set much
higher. Doing so impacts the reaction of the droplet production device to incoming conglomerated
droplets, where the flow rate of the oil is unable to ‘cleave’ the dispersed phase into proper
microdroplets – leading to a long, gelled droplet similar in shape to a jetting regime.
A larger oil channel was thus incorporated into the microfluidic device intended to create double
emulsions, of which the dimensions can be seen in Figure 30. Using the new geometries, a
Figure 26. Double emulsion microdroplets created using the device intended to create single emulsions. While
double emulsions are created, there was little control over the sizes (the double emulsion microdroplets averaged a
size of ~90 m, while intended size was between 100 m and 120 m.

54
monodisperse sample was attained while having the flexibility to encapsulate at higher pressures, and
consequently higher flow rates, shown in Figure 29.
Creating double emulsions has been done using oil-in-water-in-oil (O/W/O) or water-in-oil-in-
oil (O/W/O) configurations [112], [113]. While the oil component of double emulsions is always an
oil, or oil and surfactant mixture, the aqueous portion can be any type of liquid such as a buffer with
dissolved drugs or hydrogels [114]. Using the protocol presented in this work, a means of removing
the oil layer and creating hydrogel-in-hydrogel (H/H) double emulsions.
Figure 28. Double emulsion microdroplets created using a microfluidic device whose encapsulation point is set 110
m as opposed to the 30 m for the single emulsion devices. Here, the droplets created are within the intended size
range of 110 m to 130 m.
Figure 27. First iteration of a microfluidic encapsulation device intended to create double emulsion microdroplets.

55
Size
Single emulsion microdroplets containing polystyrene beads were more monodisperse than their
double emulsion counterparts as shown in Figure 31a. The same trend was observed with
microdroplets containing cells, shown in Figure 31b. Both results are numerically presented in table 1.
A higher level of polydispersity is present in larger microdroplets independently of their content
(polystyrene beads vs cells) as illustrated through the control microdroplet - a larger single emulsion
Figure 30. Second iteration of a microfluidic encapsulation device intended to create double emulsion microdroplets.
Figure 29. Double emulsion microdroplets created using a microfluidic device whose encapsulation point is set to 110
m and continuous phase channel width set to 90 m. The benefit of this device is in addition to being able to
produce microdroplets in the intended size range, it can be operated at a higher pressure range than the previous
iteration.

56
intended to be similar in size to the double emulsion. It can be concluded that the polydispersity of
microdroplets created using a microfluidic platform increases with the size of the microdroplets.
Surface tension increases with the size of the droplet and thus the larger droplets are more likely to
fluctuate in size [115].
Microdroplets were created with agarose hydrogel samples mixed with two different cell
concentration amounts, 7.5 x 10⁶ 𝑐𝑒𝑙𝑙𝑠
𝑚𝐿 and 10 x 106
𝑐𝑒𝑙𝑙𝑠
𝑚𝐿, suggesting that the concentration of cells in
the agarose hydrogel sample being encapsulated through the device was at either of the stated values,
however, microdroplets containing the higher cell concentrations of 10 x 106 𝑐𝑒𝑙𝑙𝑠
𝑚𝐿 were only tested at
an agarose concentration of 1.5% and 2%. It has been demonstrated that too low of an agarose
concentration, around 1% agarose, leads to immediate release of free cells reducing occupancy, while
a concentration of 3% agarose prevents cell egress entirely [82]. Microdroplets of 1.75% agarose
concentration were excluded from the higher concentration to observe the trends in extreme cases.
The average size of microdroplets containing different concentrations of cells are shown in Figure 31c
and Figure 31d for single and double emulsions respectively. Trends in the monodispersity do not

57
seem to change based on the concentration of cells. Single emulsions are more monodisperse than
their double emulsion counterparts.
Data shows that the size of microdroplets become harder to control as the microdroplet becomes
larger, and under similar conditions, encapsulating polystyrene beads or cells does not affect the level
of polydispersity. Two levels of cell concentration (7.5 x 10⁶ 𝑐𝑒𝑙𝑙𝑠
𝑚𝐿 vs 10 x 106
𝑐𝑒𝑙𝑙𝑠
𝑚𝐿) also had negligible
effect on the level of polydispersity. Microdroplets used for this project are indeed in the intended
range of 40-50 m for single emulsions and 110-130 m for double emulsions.
1.5%
(S)
1.75
% (S
)
2% (S
)
2% (S
) Contr
ol
1.5%
(D)
1.75
% (D
)
2% (D
)0
20
40
60
80
100
120
140
Siz
e (
mm
)
Average Microdroplet Size (Polystyrene Beads)
1.5% (S)
1.75% (S)
2% (S)
2% (S) Control
1.5% (D)
1.75% (D)
2% (D)
S - 7.
5 M
-cel
ls/m
L
S -
10 M
-cel
ls/m
L
D -
7.5
M-c
ells
/mL
D -
10 M
-cel
ls/m
L
0
20
40
60
80
100
120
140
Average 1.5% Agarose Microdroplet Size
(Cells)
Siz
e (
mm
)
S - 7.5 M-cells/mL
S - 10 M-cells/mL
D - 7.5 M-cells/mL
D - 10 M-cells/mL
1.5%
(S)
1.75
% (S
)
2% (S
)
2% (S
) Contr
ol
1.5%
(D)
1.75
% (D
)
2% (D
)0
20
40
60
80
100
120
140
Siz
e (
mm
)
Average Microdroplet Size (Cells)
1.5% (S)
1.75% (S)
2% (S)
2% (S) Control
1.5% (D)
1.75% (D)
2% (D)
S - 7.
5 M
-cel
ls/m
L
S -
10 M
-cel
ls/m
L
D -
7.5
M-c
ells
/mL
D -
10 M
-cel
ls/m
L
0
20
40
60
80
100
120
140
Average 2% Agarose Microdroplet Size
(Cells)
Siz
e (
mm
)
S - 7.5 M-cells/mL
S - 10 M-cells/mL
D - 7.5 M-cells/mL
D - 10 M-cells/mL
a. b.
c. d.
Figure 31. Average size of microdroplets containing polystyrene beads and cells, where (S) refers to single emulsions
and (D) refers to double emulsions. 31a. Average microdroplet size for emulsions containing polystyrene beads. Single
emulsions exhibit more monodispersity than their double emulsion counterparts and the control microdroplet. 31b.
Average microdroplet size containing cells. Smaller single emulsions exhibit more monodispersity than their double
emulsion counterparts and the control microdroplet. 31c. Average size for microdroplets composed of 1.5% agarose.
There is no apparent difference between single or double emulsion microdroplets containing 7.5 x 10⁶ 𝑐𝑒𝑙𝑙𝑠
𝑚𝐿 versus
10 x 106 𝑐𝑒𝑙𝑙𝑠
𝑚𝐿 . 31d. Average microdroplet size for microdroplets composed of 2% agarose. There is no difference
between single or double emulsion microdroplets containing 7.5 x 10⁶ 𝑐𝑒𝑙𝑙𝑠
𝑚𝐿 and 10 x 106
𝑐𝑒𝑙𝑙𝑠
𝑚𝐿 .

58
Size of cells, along with hydrogel porosity have been shown to impact cell egress and in order to
ensure that the egress being compared in later sections was fairly assessed, it was vital for the droplets
to be as monodisperse as possible [112], [116][10,11]. While larger microdroplets are indeed harder to
control in terms of monodispersity, studies on single emulsion of show that droplets various sizes
between 30 to 60 microns can be produced, using microfluidic systems, with a coefficient of variation
of 5% - which translates to control with a range of 1.5 to 3 microns[117][14]. Coefficient of variation
is computed by dividing the standard deviation of the microdroplet size and dividing it by the mean
of the size and provides a unitless percentage value for which samples can be compared [118][15].
Table 3, below, shows the standard deviation for the different types of droplets produced for which
the single emulsion variation is comparable to what is presented in literature. Double emulsions
showed a high coefficient of variation, further confirming their polydispersity single emulsions in this
thesis project as well as to the literature.
An automated, or computer based, method of measuring the droplet sizes may provide a more
accurate size distribution as opposed to measuring each droplet by hand – which can change results
based on user movement. A script that can measure the diameter of the droplets can provide a more
accurate and consistent method of measurement. Outside of refining measurement techniques,
investigating alternative pressure ratios and channel geometries to control surface tension effects
should be done for creating less
polydisperse double emulsions.
Table 3. Average size and coefficient of
variation of agarose microdroplet sizes
containing polystyrene beads and cells. (S)
denotes single emulsion microdroplets,
whereas (D) denotes double emulsion
microdroplets. While figure 1 visually
demonstrates the level of monodispersity,
this table provides numerical values.
Concentration of Inner
Agarose
Polystyrene
Beads (m) Cells (m)
1.5% (S) 48 3 48 3
1.75% (S) 47 3 47 4
2% (S) 47 5 47 3
1.5% (D) 130 10 110 10
1.75% (D) 130 10 120 10
2% (D) 130 10 110 20
2% - (S,Control) 120 10 130 10

59
Throughput
Throughput of the cell encapsulation process is described as the number of droplets generated
per second by the encapsulation device and is measured in hertz (Hz). Information on the throughput
of the device helps to determine how long to run the experiment for. Creating double emulsions
require a minimal amount of single emulsion microdroplets. More so, both single emulsion and double
emulsion microdroplets have to be seeded using a certain amount in order to be measured for viability
and egress in a consistent manner. For this reason, the throughput was tracked for each encapsulation
run.
Experiments show that the throughput for this project was highly variable. Amongst the entirety
of microdroplets created for this research project, including single and double emulsions, the range of
throughput was from 40 Hz to 143 Hz, with a mean of 85 Hz for microdroplets created with
polystyrene beads and a mean of 79 Hz for samples containing cells, as shown in Figure 32.
Single emulsion microdroplets did show, on average, a higher throughput than double emulsion
microdroplets. This is expected as double emulsion microdroplets consume more agarose per droplet
and consequently, the same volume of agarose samples will yield lower number of double emulsions.
Given the variable nature of throughput, these findings set a precedent of the time it takes to finish
an encapsulation session for each experiment. For single emulsions, timepoint imaging requires a total
of 60,000 microdroplets per experiment and another 300,000 microdroplets to introduce into the
subsequent double emulsion encapsulation process. For a 12 well microplate, supplied with 1 mL of
DMEM, 20,000 cells in each well plate provided a window filled with droplets. In creating double
emulsions, a concentration of 300,000 microdroplets per sample was chosen because qualitative trials
led to clogs with higher number of droplets. In total, 360,000 microdroplets are needed and thus single
emulsion encapsulation sessions are carried out for at least 2.5 hours to ensure that sufficient

60
microdroplets are captured. Double emulsions only require 60,000 total droplets, so it is collected for
at least 1 hour. Increasing the throughput would help in reducing the time that cells spend outside of
an incubator or within an in-vivo sample. Number of droplets for double emulsions also comes about
from supplying each time point microwell in a 12-well plate with 20,000 cells per time point, in order
to fill the field of view without overcrowding.
An immediate solution to increase device throughput is to run multiple devices in parallel,
however, it is still important to investigate device parameters in order to get a less variable, and
consequently, more predictable throughput rate. Future experiments on the duration of the
encapsulation time on cell viability could also be of interest because it would provide insight into the
importance of throughput. Should a three-hour long experiment have no negative impact on cell
viability, a device with poor throughput can still be an acceptable solution for creating encapsulated
cells without compromising sample quality. If the results do indeed show that a prolonged experiment
reduces cell viability, changes need to be made to the encapsulation protocol.
Results collected for throughput were not as expected. For both single and double emulsions, the
continuous phase was always between 0.12 – 0.15 MPa and therefore the expected throughput should
have been 100 to 200 Hz which was not achieved in this project [119]. Device geometry was not
identical for single and double emulsions, as shown in section 1 of the results. The channels are wider
for the double emulsion devices compared to the single emulsion devices (encapsulation nozzle width
of 110 m vs 30 m respectively). Larger channels using the same pressures have a higher flow rate,
however, the volume of a 120 m microdroplet, 7.2 x 10⁶ m 3, has a volume thirteen times as much
as the volume of a 50 m microdroplet, which has a volume of 5.3 x 10⁵ m 3. The agarose consumed
by one 120 m microdroplet is thus more than the agarose consumed by a 50 m microdroplet, and
it makes sense that over the same unit time, the 120 m microdroplets have a lower throughput. Still,

61
there needs to be further experimentation to determine the cause of the variable throughput in order
to have a more predictable system over all experiments and encapsulations. Changes in pressures
directly affect the size, as the flow rates are controlled via the pressure gradient, and a fluctuation in
pressure may cause a poor throughput by changing the sizes intermittently between droplet
production. Experiments can be done to investigate this by creating droplets using pressure generated
from a pressure regulator and droplets created using a syringe pump. Syringe pump driven flow in
microfluidic systems are characterized with fluctuating flow rates, while pressure driven flow in
microfluidic systems is commonly used due to its smooth and stable pressure properties [120]. A
comparison between the peristaltic-like pressure system compared to a smooth continuous pressure
flow should be done to ensure that there are no detrimental effects from fluctuations in pressures that
come from a variable throughput.
Another source of variation may arise in the sample-counting step. Microdroplets are counted
using a hemocytometer and the throughput is calculated by dividing the total number of droplets
collected after an encapsulation run by experiment duration. In order to load the samples onto the
glass counting contraption, one must use a 10 L pipette with a very narrow tip. It might be so that
microdroplets get caught in the tip. Pipette tips for 10 L micropipettes have an estimate diameter of
350 m, which works out to be less than ~3 double emulsions wide, or ~7 single emulsions [121].
The narrow dimension of the pipette tip paired with the sticky nature of agarose could lead to samples
being stuck along the interior of the pipette tip. Alternatives to microdroplet counting might be worth
exploring to treat this issue. Using videos of the encapsulation method and counting frame-by-frame
may be a more accurate, albeit more tedious, alternative to using a hemocytometer. This method,
unfortunately, requires a camera with a high frame rate, which is expensive. Perhaps, the
hemocytometer method can be tested to ensure that the results indeed align with the theoretical count.
An approach for calibrating throughput could be slowing down the live encapsulation rate to below

62
the frame rate of the camera so the live rate can be measured. The encapsulation can be run for a set
period of time then the hemocytometer values can be compared to what should be expected. While
this may seem similar to the previous suggestion, this method would slow down the potential of
throughput and thus reduce the number of microdroplets collected. For example, the camera used for
this project has a framerate of 60 Hz. If we set the encapsulation process flow rate using pressure
control to the point where it is 50 droplets per second, we can run it for a set period of time – 1 hour
for example, we can expect 180,000 droplets at the end of the encapsulation run. Using a
hemocytometer, we can confirm if the hemocytometer underestimates, overestimates or shows the
accurate results.
Poly
styr
ene
Bea
ds (S
)
Poly
styr
ene
Bea
ds (D
)
Cel
ls (S
)
Cel
ls (D
)0
50
100
150
Th
rou
gh
pu
t (H
z)
Throughput
Figure 32. Throughput between single (S) and double (D) emulsion microdroplets. Discriminating between single
emulsion and double emulsion microdroplets did little to provide a different trend in throughput.

63
Viability
Cell viability is a critical metric to ensure sample quality. Using timepoint experiments to track the
viability of cells ensures that the single and double emulsion microdroplets are not negatively effecting
stem cells. Agarose microdroplets are intended to act as the carrier for sensitive therapeutic cells and
although a benefit of agarose is biocompatibility, it is a unique environment and must be tested to
ensure it is not to the detriment of cell viability.
Figure 33a and Figure 33b show the viability of single and double emulsion microdroplets with a
cell concentration of 10 x 106 𝑐𝑒𝑙𝑙𝑠
𝑚𝐿. For 1.5% agarose microdroplets, there was no significant difference
(p > .05) between the microdroplets over time either between or within samples. That is to say that
the viability remained unchanged over a 48H period of time on average for single emulsions and
double emulsions, and there was no difference between the viability of single emulsion and double
emulsions. Viability data for 2% agarose single and double emulsion microdroplets did not show a
significant difference (p > .05) between the samples. There was, however, a difference (p = .007)
between the 0H and 48H time point within the 2% single emulsion samples, with a 6% decrease.
While the change in viability for the 2% single emulsion microdroplets is less than ideal, the 48H time
point between single and double emulsion droplets have no significant difference between them. For
this reason, the samples were used to collect cell egress data.
Initial experiments showed rather poor viability, as seen in Figure 34. Three concentrations of
agarose were tested for single and double emulsions with a cell concentration of 7.5 x 10⁶ 𝑐𝑒𝑙𝑙𝑠
𝑚𝐿,
however, during these experiments, the viability decreased from timepoint 0H to 48H. Here, it is
imperative to note that viability was in no way effected by the concentration of cells. The first batch
of experiments utilized a lower amount of cell concentration as it is easier to encapsulate lower
concentrations due to less frequent clogging within the devices and clumping of the cells. Increase in

64
concentration was in order to increase the double emulsion occupancy, which was less than desirable
in the initial experiments. Poor cell viability can lead to skewed egress results and thus it is vital that
cells remain alive over the experiment. Should there be a change in cell viability, results might be
skewed to show a higher occupancy, indicating a lower amount of cell egress as the dead cells cannot
escape microdroplets, adding false-positive data points to the experiments.
From the initial experiments, it was learned that handling samples played a large role in cell
viability. For all experiments carried out, the microfluidic encapsulation device setup was identical as
were the devices used. There was no difference between the tools, and therefore the only difference
came about from the culturing and handling of the cells. Future experimenters working in cell
encapsulation may benefit from a more stringent usage criteria for cells. By and large, future
experiments should use a narrower range of cell passages. Experiments done in this body of work
used cells from passages as low as 6 and as high as 26 – future experiments may benefit from using
cells between a stricter passage number in order to avoid genetic drift [122]. Most importantly, the
poor viability results justify tracking viability over a period of time rather than just at time point 0H.
Each sample from the initial experiments, outside of one (1.5% double emulsion) had a reasonable
initial viability levels and it was at time points 24H and 48H that the values began to decrease, in the
most extreme cases as much as 44%.
It is preferable for stem cells to stay viable for as long as possible. In fact, certain neurological
stem cell treatments track the cells for up to 14 days after in-vivo implantation, while stroke treatments
with stem cell therapies are tracked for up to 4 weeks [123], [124]. To ensure that both single and

65
double emulsion microdroplets do not impact the stem cells over a long period of time, the viability
data collected should be tracked for a longer duration.
0 H
24 H
48 H
0
20
40
60
80
100
Time (h)
% V
iab
ilit
y
1.5% (10 M-cells/mL)
Single Emulsion
Double Emulsion
0 H
24 H
48 H
0
20
40
60
80
100
Time (h)
% V
iab
ilit
y
2% (10 M-cells/mL)
Single Emulsion
Double Emulsion
*
0 H
24 H
48 H
0
20
40
60
80
100
Time (h)
% V
iab
ilit
y
1.5% (7.5 M-cells/mL)
Single Emulsion
Double Emulsion
0 H
24 H
48 H
0
20
40
60
80
100
Time (h)
% V
iab
ilit
y
2% (7.5 M-cells/mL)
Single Emulsion
Double Emulsion
0 H
24 H
48 H
0
20
40
60
80
100
Time (h)
% V
iab
ilit
y
1.75% (7.5 M-cells/mL)
S - 7.5 M-cells/mL
D - 7.5 M-cells/mL
Figure 34. Viability of cells over 48H. 33a. Viability of 1.5% single and double emulsion microdroplets over 48H.
There is no significant difference between the single and double emulsion samples at any of the time points, nor is
there a significant difference within each type of microdroplet at any of the timepoints. 33b. Viability of 2% single
and double emulsions over 48H. There is no significant difference between the single and double emulsion samples
at any of the time points and the double emulsion samples do not show a significant difference within the samples at
any time points. A difference does arise in the 2% single emulsion between 0H and 48H (p = .007). There is no
significant difference between 0H - 24H or 24H – 48H, however, over the duration of the experiment, the viability
drops a statistically significant amount.
Figure 33. Viability of cells within microdroplets over a 48H
period of time. 34a, 34b, and 34c show the viability over time
for 1.5%, 1.75% and 2% agarose microdroplets respectively.
Over time, viability dropped for all samples except for 1.5%
double emulsion microdroplets. Poor viability puts into
question further data points collected for egress studies and
therefore these initial experiments were discarded and
redone, the results of which are shown In Figure 34.

66
Microdroplet Structure
Z-stack imaging from a confocal microscope is used to gather information on double emulsion
microdroplets in a 3D orientation. One might make the argument that 2D images showing single and
double emulsions in any sort of configuration, with or without cells, are actually images of objects
stacked on top of each other and kept in place by the pressure of a glass cover slip. To ensure that the
microdroplets are indeed in the configuration we state that they are in – 3D images are provided to
exemplify the structures.
3D images from z-stack imaging are best done with a glass bottom well plate, which was not
accessible during this research project. Using the standard thick plastic well plates for imaging led to
sub-optimal quality images. However, given the LIVE/DEAD kit stain, the cells were still
distinguishable from the surrounding microdroplet emulsion. Future work done to visualize the
Figure 35. Representation of the XY, ZY
and XZ planes shown in the orthogonal
images. This figure aims to help visualize the
planes presented in the orthogonal views.

67
double emulsion structures would greatly benefit from a multi dye setup which stains the inner shells,
outer shells and the cells a different colour without relying on the bright field component.
Orthogonal images are presented as three planes, the XY, YZ and XZ planes, shown in Figure 35.
Analyzing the images requires imagining the structure in 3D space.
To serve as a guide and an example of how to interpret the images presented in this section, a
brief explanation is provided. Figure 36 depicts an orthogonal view of 2% double emulsion
microdroplet, with an empty inner microdroplet. All three images are marked with the plane that they
represent. Each image is marked with two yellow lines that relates the position of the intercepting
edge
edge
edge edge
Figure 36. Orthogonal view of a 2% double emulsion microdroplet. Images of the three planes helps to visualize the
microdroplets in 3D space and identify their structure.

68
point to the other two planes. In Figure 36 the intersection of the yellow lines is within the smaller
microdroplet positioned either within or above the larger microdroplet. Following the cross section
from the XY plane to the right shows YZ plane, and to the bottom the XZ plane. The XY plane
represents the standard 2D plane one sees under normal microscopy. To identify the placement of
the smaller sphere in relation to the larger sphere, one first follows the yellow line down to the XZ
plane. To the left and right of the yellow line intersections are two bright white lines, marked with
“edge”. At points marked “edge”, white lines that mark the diffraction of light caused by the brightfield
image bending at the edges of the agarose microdroplet can be seen. The diffracted lines align with
the edges of the larger microdroplet. The smaller microdroplet’s diffraction is not as bright likely due
to the fact that it is positioned in between the scanning area. Similarly, the diffraction lines can also be
seen in the YZ plane, and in they too hold the smaller microdroplet within the larger microdroplet.
Combining the data extracted from each plane, one can reasonably assume that the smaller
microdroplet is within the larger microdroplet, confirming the successful creation of a double
emulsion.
To then confirm the structure of a single emulsion of cells, one turns to Figure 37, which depicts
the orthogonal view of a cell-laden single emulsion microdroplet. In the XY plane, the microdroplet
of focus can be identified as the cell-laden microdroplet containing a green-stained cell. The green dye
indicates that the cell is alive, but in this case – the dye is used to identify the cell’s placement within
the microdroplet. Similarly to the previous image, Figure 36, the bending of light from the brightfield
component of this confocal image creates a crossing of sorts. In the YZ plane, the cross is a little
blurred towards the top due to the directly adjacent microdroplet, while in the XZ plane, the left and
right edges can be seen with the two white crosses.
Taking information from the three planes, it can be inferred that the cell is positioned in the center
of the Z plane, but close to the edge in the X direction. It is this type of cell that we hypothesize is

69
likely to leave, as it is located so close to the edge. The porous nature of agarose paired with the cell’s
proximity to the edge provides the cell a direction out. The blue boxes relate the microdroplets in each
plane, showing that in all planes, the cell is within the emulsion.
Finally, Figure 38 shows a double emulsion containing a cell. In this image, the cell is most likely
in poor condition as it has begun to take up the red stain which indicates cell death. Regardless, it is a
good example of cell positioning and thus presented to display a cell within a presumed double
emulsion created using our microfluidic platform. Due to the fact that the inner emulsion is 1.5%
agarose, it appears a bit faint in the brightfield image, but the outline can still be made out. The outer
droplet can be seen again using the diffracted light, and the XZ plane shows a fairly bright light
diffraction for the inner emulsion as well. From this, it can be implied that the cell is nested within the
single emulsion which is then nested with a double emulsion.
Figure 37. Orthogonal
view of a cell-laden 2%
single emulsion
microdroplet.

70
Using a confocal microscope to take z-stack images provided proof of concept data of the
structure of single and double emulsions. Cell-laden single emulsions, double emulsions with an empty
inner droplet and a cell-laden double emulsion droplet are shown. While three images is not enough
to provide a dataset to make a claim about double emulsion structures as a whole, experience in
creating encapsulations has done little to point towards cells simply being stacked on top or under
microdroplets and held in place by the microscope cover slip. When imaging double emulsions,
especially with 1.5% inner agarose microdroplets – multiple images must be taken at different points
in the z-direction to ensure that there is in fact an inner capsule. This is done because the inner droplets
can be difficult to see, however, in doing so, it was also observed that the cells are only in focus in
between the points where the inner emulsion is in focus – further supporting the claim that the cells
appearing with the double emulsion structure are indeed inside. These claims are, still, anecdotal and
based on personal experience and do not provide empirical data. For this reason, future experiments
collecting 3D images would be of interest. Using fluorescent agarose, ideally of two different colours
to create droplets that fluoresce would be a more clear way to see the structure of the droplets. Two
differently dyed agarose hydrogels could also give insight into the distribution of agarose
concentrations within the structure when different concentrations are used. For example, if the inner
shell is 1.5% agarose and the outer shell is 2% agarose, does the gel form a gradient for any reason?
Does the more aqueous components of the lower agarose concentration bleed into the outer shell as
a gradient? Such a gradient would imply that at the interface of the inner and outer droplets, the
hydrogels are not at either of the expected concentrations. More than just identifying the structural
geometry of the microdroplets, the proposed experiments could be used to investigate the general
positioning of the microdroplets. It would be interesting to find a correlation between the average
number of cells that are close to the edge in a double emulsion and the rate of egress. This would

71
further support our proposed hypothesis of cells on the edge of microdroplets being the ones that
egress out.
Figure 38. Double emulsion microdroplet with an inner cell-laden 1.5% microdroplet that has taken up both the red
and green stain from the LIVE/DEAD kit, implying an inviable cell. However, due to the brightness of the sample,
it illustrates the cell position clearly. Objects within the blue box indicates it belongs to the 1.5% inner microdroplet,
while the yellow boxes all indicate an outer emulsion.

72
Egress
Cell egress is a measurement of the percentage of cells that leave the microdroplets after
encapsulation over a period of time and is calculated as a function of the change in occupancy.
Fundamentally, it is the measurement used to support or disprove our hypothesis.
Firstly, egress of single emulsions is shown in Figure 39. Egress for single emulsions was calculated
by using time point imaging. For each time point, 10 random images were taken of a 12-well plate
containing 1 mL of DMEM and 20,000 total microdroplets. From the 10 random images, the number
of empty microdroplets and the number of cell-laden (or occupied) microdroplets are counted.
Occupancy is the total number of cell-laden microdroplets divided by the total number of
microdroplets present in all 10 images. As time point images are taken at hours 0H, 24H and 48H –
egress at timepoint 0H is considered 0%. Egress at 24H is the percentage change of occupancy from
0H to 24H, and egress at timepoint 48H is the percentage change from 0H to 48H.
Single emulsion microdroplets made of 1.5% agarose and 2% agarose containing 10 x 106 𝑐𝑒𝑙𝑙𝑠
𝑚𝐿.
showed similar egress profiles over a 48H time-point, with 2% agarose microdroplets showing a higher
average egress at each time point. At time point 24H, 2% agarose microdroplets had an average egress
of 49%, while the 1.5% agarose microdroplets had an average egress of 38%. At time point 48H, 2%
agarose microdroplets still had a higher egress, with 66% while 1.5% agarose microdroplets had an
egress of 50%. Despite the differences in the average egress, there was no statistical difference (p >
.05) between the samples at the 24H and 48H time point.
It has been shown that egress is higher for agarose with relatively lower concentrations, for
example, 1.5% agarose microdroplets should have higher egress compared to 2% agarose
microdroplets [82]. Due to the discrepancy, more experiments need to be done testing single emulsion
cell egress to compare with the published data. It is more likely that droplets with a lower

73
concentration have a higher egress because the microdroplets are structurally more porous and give
cells more pathways out [82]. We cannot, therefore, draw an appropriate conclusion from the average
egress values between the two agarose concentrations – but only a magnitude of egress. In this case,
single emulsions have an egress rate of about 40% - 60% over 48H, if the agarose concentration is in
between 1.5% and 2%. Future work should aim to conclude if a pattern exists between the two agarose
concentrations, as seen in the literature.
Cell egress from double emulsion microdroplets was quantified in two ways, using unadjusted and
adjusted egress. Unadjusted egress is calculated using the total number of microdroplets present per
0 H
24 H
48 H
0
20
40
60
80
100
Time (h)
% E
gre
ss
Egress of Single Emulsions
1.5%
2%
Figure 39. Cell egress from single emulsion microdroplets at 1.5% agarose and 2% agarose concentrations, with a cell
concentration of 10 x 106 𝑐𝑒𝑙𝑙𝑠
𝑚𝐿. Samples did not show a significant difference from one another, with (p=.3 at 24H)
and (p=.07 at 48H), there was a continuous trend of cells egressing more for 2% agarose microdroplets compared to
1.5% agarose microdroplets. These results do not line up with published findings and therefore must be further
investigated.

74
time point, while adjusted egress is counted using only microdroplet-laden emulsions. Details on the
methods of counting are provided below.
One must recall that not all double emulsion microdroplets will be occupied with an inner sphere,
and because the occupancy of the inner microdroplet is not 100%, the double emulsion samples will
have even less cell-laden samples. The three states of existence for a double emulsion is then empty
(which is one large empty microdroplet), occupied with single emulsions that have no cells, and
occupied with a microdroplet that contains one or more cells. This is different from single emulsions
where microdroplets can only exist with or without cells. Adjusted occupancy corrects the double
emulsion counts from three potential states of existence to two, which more closely resembles the
counting done for single emulsions. To allow for a meaningful comparison, egress from single
emulsions was compared to egress from double emulsions as defined using the adjusted counting
method.
Unadjusted and adjusted egress counts are compared in Figure 40. Through the comparison,
benefits of using the adjusted egress values are seen as the unadjusted counterpart is influenced by
fluctuations in how many empty double emulsion microdroplets (meaning no cell-laden or empty
single emulsion within the droplet) there are. There is no significant difference between the adjusted
and unadjusted egress values for 1.5% double emulsions, shown in Figure 40a. Figure 40b illustrates
egress for 2% double emulsions, and like the previous comparison, there is no significant difference
between the two measurement methods at any of the three timepoints. Despite the lack of statistical
difference between the two measurement types, there is a disparity in the trends demonstrated.
Unadjusted values, in both cases, show the 24H time point having higher egress than the 48H time
point. 1.5% double emulsion egress goes from 22.5% to 9.5% egress between time points 24H and
48H. Similarly, for 2% double emulsion egress, the egress changes from 19% to 18% between time
points 24H and 48H. It is very improbable that the cells re-enter the droplets once they leave, and the

75
findings are more than likely an error brought on by the counting metric. Unadjusted occupancy is
influenced by images that randomly contain more empty emulsions. The data of interest for double
emulsion tests is to measure how many cells exit from a double emulsion structure. Large droplets
with a cell and no inner droplets have not been observed thus far, and so empty emulsions do little to
provide any insight into the egress process. Their presence does, however, dampen the effects of cell
egress between occupied double emulsions and cell-laden droplets. In fact, these discrepancies
disappear when using the adjusted counting method, which removes the convolution with the droplet
occupancy of the double emulsion – perhaps an indication that during some stages of the counting
process, there were was an influential amount of totally empty large droplets created during the double
emulsion process. Adjusted values show a more sensible pattern, as the egress slightly increases from
24H to 48H for both samples, with 1.5% egress recorded as 15% to 15.3% from 24H to 48H and 2%
egress recorded as 8.6% to 9.3% from 24H to 48H. It is far more realistic that there is very little or no
change in egress than there is a re-entering of cells. Due to the fact that there is no significant
difference between the two types of measurement, it can be implied that the impact of the empty large
droplets produced in the double emulsion is effecting the trend. Both types of measurements imply a
lower amount of egress compared to the single emulsion droplet type. Therefore, due to the fact that
the unadjusted egress repeatedly shows an unlikely trend and the difference between the adjusted and
unadjusted values are not significantly different, comparison of single emulsions and double emulsions
will be done using the adjusted values of the double emulsion microdroplets.

76
Adjusted egress between the two double emulsion samples of 1.5% and 2%, depicted in Figure
41, also showed no significant difference at each time point, however, on average, the egress within
double emulsions containing 2% microdroplets with cells was lower than the egress of cells containing
1.5% microdroplets. This seems consistent with the fact that agarose at higher concentrations is stiffer
than it is at lower concentrations and thus makes it harder for cells to egress [82]. When comparing
the difference between single and double emulsions, it must be noted that each concentration showed
similar egress. In other words, 1.5% and 2% single emulsions showed similar egress that was not
significantly different from one another, and 1.5% and 2% double emulsions showed egress that was
also not significantly different from one another as well. From the data presented in Figure 41, it seems
that the inner emulsion concentration is impacting the egress values, however, still lower than the
average egress amounts for single emulsions. Experiments presented in this manuscript hold the outer
emulsion concentration constant while varying the inner microdroplet concentrations, however,
experiments varying the outer emulsion concentration while holding the inner concentration constant
might give interesting insight into the impact of the outer shell. With the current data, we cannot
determine if the egress is impacted by the concentration of the outer or inner shells. Additionally, the
0 H
24 H
48 H
0
10
20
30
40
Time (H)
% E
gre
ss
1.5% Double Emulsions
(unadjusted vs adjusted)Double
Double (adjusted)
0 H
24 H
48 H
0
10
20
30
40
Time (H)
% E
gre
ss
2% Double Emulsions
(unadjusted vs adjusted)Double
Double (adjusted)
Figure 40. Egress of cells from double emulsion microdroplets using the adjusted and unadjusted methods. 40a.
demonstrates egress of 1.5% double emulsions. There is no significant difference between the two methods (p=.14 at
24H) and (p=.50 at 48H). 40b. demonstrates egress of 2% double emulsions. There is no significant difference between
the two methods (p=.97 at 24H) and (p=.32 at 48H). As there is no difference between the two methods of
measurements, we can conclude that the data Is not altered using the adjusted egress counting method.

77
trends observed here are opposite to the trends observed for the single emulsions. As mentioned
previously, it is expected that lower concentration agarose droplets should have a higher cell egress
which is what was observed for double emulsions but not single emulsions. These findings give more
reason to investigate what may have caused the errors in single emulsions.
Perhaps the egress observed in the double emulsion microdroplets is still only due to cells on the
edge of the microdroplet. Cells situated in a double emulsion configuration that contains the inner
microdroplet close to the edge may still be produced. While there is no way of knowing, given the
current data, if that is indeed the reason for this egress, it may be a reasonable explanation given that
there is little egress that takes place between 24H and 48H. All the cells situated close to the edge end
up leaving within the first 24H, and those who are not by the edge remain within the capsule. Such an
idea can be explored using confocal microscopy to take 3D images and time-lapse imaging to track
cells over time.
Finally, egress between single and double emulsions is compared. Double emulsions consistently
had a lower egress value than single emulsions at each timepoint. Figure 42a shows the egress of 1.5%
agarose single emulsions, with a diameter of 40 – 50 m and double emulsions, with a diameter of
100-120 m. At timepoints 24H and 48H, the single emulsion microdroplets had a significantly higher
amount of egress than the larger double emulsion. Furthermore, between 24H and 48H, the egress in
1.5% agarose single emulsions continued to increase while it plateaued for double emulsions. Figure
42b shows an identical pattern of higher cell egress for 2% single emulsions with respect to 2% double
emulsions. Much like the previous samples, the egress values were significantly different between the
two concentrations at each time point. At time points 24H and 48H, 1.5% single and double emulsions
had significantly different egress values from each other. Similarly, 2% single and double emulsions
had significantly different egress values from each other 24H and 48H. For both cases, single
emulsions had a higher egress than the double emulsion counterpart. Additionally, there was a

78
noticeable plateau in egress for the double emulsion microdroplets for both concentrations between
timepoint 24 H and 48 H, while the single emulsion continued to egress between the 24H and 48H
point.
0 H
24 H
48 H
0
10
20
30
Time (h)
% E
gre
ss
Adjusted Egress
of Double Emulsions1.5%
2%
0 H
24 H
48 H
0
20
40
60
80
100
Time (h)
% E
gre
ss
1.5%
Single
Double (adjusted)
0 H
24 H
48 H
0
20
40
60
80
100
Time (h)
% E
gre
ss
2%
Single
Double (adjusted)
* ** * *
Figure 42. A comparison of cell egress out of double emulsion microdroplets of 1.5% and 2% inner shell
concentration using the adjusted egress method. There is no significant difference in cell egress at 24H (p=0.75)
and at 48H (p=0.51).
Figure 41. Comparison of egress between single emulsions and double emulsions at two different inner
microdroplet concentrations. 42a. depicts egress between 1.5% single and double emulsions. There is a significant
difference between the samples at both timepoints 24H (p= .04) and 48H (p=.01). 42b. depicts egress between 2%
single and double emulsions. There is a significant difference between samples at both timepoints 24H (p=.01) and
48H (p=.005).

79
Extending size of a microdroplet by creating a secondary emulsion does indeed lesson the amount
of egress – however, there is not enough evidence to explain why. It was hypothesized that it was the
cells on the edge of the microdroplets that leave and in order to push the cells towards the center of
the microdroplet, the secondary layer would be created. Unfortunately, the double emulsion
microdroplet production method used in this thesis did not always center the cells. While the width
and height of the double emulsion device are 110 m and 160 m respectively, the single emulsion
droplets introduced into the device are between 40 – 50 m. This leaves plenty of space for the
droplets to move around. Literature exists on centering samples in a microfluidic encapsulation device,
and perhaps the inclusion of such channel features can help in centering the position of the inner
droplet – leading to certainty that cells are not close to the edge of the device [116]. Assuming the cells
are centered, any amount of egress could contest the hypothesis.
Cell encapsulation work has been done in order to reduce in-culture cell egress and found that
the cells remain in capsules for longer [125]. The same study found that untreated encapsulated cells
had a tendency to leave within three days. While the purpose of this project is to keep them at the
target location for a longer period of time in the context of cell-based therapy, it still investigates a
similar phenomenon.
As mentioned previously, there is a need to do more egress experiments in order to explore why
1.5% single emulsions have a lower average egress than 2% single emulsions. This trend is not
supported by literature [82]. The double emulsions on the other hand, do show a higher amount of
egress when the inner droplets are 1.5% compared to when the inner droplets are 2%. This is certainly
a reasonable finding based on the concentrations of the inner droplets, however, impact of the
constant 2% agarose concentration of the outer emulsion, which is by volume a much larger
component of the entire microdroplet, is unclear from the data.

80
Finally, regardless of the significant difference, the egress values have a rather large standard
deviation. Doing more replicates of this experimental protocol would either a more clear trend with
less variance or attribute the egress process variable to microfluidic devices – and perhaps for a more
fine-tuned control, one might have to start investigating in controlling cell behavior through other
channels.

81
CONCLUSION
For this research project, two objectives were accomplished. First, a process to create a hydrogel-
in-hydrogel double emulsion microdroplet with no intermediate oil layer was developed and
characterized. Secondly, double emulsion microdroplets produced using the developed process were
applied to cell studies in order to understand the mechanism of cell egress from a microdroplet.
A flow focusing microfluidic device geometry was used to create single and double emulsion
microdroplets in the desired size ranges. Single emulsions were intended to be 40 – 50 m in size,
whereas double emulsions were intended to be 110 – 130 m in size. Coefficient of variation (CV)
values were used to measure monodispersity, with a higher CV implying lower monodispersity. Single
emulsion microdroplets exhibited a range of CV from 6% - 11%, while the double emulsion
microdroplets had a higher CV range from 7% - 14%. Although the droplets were created in the
intended range, literature reports that microdroplets can be formed using microfluidic platforms with
a CV as low as 1% - 3%, thus aspects of droplet production used in this body of work can indeed be
improved upon [67].
Throughput, or the amount of droplets created by the microfluidic device per a unit time, was
highly variable, but the variability effected all samples measured with no clear trend. On average,
double emulsions had a lower throughput than single emulsions as expected. Double emulsions are
larger in size and have a greater volume. For all encapsulation sessions, the same volume of agarose
(150 L) is inserted for both single and double emulsions, therefore, there will be less microdroplets
produced. Past work has indicated that the throughput of microfluidic production devices, at least for
single emulsions, can be as high as 100 - 200 Hz, compared to the average 85 Hz and 79 Hz (for
samples with polystyrene beads and cells respectively) observed in this body of work [119].

82
Cell viability was maintained throughout this experiment for both single and double emulsion
microdroplets, with the highest overall change in viability over 48H being -6%. From our findings, it
can be concluded that cells can remain viable in-vitro for 48H after encapsulation for both single and
double emulsions alike. It is, however, important to ensure that cells are handled properly as their
viability can be negatively impacted by mishandling samples.
Confocal microscopy is used to confirm the structure of the single and double emulsion
microdroplet. Using an orthogonal view, we confirm that cells we identify as cell-laden are in-fact cells
within agarose droplets. A LIVE/DEAD stain shows both viable and inviable cells in a microdroplet
in an orthogonal view. While there was not enough data collected on the 3D structure and positioning
of cells within double emulsions to draw a proper conclusion on cell positioning, proof of concept
work shown in this project and experience from working with cells gives a level of certainty that the
double emulsions seen under standard brightfield microscopy is indeed a double emulsion.
Finally, egress between single and double emulsions is compared. Between single and double
emulsions for both tested concentrations, 1.5% and 2% agarose, there was a significant difference in
cell egress. Single emulsions show a significantly higher amount of egress at timepoints 24H and 48H.
Furthermore, double emulsion microdroplets show the greatest amount of egress within the first 24H
with little to no egress between 24H and 48H. Single emulsions on the other hand also showed the
largest amount of egress between 0H and 24H but continued to show cell egress between 24H and
48H. Given the results, we claim that viable cells are significantly more likely to egress out if they are
closer to the edge of a microdroplets.
Double emulsion microdroplets were used to study the model cell line, NIH 3T3, in order to gain
insight into cell behavior in terms of viability and egress. It was hypothesized that cells egress when
they are at the edge of a microdroplet, and by creating a secondary layer, the position of the cells could
be pushed closer towards the center and thus reduce the amount of cells that exit. Creating the double

83
emulsion did indeed reduce the amount of egress observed while providing an environment in which
the cells remain viable thereby supporting our hypothesis that pushing cells further away from the
edges will reduce cell egress. While the double emulsions significantly reduced cell egress, it did not
completely eliminate egress and for that reason further work needs to be done in order to investigate
cell egress mechanisms.

84
FUTURE WORK
Microfluidic devices used for the encapsulation of stem cells are done so for therapeutic outcomes
and therefore must be user-friendly while providing a consistent output. Work done in this project
would highly benefit from more investigation into creating a less polydisperse sample. While the 6%
coefficient of variation (CV) for single emulsions was close to the 1% - 3% benchmark set by other
researchers, the larger droplets in this body of work had a much higher CV and should be better
controlled. A possible approach for this is to investigate multiple flow rates, pressures, and surfactant
concentrations on the effects of monodispersity of double emulsion microdroplets, as has been done
for single emulsions [119]. In a clinical setting, the microfluidic device should perform consistently
and therefore the throughput of the device needs to have less variability. Potential approaches to better
control throughput may be found in modifying device geometry for better pressure ratio controls.
Cell egress results show that double emulsion microdroplets do not entirely prevent cell egress
and this is worth further investigation. While single and double emulsions both have the largest egress
amounts between timepoints 0H and 24H, cells continue to egress out of single emulsions between
24H and 48H, while the egress remains almost zero for the same time period in double emulsions.
Work must be done to understand why this happens as it opens the door to creating tunable cell
release profiles.
One reason that double emulsions may not have shown a total lack of egress might be in that our
method of double emulsion production failed to center all the cell-laden microdroplets to ensure that
they were away from the edges. Given the data collected, the distribution of cell placement is unclear
for both single and double emulsion microdroplets, and understanding such a factor might give more
insight into cell egress. Collecting more data using the z-stack capabilities of a confocal microscope to
experimentally quantify the number of cells at the edge and comparing that number to cell egress

85
might paint a more clear picture of the mechanisms of cell egress. Such an experiment might also give
insight into additional motivations for cells wanting to exit a microdroplet. If all cells positioned close
to the edge of a microdroplet leave within the first 24H, then there might be a secondary mechanism
of egress in place that is observed between 24H – 48H, as seen in the single emulsion data.
Double emulsion microdroplets created in this project were always done with an outer layer
concentration of 2% agarose. Investigating the effects of changing concentration of the outer
emulsion while keeping the inner emulsion concentration constant might prove to be a method for
controlling egress over time, as a change in agarose concentration changes the porosity of the hydrogel
matrix [82]. Given that there was no significant difference between the two samples of double
emulsions tested (1.5% and 2% inner concentrations), cell egress in a double emulsion system may be
a function of outer microdroplet concentration. Should the outer layer agarose concentration be the
determining factor of cell egress in a double emulsion, a decreased agarose concentration from the
2% used here should yield a higher amount of egress while a higher outer layer agarose concentration
should yield a lower amount of egress, assuming a constant inner microdroplet concentration.
The ability to control cell egress can play a crucial role in cell-based therapy, where cell retention
may be preferred to having mobile cells that can exist at the target location after an acute therapeutic
effect or integrate into the target tissue [82]. Benefits of the sticky nature of agarose hydrogel paired
with the reduced level of cell egress provide a cell therapy solution that keeps cells at the desired target
location. Of course, before being used in animal trials, effects of double emulsions on the viability of
therapeutic cells must be investigated. NIH 3T3 cells are a model cell line commonly used for their
robustness in drug discovery studies and tissue engineering – not for therapeutic applications [126].
While double emulsion configurations did not negatively impact the viability of NIH 3T3 cell samples,
in-vitro tests with the more sensitive therapeutic cell lines such as HUVEC and hMSCS still have to
be done in order to ensure that double emulsion microdroplet systems remain safe for cells in terms

86
of viability. Furthermore, therapeutic cell egress profiles must be studied to ensure the effects of
double emulsion microdroplets are similar for all cell lines. Should there be a difference, it may arise
due to different egress mechanisms and alternative methods of controlling egress have to be
investigated. Perhaps it is a combination of mechanisms such as proximity to the edge and chemical
signals from neighboring cells or tissues.
From a technological stand-point, creating a hydrogel-in-hydrogel double emulsion with a
microfluidic cell encapsulation platform was an interesting and useful success, however, further work
into the creation of double emulsion microdroplets must be done. Current practices involve two
sample purification methods to remove oil from the output. At this point, it is possible that there is
some sample loss due to manipulation. Frequent manipulation and agitation of the sample in the form
of pipetting and centrifugation might also promote cells to prematurely egress out of the
microdroplets, altering the occupancy. As seen in the results, the most egress takes place within the
first 24H after encapsulation, and the time (generally about an hour) between creating the first
emulsion and second emulsion could prove to affect the occupancy of the double emulsion. For this
reason, work must be done in order to create a microfluidic platform that removes oil on-chip. On-
chip oil removal would eliminate the need to manipulate the sample in-between single and double
emulsion encapsulation points, leading to a ready-to-use output.
Hydrogel-in-hydrogel double emulsion droplets provide a function outside of cell egress studies
as well. Agarose hydrogel can be modified to alter certain properties by adding fluorescence, loading
it with nanoparticles to change the electrical characteristics or by mixing it with chemicals to change
how cells interact with the material. Usually, these changes must be carefully considered due to the

87
potential for cytotoxicity, however, double emulsions allow for the presence of sub environments, so
the cells can be kept in a biocompatible and non-cytotoxic setting.
A combination of hydrogels or different materials can also be incorporated into double emulsion
systems, with one shell being a different material, or phase from the other. Such a combination also
provides users of the microfluidic platform to create more biomimetic environments. An outer shell
that acts as the solid surface for cells to attach onto can be augmented with common proteins and
molecules found in the native cell environment, while the inner layer, can be supplemented with
substances found in the extra cellular matrix.
This project has demonstrated a proof of concept hydrogel-in-hydrogel double emulsion
microdroplet, characterized the monodispersity and throughput of the microdroplet. The effects of
double emulsions on cell egress is explored in order to better understand cell behavior in the context
of stem cell therapy. Moreover, it has identified the current shortcomings of the double emulsion
system, potential solutions for how to address the issues, as well as avenues in which interested
researchers can explore further.

88
References
[1] P. Boisseau and B. Loubaton, “Nanomedicine, nanotechnology in medicine,” Comptes Rendus
Phys., vol. 12, no. 7, pp. 620–636, Sep. 2011.
[2] G. M. Whitesides, “The origins and the future of microfluidics,” Nature, vol. 442, no. 7101,
pp. 368–373, Jul. 2006.
[3] D. Di Carlo, “Inertial microfluidics,” Lab. Chip, vol. 9, no. 21, p. 3038, 2009.
[4] J. Zhang et al., “Fundamentals and applications of inertial microfluidics: a review,” Lab. Chip,
vol. 16, no. 1, pp. 10–34, 2016.
[5] D. B. Weibel and G. M. Whitesides, “Applications of microfluidics in chemical biology,” Curr.
Opin. Chem. Biol., vol. 10, no. 6, pp. 584–591, Dec. 2006.
[6] C. D. Ahrberg, A. Manz, and B. G. Chung, “Polymerase chain reaction in microfluidic
devices,” Lab. Chip, vol. 16, no. 20, pp. 3866–3884, Oct. 2016.
[7] H. S. Rho, A. T. Hanke, M. Ottens, and H. Gardeniers, “Mapping of Enzyme Kinetics on a
Microfluidic Device,” PLOS ONE, vol. 11, no. 4, p. e0153437, Apr. 2016.
[8] D. J. Beebe, G. A. Mensing, and G. M. Walker, “Physics and Applications of Microfluidics in
Biology,” Annu. Rev. Biomed. Eng., vol. 4, no. 1, pp. 261–286, Aug. 2002.
[9] X. Leng, W. Zhang, C. Wang, L. Cui, and C. J. Yang, “Agarose droplet microfluidics for highly
parallel and efficient single molecule emulsion PCR,” Lab. Chip, vol. 10, no. 21, p. 2841, 2010.
[10] F. A. Gomez, Biological Applications of Microfluidics. John Wiley & Sons, 2008.
[11] S.-Y. Teh, R. Lin, L.-H. Hung, and A. P. Lee, “Droplet microfluidics,” Lab. Chip, vol. 8, no. 2,
pp. 198–220, Jan. 2008.
[12] X. Sun, K. Tang, R. D. Smith, and R. T. Kelly, “Controlled dispensing and mixing of pico- to
nanoliter volumes using on-demand droplet-based microfluidics,” Microfluid. Nanofluidics, vol.
15, no. 1, pp. 117–126, Jul. 2013.
[13] J.-W. Choi, G.-J. Kim, S. Lee, J. Kim, A. J. deMello, and S.-I. Chang, “A droplet-based
fluorescence polarization immunoassay (dFPIA) platform for rapid and quantitative analysis of
biomarkers,” Biosens. Bioelectron., vol. 67, pp. 497–502, May 2015.
[14] P. Xue, Y. Wu, N. V. Menon, and Y. Kang, “Microfluidic synthesis of monodisperse PEGDA
microbeads for sustained release of 5-fluorouracil,” Microfluid. Nanofluidics, vol. 18, no. 2, pp.
333–342, Feb. 2015.

89
[15] G. Aubry, M. Zhan, and H. Lu, “Hydrogel-droplet microfluidic platform for high-resolution
imaging and sorting of early larval Caenorhabditis elegans,” Lab. Chip, vol. 15, no. 6, pp. 1424–
1431, Mar. 2015.
[16] W.-L. Chou, P.-Y. Lee, C.-L. Yang, W.-Y. Huang, and Y.-S. Lin, “Recent Advances in
Applications of Droplet Microfluidics,” Micromachines, vol. 6, no. 9, pp. 1249–1271, Sep. 2015.
[17] R. R. Nadig, “Stem cell therapy – Hype or hope? A review,” J. Conserv. Dent. JCD, vol. 12, no.
4, pp. 131–138, 2009.
[18] H. Yin and D. Marshall, “Microfluidics for single cell analysis,” Curr. Opin. Biotechnol., vol. 23,
no. 1, pp. 110–119, Feb. 2012.
[19] N. Wen et al., “Development of Droplet Microfluidics Enabling High-Throughput Single-Cell
Analysis,” Molecules, vol. 21, no. 7, p. 881, Jul. 2016.
[20] R. K. Shah et al., “Designer emulsions using microfluidics,” Mater. Today, vol. 11, no. 4, pp.
18–27, Apr. 2008.
[21] W. Wang, M.-J. Zhang, and L.-Y. Chu, “Microfluidic approach for encapsulation via double
emulsions,” Curr. Opin. Pharmacol., vol. 18, pp. 35–41, Oct. 2014.
[22] J. Yan, W.-A. Bauer, M. Fischlechner, F. Hollfelder, C. Kaminski, and W. Huck,
“Monodisperse Water-in-Oil-in-Water (W/O/W) Double Emulsion Droplets as Uniform
Compartments for High-Throughput Analysis via Flow Cytometry,” Micromachines, vol. 4, no.
4, pp. 402–413, Dec. 2013.
[23] “Hierarchical Biomolecular Emulsions Using 3-D Microfluidics with Uniform Surface
Chemistry - Biomacromolecules (ACS Publications).” [Online]. Available:
https://pubs.acs.org/doi/pdfplus/10.1021/acs.biomac.7b01159?src=recsys. [Accessed: 24-
Jan-2019].
[24] P. Garstecki, I. Gitlin, W. DiLuzio, G. M. Whitesides, E. Kumacheva, and H. A. Stone,
“Formation of monodisperse bubbles in a microfluidic flow-focusing device,” Appl. Phys. Lett.,
vol. 85, no. 13, pp. 2649–2651, Sep. 2004.
[25] J. D. Tice, H. Song, A. D. Lyon, and R. F. Ismagilov, “Formation of Droplets and Mixing in
Multiphase Microfluidics at Low Values of the Reynolds and the Capillary Numbers,”
Langmuir, vol. 19, no. 22, pp. 9127–9133, Oct. 2003.
[26] “Laminar, Transitional or Turbulent Flow.” [Online]. Available:
https://www.engineeringtoolbox.com/laminar-transitional-turbulent-flow-d_577.html.
[Accessed: 24-Jan-2019].

90
[27] S. B. Pope, Turbulent flows, Reprinted with corr.. Cambridge ; New York: Cambridge University
Press, 2001.
[28] M. Schobeiri, Applied fluid mechanics for engineers. New York: McGraw Hill Education, 2014.
[29] J. P. Brody, P. Yager, R. E. Goldstein, and R. H. Austin, “Biotechnology at low Reynolds
numbers,” Biophys. J., vol. 71, no. 6, pp. 3430–3441, Dec. 1996.
[30] D. Cheng et al., “Laminar Flow in Microfluidic Channels,” p. 14.
[31] B. Lautrup, Physics of continuous matter: exotic and everyday phenomena in the macroscopic world, 2nd ed.
Boca Raton: Taylor & Francis, 2011.
[32] H. Gu, M. H. G. Duits, and F. Mugele, “Droplets Formation and Merging in Two-Phase Flow
Microfluidics,” Int. J. Mol. Sci., vol. 12, no. 4, pp. 2572–2597, Apr. 2011.
[33] “Effect of surfactant on emulsification in microchannels - ScienceDirect.” [Online]. Available:
https://www.sciencedirect.com/science/article/pii/S0009250917306425. [Accessed: 24-Jan-
2019].
[34] J. K. Nunes, S. S. H. Tsai, J. Wan, and H. A. Stone, “Dripping and jetting in microfluidic
multiphase flows applied to particle and fiber synthesis,” J. Phys. Appl. Phys., vol. 46, no. 11,
Mar. 2013.
[35] T. M. Tran, S. Cater, and A. R. Abate, “Coaxial flow focusing in poly(dimethylsiloxane)
microfluidic devices,” Biomicrofluidics, vol. 8, no. 1, Feb. 2014.
[36] P. Garstecki, M. J. Fuerstman, H. A. Stone, and G. M. Whitesides, “Formation of droplets and
bubbles in a microfluidic T-junction—scaling and mechanism of break-up,” Lab. Chip, vol. 6,
no. 3, pp. 437–446, Feb. 2006.
[37] H. Liu and Y. Zhang, “Droplet formation in a T-shaped microfluidic junction,” J. Appl. Phys.,
vol. 106, no. 3, p. 034906, Aug. 2009.
[38] P. A. Romero and A. R. Abate, “Flow focusing geometry generates droplets through a plug
and squeeze mechanism,” Lab. Chip, vol. 12, no. 24, pp. 5130–5132, Nov. 2012.
[39] X. Chen and C. L. Ren, “Experimental study on droplet generation in flow focusing devices
considering a stratified flow with viscosity contrast,” Chem. Eng. Sci., vol. 163, pp. 1–10, May
2017.
[40] D. Conchouso, E. Rawashdeh, D. Castro, A. Arevalo, and I. G. Foulds, “Optimized Channel
Geometry of a Flow-Focusing Droplet Generator for Parallelization.,” p. 6.
[41] M. Nooranidoost, D. Izbassarov, and M. Muradoglu, “Droplet formation in a flow focusing
configuration: Effects of viscoelasticity,” Phys. Fluids, vol. 28, no. 12, p. 123102, Dec. 2016.

91
[42] J.-C. Baret, “Surfactants in droplet-based microfluidics,” Lab. Chip, vol. 12, no. 3, pp. 422–433,
Jan. 2012.
[43] S. Allazetta and M. P. Lutolf, “Stem cell niche engineering through droplet microfluidics,”
Curr. Opin. Biotechnol., vol. 35, pp. 86–93, Dec. 2015.
[44] A. Trounson, R. G. Thakar, G. Lomax, and D. Gibbons, “Clinical trials for stem cell
therapies,” BMC Med., vol. 9, no. 1, Dec. 2011.
[45] B. A. Tompkins et al., “Preclinical Studies of Stem Cell Therapy for Heart Disease,” Circ. Res.,
vol. 122, no. 7, pp. 1006–1020, Mar. 2018.
[46] M. Gnecchi, Z. Zhang, A. Ni, and V. J. Dzau, “Paracrine mechanisms in adult stem cell
signaling and therapy,” Circ. Res., vol. 103, no. 11, pp. 1204–1219, Nov. 2008.
[47] L. A. Fortier, “Stem Cells: Classifications, Controversies, and Clinical Applications,” Vet. Surg.,
vol. 34, no. 5, pp. 415–423, Sep. 2005.
[48] R. Barker, M. Jain, R. Armstrong, and M. Caldwell, “Stem cells and neurological disease,” J.
Neurol. Neurosurg. Psychiatry, vol. 74, no. 5, pp. 553–557, May 2003.
[49] H. J. Kim and J.-S. Park, “Usage of Human Mesenchymal Stem Cells in Cell-based Therapy:
Advantages and Disadvantages,” Dev. Reprod., vol. 21, no. 1, pp. 1–10, Mar. 2017.
[50] S. Aggarwal and M. F. Pittenger, “Human mesenchymal stem cells modulate allogeneic
immune cell responses,” Blood, vol. 105, no. 4, pp. 1815–1822, Feb. 2005.
[51] V. Turinetto, E. Vitale, and C. Giachino, “Senescence in Human Mesenchymal Stem Cells:
Functional Changes and Implications in Stem Cell-Based Therapy,” Int. J. Mol. Sci., vol. 17, no.
7, p. 1164, Jul. 2016.
[52] Y. L. Tang, Y. J. Wang, L. J. Chen, Y. H. Pan, L. Zhang, and N. L. Weintraub, “Cardiac-
derived stem cell-based therapy for heart failure: progress and clinical applications,” Exp. Biol.
Med., vol. 238, no. 3, pp. 294–300, Mar. 2013.
[53] D. Harris, “Stem Cell Banking for Regenerative and Personalized Medicine,” Biomedicines, vol.
2, no. 1, pp. 50–79, Feb. 2014.
[54] V. F. M. Segers and R. T. Lee, “Stem-cell therapy for cardiac disease,” Nature, vol. 451, pp.
937–942, Feb. 2008.
[55] R. Champlin, “Selection of Autologous or Allogeneic Transplantation,” Holl.-Frei Cancer Med.
6th Ed., 2003.

92
[56] S. Slavin, “Graft-versus-host disease, the graft-versus-leukemia effect, and mixed chimerism
following nonmyeloablative stem cell transplantation,” Int. J. Hematol., vol. 78, no. 3, pp. 195–
207, Oct. 2003.
[57] S. G. Holtan, M. Pasquini, and D. J. Weisdorf, “Acute graft-versus-host disease: a bench-to-
bedside update,” Blood, vol. 124, no. 3, pp. 363–373, Jul. 2014.
[58] S. Zhao et al., “Bioengineering of injectable encapsulated aggregates of pluripotent stem cells
for therapy of myocardial infarction,” Nat. Commun., vol. 7, p. 13306, Oct. 2016.
[59] J. Ferrara, “Cellular therapy of the host to prevent GVHD,” Blood, vol. 124, no. 11, pp. 1703–
1704, Sep. 2014.
[60] J. N. Anderl, T. E. Robey, P. S. Stayton, and C. E. Murry, “Retention and biodistribution of
microspheres injected into ischemic myocardium,” J. Biomed. Mater. Res. A, vol. 88A, no. 3, pp.
704–710, Mar. 2009.
[61] K. Shah, “Encapsulated stem cells for cancer therapy,” Biomatter, vol. 3, no. 1, Jan. 2013.
[62] D. Jing, A. Parikh, and E. S. Tzanakakis, “Cardiac Cell Generation from Encapsulated
Embryonic Stem Cells in Static and Scalable Culture Systems,” Cell Transplant., vol. 19, no. 11,
pp. 1397–1412, Nov. 2010.
[63] M. Hashemi and F. Kalalinia, “Application of encapsulation technology in stem cell therapy,”
Life Sci., vol. 143, pp. 139–146, Dec. 2015.
[64] “Hydrogel Biomaterials for Stem Cell Microencapsulation.pdf.” .
[65] G. J. Lim, S. J. Lee, and A. Atala, “55 - Cell-Based Drug Delivery,” in Principles of Regenerative
Medicine, A. Atala, R. Lanza, J. A. Thomson, and R. M. Nerem, Eds. San Diego: Academic
Press, 2008, pp. 954–966.
[66] Z. Jiang, B. Xia, R. McBride, and J. Oakey, “A microfluidic-based cell encapsulation platform
to achieve high long-term cell viability in photopolymerized PEGNB hydrogel microspheres,”
J. Mater. Chem. B Mater. Biol. Med., vol. 5, no. 1, pp. 173–180, Jan. 2017.
[67] D. R. Link, S. L. Anna, D. A. Weitz, and H. A. Stone, “Geometrically Mediated Breakup of
Drops in Microfluidic Devices,” Phys. Rev. Lett., vol. 92, no. 5, Feb. 2004.
[68] G. Velve-Casquillas, M. Le Berre, M. Piel, and P. T. Tran, “Microfluidic tools for cell
biological research,” Nano Today, vol. 5, no. 1, pp. 28–47, Feb. 2010.
[69] E. Amici, G. Tetradis-Meris, C. P. de Torres, and F. Jousse, “Alginate gelation in microfluidic
channels,” Food Hydrocoll., vol. 22, no. 1, pp. 97–104, Jan. 2008.

93
[70] D. J. Collins, A. Neild, A. deMello, A.-Q. Liu, and Y. Ai, “The Poisson distribution and
beyond: methods for microfluidic droplet production and single cell encapsulation,” Lab. Chip,
vol. 15, no. 17, pp. 3439–3459, Aug. 2015.
[71] P. Zucca, R. Fernandez-Lafuente, and E. Sanjust, “Agarose and Its Derivatives as Supports
for Enzyme Immobilization,” Molecules, vol. 21, no. 11, p. 1577, Nov. 2016.
[72] A. Ellis and J. C. Jacquier, “Manufacture and characterisation of agarose microparticles,” J.
Food Eng., vol. 90, no. 2, pp. 141–145, Jan. 2009.
[73] J. E. Kolesar, C. Y. Wang, Y. V. Taguchi, S.-H. Chou, and B. A. Kaufman, “Two-dimensional
intact mitochondrial DNA agarose electrophoresis reveals the structural complexity of the
mammalian mitochondrial genome,” Nucleic Acids Res., vol. 41, no. 4, p. e58, Feb. 2013.
[74] E. Mercey, P. Obeïd, D. Glaise, M.-L. Calvo-Muñoz, C. Guguen-Guillouzo, and B. Fouqué,
“The application of 3D micropatterning of agarose substrate for cell culture and in situ comet
assays,” Biomaterials, vol. 31, no. 12, pp. 3156–3165, Apr. 2010.
[75] “A5030-BULK________SIAL_____.pdf.” .
[76] Y. Reissis, E. García-Gareta, M. Korda, G. W. Blunn, and J. Hua, “The effect of temperature
on the viability of human mesenchymal stem cells,” Stem Cell Res. Ther., vol. 4, no. 6, p. 139,
2013.
[77] T. S. Kaminski, O. Scheler, and P. Garstecki, “Droplet microfluidics for microbiology:
techniques, applications and challenges,” Lab. Chip, vol. 16, no. 12, pp. 2168–2187, 2016.
[78] J. Wan, “Microfluidic-Based Synthesis of Hydrogel Particles for Cell Microencapsulation and
Cell-Based Drug Delivery,” Polymers, vol. 4, no. 2, pp. 1084–1108, Apr. 2012.
[79] S. Swioklo and C. J. Connon, “Keeping cells in their place: the future of stem cell
encapsulation,” Expert Opin. Biol. Ther., vol. 16, no. 10, pp. 1181–1183, Oct. 2016.
[80] L. Hidalgo San Jose, P. Stephens, B. Song, and D. Barrow, “Microfluidic Encapsulation
Supports Stem Cell Viability, Proliferation, and Neuronal Differentiation,” Tissue Eng. Part C
Methods, vol. 24, no. 3, pp. 158–170, Mar. 2018.
[81] A. S. Mao et al., “Deterministic encapsulation of single cells in thin tunable microgels for niche
modeling and therapeutic delivery,” Nat. Mater., vol. 16, no. 2, pp. 236–243, Feb. 2017.
[82] A. Benavente-Babace, K. Haase, D. J. Stewart, and M. Godin, “Microfluidic Encapsulation to
Tune Therapeutic Cell Delivery,” J. Tissue Eng. Regen. Med., vol. accepted for publication.

94
[83] S. Okushima, T. Nisisako, T. Torii, and T. Higuchi, “Controlled Production of Monodisperse
Double Emulsions by Two-Step Droplet Breakup in Microfluidic Devices,” Langmuir, vol. 20,
no. 23, pp. 9905–9908, Nov. 2004.
[84] C. J. Martinez et al., “A Microfluidic Approach to Encapsulate Living Cells in Uniform
Alginate Hydrogel Microparticles,” Macromol. Biosci., vol. 12, no. 7, pp. 946–951, Jul. 2012.
[85] L. Liu et al., “Preparation of monodisperse calcium alginate microcapsules via internal gelation
in microfluidic-generated double emulsions,” J. Colloid Interface Sci., vol. 404, pp. 85–90, Aug.
2013.
[86] Y. Zhang et al., “A programmable microenvironment for cellular studies via microfluidics-
generated double emulsions,” Biomaterials, vol. 34, no. 19, pp. 4564–4572, Jun. 2013.
[87] B. G. Chung, K.-H. Lee, A. Khademhosseini, and S.-H. Lee, “Microfluidic fabrication of
microengineered hydrogels and their application in tissue engineering,” Lab. Chip, vol. 12, no.
1, pp. 45–59, Dec. 2011.
[88] S. K. Y. Tang and G. M. Whitesides, “Basic Microfluidic and Soft Lithographic Techniques,”
p. 26.
[89] F. Walther et al., “Stability of the hydrophilic behaviour of oxygen plasma activated SU-8,” J
Micromech Microeng, p. 11.
[90] M. Leester-Schädel, T. Lorenz, F. Jürgens, and C. Richter, “Fabrication of Microfluidic
Devices,” in Microsystems for Pharmatechnology, A. Dietzel, Ed. Cham: Springer International
Publishing, 2016, pp. 23–57.
[91] Datasheet, “SU-82000DataSheet2000_5thru2015Ver4.pdf,” 2015.
[92] “SU-8 photolithography: Baking - Elveflow.” [Online]. Available:
https://www.elveflow.com/microfluidic-tutorials/soft-lithography-reviews-and-
tutorials/how-to-get-the-best-process/su-8-photolithography-baking/. [Accessed: 25-Jan-
2019].
[93] “SU-82000DataSheet2000_5thru2015Ver4.pdf.” .
[94] “Silanization of Photoresist Master Protocol.pdf.” .
[95] N. R. Glass, R. Tjeung, P. Chan, L. Y. Yeo, and J. R. Friend, “Organosilane deposition for
microfluidic applications,” Biomicrofluidics, vol. 5, no. 3, pp. 036501-036501–7, Aug. 2011.
[96] “Advances in Microfluidic Materials, Functions, Integration, and Applications - Chemical
Reviews (ACS Publications).” [Online]. Available:
https://pubs.acs.org/doi/pdf/10.1021/cr300337x. [Accessed: 25-Jan-2019].

95
[97] “Materials for Microfluidic Chip Fabrication.” [Online]. Available:
https://pubs.acs.org/doi/pdf/10.1021/ar300314s. [Accessed: 25-Jan-2019].
[98] P. Abgrall and A.-M. Gué, “Lab-on-chip technologies: making a microfluidic network and
coupling it into a complete microsystem—a review,” J. Micromechanics Microengineering, vol. 17,
no. 5, pp. R15–R49, May 2007.
[99] S. K. Sia and G. M. Whitesides, “Microfluidic devices fabricated in Poly(dimethylsiloxane) for
biological studies,” ELECTROPHORESIS, vol. 24, no. 21, pp. 3563–3576, Nov. 2003.
[100] “Poly(dimethylsiloxane) as a Material for Fabricating Microfluidic Devices - Accounts of
Chemical Research (ACS Publications).” [Online]. Available:
https://pubs.acs.org/doi/pdf/10.1021/ar010110q. [Accessed: 25-Jan-2019].
[101] S. D. Minteer, Ed., Microfluidic techniques: reviews and protocols. Totowa, N.J: Humana Press,
2006.
[102] “NIH 3T3 Protocol.” .
[103] C. Elliott, V. Vijayakumar, W. Zink, and R. Hansen, “National Instruments LabVIEW: A
Programming Environment for Laboratory Automation and Measurement,” J. Assoc. Lab.
Autom., vol. 12, no. 1, pp. 17–24, Feb. 2007.
[104] J. Schindelin et al., “Fiji: an open-source platform for biological-image analysis,” Nat. Methods,
vol. 9, no. 7, pp. 676–682, Jul. 2012.
[105] J. R. Wünsch, Polystyrene: Synthesis, Production and Applications. iSmithers Rapra Publishing,
2000.
[106] “microscope counting chamber (hemocytometer).” [Online]. Available:
http://www.ruf.rice.edu/~bioslabs/methods/microscopy/cellcounting.html. [Accessed: 26-
Jan-2019].
[107] J. Marchini, “Lecture 5 : The Poisson Distribution,” p. 9.
[108] S. Johnson, V. Nguyen, and D. Coder, “Assessment of Cell Viability,” Curr. Protoc. Cytom.,
vol. 64, no. 1, pp. 9.2.1-9.2.26, Apr. 2013.
[109] J. M. Chen, M.-C. Kuo, and C.-P. Liu, “Control of Droplet Generation in Flow-Focusing
Microfluidic Device with a Converging-Diverging Nozzle-Shaped Section,” Jpn. J. Appl. Phys.,
vol. 50, no. 10, p. 107301, Oct. 2011.
[110] S. L. Anna, N. Bontoux, and H. A. Stone, “Formation of dispersions using ‘flow focusing’ in
microchannels,” Appl. Phys. Lett., vol. 82, no. 3, pp. 364–366, Jan. 2003.

96
[111] A. Gupta, H. S. Matharoo, D. Makkar, and R. Kumar, “Droplet formation via squeezing
mechanism in a microfluidic flow-focusing device,” Comput. Fluids, vol. 100, pp. 218–226, Sep.
2014.
[112] W. Wang, M.-J. Zhang, and L.-Y. Chu, “Microfluidic approach for encapsulation via double
emulsions,” Curr. Opin. Pharmacol., vol. 18, pp. 35–41, Oct. 2014.
[113] M.-N. Iancu, Y. Chevalie, M. Popa, and T. Hamaide, “Internally gelled W/O and W/O/W
double emulsions,” E-Polym., vol. 9, no. 1, Jan. 2009.
[114] E. Y. Liu, S. Jung, D. A. Weitz, H. Yi, and C.-H. Choi, “High-throughput double emulsion-
based microfluidic production of hydrogel microspheres with tunable chemical functionalities
toward biomolecular conjugation,” Lab. Chip, vol. 18, no. 2, pp. 323–334, Jan. 2018.
[115] R. C. Tolman, “The Effect of Droplet Size on Surface Tension,” J. Chem. Phys., vol. 17, no.
3, pp. 333–337, Mar. 1949.
[116] T. Kamperman, S. Henke, C. W. Visser, M. Karperien, and J. Leijten, “Centering Single Cells
in Microgels via Delayed Crosslinking Supports Long-Term 3D Culture by Preventing Cell
Escape,” Small, vol. 13, no. 22, p. 1603711, Jun. 2017.
[117] C.-X. Zhao and A. P. J. Middelberg, “Two-phase microfluidic flows,” Chem. Eng. Sci., vol. 66,
no. 7, pp. 1394–1411, Apr. 2011.
[118] D. J. Pike, R. R. Sokal, and P. J. Rohlf, “The Principles and Practice of Statistics in Biological
Research.,” J. Appl. Ecol., vol. 19, no. 3, p. 985, Dec. 1982.
[119] N. Monette-Catafard, “HIGH-THROUGHPUT CELL ENCAPSULATION IN
MONODISPERSE AGAROSE MICROCAPSULES USING A MICROFLUIDIC
DEVICE,” p. 86.
[120] W. Zeng, S. Li, and Z. Wang, “Characterization of syringe-pump-driven versus pressure-
driven microfluidic flows,” in 2015 International Conference on Fluid Power and Mechatronics (FPM),
Harbin, China, 2015, pp. 711–715.
[121] “Pipette tips epT.I.P.S. Standard 0.1 ul - 10 ul 0030000811 Eppendorf | Lab Unlimited.”
[Online]. Available: https://www.labunlimited.com/s/ALL/4AJ-9409410/Pipette-tips-
epT.I.P.S.-Standard-0.1-ul---10-ul-0030000811-Eppendorf. [Accessed: 26-Jan-2019].
[122] R. J. Geraghty et al., “Guidelines for the use of cell lines in biomedical research,” Br. J. Cancer,
vol. 111, no. 6, pp. 1021–1046, Sep. 2014.
[123] M. Rodriguez-Porcel, “In Vivo Imaging and Monitoring of Transplanted Stem Cells: Clinical
Applications,” Curr. Cardiol. Rep., vol. 12, no. 1, pp. 51–58, Jan. 2010.

97
[124] G. V. Goldmacher, R. Nasser, D. Y. Lee, S. Yigit, R. Rosenwasser, and L. Iacovitti,
“Tracking Transplanted Bone Marrow Stem Cells and Their Effects in the Rat MCAO Stroke
Model,” PLoS ONE, vol. 8, no. 3, p. e60049, Mar. 2013.
[125] P. S. Lienemann, T. Rossow, A. S. Mao, Q. Vallmajo-Martin, M. Ehrbar, and D. J. Mooney,
“Single cell-laden protease-sensitive microniches for long-term culture in 3D,” Lab. Chip, vol.
17, no. 4, pp. 727–737, Feb. 2017.
[126] X. (James) Li, A. V. Valadez, P. Zuo, and Z. Nie, “Microfluidic 3D cell culture: potential
application for tissue-based bioassays,” Bioanalysis, vol. 4, no. 12, pp. 1509–1525, Jun. 2012.