Tracing the spatial distribution and mobility of metal ... in the vicinity of the Nkana copper...
12
Tracing the spatial distribution and mobility of metal/metalloid contaminants in Oxisols in the vicinity of the Nkana copper smelter, Copperbelt province, Zambia Vojtěch Ettler a, ⁎, Martin Mihaljevič a , Bohdan Kříbek b , Vladimír Majer b , Ondřej Šebek c a Institute of Geochemistry, Mineralogy and Mineral Resources, Faculty of Science, Charles University in Prague, Albertov 6, 128 43 Praha 2, Czech Republic b Czech Geological Survey, Geologická 6, 152 00 Praha 5, Czech Republic c Laboratories of the Geological Institutes, Faculty of Science, Charles University in Prague, Albertov 6, 128 43 Praha 2, Czech Republic abstract article info Article history: Received 30 November 2010 Received in revised form 12 April 2011 Accepted 21 May 2011 Available online 12 June 2011 Keywords: Oxisols Metals and metalloids Pb isotopes Cu smelting Mobility Zambia The copper mining and smelting activities in the Copperbelt province (Zambia) left enormous pollution related to the disposal sites for mining/smelting waste (tailings, slags) and to the continuous deposition of smelter stack particulates in the soil systems. Topsoils in the vicinity of the Nkana copper smelter were studied in order to assess the spatial distribution of metal/metalloid contaminants (As, Co, Cu, Pb, Zn) in a 32-km 2 zone around the smelter (n =196 soil samples). The bulk concentrations of metal/metalloid contaminants were determined by ICP techniques, supplemented by the determination of the Pb isotopic composition of selected samples measured by quadrupole-based ICP-MS. The spatial distribution of the major contaminants indicated the highest contamination NW of the smelter stack, corresponding to the prevailing wind direction in the area. The highest metal/metalloid concentrations in the topsoils were: 255 mg As kg -1 , 27,410 mg Cu kg -1 , 606 mg Co kg -1 , 480 mg Pb kg -1 and 450 mg Zn kg -1 . Lead isotopes helped to differentiate the extent of metallic pollution and indicated the mixing of three major pollution sources (given as 206 Pb/ 207 Pb ratios): smelting activities (1.19– 1.28), petrol combustion (1.07–1.09) and regional background (deep soil horizons, ca. 1.35) To assess the vertical mobility of these inorganic contaminants, a 110-cm-deep profile in Oxisol in a highly polluted zone in the near vicinity of the Nkana smelter was sampled and studied by combination of bulk chemical analysis, sequential extraction procedure (SEP) and Pb isotopic tracing. Investigation of the soil profile indicated that the contamination is mostly located in the uppermost soil horizons enriched in organic matter (b 10 cm). Based on SEP, the isotopic composition and knowledge of smelter activities in the area, it was predicted that anthropogenic Pb (corresponding to a concentration of 1 mg kg -1 , i.e., approx. 1.5% of total Pb) exhibited downward migration in the soil profile with estimated penetration rate of 1.36 cm year -1 . Copper, being substantially bound in the exchangeable fraction, also showed significant mobility in the profile. As a result, the sources of anthropogenic emissions in the Kitwe smelting area represent an important source of mobile (and potentially bioavailable) metals. © 2011 Elsevier B.V. All rights reserved. 1. Introduction Non-ferrous metals smelting activities represent one of the most important point sources of metal/metalloid pollution of soils via atmospheric deposition (Rieuwerts et al., 1999; Sterckeman et al., 2000; Burt et al., 2003; Udachin et al., 2003; Martley et al., 2004; Williamson et al., 2004; Ettler et al., 2005; Douay et al., 2008; Ettler et al., 2010). So far, relatively few studies have been focused on ecosystems (soils, water, air, biota) polluted by mining/smelting industries in developing countries in Africa (e.g., Meter et al., 1999; Kříbek et al., 2010). Environmental and ecotoxicological research is mainly conducted in developed countries where risks for the population are efficiently reduced by legislation and technical measures (Banza et al., 2009). Another aspect is that a number of models have been developed in recent years to predict mobile/ bioavailable concentrations of potentially toxic elements in soils, but these models are based on data for temperate soils and could not be successfully applied to tropical soils (Rieuwerts, 2007). In this context, the binding and mobility in highly contaminated soil systems in the tropics is still not fully understood (Rieuwerts, 2007). The Copperbelt is a well known district of base metal mining and processing (mainly Cu and Co). On the Zambian side of the Copperbelt, it is estimated that 30 million tonnes of Cu metal have been produced since mining began on a full scale in 1930. The average ore grade is 30 g Cu kg -1 and 1.8 g Co kg -1 (Kamona and Nyambe, 2002). According to the US Geological Survey (USGS, 2010), Zambia was the 8th largest global producer of Cu and 7th largest global producer of Co in 2009. The Copperbelt province, including Zambia and the Democratic Republic of Congo, is the richest Co mining district in the world, with a total 27,500 tonnes mined in 2009 and reserves Geoderma 164 (2011) 73–84 ⁎ Corresponding author. Tel.: + 420 221 951 493; fax: + 420 221 951 496. E-mail address: [email protected] (V. Ettler). 0016-7061/$ – see front matter © 2011 Elsevier B.V. All rights reserved. doi:10.1016/j.geoderma.2011.05.014 Contents lists available at ScienceDirect Geoderma journal homepage: www.elsevier.com/locate/geoderma
-
Upload
vuongquynh -
Category
Documents
-
view
216 -
download
1
Transcript of Tracing the spatial distribution and mobility of metal ... in the vicinity of the Nkana copper...
Geoderma 164 (2011) 73–84
Contents lists available at ScienceDirect
Geoderma
j ourna l homepage: www.e lsev ie r.com/ locate /geoderma
Tracing the spatial distribution and mobility of metal/metalloid contaminants inOxisols in the vicinity of the Nkana copper smelter, Copperbelt province, Zambia
Vojtěch Ettler a,⁎, Martin Mihaljevič a, Bohdan Kříbek b, Vladimír Majer b, Ondřej Šebek c
a Institute of Geochemistry, Mineralogy and Mineral Resources, Faculty of Science, Charles University in Prague, Albertov 6, 128 43 Praha 2, Czech Republicb Czech Geological Survey, Geologická 6, 152 00 Praha 5, Czech Republicc Laboratories of the Geological Institutes, Faculty of Science, Charles University in Prague, Albertov 6, 128 43 Praha 2, Czech Republic
⁎ Corresponding author. Tel.: +420 221 951 493; faxE-mail address: [email protected] (V. Ettler).
0016-7061/$ – see front matter © 2011 Elsevier B.V. Aldoi:10.1016/j.geoderma.2011.05.014
a b s t r a c t
a r t i c l e i n f oArticle history:Received 30 November 2010Received in revised form 12 April 2011Accepted 21 May 2011Available online 12 June 2011
Keywords:OxisolsMetals and metalloidsPb isotopesCu smeltingMobilityZambia
The coppermining and smelting activities in the Copperbelt province (Zambia) left enormouspollution related tothe disposal sites for mining/smelting waste (tailings, slags) and to the continuous deposition of smelter stackparticulates in the soil systems. Topsoils in thevicinity of theNkanacopper smelterwere studied inorder toassessthe spatial distribution ofmetal/metalloid contaminants (As, Co, Cu, Pb, Zn) in a 32-km2 zone around the smelter(n=196 soil samples). The bulk concentrations of metal/metalloid contaminants were determined by ICPtechniques, supplemented by the determination of the Pb isotopic composition of selected samplesmeasured byquadrupole-based ICP-MS. The spatial distribution of the major contaminants indicated the highestcontamination NW of the smelter stack, corresponding to the prevailing wind direction in the area. The highestmetal/metalloid concentrations in the topsoils were: 255 mg As kg−1, 27,410 mg Cu kg−1, 606 mg Co kg−1,480 mg Pb kg−1 and 450 mg Zn kg−1. Lead isotopes helped to differentiate the extent of metallic pollution andindicated the mixing of three major pollution sources (given as 206Pb/207Pb ratios): smelting activities (1.19–1.28), petrol combustion (1.07–1.09) and regional background (deep soil horizons, ca. 1.35) To assess the verticalmobility of these inorganic contaminants, a 110-cm-deep profile in Oxisol in a highly polluted zone in the nearvicinity of the Nkana smelter was sampled and studied by combination of bulk chemical analysis, sequentialextraction procedure (SEP) and Pb isotopic tracing. Investigation of the soil profile indicated that thecontamination is mostly located in the uppermost soil horizons enriched in organic matter (b10 cm). Based onSEP, the isotopic composition and knowledge of smelter activities in the area, itwas predicted that anthropogenicPb (corresponding to a concentration of 1 mg kg−1, i.e., approx. 1.5% of total Pb) exhibited downwardmigrationin the soil profile with estimated penetration rate of 1.36 cm year−1. Copper, being substantially bound in theexchangeable fraction, also showed significant mobility in the profile. As a result, the sources of anthropogenicemissions in the Kitwe smelting area represent an important source of mobile (and potentially bioavailable)metals.
: +420 221 951 496.
l rights reserved.
© 2011 Elsevier B.V. All rights reserved.
1. Introduction
Non-ferrous metals smelting activities represent one of the mostimportant point sources of metal/metalloid pollution of soils viaatmospheric deposition (Rieuwerts et al., 1999; Sterckeman et al.,2000; Burt et al., 2003; Udachin et al., 2003; Martley et al., 2004;Williamson et al., 2004; Ettler et al., 2005; Douay et al., 2008; Ettleret al., 2010). So far, relatively few studies have been focused onecosystems (soils, water, air, biota) polluted by mining/smeltingindustries in developing countries in Africa (e.g., Meter et al., 1999;Kříbek et al., 2010). Environmental and ecotoxicological research ismainly conducted in developed countries where risks for thepopulation are efficiently reduced by legislation and technical
measures (Banza et al., 2009). Another aspect is that a number ofmodels have been developed in recent years to predict mobile/bioavailable concentrations of potentially toxic elements in soils, butthese models are based on data for temperate soils and could not besuccessfully applied to tropical soils (Rieuwerts, 2007). In this context,the binding and mobility in highly contaminated soil systems in thetropics is still not fully understood (Rieuwerts, 2007).
The Copperbelt is a well known district of base metal mining andprocessing (mainly Cu and Co). On the Zambian side of theCopperbelt, it is estimated that 30 million tonnes of Cu metal havebeen produced sincemining began on a full scale in 1930. The averageore grade is 30 g Cu kg−1 and 1.8 g Co kg−1 (Kamona and Nyambe,2002). According to the US Geological Survey (USGS, 2010), Zambiawas the 8th largest global producer of Cu and 7th largest globalproducer of Co in 2009. The Copperbelt province, including Zambiaand the Democratic Republic of Congo, is the richest Comining districtin the world, with a total 27,500 tonnes mined in 2009 and reserves

74 V. Ettler et al. / Geoderma 164 (2011) 73–84
estimated at 3,670,000 tonnes (USGS, 2010). More than 90 years ofintense Cu and Co mining and ore processing have left enormouspollution related to the disposal sites for mining/smelting waste (minetailings, slags) and to the continuous deposition of smelter stackparticulates in the soil systems. Detailed environmental studies are stillrare in this area (Meter et al., 1999; Tembo et al., 2006; Banza et al., 2009;Kříbek et al., 2010; Šráček et al., 2010; Mihaljevič et al., 2011).
Based on a previous screening study focusing on the central-northern part of the Zambian Copperbelt (Kříbek et al., 2010), weinvestigated in detail the soil contamination around the Nkanasmelter at Kitwe, one of the hot spots of metal/metalloid contamina-tion in this region. This paper is focused on the spatial distribution ofAs, Co, Cu, Pb and Zn in topsoils around the Nkana smelter coupled toPb isotopic tracing of the degree of contamination and detailedinvestigation of the vertical mobility of inorganic contaminants inthese highly polluted soils using chemical fractionation and Pbisotopic methods.
2. Materials and methods
2.1. Site description
The Zambian Copperbelt forms the south-eastern part of theNeoproterozoic Lufilian Arc, a Pan-African orogenic belt consisting ofmetasedimentary rocks of the Katanga Supergroup, and representsone of the world's most important sediment-hosted stratiform Cu-and Co-bearing sulphide deposits (more detailed information aboutthe geology of the Zambian Copperbelt is given in Kříbek et al. (2010)and references therein).
The Cu smelter at Nkana near Kitwe is the oldest metallurgicalfactory in the Zambian Copperbelt (commissioned in 1931, closed in2009). It consisted of reverbatory furnaces, Peirce–Smith convertersand blister casting facilities. The blister copper production was6000 tonnes during the first year of operation. At the productionapogee in 1971, 330,000 tonnes of Cu were produced; between 1993and 2006, the production was between 100,000 and 125,000 tonnesof Cu per year. In 1994, an El Teniente converter (CT) was installed toupgrade the reverbatory furnace matte to white metal (S-poor Cu2S,with composition Cu2S1−x), prior to its refinement in conventional PSconverters (Cutler et al., 2006).
The climatic seasons in the Copperbelt are (i) a hot rainy seasonwith tropical thunderstorms (November–April), (ii) a cool dry season(May–August) and (iii) a hot season with practically no rain(September–November). The average annual rainfall in Kitwe is1320 mm (Kříbek et al., 2010). From March until October, strongwinds from the south-easterly quadrant are predominant, whereasthe season from November to February is dominated by light north-easterly winds (Kříbek et al., 2010).
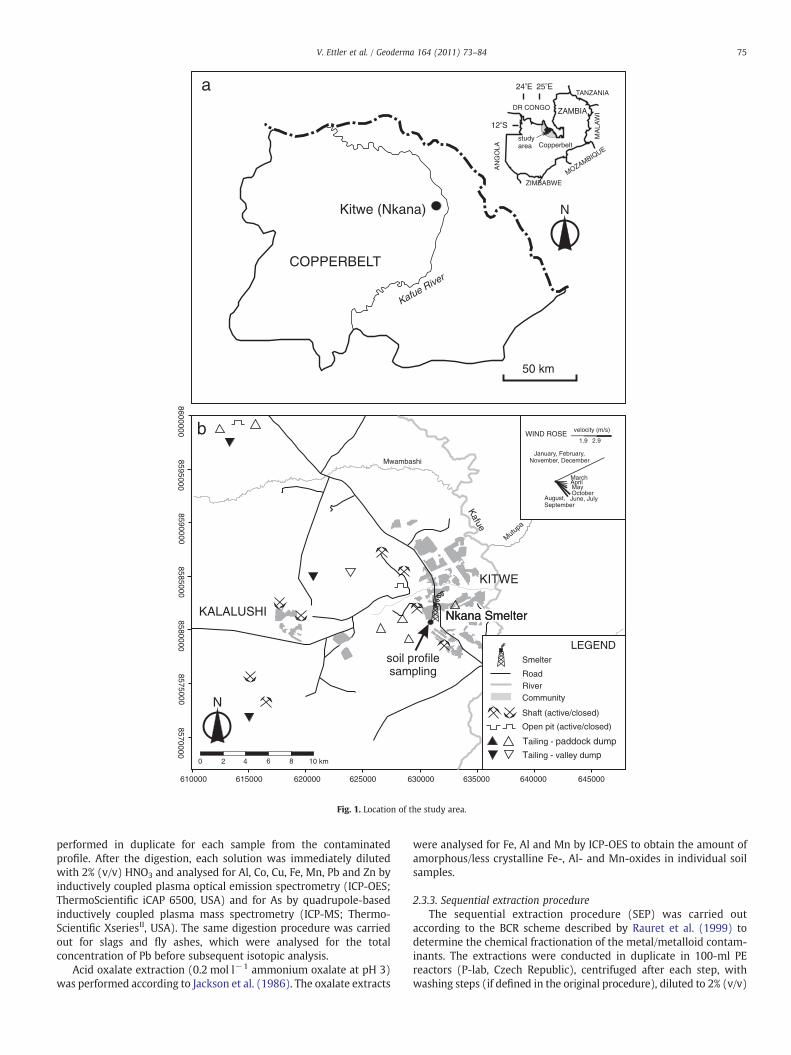
The majority of the land is covered with grass and bamboo, withsparse forested areas mainly consisting of Brachystegia and Isoberliniaspecies (Kříbek et al., 2007). The Kitwe area in the vicinity of industrialcomplexes is partly covered with waste deposits, dumps and tailingponds (Fig. 1). Agricultural activities are located close to the urbanareas, rivers and small streams. Cassava (Manihot esculenta), sweetpotatoes (Ipomoea batatas) and, to a lesser extent, maize (Zea mays)are the main crops cultivated in the area (Kříbek et al., 2007).
2.2. Sampling and sample processing
The field work was carried out in May 2008. Based on a previousregional study (Kříbek et al., 2010), a total of 196 topsoil samples(A horizon, depth 0–5 cm) were collected to cover the 32-km2-largezone in the vicinity of the Nkana copper smelter (see Figs. 1 and 2 forthe location of the sampling points). In addition, a 110-cm-deep soilprofile was sampled in a 1×1-m-wide pit within the highly pollutedzone close to the smelter stack (Fig. 1, GPS position: S 12°50′09.8″,
E 28°11′43.0″) to investigate in detail the vertical mobility of thecontaminants (n=13 samples). According to the Soil Taxonomy (SoilSurvey Staff, 2010), the soil was characterised as Oxisol, subgroupRhodic Haplustox. The samples were stored in polyethylene (PE) bagsand treated immediately on returning to the laboratory. Slag samples(n=7) were sampled on the slag dumps in the vicinity of the Nkanasmelter. As it was not possible to obtain any dust from the filteringunits in the smelter; as a proxy material we sampled the dustdeposited on the surface of tyres forming the barriers along the road,200 m away from the smelter (n=2).
Topsoils and soils from the contaminated profile were air-dried inthe laboratory to constant weight. All the soil samples were sievedthrough a clean 2-mm stainless steel sieve (Retsch, Germany). Thefraction below 2-mm was used directly for the sequential extractionprocedure (SEP) and measurements of the pH, particle size distribu-tion and cation-exchange capacity (CEC). An aliquot part of eachsample was finely ground in an agate mortar (Fritsch Pulverisette,Germany) and used for subsequent bulk chemical and isotopicanalyses. Slag and fly ash samples were dried at ambient temperatureand finely ground in an agate mortar before subsequent digestion inmineral acids and bulk chemical analyses.
2.3. Analytical procedures
2.3.1. Determination of soil properties and mineralogyThe soil colour was determined on the moist samples using the
Munsell soil colour chart tables. The description of the soil samples fromthe contaminated profilewas carried out directly in thefield. The soil pHwas measured by a Schott Handylab pH metre equipped with a SchottBlueLine 28 pH electrode (Schott, Germany) in a 1:5 (w/v) soil-deionisedwater suspension after1-h agitation (Pansu andGautheyroux,2006). The particle size distribution was measured by the hydrometermethod. The cation exchange capacity (CEC) was determined as thesum of the basic cations and Al extracted with the unbuffered0.1 mol l−1 BaCl2 solution and the extractable acidity (0.05 mol l−1
NaOH titration) (Pansu and Gautheyroux, 2006). Basic cations and Alweremeasured byflame atomic absorption spectrometry (FAAS; VarianSpectrAA 280 FS, Australia).
About 0.5 g of the pulverised samples was used for identification ofthe bulkmineralogical composition of the soils from the contaminatedprofile. We used X-ray diffraction analysis (XRD; PANalytical X'PertPro diffractometer with X'Celerator detector) with CuKα radiation at40 kV and 30 mA over the range 2–80° 2theta with a step of 0.02° andcounting time of 150 s per step. X'Pert HighScore 1.0 softwareequipped with the JCPDS PDF-2 database (ICDD, 2002) was used forthe qualitative analysis. In addition, the heavy mineral fraction wasseparated from the topmost soil horizon in 1,1,2,2-tetrabromethane(density 2.96 g cm−3) in a centrifuge (Janetzki S70D, Germany) at1800 r.p.m. for 30 min. The heavy mineral fraction was then washedin ethanol and analysed by XRD using the same analytical conditionsas for the bulk samples.
2.3.2. Determination of bulk concentrationsTotal organic carbon (Corg) and total sulphur (Stot) were deter-
mined on an Eltra CS 530 analyzer (Eltra, Germany). Determination ofthe total inorganic carbon was carried out using an Eltra CS 500analyzer (Eltra, Germany), but its concentrations were below thedetection limit (0.1 g kg−1) for all the studied samples.
A mass of 0.2 g of dry soil sample was dissolved in a Pt dish in10 ml of hot HF and 0.5 ml HClO4 and evaporated to dryness. Theprocedure was repeated with 5 ml HF and 0.5 ml HClO4 in order toremove all the silica from the sample. Subsequently, the residue wasdissolved in 2 ml HNO3 and diluted to 100 ml. All the acids used in thedissolution procedure were of reagent grade (Merck, Germany andLach-ner, Czech Republic) and MilliQ+(Millipore, USA) deionisedwater was used for all the digestions. The total digestions were
Kitwe (Nkana)
50 km
COPPERBELT
Kafue River
ZAMBIA
ZIMBABWE
MA
LAW
I
DR CONGO
AN
GO
LA
TANZANIA
MOZAMBIQUECopperbelt
24 Eo 25 Eo
12 So
studyarea
N
a
86000008595000
85900008585000
85800008575000
8570000
0 2 4 6 8 10 km
610000 615000 620000 625000 630000 635000 640000 645000
KITWE
KALALUSHI
Kafue
Mutupa
Mwambashi
1.9 2.9
velocity (m/s)
August,September
June, JulyOctoberMayAprilMarch
January, February,November, December
WIND ROSE
soil profilesampling
Smelter
Shaft (active/closed)
Open pit (active/closed)
Tailing - paddock dump
Tailing - valley dump
RoadRiverCommunityN
b
LEGEND
Nkana SmelterNkana Smelter
Fig. 1. Location of the study area.
75V. Ettler et al. / Geoderma 164 (2011) 73–84
performed in duplicate for each sample from the contaminatedprofile. After the digestion, each solution was immediately dilutedwith 2% (v/v) HNO3 and analysed for Al, Co, Cu, Fe, Mn, Pb and Zn byinductively coupled plasma optical emission spectrometry (ICP-OES;ThermoScientific iCAP 6500, USA) and for As by quadrupole-basedinductively coupled plasma mass spectrometry (ICP-MS; Thermo-Scientific XseriesII, USA). The same digestion procedure was carriedout for slags and fly ashes, which were analysed for the totalconcentration of Pb before subsequent isotopic analysis.
Acid oxalate extraction (0.2 mol l−1 ammonium oxalate at pH 3)was performed according to Jackson et al. (1986). The oxalate extracts
were analysed for Fe, Al and Mn by ICP-OES to obtain the amount ofamorphous/less crystalline Fe-, Al- and Mn-oxides in individual soilsamples.
2.3.3. Sequential extraction procedureThe sequential extraction procedure (SEP) was carried out
according to the BCR scheme described by Rauret et al. (1999) todetermine the chemical fractionation of the metal/metalloid contam-inants. The extractions were conducted in duplicate in 100-ml PEreactors (P-lab, Czech Republic), centrifuged after each step, withwashing steps (if defined in the original procedure), diluted to 2% (v/v)

Fig. 2. Spatial distribution of Co and Cu in topsoils around the Nkana smelter (n=196). The data for subsurface soils are taken from Kříbek et al. (2010).
76 V. Ettler et al. / Geoderma 164 (2011) 73–84

Table 1Quality control of the total digestion and sequential extraction procedures (mg kg−1).
Code As Co Cu Pb Zn
Units mg kg−1 mg kg−1 mg kg−1 mg kg−1 mg kg−1
NIST 2710Measured 621±26a 10.5±0.08 2976±4 5500±6 6804±2Certified 626±38 10 2950±130 5532±80 6950±91
NIST 2711Measured 110±4 10.2±0.1 118±0.9 1238±5 343.8±1.0Certified 105±8 10 114±2 1162±31 350.4±4.8
BCR 483Step 1 measured 7.73 0.98 19.0 0.496 416Step 2 certified –b – 16.8±1.5 0.756±0.7 441±39Step 2 measured 16.6 1.98 133 429 494Step 2 certified – – 141±20 379±21 438±56Step 3 measured 10.6 1.57 167 55.0 40.2Step 3 certified – – 132±29 66.5±22 37.1±9.9Residue measured 17.5 3.34 33.8 69.5 64.1Residue certified – – 43.3±3.8 76.9±17 82.1±9.6Sum calculated 52.4 7.86 353 554 1014Sum certified – – 333±35 523±35 998±70
77V. Ettler et al. / Geoderma 164 (2011) 73–84
HNO3 and immediately analysed by ICP-MS for the total concen-trations of As, Co, Cu, Pb and Zn. The BCR SEP consisted of thefollowing steps: (i) Step 1 — exchangeable/acid extractablefraction (targeting soluble/exchangeable metals and carbonates),0.11 mol l−1 CH3COOH; (ii) Step 2 — reducible (targeting Fe–Mnoxyhydroxides), 0.5 mol l−1 NH2OH·HCl at pH 1.5; (iii) Step 3 —
oxidisable (targeting organic matter and sulphides), H2O2 (85 °C)then 1 mol l−1 CH3COONH4; (iv) Residual — total digestion (targetingmetals bound to silicates) (for detailed description of the preparationof extraction solutions and procedure see e.g., Rauret et al., 1999;Bacon and Davidson, 2008 or Ettler et al., 2010). The residual step isonly recommended and can also be calculated from a separate aquaregia pseudo-total digestion minus the sum of Steps 1 to 3 (Bacon andDavidson, 2008). In our case, due to insufficient extractability by aquaregia, the residual and pseudo-total digestions were replaced bycomplete digestion in mineral acids (HF–HClO4–HNO3) (Ettler et al.,2010). Although the BCR SEP is designed for metals and notmetalloids (forming anions in the environment), some applicationsfor As can be found in the literature (Bacon and Davidson, 2008;Ettler et al., 2010).
Total certified – – 362±12 501±47 987±37
a Mean±standard deviation.b – not given.
2.3.4. Lead isotopic determinationsThe Pb isotopic compositions (206Pb/207Pb and 208Pb/206Pb ratios)were determined in 50 selected topsoils in a 32-km2 area around theNkana smelter and in 13 soil samples from the contaminated soilprofile (bulk digests and sequential extraction steps obtained from thechemical fractionation study). To obtain the signature of possiblepollution sources, the Pb isotopic composition was determined forslags and flying dust sampled in the vicinity of the smelter. Accordingto our previousmethodological studies (Ettler et al., 2004), the digestswere diluted to Pb concentrations of 25±5 μg l−1 and analysed byICP-MS. The detailed analytical conditions are given elsewhere(Mihaljevič et al., 2011). Correction for the mass bias was carriedout using NIST 981 (common lead) standard solution analysed afterevery second sample. The standard errors for measurements of the206Pb/207Pb and 208Pb/206Pb were generally below 0.3% RSD.
2.3.5. Data processingThe basic statistics and graphical interpretation of the obtained
data were performed by Excel 2003 (MS Office, Microscoft, USA) andSigmaPlot 11 (Systat Software, USA). The grid was calculated and theresults of the spatial distribution of metal/metalloid contaminantswere mapped using Surfer 8 (Golden Software, USA). The existingconcentration data from the previous sampling of subsurface soils(depth 80–90 cm) from the dataset of Kříbek et al. (2010) were alsoadded to the spatial distribution plots generated from the topsoil data.The correlation coefficients were calculated using the NCSS statisticalsoftware (NCSS, USA).
2.3.6. Quality control of the analytical proceduresThe accuracy of the TOC and S measurements was controlled using
NIST 2710 standard reference material (SRM) and was always betterthan 5%. Standard reference materials NIST 2710 (Montana soil —highly elevated concentrations) and NIST 2711 (Montana soil —
moderately elevated concentrations) were used to check the qualityof the total digestions and subsequent chemical analysis of As, Co, Cu,Pb and Zn. The accuracy of the digestion procedure was within 7%relative standard deviation (RSD) (Table 1). The reproducibility basedon duplicated digestions/determinations of bulk chemical composi-tions was generally below 5% RSD. Certified reference materials(CRM) BCR 483 (Sewage sludge amended soil) were used to check theaccuracy of the BCR SEP, and the results were found to be satisfactoryalthough the analysis was performed in only one replicate (Table 1).
3. Results
3.1. Soil properties
The statistical data including the basic properties and chemicalparameters for topsoils and for the contaminated soil profile are givenin Tables 2–5. The mean value of the pH for a set of topsoils was 4.8.Slightly higher pH values ranging between 5.3 and 5.6 were observedin the topmost horizon of the profile (0–10 cm). The pH valuedecreases down to 4.2 with depth. The mean Corg concentration was23.4 g kg−1 for the set of topsoils (Table 2). The vertical distribution ofCorg indicates its enrichment in the uppermost horizons (15.3–76.3 g kg−1), rapidly decreasing in deeper layers (b5 cm) to less than5 g kg−1 (Table 3). Sulphur is also enriched in the uppermost soilhorizons and the maximum value in topsoils was 4500 mg kg−1 forsamples collected in the areas strongly affected by the smelter fumes(Tables 2 and 3). CEC exhibited low values with low base saturation(BS) being slightly higher in the uppermost horizons (Table 3). Inmore acidic horizons below 20 cm depth, CEC was predominantlycomposed of exchangeable acidity (Al3++H+). Granulometry mea-surements indicated that the clay fraction was significantly higher atdepths below 5 cm (Table 3). The mineralogical composition in theprofile was rather uniformwith predominant quartz (SiO2) andminorkaolinite [Al2Si2O5(OH)4] and hematite (Fe2O3), with a chlorite-groupphase [(Mg,Fe,Al)6(Al,Si)4O10(OH)8] and an amorphous phase (prob-ably organic matter) detected in the uppermost horizon (Table 3).
The total concentrations of Al, Fe and Mn indicate their relativelyhomogeneous distribution in the soil profile, with a slight enrichmentin the topmost samples (Table 4). Selective oxalate extractionsindicated only a small proportion of amorphous/less crystallineoxides (1–2% of total Al, 0.4–4% of total Fe and 2–17% of total Mn).Thus, these metals are mostly bound in clays and crystalline Fe-oxides, as was also confirmed by XRD (Table 3).
3.2. Spatial distribution of metals/metalloids
The concentration ranges, means andmedians of As, Co, Cu, Pb andZn for the topsoil dataset are given in Table 2, showing that Cu is themost critical contaminant with concentrations attaining more than27 g kg−1. Statistically significant correlations between the topsoilconcentrations of the individual contaminants were observed

Table 2Basic statistical data for topsoils (n=196).
Code pH Corg Stot As Co Cu Pb Zn
Units Std. units g kg−1 g kg−1 mg kg−1 mg kg−1 mg kg−1 mg kg−1 mg kg−1
Min 4.06 0. 5 0.04 0.04 2.0 34 4.0 4.0Max 8.04 128 4.5 255 606 27,410 480 450Mean 4.80 23.4 0.4 3.13 56.8 1501 15.3 34.4Median 5.06 18.4 0.2 0.65 19.0 454 4.0 15.0
78 V. Ettler et al. / Geoderma 164 (2011) 73–84
(R=0.59–0.92, pb0.05). The spatial distributions of Co and Cu (asrepresentative examples) in the studied area topsoils are plotted inFig. 2, indicating the highest contamination NW (downwind) of thesmelter stack corresponding to the direction of the prevailing wind inthe area (see also the wind rose, Fig. 1). In addition, Co (Fig. 2), Pb(Fig. 5) and Zn anomalies (not shown) also expand further NW of thezone directly impacted by smelter emissions, located close to theKitwe–Chambishi road. These elevated concentrations may be relatedto the concentrate transport from the Chingola flotation plant to theNkana smelter (Kříbek et al., 2010).
3.3. Vertical distribution and chemical fractionation of metals/metalloids
The concentration data for As, Co, Cu, Pb and Zn in the contaminatedOxisol profile indicate enrichment of the uppermost soil horizons(Table 5). The concentrations of some contaminantswere evenhigher inthe 0–2 cm horizon than for the topsoil dataset used for the spatialdistribution plot (cf. Tables 2 and 4): 37,770 mg Cu kg−1, 676 mgCo kg−1, and 549 mg Zn kg−1. The bulk concentration data show thatCu is probably the most mobile contaminant in this soil system due tothe elevated concentration even in the B2 horizon (10–20 cm). Incontrast, As, Co, Pb and Zn showelevated concentrations only in the twotopmost horizons A0 and A1 (depth 0–5 cm) (Table 5). The XRD-basedinvestigationof theheavymineral fraction in theuppermost soil horizonindicated the predominance of hematite (Fe2O3),magnetite (Fe3O4) andtenorite (CuO) with minor amounts of cuprite (Cu2O), chalcopyrite
Table 3Description and basic properties of the studied Oxisol profile.
Sample Horizon Depth(cm)
Colour(moist)a
Description Humidit
%
Z1 A0 0–2 7.5YR 4/2 brown Humus layer, dense (fine)root network, mgf structure
0.09
Z2 A1 2–5 5YR 4/6 yellowishred
Root zone, root network,mg structure
0.15
Z3 B1 5–10 2.5YR 4/6 red Dry, mf structure, largefragments
0.32
Z4 B2 10–20 2.5YR 4/8 red Dry-wet transition, mg/gf
structure (rare aggregates1–20mm)
0.34
Z5 C1 20–30 2.5YR 3/6 dark red Wet crust, mg/g structure(aggregates 1–20mm)
0.52
Z6 C2 30–40 2.5YR 3/6 dark red Wet, g structure(aggregates 1–30mm)
0.58
Z7 C3 40–50 2.5YR 3/6 dark red Wet, g structure(aggregates 2–30mm)
0.72
Z8 C4 50–60 2.5YR 3/6 dark red Wet, g structure(aggregates 2–30mm)
0.79
Z9 C5 60–70 2.5YR 3/6 dark red Wet, g/m structure 0.97Z10 C6 70–80 2.5YR 3/6 dark red Wet, g/m structure 0.74Z11 C7 80–90 2.5YR 3/6 dark red Wet, g/m structure 0.80Z12 C8 90–100 2.5YR 3/6 dark red Wet, g/m structure 0.90Z13 C9 100–110 2.5YR 3/6 dark red Wet, g/m structure 1.00
a According to the Munsell soil colour chart.b Determined after drying at 105 °C.c CEC = cation exchange capacity.d BS = base saturation.e Q , quartz; Ch, chlorite; Ka, kaolinite; He, hematite; am, amorphous phase (probably sof Structure: mg = microgranular; g = granular; m = massive.
(CuFeS2), brochantite (Cu4(SO4)(OH)6) and also trace occurrences ofvillamaninite ((Cu,Ni,Co,Fe)S2).
The sequential extraction procedure indicated substantial differ-ences in binding of the studied contaminants to soil fractions and theirsubsequent mobility (Fig. 3, only the uppermost 3 horizons andhorizon C1 for comparison are reported). Arsenic was predominantlypresent in the residual fraction, especially in the deeper soil horizons.However, in the A0 horizon (0–2), 6% As (4.9 mg kg−1) was highlyavailable, being present in the exchangeable fraction and 38% As(32 mg kg−1) was bound in the reducible fraction. In the A1 horizon(2–5 cm), 19% (4 mg kg−1) of the As was detected in the reduciblefraction and 26% (6 mg kg−1) of the As was bound in the oxidisablefraction (Fig. 3).
The chemical fractionation of Co was also dominated by binding tothe residual fraction, except for the uppermost soil horizons. In the A0horizon, 3% (17 mg kg−1) of the Co was bound in the exchangeablefraction, 11% (73 mg kg−1) in the reducible and 14% (97 mg kg−1) inthe oxidisable fraction. Similar proportions were observed in the A1horizon (4% [7 mg kg−1], 14% [28 mg kg−1] and 9% [17 mg kg−1] inthe exchangeable, reducible and oxidisable fractions, respectively)(Fig. 3). The chemical fractionation in the deeper horizons indicatedthat the residual fraction accounted for ca. 90% and the remainder ofthe Co was equally distributed between the exchangeable andreducible fractions (Fig. 3).
The sequential extraction procedure indicated that a large propor-tion of the Cu was present in the mobile fractions, especially in the
yb pHH2O Corg Stot CECc BSd Granulometry (%) Mineralogye
g kg−1 mg kg−1 cmol+kg−1 % Sand Silt Clay
5.30 76.3 3633 0.94 43 51.4 45.7 2.9 Q, Ch, He, am
5.64 15.3 923 0.33 96 61.6 37.4 1 Q, Ka, He
5.33 4.6 69 0.60 86 60.8 9.4 29.8 Q, Ka, He
4.74 4.3 73 0.86 35 54.4 15.6 30 Q, Ka, He
4.52 3.6 94 1.10 23 52.6 11.7 35.7 Q, Ka, He
4.35 3.1 162 1.15 21 42.4 16.5 41.1 Q, Ka, He
4.37 2.7 212 1.38 20 46.1 13.7 40.2 Q, Ka, He
4.26 2.1 232 1.53 18 52.6 14.4 33 Q, Ka, He
4.20 1.9 259 1.51 19 46.2 18.7 35.1 Q, Ka, He4.21 1.6 248 1.46 17 62.3 12.7 25 Q, Ka, He4.22 1.7 262 1.58 19 50.6 28.5 20.9 Q, Ka, He4.20 2.0 240 1.46 25 54.7 12.3 33 Q, Ka, He4.25 1.7 259 1.40 29 50.6 13 36.3 Q, Ka, He
il organic matter).

Table 4Bulk concentrations and selective oxalate extractions of Al, Fe and Mn in the studied Oxisol profile.a
Sample Horizon Depth Total concentrations Oxalate extractions Oxalate-extracted/total ratio
cm Altot Fetot Mntot Alox Feox Mnox Alox/Altot
Feox/Fetot
Mnox/Mntotg kg−1 g kg−1 g kg−1 g kg−1 g kg−1 g kg−1
Z1 A0 0–2 133±0.55 128±1.00 0.52±0.000 2.36±0.02 4.74±0.07 0.029±0.004 0.02 0.04 0.06Z2 A1 2–5 120±0.35 77.9±0.05 0.23±0.003 1.51±0.02 1.77±0.03 0.030±0.009 0.01 0.02 0.13Z3 B1 5–10 123±0.73 63.0±0.17 0.14±0.005 1.10±0.03 0.61±0.01 0.024±0.014 0.01 0.01 0.17Z4 B2 10–20 130±1.80 64.3±0.95 0.14±0.005 1.31±0.02 0.55±0.01 0.019±0.006 0.01 0.01 0.14Z5 C1 20–30 144±1.00 68.9±0.50 0.15±0.003 1.50±0.02 0.68±0.01 0.008±0.003 0.01 0.01 0.05Z6 C2 30–40 168±1.22 78.2±0.60 0.17±0.000 1.43±0.00 0.52±0.02 0.027±0.004 0.01 0.01 0.16Z7 C3 40–50 195±2.13 87.9±0.75 0.21±0.005 1.63±0.02 1.20±0.01 0.018±0.004 0.01 0.01 0.09Z8 C4 50–60 187±0.30 84.8±0.05 0.21±0.008 1.51±0.03 0.45±0.03 bDLb 0.01 0.01 ndc
Z9 C5 60–70 197±1.50 89.9±0.92 0.23±0.003 1.56±0.03 0.37±0.01 bDL 0.01 0.004 ndZ10 C6 70–80 188±1.28 86.0±0.65 0.22±0.000 1.41±0.04 0.88±0.03 bDL 0.01 0.01 ndZ11 C7 80–90 200±3.48 90.2±1.40 0.24±0.012 1.46±0.03 0.46±0.02 0.030±0.017 0.01 0.01 0.13Z12 C8 90–100 198±0.75 89.1±0.45 0.24±0.005 1.70±0.03 1.50±0.03 0.020±0.008 0.01 0.02 0.08Z13 C9 100–110 204±2.83 93.5±0.40 0.26±0.003 1.47±0.03 0.53±0.02 0.004±0.000 0.01 0.01 0.02
a Mean±standard deviation.b Detection limit (DL) for Mn is 0.002 g kg−1.c nd = not determined.
79V. Ettler et al. / Geoderma 164 (2011) 73–84
uppermost 4 horizons. In the A0 horizon, 33% (12,610 mg kg−1) of theCu was bound in highly mobile exchangeable fraction, 25%(9490 mg kg−1) in the reducible fraction and 9% (3450 mg kg−1) inthe oxidisable fraction (Fig. 3). The chemical fractionation of Cu in thedeeper soil horizons was rather similar to the following ranges in theindividual fractions: 43–56% exchangeable, 16–24% reducible, 5–7%oxidisable, 15–33% residual. This trend indicates that all the horizonscontain “mobile”Cu,which canmove vertically in the soil profile (Fig. 3).
Lead was mainly bound in the reducible fraction, except for theuppermost horizon, where 9% (36 mg kg−1) was bound in theexchangeable, 59% (247 mg kg− 1) in the reducible and 3%(12 mg kg−1) in the oxidisable fraction, respectively (Fig. 3). In theA1 horizon, a substantial amount of Pb was still bound in the reduciblefraction (22%, i.e., 24 mg kg−1) with minor contribution of theexchangeable (5%, i.e., 5.5 mg kg−1) and oxidisable (1%, i.e.,1.1 mg kg−1) fractions. In the deeper soil horizons, approximately1.2 to 1.5% of the Pbwere bound in the reducible fraction and less than0.1% in the exchangeable and oxidisable fractions (Fig. 3), indicatingthat a minute amount of Pb can be vertically mobile in the soil profile.Interestingly, low Pb concentrations were reported by Kříbek et al.(2010) for subsurface soils in the studied area (generally below10 mg kg−1, see subsurface soil data added to the spatial distributionplots in Fig. 2). In contrast, our data from the contaminated profileindicate that the subsurface Pb concentrations are close to100 mg kg−1. This discrepancy may be related to the inefficiency ofaqua regia pseudo-total digestion used by Kříbek et al. (2010); this
Table 5Bulk concentrations of metal/metalloid contaminants in the studied Oxisol profile.a
Sample Horizon Depth As C
cm mg kg−1 m
Z1 A0 0–2 85.2±0.96 6Z2 A1 2–5 18.7±0.60 2Z3 B1 5–10 0.95±0.03 9Z4 B2 10–20 0.91±0.07 8Z5 C1 20–30 0.85±0.11 8Z6 C2 30–40 0.92±0.05 1Z7 C3 40–50 1.32±0.09 1Z8 C4 50–60 1.25±0.003 1Z9 C5 60–70 1.35±0.01 1Z10 C6 70–80 1.77±0.07 1Z11 C7 80–90 1.60±0.31 1Z12 C8 90–100 1.31±0.31 1Z13 C9 100–110 1.54±0.22 1
a Mean±standard deviation.
process is highly inefficient, especially for deeper soil horizonsamples, where Pb is present in the residual fraction (Fig. 3). The“complete” digestion procedure using the combination of acids (HF–HClO4–HNO3) employed in this work is substantially more efficient inthe extraction of metallic elements bound in these matrices.
Zinc chemical fractionation was dominated by binding to theresidual fraction (Fig. 3). The binding to the reducible fraction wasubiquitous in all the soil horizons ranging between 5 and 8% of the totalZn concentrations (0.5 to 37 mg kg−1). The exchangeable fractionaccounted for 7–10% (0.8 to 53 mg kg−1) in the three uppermosthorizons and the oxidisable fraction accounted for ca 3% (1.6 to16 mg kg−1) in the two uppermost horizons (Fig. 3).
3.4. Lead isotopic tracing of contaminant dispersion in topsoils and soilprofile
The three-isotope graph (206Pb/207Pb vs 208Pb/206Pb), indicatingthe ranges of Pb isotopic compositions of the studied materials (soils,slags, fly ash), is given in Fig. 4. The isotopic compositions of smelter-derived sources are rather variable (206Pb/207Pb): 1.204–1.206 (flyash), 1.191–1.274 (slags from Nkana), 1.21–1.28 (ore concentrates,taken from Mihaljevič et al., 2011). This variation indicates that theisotopic composition of the incoming processed material changed inthe history of smelting activities at Kitwe. The “uncontaminated” soilscorresponding to deeper soil horizons have 206Pb/207Pb around 1.350(Fig. 4). Another possible source of contamination in the area is leaded
o Cu Pb Zn
g kg−1 mg kg−1 mg kg−1 mg kg−1
76±2.40 37,770±70 419±1.90 549±0.2004±0.90 14,901±315 107±5.46 61.5±0.08.36±0.00 981±4.40 72.1±0.07 11.8±0.01.64±0.02 433±0.20 75.7±0.77 12.5±0.08.44±0.16 297±0.90 82.0±4.37 12.5±0.000.3±0.03 291±6.70 103±4.38 14.6±0.032.0±0.09 250±3.70 117±4.86 17.0±0.172.6±0.13 232±0.30 108±1.24 16.6±0.144.1±0.20 227±1.00 114±0.33 17.6±0.153.0±0.03 205±0.90 108±0.84 23.3±0.844.0±0.17 239±0.00 117±2.80 21.5±0.305.1±0.04 259±5.30 111±0.41 24.2±2.216.5±0.20 323±7.50 119±2.12 22.4±0.17

0-2
2-5
5-10
20-30
exchangeablereducibleoxidisableresidual
Co
concentration (mg/kg)
Dep
th (
cm)
0-2
2-5
5-10
20-30
Dep
th (
cm)
Fractions
As
0 4000 8000 12000 160000 100 200 300 400 500 6000 10 20 30 40 50 60
0 100 200 300 0 100 200 300 400 500
Cu
Pb Zn
Fig. 3. Chemical fractionation of As, Co, Cu, Pb and Zn in selected horizons of the highly contaminated soil profile sampled in the vicinity of the Nkana smelter.
80 V. Ettler et al. / Geoderma 164 (2011) 73–84
gasoline, whichwas still used in the past decade in Zambia.Within thearea, especially environments in the vicinity of roads are also affectedby heavy traffic related to transport of materials originating frommines and smelter operations. Although it was not possible to sample
1.05 1.10 1.15 1.20 1.25 1.30 1.35 1.401.8
1.9
2.0
2.1
2.2
2.3
208 P
b/20
6 Pb
206Pb/207Pb
laterite soil profile(depth < 5 cm)Nkana slags
Nkana smelter dust
A2 horizonlaterite soil
(depth 2-5 cm)
A1 horizonlaterite soil
(depth 0-2 cm)
grass roots(laterite soil)
aerosolsSouth Africa
topsoils around Nkana (n = 50)
Fig. 4. Three-isotope graph of 208Pb/206Pb vs 206Pb/207Pb showing the Pb isotopiccomposition of topsoils in the Kitwe area (n=50), samples from the contaminated soilprofile collected in the close vicinity of the Nkana smelter (n=13), slags (n=7) andflying dusts from the smelter (n=2) and South-African aerosols taken from Bollhöferand Rosman (2000, 2002).
leaded gasoline in Zambia in 2008, the existing data from neighbour-ing countries (Zimbabwe, South Africa, Namibia) indicate thatatmospheric aerosols have 206Pb/207Pb between 1.067 and 1.090(Bollhöfer and Rosman, 2000; Bollhöfer and Rosman, 2002). Some ofthe topsoil samples indicate that their Pb isotopic composition can beamixture of smelter-derived Pb (predominant) and petrol-derived Pb(minor contribution). The Pb isotopic composition of topsoils (n=50)around the Nkana smelter range from 1.156 to 1.323, indicating theinfluence of background-, smelting- and traffic-related Pb. The spatialdistribution of the 206Pb/207Pb and 208Pb/206Pb isotopic ratios in thestudied area is reported in Fig. 5. This plot indicates that the topsoilswith the lowest 206Pb/207Pb signatures and highest 208Pb/206Pbsignatures corresponding to a Pb mixture derived from smelting andpetrol combustion are located downwind (NW) of the smelter stack(correlating closely with the bulk metal/metalloid concentrations)and close to the road going to NW from Kitwe.
Individual fractions of SEP were also analysed for the Pb isotopiccomposition (Fig. 6). Bulk digestions indicated that soil horizonsbelow a depth of 5 cm exhibit 206Pb/207Pb close to 1.35 (Fig. 4). Asimilar signature was also observed for the residual fraction inhorizons below 5 cm (Fig. 6). All the fractions of SEP in the twouppermost soil horizons have signatures corresponding to a mixtureof smelter- and petrol-derived Pb. At depths b5 cm, the exchangeableand oxidisable fractions have 206Pb/207Pb between 1.175 and 1.200,whereas Pb bound to the reducible fraction exhibits 206Pb/207Pb closeto 1.250 (Fig. 6). This observation indicates that, although themajorityof Pb in deeper soil horizon is rock-derived and is immobile; a minuteamount of Pb (ca. 1 mg kg−1, i.e., ca. 1.5% of the total concentration)

Fig. 5. Spatial distribution of Pb in topsoils (n=196) and corresponding 206Pb/207Pb ratios in selected 50 topsoil samples in the Kitwe area.
81V. Ettler et al. / Geoderma 164 (2011) 73–84

Dep
th (
cm)
1.15 1.20 1.25 1.30 1.35 1.40
-25
-20
-15
-10
-5
0
exchangeable reducible oxidisable residualFractions
124
77
71
74
81
247
24
1.05
1.02
0.96
0.08
0.07
0.07
5.51.1
12
0.29
0.30
0.30
36 numbers indicatePb concentration (mgkg-1)in individual fractions
contamination206Pb/207Pb
Fig. 6. Patterns of Pb isotopic composition (206Pb/207Pb) in different fractions of thesequential extraction procedure and their changes with depth in the contaminated soilprofile.
82 V. Ettler et al. / Geoderma 164 (2011) 73–84
with anthropogenic signature is mobile in the soil profile andmigratesvertically to deeper soil horizons. Given the fact that the smelter wasin operation from 1931 until the soil sampling campaign in 2008 (i.e.,77 years, Vítková et al., 2010) and the anthropogenic signature wasdetected in some SEP fractions at the bottom of the soil profile at adepth of 105 cm, the vertical migration rate for Pb can be estimated to1.36 cm year−1. The absence of isotopic data for the other contam-inants precludes more precise calculation of their vertical migrationrate. This can be estimated only on the basis of the presence/absenceof “mobile” (exchangeable) fractions in the individual horizons of thecontaminated soil profile. Based on this assumption, Cu and Co boundin the exchangeable fraction also penetrated down to the bottom ofthe profile, indicating that these two metals would have similarpenetration rates to Pb. In contrast, exchangeable As occurred only inthe topmost layer and no exchangeable Zn occurred in horizons below10 cm, showing that both these contaminants have significantly lowervertical mobility.
4. Discussion
Topsoils are the most fragile compartment of environmentalsystems, being highly affected by smelter emissions (Rieuwerts et al.,1999; Kříbek et al., 2010). The degree of contamination in topsoils inagricultural areas is particularly critical, due to possible contaminanttransfer to plants and subsequent steps in the food chain (Douay et al.,2008; Banza et al., 2009). Another impact is related to windblownerosion of topsoils and formation of highly contaminated dust ordirect exposure to smelter fumes, which can influence the localpopulation (Meter et al., 1999; Williamson et al., 2004; Pope et al.,2007; Banza et al., 2009). The mineralogical composition of the heavymineral fraction in the topmost layer of the highly contaminated soilprofile yielded the presence of primary and secondary Cu-bearingphases derived from smelter fumes and mining operations (Cusulphides and oxides, brochantite), in agreement with previouslypublished data on the mineralogy of dust from the Cu smelting andmining industry (Samuelsson and Björkman, 1998; Barcan, 2002;Knight and Henderson, 2006; Kříbek et al., 2010). It has been reportedat numerous smelting sites that the dispersal of contaminants aroundthe smelters is highly dependent on the local meteorological situation,mainly on the prevailing wind direction (Rieuwerts et al., 1999; Ettleret al., 2005; Knight and Henderson, 2006; Tembo et al., 2006). This hasalso been documented by the spatial distributions of As, Co, Cu, Pb and
Zn and the Pb isotopic compositions in topsoils close to the Nkanacopper smelter (Figs. 2 and 5). Although even higher concentrationsof the studied contaminants were documented during previousstudies (Kříbek et al., 2010), the area around Kitwe is one of themost contaminated hotspots in the Copperbelt province. According toTembo et al. (2006), a number of topsoil samples exceed the WHO(World Health Organization) limits for the total metal concentrationin soil, e.g., 30 mg Cu kg−1, 35 mg Pb kg−1, 90 mg Zn kg−1.
Chemical fractionation studies by means of SEP are extremelyimportant when assessing the (bio)availability or mobility of metalsand metalloids in soil profiles (Martley et al., 2004; Bacon andDavidson, 2008). Although the highest degree of contamination wasfound in the uppermost horizons of the studied soil profile (0–10 cm),SEP indicated that a minor amount of metals can be bound in themobile (exchangeable) fraction. The highest mobility in horizonsbelow 10 cm was observed for Cu, where the exchangeable fractionaccounted for up to 56% of the total concentration. In contrast to othermetals, significantly higher Cu mobility was also observed in othersoils affected by Cu smelting (Kabala and Singh, 2001; Burt et al.,2003; Martley et al., 2004). It is known that tropical soils arecomposed of low activity clays (kaolinite) and have relatively loworganic matter concentrations, low pH values and abundant Fe-oxides(Rieuwerts, 2007 and Table 3). Relatively low levels of organic matteroccurring predominantly in the uppermost soil horizons are generallynot able to completely retain the contamination (Rieuwerts, 2007 andreferences therein). Metallic contaminants can be highly mobile evenin highly organic horizons of temperate forest soils polluted bysmelters (Ettler et al., 2004; Ettler et al., 2005). It has also beensuggested that Cu can form mobile complexes with dissolved organiccarbon (DOC) and can migrate downward especially in acidic sandysoils (Temminghoff et al., 1997). A similar mobilisation mechanismcan be suggested for the studied Oxisol and is also supported by SEPdata, indicating that Cu can be substantially bound to soil organicmatter (oxidisable fraction) (Fig. 3; Kabala and Singh, 2001). Inaddition, kaolinite and similar clay minerals are not able to efficientlyadsorb metals because of their significantly lower CEC values, incontrast to smectites and montmorillonites which are significantlymore efficient adsorbents in temperate soils (Rieuwerts, 2007). Inagreement with other studies (Kabala and Singh, 2001; Burt et al.,2003; Martley et al., 2004; Ettler et al., 2005; Ettler et al., 2010), a largeproportion of all the metals and As have been found in the reduciblefraction (Fig. 3), which could represent binding to Fe-oxides that aremassively present in our soil samples (Table 3) and suggest that theyare the most efficient adsorbing compounds in these soil systems(Rieuwerts, 2007).
Lead isotopes were used to trace the degree and sources ofpollution in topsoils and a highly contaminated soil profile. Theregional background end-member corresponded to 206Pb/207Pb ca.1.35, as documented at the bottom of the soil profile. The variablechemical composition of the Nkana slags, fly ashes and concentratesindicated historical changes in the feed material (206Pb/207Pb of thesmelter source was 1.19–1.28). Nevertheless, some of the topsoilsamples had slightly less radiogenic compositions (206Pb/207Pb ca.1.17) indicating possible mixture with petrol-derived Pb (SouthAfrican aerosols have compositions ca. 1.07–1.09). To elucidate thecontribution of the three possible sources (background, smelting,petrol combustion) using isotopic tracing, either inclusion of the 204Pbisotope (which is not precisely measured by our ICP-MS technique)(Ellam, 2010) or multi-isotopic systems (Bullen and Walczyk, 2009)would be useful.
Lead isotopic tracing applied to SEP fractions confirmed that theanthropogenic Pbwas rathermobile and penetrated down to deeper soilhorizons (Fig. 6). The isotopic signature of this Pb (approx. 1.5% of thetotal Pb concentration in deeper soil horizons) with values between1.175 and 1.200 probably corresponded to a mixture of smelter- andpetrol-derived Pb with a predominant smelter component. Numerous
83V. Ettler et al. / Geoderma 164 (2011) 73–84
studies showed that Pb in “mobile” formsobtainedby singleor sequentialextractions exhibited isotopic signatures corresponding to an anthropo-genic signal, whereas total digests or residual fractions corresponded tothe background (natural) signatures (Erel, 1998; Teutsch et al., 2001;Bacon and Hewitt, 2005). In our profile, the only exceptions are thetopmost soil horizons, where the Pb isotopic composition of residualfractionsdoesnot correspond to thebackgroundvalues, but is close to theanthropogenic signal (206Pb/207Pb=1.19) (Fig. 6). This phenomenoncanbe related to the presence of smelter-derived slag-like particles, whichare resistant to weathering. Knight and Henderson (2006) investigatedsmelter-derived particles in topsoils and showed that they can be rapidlyaltered, leading to release of metals in the soil, except relatively stableslag particles, encapsulating metals in glassy/silicate matrices, which aresignificantly more resistant to weathering and could also be observed intopsoils at other smelting sites in the Zambian Copperbelt (Kříbek et al.,2010). Based on the SEP results, isotopic data and knowledge of theNkana smelter activity, we calculated that the vertical penetration ratecan be estimated at 1.36 cm year−1. In smelter-affected forest soils inCentral Europe, Ettler et al. (2004) calculated a verticalmigration rate forPb in the range 0.3–0.36 cm year−1. Studies focused on Mediterraneansandy soils showed that the Pb penetration rate was ~0.5 cm year−1
(Erel, 1998; Teutsch et al., 2001). In addition, it has been reported byMiller and Friedland (1994) that the Pb penetration rate could be evenmore rapid, especially in mineral soil horizons, ranging from 0.82 to1.97 cm year−1; these values correspond well to the estimates for ourOxisol profile. The role ofprecipitation canalsobeextremely important inmobilisation and vertical transport of contaminants; at the sitesmentioned above, the precipitation rates were approx. 600 mm year−1
(Teutsch et al., 2001; Ettler et al., 2004), i.e., half of the annualprecipitation rate at the studied Zambian site (1320 mm year−1). Thepenetration rates for Co and Cuwere probably similar to that of Pb, basedon the presence of a “mobile” exchangeable fraction in the deeper soilhorizons. In contrast, As and Zn are significantly less mobile with noindication of an exchangeable fraction below a depth of 2 and 10 cm,respectively (Fig. 3). Taking into account the fact that As occurs in thestudied soils in significantly lower concentrations than other contami-nants and predominantly forms anionic species in aqueous/soil environ-ments, it can be more efficiently retained by oxides and organic matter,which have positively charged surfaces under acidic conditions (Fig. 3;Ettler et al., 2010). Although quite different data has been published forthe vertical mobility of Zn in tropical soils (Rieuwerts, 2007 andreferences therein), it seems that the lower vertical Zn mobility in thestudied soil profile is consistent with numerous other studies fromsmelter-affected soil environments (e.g., Sterckeman et al., 2000; Kabalaand Singh, 2001).
5. Conclusions
Topsoils in the vicinity of the Nkana copper smelter (Zambia) andsoils from a highly contaminated soil profile located close to thesmelter stack were studied using a combination of analysis of bulkmetal/metalloid concentrations, sequential extraction procedures(SEP) and Pb isotopic fingerprinting of pollution sources. The spatialdistribution of As, Co, Cu, Pb and Zn were mostly affected by theprevailing wind direction and the highest concentrations weredetected downwind (NW) of the smelter. SEP indicated that a numberof metals (mainly Cu) can be mobile in the soil profile. Lead isotopicanalysis indicated the mixing of three major pollution sources (givenas 206Pb/207Pb ratios): smelting activities (1.19–1.28), petrol com-bustion (1.07–1.09) and regional background (deep soil horizons, ca.1.35). It has been demonstrated by SEP combined with Pb isotopictracing and knowledge of historical smelting activities in the area thatanthropogenic Pb (corresponding to concentration of 1 mg kg−1 i.e.,approx. 1.5% of total Pb) exhibited downward migration in the highlycontaminated soil profile estimated at 1.36 cm year−1.
Acknowledgements
This study was supported by the Czech Science Foundation (GAČR205/08/0321) and the Ministry of Education, Youth and Sports of theCzech Republic (MSM 0021620855). This study was carried outwithin the framework of the IGCP Project no. 594, Assessment ofimpact of mining and mineral processing on the environment andhuman health in Africa. Laboratory and technical assistance wereprovided by a number of our colleagues: Marie Fayadová, VěraVonásková and Jaromír Šikl (chemical analyses), František Veselovský(heavy mineral fraction separation), Ondřej Šráček (field work), PetrDrahota (XRD) and Vít Penížek (Department of Soil Science and SoilProtection, Czech University of Life Sciences, soil taxonomy). Dr.Madeleine Štulíková is thanked for revision of the English in themanuscript. The comments of two anonymous reviewers helped toimprove the original version of the manuscript.
References
Bacon, J.R., Hewitt, I.J., 2005. Heavy metals deposited from the atmosphere on uplandScottish soils: chemical and lead isotope studies of the association of metals withsoil components. Geochim. Cosmochim. Acta 69, 19–33.
Bacon, J.R., Davidson, C.M., 2008. Is there a future for sequential chemical extraction?Analyst 133, 25–46.
Banza, C.L.N., Nawrot, T.S., Haufroid, V., Decrée, S., De Putter, T., Smolders, E., Kabyla, B.I.,Luboya, O.N., Ilunga, A.N., Mtombo, A.M., Nemery, B., 2009. High human exposureto cobalt and other metals in Katanga, a mining area of the Democratic Republic ofCongo. Environ. Res. 109, 745–752.
Barcan, V., 2002. Nature and origin of milticomponent aerial emissions of the copper-nickel smelter complex. Environ. Int. 28, 451–456.
Bollhöfer, A., Rosman, K.J.R., 2000. Isotopic source signatures for atmospheric lead: thesouthern hemisphere. Geochim. Cosmochim. Acta 64, 3251–3262.
Bollhöfer, A., Rosman, K.J.R., 2002. The temporal stability in lead isotopic signatures atselected sites in the Southern and Northern Hemispheres. Geochim. Cosmochim.Acta 66, 1375–1386.
Bullen, T.D., Walczyk, T., 2009. Environmental and biomedical applications of naturalmetal stable isotope variations. Elem. 5, 381–385.
Burt, R., Wilson, M.A., Keck, T.J., Dougherty, B.D., Strom, D.E., Lindahl, J.A., 2003. Traceelement speciation in selected smelter-contaminated soils in Anaconda and DeerLodge Valley, Montana. USA. Adv. Environ. Res. 8, 51–67.
Cutler, C.J., Natarajan, M., Mponda, E., Eksteen, J.J., 2006. Phasing out reverbatoryfurnace operations at KCM Nkana. In: Jones, R.T. (Ed.), Southern AfricanPyrometallurgy 2006. South African Institute of Mining and Metallurgy, Johannes-burg, pp. 251–264. March 5–8, 2006.
Douay, F., Roussel, H., Pruvot, C., Waterlot, C., 2008. Impact of a smelter closedown onmetal content of wheat cultivated in the neighbourhood. Environ. Sci. Pollut. Res.15, 162–169.
Ellam, R.M., 2010. The graphical presentation of lead isotope data for environmentalsource apportionment. Sci. Total. Environ. 408, 3490–3492.
Erel, Y., 1998. Mechanisms and velocities of anthropogenic Pb migration inMediterranean soils. Environ. Res. A78, 112–117.
Ettler, V., Mihaljevič, M., Komárek, M., 2004. ICP-MS measurements of lead isotopicratios in soils heavily contaminated by lead smelting: tracing the sources ofpollution. Anal. Bioanal. Chem. 378, 311–317.
Ettler, V., Vaněk, A., Mihaljevič, M., Bezdička, P., 2005. Constrasting lead speciation inforest and tilled soils heavily polluted by lead metallurgy. Chemosphere 58,1449–1459.
Ettler, V., Tejnecký, V., Mihaljevič, M., Šebek, O., Zuna, M., Vaněk, A., 2010. Antimonymobility in lead smelter-polluted soils. Geoderma 155, 409–418.
ICDD, 2002. PDF-2 Database, Release 2002. International Centre for Diffraction Data,Newton Square, PA, USA.
Jackson, M.L., Lim, C.H., Zelazny, L.W., 1986. Oxides, hydroxides, and alumosilicates. In:Klute, A. (Ed.), Methods of Soil Analysis. Part 1: Physical and MineralogicalMethods. American Society of Agronomy-Soil Science Society of America, Madison,WI, pp. 101–150.
Kabala, C., Singh, B.R., 2001. Fractionation and mobility of copper, lead, and zinc in soilprofiles in the vicinity of a copper smelter. J. Environ. Qual. 30, 485–492.
Kamona, A.F., Nyambe, I.A., 2002. Geological characteristics and genesis of stratiformsediment-hosted Cu-(Co) deposits, Zambian Copperbelt. In: Miller, R.E. (Ed.), Proc.11th IAGOD Quadrennial Symposium and Geocongress, Extended Abstracts.Geological Survey of Namibia, Windhoek Namibia (CD version).
Knight, R.D., Henderson, P.J., 2006. Smelter dust in humus around Rouyn-Noranda.Québec. Geochem.-Explor. Environ. Anal. 6, 203–214.
Kříbek, B., Majer, V., Nyambe, I., 2007. Environmental-geochemical atlas of the central-northern part of the Copperbelt province of Zambia. Prague, Czech Republic, CzechGeological Survey Editions.
Kříbek, B., Majer, V., Veselovský, F., Nyambe, I., 2010. Discrimination of lithogenic andanthropogenic sources of metals and sulphur in soils of the central-northern part ofthe Zambian Copperbelt Mining District: a topsoil vs. subsurface soil concept.J. Geochem. Explor. 104, 69–86.

84 V. Ettler et al. / Geoderma 164 (2011) 73–84
Martley, E., Gulson, B., Louie, H., Wu, M., Di, P., 2004. Metal partitioning in soil profiles in thevicinity of an industrial complex,NewSouthWales, Australia. Geochem.-Explor. Environ.Anal. 4, 171–179.
Meter, S.L., Formenti, P., Piketh, S.J., Annegarn, H.J., Kneen, M.A., 1999. PIXEinvestigation of aerosol composition over the Zambian Copperbelt. Nucl. Instrum.Methods Phys. Res. B 150, 433–438.
Mihaljevič, M., Ettler, V., Šebek, O., Sracek, O., Kříbek, B., Kyncl, T., Majer, V., Veselovský,F., 2011. Lead isotopic and metallic pollution record in tree rings from theCopperbelt mining-smelting area. Zambia. Water Air Soil Pollut. 216, 657–668.
Miller, E.K., Friedland, A.J., 1994. Lead migration in forest soils: response to changingatmospheric inputs. Environ. Sci. Technol. 28, 662–669.
Pansu, M., Gautheyroux, J., 2006. Handbook of Soil Analysis: Mineralogical, Organic andInorganic Methods. Springer Verlag, Berlin, Heidelberg.
Pope III, C.A., Rodermund, D.L., Gee, M.M., 2007. Mortality effects of a copper smelterstrike and reduced ambient sulfate particulate matter air pollution. Environ. HealthPersp. 115, 679–683.
Rauret, G., López-Sanchez, J.F., Sahuquillo, A., Rubio, R., Favidson, C., Ure, A.,Quevauviller, P., 1999. Improvement of the BCR three step sequential extractionprocedure prior to the certification of new sediment and soil reference materials.J. Environ. Monit. 1, 57–61.
Rieuwerts, J.S., Farago, M., Cikrt, M., Bencko, V., 1999. Heavy metal concentrations inand around households near a secondary lead smelter. Environ. Monit. Assess. 58,317–335.
Rieuwerts, J.S., 2007. The mobility and bioavailability of trace metals in tropical soils: areview. Chem. Spec. Bioavailab. 19, 75–85.
Samuelsson, C., Björkman, B., 1998. Dust forming mechanisms in the gas cleaningsystem after the copper converting process. I. Sampling and characterisation.Scand. J. Metall. 27, 54–63.
Soil Survey Staff, 2010. Keys to Soil Taxonomy, 11th Ed. USDA-Natural ResourcesConservation Service, Washington, DC, USA.
Šráček, O., Mihaljevič, M., Kříbek, B., Majer, V., Veselovský, F., 2010. Geochemistry andmineralogy of Cu and Co in mine tailings at the Copperbelt, Zambia. J. Afr. Earth Sci.57, 14–30.
Sterckeman, T., Douay, F., Proix, N., Fourrier, H., 2000. Vertical distribution of Cd, Pb and Znin soils near smelters in the North of France. Environ. Pollut. 107, 337–389.
Tembo, B.D., Sichilongo, K., Cernak, J., 2006. Distribution of copper, lead, cadmium andzinc concentrations in soils around Kabwe town in Zambia. Chemosphere 63,497–501.
Temminghoff, E.J.M., Van der Zee, S.E.A.T.M., de Haan, F.A.M., 1997. Copper mobility incopper-contaminated sandy soil as affected by pH and solid and dissolved organicmatter. Environ. Sci. Technol. 31, 1109–1115.
Teutsch, N., Erel, Y., Halicz, L., Banin, A., 2001. Distribution of natural and anthropogeniclead in Mediterranean soil. Geochim. Cosmochim. Acta 65, 2853–2864.
Udachin, V., Williamson, B.J., Purvis, O.W., Spiro, B., Dubbin, W., Brooks, S., Coste, B.,Herrington, R.J., Mikhailova, I., 2003. Assessment of environmental impacts ofactive smelter operations and abandoned mines in Karabash, Ural Mountains ofRussia. Sust. Dev. 11, 1–10.
USGS, 2010. U.S. Geological Survey Minerals Information, Copper and Cobalt(http://minerals.usgs.gov/minerals/pubs/commodity. website assessed on July 23, 2010).
Vítková, M., Ettler, V., Johan, Z., Kříbek, B., Šebek, O., Mihaljevič, M., 2010. Primary andsecondary phases in copper-cobalt smelting slags from the Copperbelt Province,Zambia. Mineral. Mag. 74, 581–600.
Williamson, B.J., Udachin, V., Purvis, O.W., Spiro, B., Cressey, G., Jones, G.C., 2004.Characterisation of airborne particulate pollution in the Cu smelter and formermining town of Karabash, South Ural Mountains of Russia. Environ. Monit. Assess.98, 235–359.