tracer study of the short-term fate of particulate organic ... · 15N tracer study of the...
16
Vol. 16: 89-104, 1984 MARINE ECOLOGY - PROGRESS SERIES Mar. Ecol. Prog. Ser. Published February 29 15N tracer study of the short-term fate of particulate organic nitrogen at the surface of coastal marine sediments Jonathan H. Garber* Graduate School of Oceanography. University of Rhode Island, Kingston, Rhode Island 02881. USA ABSTRACT: I5N tracer experiments were conducted to examine the fate of particulate organic nitrogen at the surface of an intact silty sediment community from Narragansett Bay, R.I. (USA). I5N-labelled particulate organic matter (POM, 82.5 atom % I5N excess), obtained from cultured marine diatoms (Skeletonema costaturn), was applied to the surface of 10 to 12 cm deep sediment cores and the time course distribution of the tracer was determined in inorganic-N and organic-N compartments in sediment and free water. Tracer experiments were conducted in spring (8OC) and fall (16OC).Small amounts of tracer-N were recovered in all sediment and free water compartments after 1.5 d in spring and after 6 h in fall. The initial rates of transport of the tracer downward into the sediment, based on the depth distribution of I5N in cores incubated for less than 2 d, appeared to be anomalously high. Subsequent downward mixing of the tracer in particulate and dissolved forms gave estimates of the sediment vertical mixing coefficient (D,) of 3 to 5 X 1OP6 cm2 S-'. Net release of NH,+ from the cores was suppressed for about 24 h following application of labelled-POM to the sediment surface. This was probably caused by immobilization of nitrogen in a rapidly growing microbial population at the sediment surface. Subsequently, the net rates of 15NH,+ production in the cores averaged 13 (s.d., 5) pm01 m-' h-' in spring and 32 (s.d., 12) pm01 m-' h-' in fall. The observed rates of NH,+ release suggest that 10 to 50 % of the NH,+ flux from the sediment was due to rapid nitrogen remineralization at the sediment-water interface. 'SNH,+ produced near the sediment-water interface was partitioned between sediment pore waters and exchange sites on sediment solids in ratios (by atoms) of less than '/l. Rate constants (% h-', base e) for the decomposition of the labelled organic-N were 0.075 (s.d., 0.030) in spring and 0.14 (s.d.. 0.05) in fall. These rates suggest that the 'half-life' of organic nitrogen at the surface of coastal marine sediments is in the order of 1 to 2 mo in spring and of 2 to 3 wk in fall. INTRODUCTION As is well known, at least qualitatively, the fertility of the sea is maintained by recycling of essential nut- rient elements. Recent estimates of the global inven- tories and flows of nitrogen - the element most often singled out as limiting primary production in marine ecosystems (Ryther and Dunstan, 1971; Goldman et al., 1973; Thayer, 1974; Smayda, 1974) - show that river- flow, rainfall, and marine nitrogen fixation supply less than 10 % of the nitrogen needed to support annual rates of primary production in the World Ocean (Soder- lund and Svensson, 1976; Delwiche, 1977). The infer- ence follows that the deficit must be met by a flux of recycled, i.e. remineralized, nitrogen to the euphotic zone of the sea. Present address: Oregon State University, Marine Science Center, Newport, Oregon 97365, USA O Inter-Research/Printed in F. R. Germany In the deep sea the decomposition of organic matter and remineralization of nutrients goes nearly to com- pletion in the water column (Riley, 1951; Rittenberg et al., 1955; Bender et al., 1977).Unlike offshore systems, a significant portion of the organic matter formed in, or imported to, coastal waters settles out of the water column before pelagic decomposition proceeds very far. This contention is supported by relatively high organic content of nearshore sediments and by the high rates of metabolic activity (as determined by rates of oxygen consumption) reported for coastal marine sediments (e.g. Teal and Kanwisher, 1961; Cary, 1967; Pamatmat, 1971a, b; Smith et al., 1972, 1973; Nixon et al., 1976). Nixon (1981) described a linear relationship between the amount of organic matter produced in, or imported to, these systems and the amount of organic matter respired in the benthos. His regression suggests that 25 to 50 % of the organic matter entering these systems is consumed in the sediments.
Transcript of tracer study of the short-term fate of particulate organic ... · 15N tracer study of the...

Vol. 16: 89-104, 1984 MARINE ECOLOGY - PROGRESS SERIES Mar. Ecol. Prog. Ser.
Published February 29
15N tracer study of the short-term fate of particulate organic nitrogen at the surface of
coastal marine sediments
Jonathan H. Garber*
Graduate School of Oceanography. University of Rhode Island, Kingston, Rhode Island 02881. USA
ABSTRACT: I5N tracer experiments were conducted to examine the fate of particulate organic nitrogen at the surface of an intact silty sediment community from Narragansett Bay, R.I. (USA). I5N-labelled particulate organic matter (POM, 82.5 atom % I5N excess), obtained from cultured marine diatoms (Skeletonema costaturn), was applied to the surface of 10 to 12 cm deep sediment cores and the time course distribution of the tracer was determined in inorganic-N and organic-N compartments in sediment and free water. Tracer experiments were conducted in spring (8OC) and fall (16OC). Small amounts of tracer-N were recovered in all sediment and free water compartments after 1.5 d in spring and after 6 h in fall. The initial rates of transport of the tracer downward into the sediment, based on the depth distribution of I5N in cores incubated for less than 2 d, appeared to be anomalously high. Subsequent downward mixing of the tracer in particulate and dissolved forms gave estimates of the sediment vertical mixing coefficient (D,) of 3 to 5 X 1OP6 cm2 S-'. Net release of NH,+ from the cores was suppressed for about 24 h following application of labelled-POM to the sediment surface. This was probably caused by immobilization of nitrogen in a rapidly growing microbial population at the sediment surface. Subsequently, the net rates of 15NH,+ production in the cores averaged 13 (s.d., 5) pm01 m-' h-' in spring and 32 (s.d., 12) pm01 m-' h- ' in fall. The observed rates of NH,+ release suggest that 10 to 50 % of the NH,+ flux from the sediment was due to rapid nitrogen remineralization at the sediment-water interface. 'SNH,+ produced near the sediment-water interface was partitioned between sediment pore waters and exchange sites on sediment solids in ratios (by atoms) of less than ' / l . Rate constants (% h-', base e) for the decomposition of the labelled organic-N were 0.075 (s.d., 0.030) in spring and 0.14 (s.d.. 0.05) in fall. These rates suggest that the 'half-life' of organic nitrogen at the surface of coastal marine sediments is in the order of 1 to 2 mo in spring and of 2 to 3 wk in fall.
INTRODUCTION
As is well known, at least qualitatively, the fertility of the sea is maintained by recycling of essential nut- rient elements. Recent estimates of the global inven- tories and flows of nitrogen - the element most often singled out as limiting primary production in marine ecosystems (Ryther and Dunstan, 1971; Goldman et al., 1973; Thayer, 1974; Smayda, 1974) - show that river- flow, rainfall, and marine nitrogen fixation supply less than 10 % of the nitrogen needed to support annual rates of primary production in the World Ocean (Soder- lund and Svensson, 1976; Delwiche, 1977). The infer- ence follows that the deficit must be met by a flux of recycled, i.e. remineralized, nitrogen to the euphotic zone of the sea.
Present address: Oregon State University, Marine Science Center, Newport, Oregon 97365, USA
O Inter-Research/Printed in F. R. Germany
In the deep sea the decomposition of organic matter and remineralization of nutrients goes nearly to com- pletion in the water column (Riley, 1951; Rittenberg et al., 1955; Bender et al., 1977). Unlike offshore systems, a significant portion of the organic matter formed in, or imported to, coastal waters settles out of the water column before pelagic decomposition proceeds very far. This contention is supported by relatively high organic content of nearshore sediments and by the high rates of metabolic activity (as determined by rates of oxygen consumption) reported for coastal marine sediments (e.g. Teal and Kanwisher, 1961; Cary, 1967; Pamatmat, 1971a, b; Smith et al., 1972, 1973; Nixon et al., 1976). Nixon (1981) described a linear relationship between the amount of organic matter produced in, or imported to, these systems and the amount of organic matter respired in the benthos. His regression suggests that 25 to 50 % of the organic matter entering these systems is consumed in the sediments.

90 Mar. Ecol. Prog. SE
The oxidation of this large amount of organic matter in the nearshore benthos is accompanied by a flux of remineralized nutrients to the overlying water. Recent measurements of the fluxes of nutrients from the sedi- ments to the overlying water have, in fact, shown that this recycling pathway can make significant contribu- tions to the nutrients required to support primary pro- duction in the water column (see reviews by Nixon, 1981; Kemp et al., 1982; Nixon and Pilson, in press).
Thus, the picture emerging in marine ecology today shows that subtidal benthic communities function as integral parts of the coastal system: primary production in the water column depends, in part, on nutrients released by the benthos, and secondary production in benthic communities requires organic matter produced in the overlying water. Quantitative annual budgets for nitrogen production and remineralization have pro- vided valuable insights into the balance between nit- rogen income and outgo in the coastal environment but many questions, particularly about transformations occurring rapidly at the sediment surface, remain: How much of the detrital nitrogen is immediately remineralized at the sediment-water interface? How much is assimilated by the benthos? How much is ultimately lost to the pelagic system through burial or denitrification?
RATIONALE FOR EXPERIMENTAL DESIGN
The purpose of the experiments described here was to determine the short-term fate of particulate organic nitrogen (PON) at the surface of an intact benthic community. My approach was to simulate the deposi- tion of particulate organic matter (POM) on the sedi- ment surface with a spike addition of organic matter labelled with "N.
Type of POM. Material collected in sediment traps deployed near the bottom of the Narragansett Bay (Oviatt and Nixon, 1975) consisted of a mixture of intact phytoplankton cells, fecal pellets and detritus. A substantial portion of this material was believed to be resuspended sediment that cannot be taken as rep- resentative of freshly deposited material. Although it seems likely that a fraction of the phytoplankton crop must be grazed, evidence that zooplankton fecal pel- lets convey most of the detrital organic matter to near- shore sediments is equivocal. The data by Knauer et al. (1979) for a sediment trap deployed at 50 m in Mon- terey Bay (total water depth: 1000 m) show that fecal pellets account for only 10 % or less of the organic matter settling out of the euphotic zone. Studies in meso-scale microcosm tanks (J. Kelley, pers. comm.) have shown that a large fraction of a Skeletonema bloom may settle out of the water column under condi- tions in which the vertical mixing of the water column
appears to be more vigorous than in mid-Narragansett Bay (Nixon et al., 1980). Therefore, I assumed that particulate organic matter derived from dead, intact cells of Skeletonema costatum, the diatom usually associated with winter-spring and fall diatom blooms in Narragansett Bay (Smayda, 1957; Pratt, 1959, 1965; Martin, 1965; Vargo, 1976). represented a reasonable analog for POM freshly deposited on the sediments surface. As a further attempt to add realism, experi- ments were conducted in spring and fall when the fallout of POM from S. costatum blooms would be expected to be high (Vargo, 1976).
Rate of POM deposition. Ideally, the amount of POM added to the cores would correspond to the natural rate of deposition and would contain tracer-N in quantities sufficient to provide a detectable signal when diluted many times with unlabelled nitrogen in the sediments. The second part of this problem was overcome by using POM highly enriched in 15N. A realistic rate of deposition of fresh detritus cannot be determined directly from the sediment trap data of Oviatt and Nixon (1975). However, it is possible to estimate the maximum amount of carbon needed to support observed rates of oxygen consumption in the sedi- ments using the sediment oxygen uptake vs. tempera- ture regression given by Nixon et al. (1976). These calculations, summarized in Table l, suggest that the addition of 'SN-labelled POM corresponding to a rate of deposition of 2 to 2.5 g C m-' would equal the amount of carbon respired in the benthos in 2 to 8 d. Narragansett Bay has been characterized as a plank- ton-based system (Kremer and Nixon, 1978). Therefore the estimate of primary production the water column of 310 g C m-' yr-' (Furnas et al., 1976) sets an upper limit to the quantity of organic matter available to the benthos, this production in the water column could provide a maximum deposition rate of organic matter to the benthos of 1 to 2 g C m-' d-'. Thus, the addition of 2 to 2.5 g C m-= to the sediments represents the amount of deposition that could occur in 1 to 2 d. I concluded that a single addition of POM correspond- ing to a rate of deposition of about 2 g C m-' would not be grossly different from conditions in the field and that the POM derived from cultured Skeletonema cos- tatum would reasonably simulate the nutritional qual- ity of freshly deposited material in the bay.
METHODS
Description of study site
Sediments used in the tracer experiments were taken from a station (41" 35' N 72" 22' W) north of Conanicut Point in mid-Narragansett Bay, Rhode

Garber: Short-term fate of PON in coastal sediments 91
Island, USA. The sediments in this area of the bay are composed of 60 to 70 % silt with about 20 % each of clay and sand (McMaster, 1960; Hale, 1974), and an organic carbon content of about 1 to 2 % of the sedi- ment dry weight (Hale, 1974; Oviatt and Nixon, 1975).
Water depth at the station (6 m) places the sediments below the 1 % isolume for most of the year (Schenck and Davis, 1972). The macrofaunal community is domi- nated by polychaetes (Nepthys incisa, Lumbrinereis fragilis, Mediomastus ambiseta) and small deposit- feeding bivalves Nucula annulata, Yoldia limatula) (Phelps, 1958; Hale, 1974; McCaffrey et al., 1980). Nixon et al. (1976) described the seasonal cycle of benthic metabolism and the fluxes of nutrients from the sediment communities at this site; Oviatt and Nixon (1975) examined the dynamics of sediment resuspension and deposition in the mid-bay region; and McCaffrey et al. (1980) examined the influence of benthic organisms on the fluxes of nutrients and man- ganese from sediments at the Conanicut Point station.
Source of the 15N-labelled POM
Batch cultures of the marine diatom Skeletonema costatum were grown in 15 1 carboys using Guillard's (1963) f/2 medium amended with NaI5NO, (99 atom % I5N, Stohler Isotope Chemicals Inc., Waltham, Ma.). After 2 wk of growth under fluorescent light at 15 OC the concentration of cells exceeded 10%-'. The cul- tures were unialgal but not bacteria-free. The labelled cells were harvested by reverse-flow filtration below a membrane filter (Nuclepore NlOO), concentrated into a pellet by centrifugation (1000 g, 10 min, room tempera- ture), frozen and lyophilized. Carbon and nitrogen content of the lyophilized material was determined by high-temperature combustion (Carlo Erba Model 1100 CHN analyser); phosphorus content was determined by ashing and acid hydrolysis (Andersen, 1976). The elemental composition of the POM on a dry weight basis, 27.4 % C, 3.3 % N, 0.69 % P, gave ratios of nutrients, by atoms, of 102 C : 10.6 N : 1 P. The isotopic composition of nitrogen in the labelled POM, 82.5 4 0.3 atom % excess, was determined by mass spectro- metry using Kjeldahl-Rittenberg procedures (Bremner, 1 9 6 5 ~ ; Fiedler and Proksch, 1975; Garber, 1982).
Experimental
Conditions for the 2 experiments are given in Table 1. Cores of sediment containing 10 to 15 cm of mud with about 1.5 1 of overlying water were taken by SCUBA divers from the bay bottom at the Conanicut Point station. Three rectangular box cores (12.5 X 25.5
Table 1. Expenmental conditions for spring and fall I5N-tracer experiments
Spring Fall
Time of year April 1977 October 1977
Water temperature ("C) 8 + 1 16 f l
Sediment coring device Box core, Round core. and experimental chamber 319 cm2 219 cmZ
Estimated rates of benthic metabolism (gC m-Z d-l)'
0.29 0.80
POM added (g m2) 9.24 11.4 (gC m2) 2.5 3.0 (gN m-2) 0.325 0.395
Number of daily rations of 9 4 carbon added to each core
Incubation time (d) 1.5, 7.3, 17.5 0.25,0.5. 1. 2 , 4
' Based on benthic 0, uptake vs. temperature regression of Nixon et al. (1976). RQ = 1
cm) were taken in spring, 10 round cores (16.6 cm diameter) in fall, 5 of which were treated with labelled POM and 5 were used to determine net flux of NH,+ without POM amendment. The coring devices also served as experimental chambers. Cores were brought to the laboratory and held in flowing bay water at ambient bay water temperature before tracer experi- ments were conducted. Experiments were initiated as follows: the water over the cores was carefully removed and a slurry made by rehydrating an aliquot of the labelled POM with 10 m1 of glass-fiber-filtered (Reeve Angel 934 AH) bay water was spread over the surface of the mud. The cores were rocked back and forth to distribute the labelled material as evenly as possible. This procedure resuspended the top 1 to 2mm of sediment. Glass-fiber filtered bay water was then slowly siphoned onto the cores. The water over the sediment was kept oxygenated and in motion with a stream of air scrubbed through 5 % sulfuric acid and filtered bay water. This treatment had no effect on the pH of the overlying water. The cores were incubated in the dark at ambient bay water temperature. Single cores were sacrificed according to the schedule given in Table 1. In spring the overlying water was replaced with fresh, glass-fiber-filtered bay water on the 4th and 9th days of incubation. The amounts and isotopic com- positions of nitrogen in the water removed during the replacements were determined and included in the nitrogen inventories and tracer'budgets.
Also in spring, N-remineralization in bay water alone was examined by allowing 0.300 g samples of lyophilized Skeletonema POM to decompose in 3 bot- tles, each containing 1 1 of aerated, glass-fiber-filtered bay water. The entire contents of 1 bottle were sam-
92 Mar Ecol. Prog. Ser. 16: 89-104, 1984
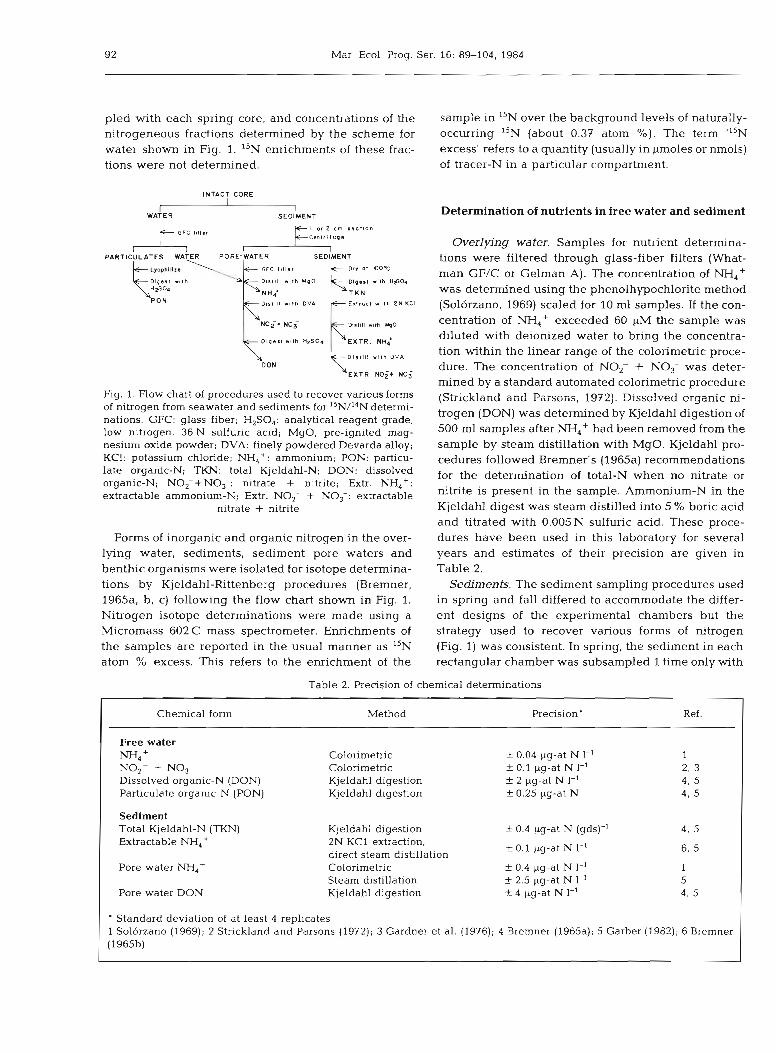
pled with each spring core, and concentrations of the sample in 15N over the background levels of naturally- nitrogeneous fractions determined by the scheme for occurring 15N (about 0.37 atom %). The term "'N water shown in Fig. 1. 15N enrichments of these frac- excess' refers to a quantity (usually in pmoles or nmols) tions were not determined. of tracer-N in a particular compartment.
WATER SEDI,MENT , l ,,@, , " ''m " " W "
C e n t r l l u q n
PARTICULATES WAYER PORE-WATER SEDIMENT
D l q r l l w i t h He01
T K N D n l l # l l "4th OVA E x t r a c t r l t h 2 N KC1
h DON
Fig. i. Flow chart of procedures used to recover various foms of nitrogen from seawater and sediments for l5N/l4N determi- nations. GFC: glass fiber; H,SO,: analytical reagent grade. low nitrogen, 3 6 N sulfuric acid; MgO, pre-ignited mag- nesium oxide powder; DVA: finely powdered Devarda alloy;
Determination of nutrients in free water and sediment
Overlyi'ng water. Samples for nutrient determina- tions were filtered through glass-fiber filters (What- man GF/C or Gelman A). The concentration of NH,+ was determined using the phenolhypochlorite method (Solorzano. 1969) scaled for 10 m1 samples. If the con- centration of NH4+ exceeded 60 pM the sample was diluted with deionized water to bring the concentra- tion within the linear range of the colorimetric proce- dure. The concentration of NO, + NO, was deter- mined by a standard automated colorimetric procedure (Stiickland and Parsons, 19721. Dissolved organic ni- trogen (DON) was determined by Kjeldahl digestion of 500 m1 samples after NH4+ had been removed from the sample by steam distillation with MgO. Kjeldahl pro-
KCl: potassium chloride; NH,+: ammonium; PON: particu- cedures followed Bremner's (1965a) recommendations late organic-N; TKN: total Kjeldahl-N; DON: dissolved for the determination of total-N when no nitrate or organic-N; NOC+NO;: nitrate + nitrite; Extr. NH,+: extractable Extr, NO,- + NO,-: nitrite is present in the sample. Ammonium-N in the
- a
nitrate + nitrite
Forms of inorganic and organic nitrogen in the over- lying water, sediments, sediment pore waters and benthic organisms were isolated for isotope determina- tions by Kjeldahl-Rittenberg procedures (Bremner, 1965a. b, c) following the flow chart shown in Fig. 1. Nitrogen isotope determinations were made using a Micromass 602 C mass spectrometer. Enrichments of the samples are reported in the usual manner as "N atom % excess. This refers to the enrichment of the
Kjeldahl digest was steam distilled into 5 % boric acid and titrated with 0.005 N sulfuric acid. These proce- dures have been used in this laboratory for several years and estimates of their precision are given in Table 2. Sediments. The sediment sampling procedures used
in spring and fall differed to accommodate the differ- ent designs of the experimental chambers but the strategy used to recover various forms of nitrogen (Fig. 1) was consistent. In spring, the sediment in each rectangular chamber was subsampled 1 time only with
Table 2. Precision of chemical determinations
Chemical form Method Precision' Ref.
Free water NH.4 • Colonmetric f 0.04 pg-at N I-' NO,- + No3- Calorimetric f 0.1 pg-at N I-' Dissolved organic-N (DON) Kjeldahl digestion f 2 pg-at N 1-' Particulate organic-N (PON) Kjeldahl digestion t 0.25 pg-at N
Sediment Total Kjeldahl-N (TKN) Extractable NH,'
Pore water NH,*
Pore water DON
Kjeldahl digestion f 0.4 pg-at N (gds)-I 2N KC1 extraction,
f 0.1 pg-at N 1-' direct steam distillation Colorimetric f 0.4 pg-at N 1-' Steam distillation f 2.5 pg-at N 1-' Kjeldahl digestion k 4 ~ g - a t N 1-'
Standard deviation of at least 4 replicates 1 Sol6rzano (1969); 2 Strickland and Parsons (1972); 3 Gardner et al. (1976); 4 Bremner (1965a); 5 Garber (1982); 6 Brernner (1965b)

Garber: Short-term fate of PON in coastal sediments 93
3 acrylic plastic tubes (76 mm diameter). Each subcore was then extruded in air and sectioned at 1 or 2 cm intervals. The water content (% H,O, by weight) of the sediment was determined by drying sections from 1 subcore at 100°C. The sections from the other 2 cores were transferred to 250 m1 polyethylene centrifuge bottles and centrifuged (3500 g for 20 min at 8 "C). This procedure removed about 40 % of the pore water from each section. The samples of pore water were filtered (Gelman A) and the concentration of NH,+ immedi- ately determined using Solorzano's (1969) procedure as described above. The remaining pore water samples from identical sections of the 2 subcores were com- bined and frozen for subsequent separation of NH,' and DON. The pellets of semi-dry sediment were transferred to glass jars, dried at 100°C, ground to pass a 40 mesh (250 pm opening) screen and stored, tightly- stoppered, at room temperature. It was not necessary to subcore the sediments in the fall since the entire core could be extruded from the core liner and sliced at 1 cm intervals. The water content of each section was determined by drying a 5 to 10 g subsample at 100°C. The rest of the sediment from each section was cen- trifuged, dried, ground, and stored as described above.
The methods used to recover nitrogen from various fractions in the sediment and the preparation of the samples for mass spectrometry were based on Kjel- dahl-Rittenberg procedures given in Bremner (1965a, b, c). The fractions are defined as follows:
Total Kjeldahl-N (TKN): nitrogen returned from dried sediment using a standard semi-micro Kjeldahl digestion procedure. This fraction would be expected to include most forms of organic-N in the sediment, extractable M,+, and the dissolved NH,' and DON remaining in the sediment after centrifugation. The procedure does not give quantitative recovery of NO2-, NO3-, or fixed NH,+.
Pore water NH,+: NH,' dissolved in the interstitial water. Pore water samples were pressed from the sedi- ments by centrifugation in air. NH,' was recovered by steam distillation with MgO.
Pore water DON: organic forms of nitrogen dissolved in the sediment pore water. Pore water NH,+ was first stripped from the sample, then DON was converted to NH,+ by Kjeldahl digestion.
Extractable M,+: NH,+ recovered by extraction of 10 g samples of the centrifuged, dried, ground sedi- ment with 50 ml of 2 N KC1 for 1 h at room tempera- ture. The NH,' released into the KC1 solution was then steam distilled into boric acid using MgO. This fraction would be expected to include NH,+ reversibly sorbed onto sediment particles ('exchangeable NH, + ') and the pore water NH,+ remaining in the sediment following the centrifugation step.
Extractable NO,- + NO,-: NO2- and N O , in the 2 N
KC1 extracts prepared as described above. These forms were converted to NH,+ using Devarda alloy after extractable NH,+ had been stripped from the extract by steam distillation.
Macrofauna-N: organic N in the tissues of benthic organisms recovered using standard Kjeldahl diges- tion procedures.
In addition to the forms given above, M,+ in the sediment may be non-reversibly bound to clay parti- cles, and NO2- + NO3- may be dissolved in pore waters. 'Fixed' or 'non-exchangeable' NH,' may make significant contributions to the nitrogen inventories in marine sediments (Stevenson and Tilo, 1966; Rosen- feld, 1979). It seemed unlikely that significant enrich- ment of this compartment would occur during the short duration of the experiments and therefore fixed NH,+ was not determined. Tests for the presence of NO2- + NO,- in pore water by conversion of these forms to NH,+ with Devarda alloy were consistently negative.
Calculation of N inventories and budgets
Concentrations of nitrogen in particulate forms (TKN and extractable-N) were based on analyses of known weights of dried sediments. Concentrations of dissol- ved NH,+ and DON were based on known volumes of sediment pore waters. To compute the inventories of N in each of these compartments (and to make direct comparisons of the relative contributions of each of the fractions to the total standing stock of nitrogen in the sediment) the concentration data were transformed to volume-based units, N, = kg-at N cm-3 wet sediment. The equation used to transform the weight-based data was:
N, = NW (I-% H 2 0 ) p (1)
where NW = concentration of fraction N in kg-at N g-' dry sediment; H,O = water fraction (by weight) of the wet sediment; p = bulk density of wet sediment in g cm-3, which was calculated for each sediment frac- tion as 2.5/(1 + 1.5 % H,O). Similarly, the equations used for the transformation of the volume-based con- centration data were of the form:
where N, = concentration of dissolved fraction N in kg-at N I-'; the other terms were as defined above. Characteristics of the sediments from mid-Narragan- sett Bay, expressed in these units, are given in Table 3.
'15N inventory' refers to the volume-based concen- tration of I5N excess in any of the free water and sediment fractions. I5N inventories for sediment frac- tions were calculated by multiplying the volume- based concentration of N in the fraction (total atoms of

94 Mar. Ecol. Prog. Ser. 16: 8S104, 1984
Table 3. Average characteristics and nitrogen inventories in sediment cores from mid-Narragansett Bay. All nitrogen determina- tions are reported as pg-at N cm-3 wet sediment. Table entries: 2 f S. D.
Spring Fall Fielda Experimentalb FieldC Experimentald
Water content (%) 47 f 7 - 41 f 2 40 t 6 Bulk density (g cm-3) 1.47 f 0.09 - 1.55 2 0.03 1.55 -C 0.04 Total Kjeldahl-N 114 f 7 113 t IS 122 f 13 104 t 10 Extractable NH, + 0.03 f 0.23 0.93 -t 0.19 - - Extractable NO,- + NO3- 0.05 f 0.1 - - - Pore-water NH,+ 0.08 0.04 0.17 t 0.04 0.04 f 0.01 0.07 -t 0.02 Pore-water DON 0.08 + 0.05 0.08 + 0.04 - 0.03 + 0.01 Pore-water NO,- + NO3- < 0.01 - - -
a 2 cores, 6 depth intervals (0 to 10 cm); 3 cores, 6 depth intervals (0 to 10 cm); 1 core, 18 depth intervals (0 to 18 cm); 5 cores, 12 depth intervals (0 to 12 cm)
N cm-3) by their enrichments (atoms 15N/100 atoms N). The sediment "N inventories were then multiplied by the volume of sediment in each I or 2 cm thick layer and these amounts of N were summed to give the total N inventory for each fraction in each core. 15N inven- tories in the free water fractions were calculated by multiplying the concentrations of nitrogen in each fraction by the appropriate enrichment and then by the volume of overlying water over the core at time of sampling.
RESULTS
The tracer budget for spring experiments shows that measurable amounts of the tracer could be recovered from all sediment and overlying water compartments
after 1.5 d of incubation at 8OC (Table 4). In general, net transfers of tracer atoms from "N-labelled POM into :he various compaAments took p!ace most rapid.1.y during the first week of the experiment. Tracer budgets for the fall series of cores, also given in Table 4, revealed similar distributions of the tracer. However, the more closely-timed sampling intervals adopted in fall revealed that the release of 15N labelled DON took place during the first 6 h of incubation. A substantial release of DON probably occurred when the freeze- dried POM was rehydrated (Garber, in press). While the net transfer of tracer into the sediment pore-water NH,' compartment proceeded linearly for 2 d (r =
0.93) at a rate of about 0.022 percent h-', the net flux of 15NH4+ across the sediment-water interface reversed after 6 h and recommenced by the second day. The
Table 4. Recovery of 15N excess in free water and sediment compartments following the application of 15N-labelled PON to the surface of sediment cores. Entries are given as the percent of I5N excess (% of spike) added to each core
Spring; 8°C; % of spike Fall; 16°C; % of spike
Core S-l Core S-2 Core S-3 Core F-l Core F-2 Core F-3 Core F-4 Core F-5 1.5 d 7.3 d 17.5 d 6 h 12 h l d 2 d 4 d
Free water compartments PON 7.3 0.9 1.8 - - - DON 8.7 4.4 5.7 9.0 - 7.0 7.2 4.8 NH,+ 1.8 15 17 0.4 0.0 - 3.9 8.9
Sediment compartments TKN 0-1 cm 2 6 24 18 62 59 51 60 53 Below 1 cm 2.3 9.9 63 5.8 1.3 5.8 5.0 6.7
Extractable NH,' 0.6 1. l 0.7 - - -
Pore water DON (0-1 cm) 0.1 0.1 0.0 - - - - NH,+ 0.6 2.0 1.5 0.6 1 .O 0.8 2.1 2.5
Macrofauna ' 0.3 1.4 3.3 0.0 0.1 0.2 0.3 0.6 Total recovered 48 59 54 78 61 65 78 7 6
- Not determined Estimated from enrichment of selected individuals (see text)

Garber: Short-term fate of PON in coastal sediments 95
Table 5. Concentrations and enrichments of nitrogen in the free water over sediment cores following the application of lSN-labelled POM to the sediment surface
PON DON NH,+ NO,- + NO3-
Free water sample Incubat~on FM % "N FM Sbl"N PM % I5N pM % IsN period excess excess excess excess
Free water initials, 0.0 Nat. 13.4 Nat. 0.83 Nat. 0.2 Nat. spring cores Core S-l 0 - 1 . 5 d 44.2 35.23 69.9 26.68 36.9 10.20 0.5 - Core S-2 0 - 3.7 d 11.0 14.68 45.3 16.65 159 12.63 1.3 -
3.7- 7.4 d 12.3 3.23 46.4 5.48 203 7.50 3.6 - Core S-3 0 - 3.7 d 14.5 21.51 45.8 23.15 113 15.92 1.2 -
3.7- 9.4 d 15.7 2.94 46.4 5.24 196 7.92 1.2 - 9.4-17.5 d 28.7 3.20 49.8 2.80 213 3.96 4.2 -
Free water initials, - 11.9 Nat. 1.42 Nat. 2.06 Nat. fall cores Core F-l 0- 6 h - 60.7 46.3 5.41 22.95 0.20 - Core F-2 0-12 h - - 59.2 - 0.00 - 0.00 - Core F-3 0-24 h - - 58.2 34.4 0.81 - 0.15 - Core F 4 0 4 8 h - 52.2 37.0 31.05 33.40 0.00 - Core F-5 0-96 h - 37.5 26.2 111.6 22.6 2.39 -
Nat. Natural abundance of I5N, assumed to b e 0.37 atom % I5N, or 0.00 % I5N excess - Not determined
reversal of net DIN flux between 6 h and 24 h in fall was also recorded in measurements of total (i.e. label- led plus unlabelled) NH4+ and NO2- and NO,- (Table
5). Distributions of 15N in particulate and dissolved ni-
trogen fractions in the sediment are shown in the series of depth profiles in Fig. 2 and 3. As expected, the largest inventories of 15N were found in the TKN frac- tion in the 0 to 1 cm layer of sediment (Fig. 2a and 3a). However, the initial enrichment of this fraction, about 0.5 and 1.5 atom % lSN excess for Experiments 1 and 2, respectively, was considerably less than the value expected if the total amount of I5N in the labelled POM had been uniformly mixed into the top layer of sedi- ment. The problem of the missing 15N will be addres- sed later. Here it suffices to point out that one half to two thirds of the tracer atoms added to the cores were not found in the topmost layer of sediment. These deficits carried through the tracer budgets, and are reflected in the totals given in Table 4.
DISCUSSION
Conceptual models of nitrogen dynamics in sediment- water systems are always complex. At any point in the system - and depending on the valence state of the atoms involved and the surrounding redox regime - nitrogen atoms may be (1) assimilated into living biomass, (2) remineralized as NH,', (3) oxidized to NO2- or NO3-, (4) reduced to N,O, NH20H, NH4+ or N2. In addition to these biological transformations, parti-
cle-bound forms may be physically mixed downward into the sediment; dissolved forms may diffuse in any direction along concentration gradients and take part in exchange reactions with mineral phases in the sedi- ment. In the subtidal benthos, this web of chemical and physical processes ultimately depends on organic mat- ter deposited at the sediment surface. The experiments described here examined the processes affecting the fate of freshly-deposited organic nitrogen. The validity of the experiments rests on the assumption that the 15N-labelled PON represented a reasonable analog of detrital material reaching the nearshore benthos. The arguments for this assumption were given earlier. My contention here is that the movement of the I5N tracer from the labelled POM into the overlying water and sediment compartments provided direct evidence that the processes determining the fate of detrital nitrogen include (1) the release of soluble organic-N com- pounds, (2) remineralization of organic-N as NH,', (3) fluxes of remineralized NH4+ upward into the water and downward into the sediment, (4) downward con- veyance of particle-bound nitrogen , (5) exchange reactions with sediment particulates, and (6) uptake of some fraction of the detrital-N by benthic fauna.
Release of DON
About 9 % of the labelled PON initially added to the cores appeared in the free water DON compartment immediately after the slurry of Skeletonema costatum cells was added to the cores (Table 4). Release of DON

Mar. Ecol. Prog. Ser. 16: 89-104, 1984
a SEDIMENT T K N FRACTION - SPRING
1.5 OAYS 7.3 OAYS 17.5 OAYS 1.5 DAYS 7.3 DAYS 17.5 DAYS
CONCENTRATION. p M 100 200 300 100 ZOO 300 100 ZOO 300 CONCENTRATION, p g - a t T K N I g d r y s e d i m e n t
- ENRICHMENT , log Atom % 'IN excess L L
U E N R I C H M E N T , l o g A t o m *h "N excess
6 - W I N V E N T O R Y , n m01 "N excess / cm3
C PORE WATER DON FRACTION - SPRING d EXTRACTABLE N H ~ + FRACTION - SPRING
1.5 DAYS 7.3 DAYS 17.5 DAYS 1.5 DAYS 7.3 DAYS 17.5 DAYS
CONC. , p rnol Ext r . NH: I g dry sediment CONCENTRATION, ,K M lly73y l 2 7 l Z0,o
2
6
8
E ENRICHMENT. Atom % "N excess
E N R I C H M E N T . A t o m % ' 5 ~ excess
't X l0 l- a
t INVENTORY, n rnol 1 5 ~ excess
W
t !OL L L
l- a I N V E N T O R Y , n rno l 1 5 ~ excess / cm3
10
Fig. 2. Spring experiment: profi les of nitrogen concentrations, 15N enrichments, and 15N i n v e n t o r i e s in s e d i m e n t TKN (a), pore water NH,' (b), pore water DON (c), and extractable NH,+ (d), at various times after cores were treated with lSN-labelled PON

Garber: Short-term fate of PON in coastal sediments 97
Q S E D I M E N T T K N F R A C T I O N - F A L L
6 h 12 h 24 h 48 h 96 h
C O N C E N T R A T I O N , p p - o t T K N l g d r y sed iment
E N R I C H M E N T . 109 Atom % ' 5 ~ excess - 3 -2 - 1 0 - 3 - 2 - 1 0 - 3 2 - 1 0 3 -2 - I 0 -3 - 2 - 1 0
W I N V E N T O R Y , pm01 15N excess / c m 3
b P O R E W A T E R N H ~ F R A C T I O N - F A L L
6 h 12 h 24 h 48 h 96 h
C O N C E N T R A T I O N . pM
E N R I C H M E N T . lop A t o m % excess 5 - 2 - 1 0 I - 2 - I 0 , . * . I 0 I . ? . , 0 1 - 2 . 1 0 , !.;yVFK 2 I ' O r
L 1 2 L
W I N V E N T O R Y . n m o l 15N excess / cm3
Fig. 3. Fall experiment: profiles of nitrogen concentrations, "N enrichment5 and I5N inventories in sediment TKN (a), and porewater NH,+ (b), at various times after cores were treated with I5N-labelled PON
also occurred when the labelled cells were allowed to decompose in seawater alone (Fig. 4) . The release of DON from lyophilized plankton has been reported in other studies of plankton decomposition (Otsuki and Hanya, 1972; Rajendran, 1978; Garber, in press). Otsuki and Hanya (1972) suggested that the freeze- drying process was responsible for the initial release of
D A Y S
soluble cellular components. On the other hand, Gol- terman (1960) had shown that water soluble forms of organic-N were released when plankton cells die and lyse under a variety of conditions. While lyophilization may have been the least destructive means to kill and preserve the labelled S. costatum cells, the initial release of large amounts of DON was probably an artifact of this pre-treatment. Nevertheless, the subse- quent fate of the labelled-DON shows that a large fraction, perhaps as much as 50 %, of these compounds were reactive in the sediment-water system Table 4).
After the initial release of DON, the concentration of DON in the free water decreased for about 4 d and then, in spring, increased slowly (Fig. 5). In each core the 15N enrichment of the DON compartment decreased with time (Table 5 ) . However, the nearly constant concentration of DON suggests that the disap- pearance of labelled DON was balanced by a nearly equivalent amount of unlabelled DON.
Rates of N remineralization
Fig. 4. Dynamics of the aerobic decomposition of I5N-labelled In both experiments the primary form of Skeletonema costaturn cells in glass-fiber-filtered Narragan- remineral ized-~ released from the labelled POM was sett Bay water, 8 "C. Initial amount of PON (0.73 mg-at N), identical to that added to sediment cores, was suspended in NH,+ (Table 5). Although the sediments taken in
11 of bay water, circles: PON; squares: DON; triangles: spring exhibited small positive net releases of NO,- + NH,'; crosses: NO,- + NO, NO,- to the overlying water (l to 2 km01 m-2 h-'), nearly

98 Mar. Ecol. Prog. Ser. 16: 89--104, 1984
all of the cores taken in fall exhibited net uptakes of NO2- + No3- (Table 5). In fall, the net release of NH,+ began after a lag of about 24 h during which NH4+ and NO2- + NO,- were removed from the overlying water. This uptake of inorganic-N may have been due to the temporary immobilization of nitrogen in an actively growing population of microbial decomposers. If so, the microbial community at the sediment surface may be remarkably sensitive to the 'quality' of the available organic matter and its activities may determine the direction of nutrient exchanges between sediment and free water. This does not necessarily imply that the same microbial species may take u p or release NH4+, NO2- and NO,- depending on the 'quality' of organic matter, but rather that uptake may be due to the domi- nance of metabolic types different than those respon- sible for net release.
Net rates of I5NH4+ production (Table 6) were calcu- lated by dividing the total amount of 15Nh',+ recovered in each core (free water 15NH4+ + pore water 15NH,+ + exchangeable 15NH,+) by the surface area of sedi- ment in the core and by the duration of incubation. The net rates averaged 13 (S. d. 5) km01 NH4+ m-2 h-' in spring and 32 (S. d. 12) p 0 1 NH,+ m-' h-2 h-' in fall. The calculated net rates of NH4+ production do not account for the cycling of I5NH4+ through the mi- crobiota and meiofauna and therefore underestimate the instantaneous rates of nitrogen remineralization in the cores (Barsdate et al., 1974; Blackburn, 1979). How- ever, I believe these rates do reflect the net rates of NH,+ production from the labelled POM in the sedi- ment-water system, and therefore give an indication of the net rate of N-remineralization in an intact benthic system.
If the remineralization of organic-N is assumed to proceed as a first order reaction then the half-lives for organic-N at the sediment surface, based on the net rates of 15NH4 + production in the cores, are in the order
of 1 to 2 mo in spring and 2 to 3 wk in fall (Table 6). Even if the remineralizatlon of the organic-N depo- sited on the sediments were to proceed throughout the entire year at the slower rate found in spring (0.075 % d-l), 99 % of the organic-N would be remineralized in less than 9 mo. These results are consistent with Nixon's (1981) calculations that suggested that only about 1.5 % of the primary production of nitrogen in the surface waters of Narragansett Bay is buried in the sediments annually, and Eadie and Jeffrey's (1973) estimate, based on carbon isotope ratios, that 5 % or less of oceanic POM reaches the deep sea benthos.
Rates of release of total NH,+ to the free water over the sediment cores are also given in Table 6. The isotopic composition of the original labelled POM was 82.5 atom % 15N excess. Therefore 1.21 (= 100 - 82.5) moles of total-N were transferred from one compart- ment to another for each mole of labelled-N recovered in the compartment receiving the transfer. Thus, only 10 to 22 % of the net flux of total NH,+ to the overlying water in the spring could be attributed to the decom- position of the labelled POM. The transient depression in the flux of NH4+ from the sediments in fall makes similar calculations difficult. However, the net flux of NH,+ from sediments in the additional suite of 5 unamended cores was 113 k 61 p 0 1 m-2 h-' (mean f SD). If this rate of ammonia flux is assumed as a background in the treated cores then the rates of decomposition of the fresh POM at the sediment sur- face could have been responsible for about 35 % (range 16 to 54 %) of the flux of NH,' associated with these sediments in the fall. These results are consistent with the view that the total flux of remineralized nut- rients from subtidal sediments comprises at least 2 components: one originates from the rapid decomposi- tion of freshly deposited material and the other from the, perhaps slower, decomposition of previously deposited material. This results, it seems, in the 'burn-
Table 6. Net rate of production of I5NH,+ and calculated rate constants for the decomposition of 'SN-labelled POM in coastal marine sediment-water systems
Temp. Core Net change Net rate of I5NH,+ Rate constants for N Half life for fresh ?c) in total free production remineralization (% h-') organic-N In the
water NH,' (pm01 m-2 h-') Linear model Exponential sediment-water (pm01 m-2 h-') (zero order) model, base e system (d)
(1st order)
8 S-l 8 1 13.6 0.073 0.074 39 S 2 140 17.8 0.096 0.105 27 S-3 84 7.8 0.042 0.046 62
16 F- l 46 50.2 0.22 0.22 13 F-2 -7.8 32.4 0.14 0.14 20 F-3 0.1 15.1 0.066 0.067 43 F 4 4 6 35.6 0.16 0.16 18 F-5 83 29.7 0.13 0.14 20

Garber Short-term fate of PON in coastal sediments 99
ing off' of the organic input at a rate that assures that all but a few percent of the organic-N reaching the sediment will be remineralized within a year's time.
Most in vitro studies of plankton decomposition report that some fraction of the organic-N is initially present as, or is converted to, refractory organic com- pounds similar to humic substances in soils (Otsuki and Hanya, 1972). It appears that only a very small fraction of the PON landing on the sediment surface is fated to be converted into refractory substances.
Downward transport of labelled-N
Downward transport of lSN-labelled particulate mat- ter could only be effected by the feeding and burrow- ing activities of the benthic fauna (bioturbation) whereas labelled ammonium ions could move down- ward by Fickian diffusion and by advective exchange of pore water driven by the benthic fauna ('biopump- ing'). Several investigators have used dissolved and particulate radio-tracers to estimate rates of sediment mixing (Aller and Cochran, 1976; Ludke and Bender, 1979; Santschi et al., 1979) and biopumping (Ludke and Bender, 1979). Nitrogen is not an ideal tracer to use for these purposes because it is non-conservative in the sediment system. Denitrification, for example, can lead to the loss of label from the system while ammonification and immobilization can bring about exchanges of tracer between the particulate and dis- solved pools both at the sediment-water interface and deeper in the sediment column. Nevertheless, progres- sions toward log-linear distributions of excess 15N were observed in both the sediment TKN and pore- water compartments. I suggest the the depth profiles of 15N in the sediment TKN fraction (corrected for residual pore water 15NH,+) reflect the downward transport of nitrogen associated with particulate phases in the sediment and that the distribution of 15N in the pore water NH4+ pool reflects the downward transport of '5NH4+ formed at the sediment-water in- terface.
Assuming that (1) the sediment-water interface rep- resents a plane source of labelled POM, (2) the sedi- ment below the interface is a uniform (isotropic) diffu- sive medium, (3) the sediment mixing coefficient (D,) is constant at all depths in the sediment, and (4) par- ticulate matter can only be mixed downwards, the depth distribution of tracer in the TKN fraction can be described by the equation given by Crank (1975) for diffusion from a plane source in a semi-infinite cy- linder:
In C = ln[M/(Dmt)1'2] - (z2/4D,t) (1)
where C = concentration of lSN (pg-at 15N cm4) at time t and depth z (measured positively downward from the
H O U R S H O U R S
Fig. 5. Dynamics of net release and uptake of total and 15N- labelled DON (circles) and NH,+ (triangles) to the free water over sediment cores treated with 15N-labelled PON. Note difference in time scales for spring experiment (Panels a and
c) and fall experiment (Panels b and d)
sediment-water interface). By further assuming that (1) the rate of production of labelled ammonium is con- stant at the sediment-water interface (thus giving a plane source of ammonium at z = O), (2) ammonium can diffuse both upwards (into the free water) and down- wards (into the sediment pore water) and (3) the 'diffu- sion' constant for ammonium (D,) is constant at all depths in the sediment, an equation for the distribution of labelled ammonium can be derived that differs from (1) only by a factor of 1/2 in the first term:
D, and D, can then be estimated from the slope of plots of In C vs zZ, z taken as the midpoint of each sediment section. The coefficients D, and D, were calculated from the predictive least squares linear regression slopes for the linear portions of plots such as those shown in Fig. 6.
The calculated coefficients ranged over 4 orders of magnitude (Table 7) and the value of the coefficients generally decreases as the length of incubation of the cores increased. D, values calculated for cores incu- bated for longer than 1 d showed the best agreement with values determined in other studies (Table 8). These results suggest that either the procedures used to calculate D, and D, were not appropriate for short incubation periods or the initial rates of downard mix- ing of tracer are very much higher than would be predicted based on the results of the longer-term experiments. On the one hand, sediment displacement by the benthic fauna would be most intense near the surface of the core. This could result in rapid convey- ance of particulate material to a depth of 1 or 2 cm after which downward mixing would take place more slowly. This interpretation is consistent with inventory

100 Mar. Ecol. Prog. Ser. 16: 89-104, 1984
C O R E 5-3 C O R E F - 5
days) duration. The values of D, and D, calculated for the cores incubated for 2 d or more converged on 2 to 5 X 10d cm2 S - ' . These sediment mixing coefficients are somewhat higher, but roughly comparable, with the rates reported by other workers (Table 8).
L - L
Fig. 6. Examples of plots of In C vs Z2, where C = inventory of 15N in sediment TKN (circles) and pore water NH,' (trian-
gles); Z = mid-point of each sediment section
- C1 t b
data (Table 4). Had the tracer in particulate matter been mixed downward by a process that, on short time scales, was truly analogous to Fickian diffusion, then the inventories of 15N in the TKN fraction below 1 cm would have increased in a regular fashion as the period of incubation increased. Instead, a small frac- tion of the tracer, amounting to 2 to 5 % of the labelled POM added to the cores, was rapidly conveyed below 1 cm. The possibility that this initial transport of tracer results from the handling of the cores seems remote because great care was taken to avoid cross-contami- nation of the sediment sections. The values of D, and D, in Table 7 suggest that the assumption that the rate of sediment reworking is constant for the entire sedi- ment column is not correct and that the problems stemming from that assumption are particularly troublesome for experiments of short (less than several
6
N cm-3 (1 to 1.4 pg-at N g-' dry sediment). The isotopic composition of the exchangeable M,+ fraction was then estimated by assuming that the 60 % of the label- led NH4+ dissolved in the sediment pore water remained in the centrifuged sediment. The 15N atom % excess in the exchangeable NH,' fraction (R,,) is then
R,, = (R, . N,,,) - 0.6 15N,,/N,,, (3)
1 - \
l
NH,+ exchange dynamics
The amount of ammonium reversibly adsorbed onto particulate matter in the sediment was estimated by assuming that centrifugation removed 40 % of the sedi-
0 - ment pore water. The inventories of extractable-NH,+ \ were then corrected for the amount of pore water NH4+
- I I I I I I I I I I I remaining in the sediment. The calculated concentra- 0 10 20 0 10 20
-,2 7 2 tions of exchangeable NH4+ ranged from 0.5-1.2 pg-at
- B
where R, = 15N atom % excess in the exchangeable NH4+ pool; N,,, = concentration of extractable NH4+ in pm01 cm-3; 15N,, = concentration of excess 15NH,+ in the pore water in pm01 cm-3; N,,, = calculated concentration of exchangeable NH4+ in pm01 cm-3.
Significant enrichments of the exchangeable NH4+ fraction were found only in the topmost layers of sedi- ment (Fig. 2d). Calculated enrichments of the exchangeable NH,+ in the 2 to 4 cm layer were less than 0, that is, the isotopic composition was less than the natural abundance of 15N. Although the apparent depletion of 15N in the tracer experiments may have been caused by discrimination against the heavy
1 - \
l
Table 7. C a l ~ l a t e d coefficients for sediment mixing (D,) and NH,' diffusion (D,) based on the 15N inventories (C) in sediment TKN and pore water NH,+ fractions. Table includes least squares regression slopes and coefficients of determination (rZ) for the
linear portions of plots of 1nC vs. Z2
Core At TKN fraction' Pore water NH4+ fraction X 105 S Interval LS slope (r2) D, X 104 Interval LS slope (r2) D, X 104
(cm) cm2 S-l (cm) cm2 S-'
S-l 1.3 0-4 -.428 (.77) 4.4 1-6 -.097 (.99) 19 S 2 6.4 0-4 -.299 (.94) 1.3 1-6 -.048 (.99) 8.2 S-3 15 0-4 -.395 (.98) 0.42 0-6 -.057 (.96) 4.6 F- l 0.22 1-5 -.094 (-88) 123 0-5 -.l88 (.82) 62 F-2 0.43 1-5 -.l33 (.75) 44 0-5 -.421 (.88) 14 F-3 0.86 1-6 -.061 (.79) 47 0-5 -.l44 (.65) 20 F 4 1.7 1-3 -.472 3.1 0-3 -.447 (.96) 3.2 F-5 3.5 1-6 -.l75 (.98) 5.2 0-5 -.l56 (.99) 4.6
TKN inventories were corrected for residual pore water I5NH4 by assuming that 60 % of the pore water 15N inventories remained in the sediment after centrifugation

Garber: Short-term fate of PON in coastal sediments 101
Table 8. Comparison of sediment mixing coefficients (D,) and ammonium diffusion coefficients (D,) found in this study with values reported in the literature
Location D, DS Reference (cm-2 S-' X 10d)
Narragansett Bay 0.4-5.2 4.6-8 This studp Narragansett Bay 0.2-0.4 Ludke and Bender ( 1 9 7 9 ) ~ Narragansett Bay 0.1-0.01 Santschl et al. (1979)' Long Island Sound 1.2-2.5 Aller and Cochran ( 1 9 7 6 ) ~ Long Island Sound Rosenfeld (1979Ie Southern Bight of the North Sea Billen (1978)' Roskeeda Bay, Eire Raine and Patching (1980)' Free solution molecular diffusivity Klump and Martins (1981) for NH,+, 0-30 "C
Data for cores incubated longer than 24 h Tracer experiment with 141Ce and 59Fe
c Tracer experiments with 59Fe, '03Hg and labelled microspheres Analysis of in situ distribution of 234Th Laboratory diffusion cells filled with mud
' Analysis of pore water profiles
isotope, it is likely that this was an artifact of calcula- tion, caused by uncertainties in the concentrations of the extractable NH4+ and the factors used to correct the data for pore water M , + .
Rosenfeld (1979) characterized the dynamics of ammonium absorption in anoxic coastal marine sedi- ments as rapid, reversible and linear with respect to the concentration of ammonium in the sediment pore water. His experiments indicated that the equilibrium between ammonium in the pore water and exchange- able NH4+ in the sediment particulate matter was established in 2 h or less. His conclusion, based on the evaluation of a parameter, K, the ammonium absorp- tion coefficient, was that 'of the ammonium produced by organic matter decomposition, one to two times more is associated with the sediment that is dissolved in the interstitial water'. My results, although qualified by the indirect methods used to calculate the concen- tration and isotopic composition of exchangeable M,+, provide a test of these conclusions. If the NH4+ produced during the decomposition of labelled organic matter had been partitioned equally between the exchangeable and pore water NH, + compartments (K = l ) , and if the rate of change of the isotopic com- position of the pore water NH,+ compartment is slow compared to the dynamics of the exchange reactions, then the ratio of the inventories of 15NH4+ in the exchangeable and pore water compartments should be about 1. The data from the sediment sections suggest that this ratio was less than 1 (Fig. 7) and the inventory data (Table 4) show that the ratios of exchangeable 15NH,+: pore water 15NH4+ in the cores fell between 0.5 and 1.0. These results warrant verification, but the conclusion based on the results of the direct measure-
CORE S-l CORE 5-2
A CORE 5-3
. . W
PORE WATER NH~' , nmol I5N e x c e s s cm-3
Fig. 7. Relationship between amounts of 15N recovered in pore water NH,' and sediment exchangeable NH,' in spring cores after cores were treated with I5N-labelled PON. Line
gives the 1 : l relationship
ments of 15NH4+ produced near the sediment water interface is that ammonium may be partitioned between the exchangeable- and pore water-NH4+ pools in ratios lower than 1/1.
Incorporation of detrital-N into benthic biomass
The amounts of 15N taken up by the benthic macro- infauna were based on the isotopic compositions of animals captured when the cores were sliced. Rates of uptake (Table 9) were calculated by dividing the 15N e ~ i c h m e n t s of the animals by the period of incubation of the cores. Therefore the uptake rates represent the

102 Mar. Ecol. Prog. Ser. 16: 89-104, 1984
Table 9. Uptake of I5N by benthic infauna following addition of labelled POM to sediment cores
Core Species ( # analyzed) 15N atom % excess 15N uptake rate atom % h-' X 10-3
Yoldia limatula (6) Yoldia limatula (6 ) Yoldia limatula (3) Yoldia limatula (2) Yoldia limatula ( 1 ) Nepthys incisa (3) Nepthys incisa (1) Maldanopsis sp. (1) Maldanopsis sp. (2) Nassarius tn'vittatus (1)
number of I5N atoms incorporated into the tissues of the animal per 100 atoms of N in the animal per hour. The average rates of uptake of 15N for bivalves, gastro- pods and polychaetes were 0.0044, 0.0033 and 0.011 atom % 15N h-', respectively. The uptake rates for the 3 groups of organisms appeared reasonably constant (note particularly the uptake rates for Yoldia limatula) in the spring series. Since the data were insufficient to estimate the effects of temperature on the uptake rates, I assumed that the rates were constant for the 3 groups in both sets of cores. The amounts of 15N incorporated into benthic biomass given in the tracer budgets (Table 4 ) were calculated by multiplying the uptake rates by the average concentrations of each group of macrofaunal-N found in replicate sediment cores. These calculations indicate that only a few percent of labelled detritus could have been taken up by the macrofauna in the cores.
Deficits in the N budgets
The deficits in the budgets for the amounts of tracer- N added to the cores averaged 46 % in spring and 28 % in fall. These recoveries, particularly in spring, were dishearteningly low. The improvement in the recoveries of tracer in the second experiment undoub- tedly reflects better sampling procedures. Since entire sections of the sediment could be removed from the cores intact, the determinations of sediment inven- tories were not subject to subsampling errors.
It is possible to account for any fraction of the tracer deficits, or, in fact, for the loss of the entire spike of 15N, by assuming that denitrification in the cores produced N, gas that was more or less enriched in l5N. However, if denitrification of the labelled-N were the cause of the loss of significant amounts of the input, I would have expected the deficits in the budgets to increase in some regular fashion with the length of the incubation period. There appeared to be no relationship between
the size of the deficit and the length of incubation of the cores. The deficits were relatively constant within each experimental set. This suggests that the losses were the resuit of sampling or procedural errors, rather than due to a biological process occurring in the cores.
The amount of I5N recovered in the sediment TKN fraction corresponded reasonably well with the amount that would have remained in particulate form if 30 to 40 % of the nitrogen in the input material had been released to the water as DON at the start of the experiment. There can be no doubt that the release of some DON took place when the POM slurry was added to the cores. The problem, however, is that the missing 15N cannot be attributed to uncertainties in the free water DON fraction. Even granting a liberal estimate of the error associated with the determination of the concentration of DON in the free water of + 10 pg-at N 1-l only about 2 % of the input could have been lost in this fraction.
Since none of the sources of error alone can account for a major loss of tracer from the systems, the conclu- sion seems to be that the losses reflect cumulative errors, each of which contributed to underestimates of the amount of nitrogen in some compartments or to the dilution of labelled-N in the samples. Losses of tracer could also be attributed to processes that are impos- sible to evaluate quantitatively. These include absorp- tion of labelled-N on the wall and tops of the contain- ers, or the immobilization of N in microbial growth on the walls of the tubes, or leakage of water through the bottom seals of the coring devices.
CONCLUSIONS
The experiments described here represented an attempt to determine the fate of freshly deposited detrital nitrogen at the surface of a heterotrophic benthic community from mid-Narragansett Bay, Rhode Island, USA. The experiments provided direct evi-
Garber: Short-term fate of PON in coastal sediments 103
dence that nitrogen is remineralized from freshly- deposited POM and the dominant form of remineralized-N leaving the sediments is NH,'. Net rates of N-remineralization based on the conversion of labelled PON to NH,' suggest that essentially all but a few percent of detrital-N reaching the sediment sur- face could be recycled in less than 1 yr.
The tracer experiments also provided evidence that 5 to 10 % of the nitrogen in freshly deposited POM is conveyed to deeper layers of the sediment and that both particulate and dissolved forms of nitrogen are carried downward from the sediment surface. The experiments further provided evidence that freshly remineralized NET,+ takes part in exchange reactions with particulate phases in the sediments.
Finally, the recovery of tracer-N in the tissues of a number of benthic organisms demonstrated that the nitrogen originating in the deposited POM was taken up by the benthos. The exact pathway of uptake cannot be determined from the results reported here but it seems clear that only a small fraction, perhaps a few percent, of the organic nitrogen conveyed to the sedi- ment surface in the fallout of detritus is incorporated into benthic biomass, the rest is rapidly remineralized at the sediment surface.
Acknowledgements. Many friends and colleagues at Gradu- ate School of Oceanography at the University of Rhode Island contributed to this work. I would like to acknowledge my special debt to S. W. Nixon for suggestions, criticisms and encouragement. Special thanks also go to M. L. Bender for help with the I5N/l4N determinations. The staff at the Univer- sity of Rhode Island Engineering Instrument Workshop helped design and construct the sediment chambers. R. Hull, C. Oviatt and M. E. Q. Pilson commented on the manuscript. Support for this work was provided in part through EPA Grant R 803902010 to the Marine Ecosystem Research Laboratory.
LITERATURE CITED
Aller, R. C., Cochran, J. K. (1976). 234Th/238~ disequilibrium in nearshore sediment: particle reworking and diagenetic time scales. Earth Planet. Sci. Lett. 20: 37-50
Anderson, J. M. (1976). An ignition method for determination of total phosphorus in lake sediments. Wat. Res. 10: 329-331
Barsdate, R. J., Prentki, R. T., Fenchel, T. (1974). Phosphorus cycle of model ecosystems: significance for decomposer food chains and effect of bacterial grazers. Oikos 25: 239-251
Bender, M. L.. Fanning, K. A., Froelich, P. N., Heath, G. R.. Maynard, V. (1977). Interstitial nitrate profiles and oxida- tion of sedimentary organic matter in the eastern equato- rial Atlanic. Science, N. Y. 198: 605-609
Billen, G. (1978). A budget of nitrogen recycling in North Sea sediments off the Belgium coast. Estuar. coast. mar. Sci. 7: 127-146
Blackburn, T. H. (1979). Method for measuring rates of NH,+ turnover in anoxic marine sediments, using a 15NH,+ dilution technique. Appl. environ. Microbiol. 37: 760-765
Bremner, J. M. (1965a). Total nitrogen. Agronomy 9: 1149-1178
Bremner, J. M. (1965b). Inorganic forms of nitrogen. Agronomy 9: 1179-1237
Bremner, J. M. (1965~). Isotope-ratio analysis of nitrogen in nitrogen-15 tracer investigations. Agronomy 9: 1256-1286
Carey. A. G., Jr. (1976). Energetics of the benthos of Long Island Sound I. Oxygen utilization of sediment. Bull. Bing- ham oceanogr. Coll. 19: 136144
Crank. J. (1975). The mathematics of diffusion, 2nd ed. Clarendon Press, London
Delwiche, C. C. (1977). Energy relations in the global nitro- gen cycle. Ambio 6: 106-111
Eadie, B. J., Jeffrey, L. M. (1973). 6I3C analyses of oceanic particulate organic matter. Mar. Chem. 1: 199-209
Fiedler. R., Proksch, G. (1975). The determination of nitrogen- 15 by emission and mass spectrometry in biochemical analysis: a review. Analytica chim. Acta 78: 1-62
Furnas, M. J . , Hitchcock, G. L., Smayda, T. J. (1976). Nutrient- phytoplankton relationships in Narragansett Bay during the 1974 summer bloom. In: Wiley, M. (ed.) Estuarine processes, Vol. I. Academic Press, New York, p. 118-133
Garber, J . H. (1982). I5N tracer and other laboratory studies of nitrogen remineralization in sediments and waters from Narragansett Bay, Rhode Island. Ph. D. dissertation, Uni- versity Rhode Island
Garber, J. H. (in press). Laboratory study of nitrogen and phosphorus remineralization during the decomposition of coastal plankton and seston. Estuar. coast. Shelf Sci.
Gardner, W. S., Wynne, D. W., Dunstan, W M. (1976). Sim- plified procedure for the manual analysis of nitrate in seawater Mar. Chem. 4 : 393-396
Goldman, J. C., Tenore, K. R. , Stanley, H. I . (1973). Inorganic nitrogen removal from wastewater: effect on phytoplank- ton growth in coastal marine waters. Science. N. Y. 180: 955-956
Golterman, H. L. (1960). Studies on the cycle of elements in fresh water. Acta bot. neerl. 9: 1-58
Guillard. R. R. C. (1963). Organic sources of nitrogen for marine centric diatoms. In: Oppenheimer, C. H. (ed.) Sym- posium on marine microbiology. C. C. Thomas, Spring- field, Ill., p. 93-104
Hale, S. S. (1974). The role of benthic communities in the nutrient cycles of Narragansett Bay. MS thesis, University of Rhode Island
Kemp. W. M., Wetzel, R. L., Boynton, W. R.. D'Elia. C . F., Stevenson, J . C. (1982). Nitrogen cycling at estuarine interfaces: some concepts and research directions. In: Kennedy, V. (ed.) Estuarine comparisons. Academic Press, New York, p. 209-230
Knauer, G. A., Martin, J . H., Bruland, K. W. (1979). Fluxes of particulate carbon, nitrogen, and phosphorus in the upper water column of the northeast Pacific. Deep Sea Res. 26a: 97-108
Klump, J. V., Martins, C. S. (1981). Biogeochemical cycling in an organic rich coastal marine basin: 2. Nutrient sedi- ment-water exchange processes. Geochim. cosmochim. Acta 45: 101-122
Kremner, J . N., Nixon, S. W. (1978). A coastal marine ecosys- tem. Simulation and analysis. Springer-Verlag, Berlin
Ludke, N. A., Bender, M. L. (1979). Tracer study of sediment- water interactions in estuaries. Estuar. coast. mar. Sci. 9: 643-65 1
McCaffrey, R. J., Meyers, A. C., Davey, E., Morrison, G., Bender, M., Ludke, N., Cullen, D., Froelich, P.. Klinkham- mer, G. (1980). The relation between pore water chemistry