Tracer Study of the Graduates of - event.gov.np Study of the Graduates of ... The Tracer Study...
59
Tracer Study of the Graduates of Diploma and TSLC Programs under CTEVT Submitted to Council for Technical Education and Vocational Training Sanothimi, Bhaktapur Submitted by Accountability Initiative (Acin) Private Limited Babarmahal, Kathmandu 2016
Transcript of Tracer Study of the Graduates of - event.gov.np Study of the Graduates of ... The Tracer Study...

Tracer Study of the Graduates of Diploma and TSLC Programs under CTEVT
Submitted to
Council for Technical Education and Vocational Training
Sanothimi, Bhaktapur
Submitted by
Accountability Initiative (Acin) Private Limited
Babarmahal, Kathmandu
2016
2 | P a g e
Tracer Study of the Graduates of Diploma and TSLC Programs under CTEVT
Data Collection Team
1 Mr. Mohan Karki 2 Mr. Hom Nath Adhikari
3 Mr. Bhawan Singh Thapa 4 Mr. Lalu Prasad Gautam
5 Mr. Prem Kumar Gurung 6 Mr. Sangam Gautam
7 Ms. Hem Dutta Devkota 8 Dr. Raju Bhusal
9 Mr. Sangam Gautam 10 Mr. Sunil Sigdel
11 Ms. Suk Maya Pun 12 Mr. Nagendra Kumar Yadav
13 Mr. Bharat Buda 14 Mr. Sunil Sigdel
15 Mr. Tej Bahadur Khatri 16 Mr. Kalawati Bhatta
Research Experts
Dr. Aslesha Sharma- Team Leader
Er. Guna Raj Ghimire- TVET Expert
Dr. Khim Lal Devkota- Statistician
Umesh Adhikari - Research Associate
Consultancy Service
Accountability Initiative Private Limited
Research Coordinator
Mr. Manoj Sharma Neupane
Advisors
Dr. Kul Bahadur Basnet
Dr. Ramhari Lamichhane
Mr. Shiva Shankar Ghimire
Financial Support
EVENT Project/ World Bank
Overall Management
Council for Technical Education and Vocational Training
Research and Information Division
Sanothimi, Bhaktapur

3 | P a g e
ACRONYMS
AAHW : Assistant Ayurveda Health Worker
ANM : Auxiliary Nurse Midwifery
BPH : Bachelor in Public Health
CMA : Community Medical Assistant
CTEVT : Council for Technical Education and Vocational Training
FGD : Focused Group Discussion
FGI : Focused Group Interview
HA : Health Assistant
INGO : International Non Governmental Organization
JTA : Junior Technical Assistant
NGO : Non Governmental Organization
OJT : On the Job Training
PCL : Proficiency Certificate level
SD : Standard Deviation
TSLC : Technical School Leaving Certificate
TVET : Technical Vocational Education and Training
VJTA : Veterinary Junior Technical Assistant
4 | P a g e
EXECUTIVE SUMMARY
Council for Technical Education and Vocational Training (CTEVT) has been running long term
and short term training programs of vocational nature under the trade of Health, Agriculture and
Construction since its establishment in 2037 B.S. At present, CTEVT delivers both long and
short term vocational programs as well as three years academic diploma programs in different
faculty. Although large numbers of students have already been graduated from the programs of
CTEVT, information about the situation of these graduates is still limited within speculation due
to lack of effective and reliable study. This tracer study was conducted with the main objective to
provide CTEVT with information on the graduates’ employment status as well as labor market
needs, status of the quality of its Diploma and TSLC level training programs and to suggest the
measures to promote the quality of TVET programs thereby employability and efficiency of
graduates.
The Tracer Study covered the graduates of academic year 2013 of eight diploma level programs,
i.e. Proficiency Certificate in Nursing; Diploma in General Medicine; Diploma in Pharmacy;
Certificate in Medical Laboratory Technology; Diploma in Civil Engineering; Diploma in
Electrical Engineering; I. Sc. in Agriculture Science and Diploma in Computer Engineering.
Similarly, the eight TSLC Level programs covered were: Community Medicine Assistant
(CMA); Auxiliary Nurse Midwifery (ANM); Medical Lab Assistant; Civil Sub-overseer;
Electrical Sub-overseer; Veterinary-Junior Technical Assistant (V-JTA); Basic Surveying and
Assistant Ayurveda Health Worker (AAHW).
The total number of graduates in the selected eight diploma level programs in the academic year
2013 was 7,114 and corresponding number of selected TSLC program graduates was 5,694. The
proposed sample size of graduates in diploma level program was 1623 and from TSLC level
program was 1640. Total number of graduates from both was 3263. However, targeted data
collection was found difficult because of the effect of devastating earthquake of 25 April and 12
May 2015, and the undeclared blockade in the border area. Therefore, the study team could not
reach to all the proposed target graduates. Only 2009 graduates (1110 graduates from Diploma
level and 899 graduates from TSLC level programs were traced during the field visit considering
the 99% confidence level and below 5% margin of error. Likewise, training institutes were
selected purposively so as to cover all parts of the country. Both quantitative and qualitative
approaches were used for data collection. Quantitative information was collected through survey
of the graduates. Focus group discussion and Key-informants' interview were also used for
getting qualitative information.
Two sets of questionnaires; one for the graduates and another for their employers were designed
and used to collect the post-training information. Most of the graduates were interviewed face to
face. However, telephone interview was also conducted from the graduates if face-to-face
interview was not possible. The survey questionnaire included both status and opinion type of
questions. In the case, where both face-to-face and telephonic interview were not possible,
Limited numbers of post training information (status type of questions) was also collected from
third sources like their teachers, guardians, friends etc incase where face-to-face and telephonic
interview were not possible.
5 | P a g e
Semi-structured questionnaire were used for the graduates and rating scale type of questionnaire
for employers. Likewise, semi-structured interview checklists were used to interview key
informants. The study instruments were pre-tested with 50 graduates randomly selected mainly
from Kathmandu Valley and improved based on the experiences gained from pre-test. .
SPSS program was used to analyze the collected data from the graduates. In the quantitative data
analysis, tools like frequencies, cross tabulations, mean comparison were basically used. In
addition to these analytical tools, ANOVA, Chi-square, t-Test were also considered as per the
nature of data and necessity of analysis. Some qualitative information in the questionnaires were
analyzed using cross tabulation and frequency tables.
The analyses of the tracer study are organized in the five thematic sections which are (a) Profile
of respondents (b) Employment status of graduates (c) Income level of the graduates, (d)
Proficiency and satisfaction level of graduates and; (e) Quality and Relevance of TVET
Programs.
The key findings of the study are presented under following headings:
Profile of respondents
Of the total 2009 traced graduates of sixteen different TVET programs, 55.5% were female and
44.5% were male. Programs like Proficiency Certificate in Nursing and Auxiliary Nurse
Midwifery are accessed only for female. Except these two, female representation was found
highest (62.3%) in TSLC Lab Assistant Program followed by Community Medicine Assistant
(58.2%). Participation of female is comparatively lower in engineering related programs.
Highest representation of the graduates in the study was from province one (23.5%) followed by
Province Five 22.6%. Only 5.6% were represented from Province Six.
Majority of traced graduates were from hill Brahmin/Chhetri group (58.1%) followed by hill
Janajati 21.5%. Hill Dalit, Tarai Dalit, Madhesi Middle Caste and Muslim have very negligible
representation. Average age of the respondent was 22 years with minimum 17 years and
maximum 49 years.
The large majority (62.86%) of employers'-organization were from private sector followed by
government organization (20%). Likewise, 77.15 % of employers interviewed were from Health
and Social Service Sector, followed by 11.43 % from Education Sector. Representation of
employers from Agriculture Sector and Construction was equal to 2.86%. None of the employers
were interviewed from manufacturing sector.
Employment status of the TVET graduates
Out of 2009 traced TVET graduates, 982 (49%) were employed, 928 (46%) were unemployed,
and the rest 99 (5%) were working as volunteers. The gap between the percentage of employed
and unemployed graduates is not that big. At least 70% employment of the graduates is
acceptable in TVET program. But the tracer study showed only 49% employment of TVET
graduates.
6 | P a g e
In Diploma Level programs, 51 % were employed, 44% were unemployed, and 5% were
working as volunteers. Forty nine percent graduates were employed in PCL Nursing. The highest
number of graduates working as volunteer was also from nursing program. Nursing Institutes
having direct linkage with large hospitals have greater employment rate. The employment rate is
highest in the Certificate in Medical Lab Technology (65 %) among the eight diploma programs
traced out. In TSLC program, 46.9% traced graduates were employed and 49 % were found
unemployed.
Health related program graduates were involved as volunteers without any salary for six months
to one year and there is no job guarantee for these graduates even after completing the terms and
conditions of volunteer service. Employment rate in TSLC level graduates is found only 47 %
that is quite low. TSLC level graduates of Health trade, i.e. ANMs and CMAs, were found being
replaced by Diploma level Staff Nurse and Health Assistant graduates and indicate ANMs and
CMAs being phased. In TSLC level Survey course, employment is found only 28%. Very few
graduates of Computer engineering program are wage employed.
Graduates who are self employed are earning more; for example, the graduates of VJTA program
and therefore needs to be encouraged for self employment. There is higher opportunity of self
employment in this trade. Graduates of Lab technology program are also happy with their self or
part time employment as they can take more than one work at a time in their own discretion.
Although the earnings of the graduates employed in formal sector is less than the graduates in
informal sector or self-employment or in foreign employment; they are found satisfied with their
income.
Still 22.8 % (458 persons) of the traced graduates out of 928 unemployed are hopeful for getting
the job and are searching for job. Remaining 11.3 % of the total traced graduates who were
unemployed have decided to pursue higher education and progress in their academic level so that
they can get higher level job. Likewise, 1.5 % graduates were preparing for public service
commission examination, and 0.9 % were preparing to initiate their own business. This shows
that the TVET graduates have choices; either to go into job market having skill to perform well
in the job or go in for higher education. Preference of the employer to hire diploma graduates in
place of the TSLC graduates, especially in health trades indicates the need to review these
programs.
The skill and knowledge learnt during their study is found relevant to the requirement of the job
market. Only 8.4 % unemployed graduates mentioned that the skill and knowledge they learnt
during study do not match with the required job in the job-market. Normally, the gap between
graduation and employment is around 3 months. Soft skills were instrumental for getting
employment or to retain on it. Communication skill, honesty/positive attitude toward work and
organization, and interpersonal skills were very vital for retaining in the job, especially in private
sector. Placement and counseling support of the institute to the graduates is crucial for promoting
employment.
Income level of the graduates
There is large variation in the income level of graduates which ranges from Rs. 4000/ to Rs.
87000/per month. The average income is found Rs. 15861.05/month. Graduates who are in self-
7 | P a g e
employment earn better than graduates who are in wage employment in both formal and informal
sector. Graduates of agriculture trade of both Diploma and TSLC level program have the highest
monthly income. This could be due to higher number of graduates involved in self employment
where earning is significantly higher, a portion of which is the return on the investment too.
Average earning of graduates of engineering trade was also over 20 thousands. Earning is least in
Health program graduates among the traced out.
Graduates of formal employment are relatively more satisfied with their income, although they
earn less than the graduates in informal sector or self-employment or in foreign employment.
Earning of male graduates is found greater than female graduates. In the engineering trades, male
graduates are earning Rs. 19776.36, whereas females are earning only Rs. 14785.71. Regarding
the job satisfaction, 74.8 percent of the respondent employed graduates were satisfied with their
current job. 25.2 percent showed their dissatisfaction with the job they had. Some respondents
showed their dissatisfaction with their job because of low remuneration, especially in private
sector.
Satisfaction Level of Employers Regarding the Graduate's Performance
Majority of the graduates were satisfied with the TVET program that they received. The
graduates under the lab technician or lab assistant program were not found confident due to
inadequate practical opportunities in the training institutions, especially in private institutions.
61.5 percent of employers found no significant difference between the performances of the
graduates trained at CTEVT institutions and other training institutions. 31 % employers have the
opinion that TVET graduates were performing better than other technical staffs. The employers
were satisfied about the overall performance of graduates, and especially with the graduates
having required individual and teamwork skills.
The performance level of the TVET graduates at the work place is to the acceptable level for the
employers. Employers are found willing to hire TVET graduates and further emphasized to
provide training as per labour market needs and required standard. Employers have the opinion
to make four year diploma program including one additional year of workplace training packages
for better performance. They also urged to revise the curriculum to address new and emerging
technologies.
Practical opportunity is inadequate in both Diploma and TSLC level program. Therefore, the
graduates are not much confident to perform the work even if they get the job. Hence, despite
acceptance of job performance level of the graduates by the employers, there is a need for the
graduates to improve their skills.
Quality and Relevance of TVET Programs
It was found that the graduates are lacking skills due to inadequate practical opportunities. Time
provided for practicing skill is inadequate in most of the programs of the private institutes. There
is a need of substantial improvement on workshop and lab equipment. Ample opportunity need
to be provided for practice and industrial attachment. Periodic revision of the Curricula is also
8 | P a g e
needed to make the program relevant, practical based to address the latest development of labor
market.
Lack of job opportunities in the job market is revealed as the main reason for unemployment.
This indicates lack of relevancy of the training programs in the job market. And also indicates
the time for updating its programs to prepare the human resource according to the skill demand
of the job market. Lack of linkage with the employers’, and ‘inadequate technical and other soft
skills’ were other reasons for being unemployed.
Conclusions and Recommendations
Conclusions
TVET program has been contributing to the employment and overall economic growth of the
country and needs to be further strengthen. However, the employment percentage is
comparatively low. Therefore, there is a high need to strengthen the linkage with the industry
and job market and also review the programs to address the changing market needs.
Practical opportunities for the participants are inadequate especially in Private Institutes as
specified in the curriculum. Effective monitoring mechanism has to be established and
implemented to ensure the effective implementation of the curriculum.
Overall income and earning of employed graduates was satisfactory. Not only the graduates but
the employers are also happy and satisfied with their employees' job performance, although some
additional skills and knowledge are required for the TVET graduates. Hence, it can be concluded
that TVET program of CTEVT has helped to improve the economic life of the targeted group to
some extent.
Recommendations:
Labour market studies are recommended to conduct in a Periodic manner to identify the
changing needs of the labour market. Consequently, it is recommended to review
Curricula to cater the market demand.
Recommended to ensure effective monitoring is carried out to ensure that the curriculum
is fully implemented. Specially to ensure adequate practical opportunities for the students
as envisaged by the curriculum. It was found lacking specially in private institutes.
Recommended to carry out the tracing of the graduates by each training institute in a
regular basis to update the market demand and course updating.
Linkage between institutions and industries or employers should be strengthened so that
the TEVT program is offered according to the human resource demand of the employers.
It is recommended to establish functional placement and counseling unit or any other
such mechanism in each training institute and in the CTEVT as well to support graduates
linking with job market.
It is recommended for assessing by subject experts regarding the necessity of on the job
training (work place practice) provision for diploma programs. For the existing TSLC
program with OJT provision, it is also recommended to ensure that the graduates get
opportunity of working in the related job during the OJT. Developing a roaster of
potential organizations for OJT placement in each program would be instrumental.
9 | P a g e
TABLE OF CONTENTS Acknowledgement ........................................................................................................................... i
Executive Summary.........................................................................................................................ii
Acronyms........................................................................................................................................iii
I INTRODUCTION
1.1 Background/Rationale....................................................................................................... 11 1.2 Objectives of the study....................................................................................................... 12 1.3 Scope and limitations of the study ..................................................................................... 12 1.4 Institutional arrangements to conduct the study ................................................................ 13
1.5 Study Design and Methodology......................................................................................... 14 1.5.1 Approaches of data collection ................................................................................... 15 1.5.2 Data analysis and report writing ................................................................................. 16
II ANALYSIS AND PRESENTATION
2.1 Graduates' Profile ............................................................................................................... 17 2.1.1 Gender of the Graduates ............................................................................................. 17
2.1.2 Provincial Distribution of Respondents ...................................................................... 18 2.1.3 Ethnicity of Respondents ............................................................................................ 19 2.1.4 Age of the Respondents .............................................................................................. 19
2.1.5 General Profile of the Employers: .............................................................................. 20
2.2 Employment status of graduates ........................................................................................ 20 2.2.1 Employment status of graduates ................................................................................. 21 2.2.2 Types of Employment ................................................................................................ 24
2.2.3 Nature of Employment ............................................................................................... 24 4.2.4 Means for Getting Employment ................................................................................. 25
2.2.5 Status of Unemployed graduates ................................................................................ 26 2.2.6 Reasons for Unemployment ....................................................................................... 26 2.2.7 Relation of job to the TEVT program ........................................................................ 27
2.2.8 Transition Period between job and completion of TVET Program ........................... 28 2.2.9 Activities during Transition period ............................................................................. 28
2.2.10 Holding More than One Job ....................................................................................... 28 2.2.11 Soft Skill – how much important for employment? .................................................. 29
2.3 Income Level and Its Variation.......................................................................................... 29 2.3.1 Income Comparison Among Trades ........................................................................... 30 2.3.2 Income Comparison among Employment Types ....................................................... 30 2.3.3 Income Comparison Among Program ........................................................................ 31 2.3.4 Income Comparison among Sex ................................................................................. 32
2.3.5 Income Comparison Among Trades ........................................................................... 33 2.3.6 Perception Regarding the TVET Programs and Graduates ........................................ 33
2.4 Proficiency and satisfaction level of graduates .................................................................. 34 2.4.1 Satisfaction Level of Employers Regarding the Graduate's Performance .................. 35
2.4.2 Need for additional training ........................................................................................ 36 2.4.3 Willingness of employers’ to hire TVET graduates ................................................... 37 2.4.4 Issues Related to the Quality and Relevance of TVET Programs ............................. 38
2.5 How Much Training is Applicable to the Graduates ......................................................... 40
III Major Findings, Conclusion & Recommendation
10 | P a g e
3.1 Employment status of the TVET graduates ...................................................................... 42
3.2 Satisfaction Level of Employers Regarding the Gra.........................................................43 3.3 Characteristics, Expectations and Aspirations of Graduates.............................................44 3.4 Quality and Relevance of TVET Programs ....................................................................... 44
3.5 Conclusion ......................................................................................................................... 44 3.6 Recommendations .............................................................................................................. 45
BIBLIOGRAPHY
ANNEXES
Annex I: Location and number of employers interviewed ....................................................... 48
Annex II: Graduates either in education or . .............................................................................. 49
Annex III: Graduates either in education or .............................................................................. 49
Annex IV Questionnaire for Graduates ...................................................................................... 50 Annex V : Questionnaire for Employers .................................................................................... 56
11 | P a g e
SECTION ONE: INTRODUCTION
1.1 Background/Rationale Council for Technical Education and Vocational Training (CTEVT) has been carrying out three
years diploma level courses since 2058 B.S. Presently, almost 530 institutes are running under
CTEVT. Out of them, 110 institutions are running PCL Nursing programs, 47 are running
General Medicine (HA) programs, 38 running Civil Engineering Programs and so on. Large
numbers of students have already been graduated from these programs however; lack of effective
and reliable study, information of whereabouts of these graduates is still limited with in
speculation (CTEVT, 2073).
CTEVT is running long term and short term training programs of vocational nature under the
trade of Health, Agriculture and Construction since its establishment. Gradually it elaborates its
activities not only in geography but also in nature and sector of trade. Presently, it caters both
long and short term vocational programs as well as three years diploma as an academic program.
The broader objectives of CTEVT is to make significant contribution on employment creation or
poverty reduction of country either by preparing graduates as per the employment needs of
country or making them capable enough to create new employment (self-employment). CTEVT
should, therefore be well informed about the employment status of their graduates as well as
needs of the labour market. Although, tracer study can't be the substitute for labour market study;
it can provide great deal of information in this aspect.
Since monitoring, supervision and evaluation are three crucial aspects of quality control. Like
any evaluation, tracer study is also an evaluation which explores its importance in various ways.
It provides realistic expectations concerning what a program can and can't do: it can provide
information to program administrators and employees concerning ways to improve their services
and it can aid policy makers in determining basic changes in programs structure or funding and
finally it can be used as political ammunition to attack or defend a program.
The quality of training programs should be viewed not only in the examination score but also on
employability of its graduates. This concept of evaluation is further relevant in the case of TEVT
graduates. Thus, the tracer study should be made inextricable function of CTEVT which
provides the status on employability of its graduates and more realistic signals of labour market.
Anecdotes say that the floods of youth, who want to enroll in CTEVT's training programs, are
decreasing year by year. This arise two possibilities, whether the supply capacity doesn't dovetail
with the labour market needs or the graduates of these institutes are below the quality threshold.
The tracer study gives valuable information regarding these issues and sketches a way-out for
future programmes.
Tracer study is a major evaluation tool to measure both effectiveness and quality of training
programs. Outcome and impact of any type of training programs are not constant over time.
Fluctuations of such impacts can be occurred and observed in labour market. Tracer study is
therefore, an essential technique to get information of overtime fluctuation of both employability
12 | P a g e
of graduates and demand of labour market. It also provides the crucial information for policy
makers or planners whether to continue or modify or terminate the existing training programs.
The follow-up research or tracer study has significant importance as an evaluation strategy.
However, there are some specific considerations to make the result more valid and reliable. In
this regard, Flaherty and Morell, 19781 argued that if follow-up techniques are to be used to their
fullest potential, it is necessary to consider the unique nature of evaluation as a form of social
research. Basically tracer study must be guided by the two principles. First, data bear a heavy
responsibility for generating information on the value and validity of what has been found.
Second, tracer study can't be interpreted in isolation from knowledge which is gained from a
multiplicity of sources that are external to the research itself (Morell, 1978)2.
Therefore, the main objective of tracer study was to trace the graduates not only to find out their
whereabouts but also to get the information on activity status to make sure that the knowledge
and skills of individual learned during the training are in use. This can be verified by their post
training information. The gathered information from the tracer study is not only applicable to
identify the employment status of graduates but also analyses or update the demand of labour
market.
1.2 Objectives of the study The major objectives of the study was to trace the graduates to find out their employment status
as well as their income and performance level at workplace. The other specific objectives of the
study were as follows;
Identify the employment status of graduates of the Diploma and TSLC level programs;
Analyze the work place performance level of employed graduates;
Spell out the determinants of employability and efficiency for such graduates;
Suggest the measures to promote the quality of TVET programs thereby employability
and efficiency of graduates.
Understand the different ways in which graduates learn about labor market opportunities
and transition to employment.
Perform the above analyses disaggregated by socio-economic characteristics and
locational factors (e.g., rural vs. urban).
1.3 Scope and limitations of the study This tracer study covered eight diploma level programs and equal numbers of TSLC level
programs. The eight diploma level programs were: 1. Proficiency Certificate in Nursing, 2.
Diploma in General Medicine, 3. Diploma in Pharmacy, 4. Certificate in Medical Laboratory
Technology, 5. Diploma in Civil Engineering, 6. Diploma in Electrical Engineering, 7. I. Sc. in
Agriculture Science and 8. Diploma in Computer Engineering. Similarly, the eight TSLC Level
programs are; 1. Community Medicine Assistant (CMA) 2. Auxiliary Nurse Midwifery (ANM)
1 Flaherty, E. W., and Morell J. A. 1978. Evaluation: Manifestation of a new field. Evaluation and Program
Planning 1: 1-10 2 Morell, J. (1978). Follow-up research as an evaluation strategy (Theory and Methodology). Hand book of
Vocational Education Evaluation.
13 | P a g e
3. Medical Lab Assistant 4. Civil Sub-overseer, 5. Electrical Sub-overseer 6. Veterinary-Junior
Technical Assistant (V-JTA), 7. Basic Surveying and 8. Assistant Ayurveda Health Worker
(AAHW).
The trainees who were graduated in 2013 of the sampled institutes were the total population, out
of which valid and reliable sample size was drawn as specified in the methodology.
Sudden natural disaster like the devastating earthquake of 12 Baisakh and 29 Baishakh 2072 B.S.
(25 April and 12 May 2015 AD), and the unexpected and undeclared blockade in the border area
that caused big trouble in data collection, have also been considered as the limitation for this
study. Therefore, the study team could not reach to all the proposed target graduates. Likewise,
training institutes were selected purposively so as to cover all parts of the country, which is also
considered as another limitation.
In case of diploma level graduates, they had shorter period for the employment and the tracing
may not perfectly represent the employment opportunity due to the smaller gap between the
graduation and the employment tracing. The gap was only about 6 months for 068 batch. Due to
this, the gap for getting the job was shorter. However, in case of the TSLC level, due to the
sufficient gap between the graduation and the tracing, the employment might be realistic.
The gap in case of the nursing course was only about 6 months due to the council exam. In other
diploma program, the gap was 8/9 months which seems adequate for maturity for the
employment tracing.
The study is conducted at the time of extreme recession phase of national economy caused by the
devastating earthquake and border blockade. The employment rate of graduates may be
underestimated than in the regular situation.
1.4 Institutional arrangements to conduct the study This tracer study is designed and conducted by Research and Information Division, CTEVT by
outsourcing the expert group from a consulting firm named Accountability Initiative Private
Limited where high level skills is needed. The primary data was collected by mobilizing the
internal staffs of CTEVT whereas the qualitative data collection was made by external expert
group of consulting firm. For collecting post training information of the graduates, priority was
given to face to face interview. For this, two data collection teams were deployed to eastern and
western part of country. Likewise, individual enumerators were deployed for the data collection
at Kathmandu Valley and Neighboring Districts. All of the related institutes had also facilitated
the whole data collection activities by providing the contract information of graduates.
Moreover, some institutes also gathered the selected graduates in the respective institutes at the
time of data collection.
Besides the above mentioned quantitative data, qualitative data was also collected from
employers, teachers and managers at institution level. Similarly, the member of professional
associations were also interviewed about the employment status in their corresponding
profession.
14 | P a g e
1.5 Study Design and Methodology The methodology adopted for this study was mainly quantitative; however various qualitative
approaches were also adopted while conducting the study. Tracer study mainly deals with the
post training information of the graduates, which is collected by means of survey of the
graduates. However, work-place performance level of the employed graduates was also the
concern of this study which requires both quantitative and qualitative information. Focus group
discussion and Key-informants' Interview were also the basic tools for getting qualitative
information which is explained in brief in next topics. As explained in the previous topic (scope
of the study), graduates of eight diploma level programs and equal number of TSLC level
programs, graduated in 2013 were covered in this study.
Two sets of questionnaires were designed to collect the post-training information of the
graduates, one was for the graduates who are in paid employment and second one was for their
employers. Most of the graduates were interviewed face to face whereas telephone interview
was also conducted to take the information from the graduates if face-to-face interview was not
possible. The survey questionnaire includes both status and opinion type of questions. In the
case, where both face-to-face and telephonic interview were not possible, limited numbers of
post training information (status type of questions) was also collected from third sources like
their teachers, guardians, friends etc.
The proposed sample size of graduates was 1623 from Diploma level program, and 1640 (a total
of 3263) from TSLC level program. The political unrest and unexpected nakabandi (Blockade)
at the border areas made data collection difficult from the intended sample of graduates.
Therefore, only 1110 graduates from Diploma level program and 899 graduates from TSLC level
(Total 2009) were traced for the study.
The total number of graduate in the selected eight diploma level programs in the academic year
2013 was 7,114. Similarly the corresponding number of TSLC graduates was 5,694 of the eight
selected TSLC programs. In aggregate, 1,110 and 865 graduates respectively from diploma
level program and TSLC level program were traced during the field visit taking 99% confidence
level and below 5% margin of error. The detail of population, sample (traced graduates),
confidence level and margin of error for each of the selected program is presented in the Table
1.1.
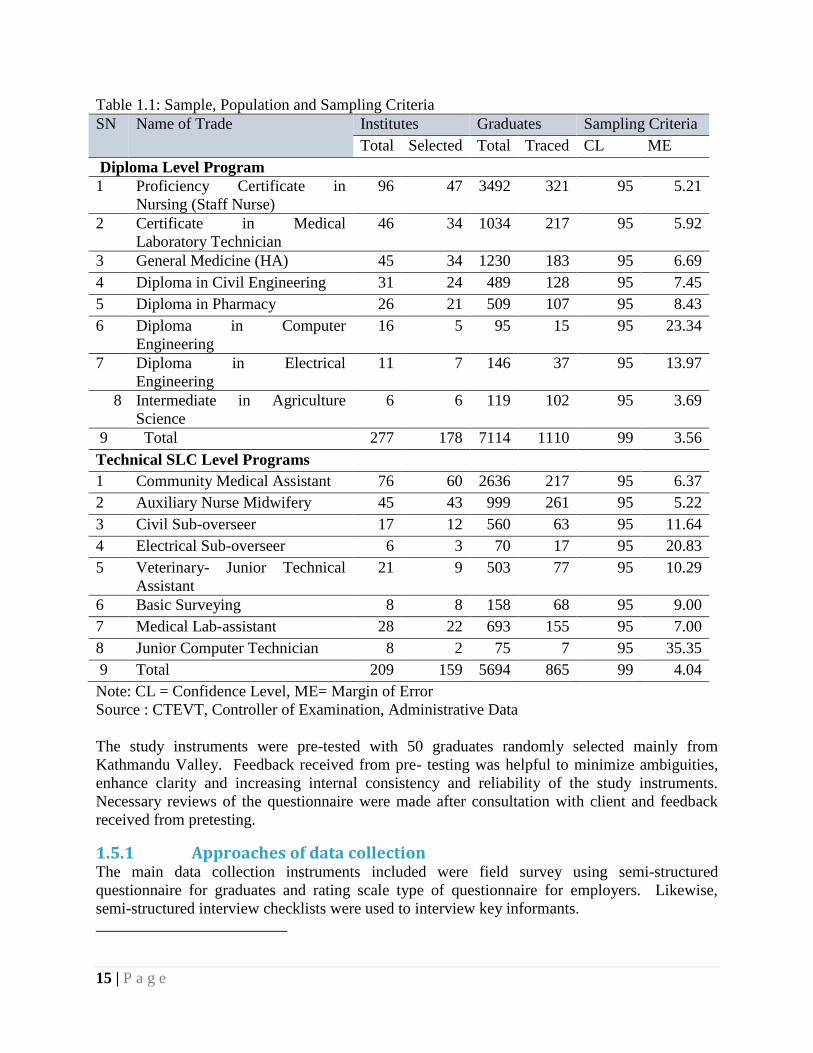
The program wise sampling validity is also presented in the Table 1.1, where confidence level is
considered 95% for all programs, but margin of errors were considered differently for different
trades. Out of the total 16 programs, the size of sample taken for Diploma in Computer
Engineering, Diploma in Electrical Engineering, Electrical Sub-overseer and Junior Computer
Technicians are not that much strong to claim the statistical validity of the result in the form of
disaggregated findings. In these trades, the margin of errors are considered far greater than
generally considered in sampling, however it provides signals to speculate the general demand
situation.
15 | P a g e
Table 1.1: Sample, Population and Sampling Criteria
SN Name of Trade Institutes Graduates Sampling Criteria
Total Selected Total Traced CL ME
Diploma Level Program
1 Proficiency Certificate in
Nursing (Staff Nurse)
96 47 3492 321 95 5.21
2 Certificate in Medical
Laboratory Technician
46 34 1034 217 95 5.92
3 General Medicine (HA) 45 34 1230 183 95 6.69
4 Diploma in Civil Engineering 31 24 489 128 95 7.45
5 Diploma in Pharmacy 26 21 509 107 95 8.43
6 Diploma in Computer
Engineering
16 5 95 15 95 23.34
7 Diploma in Electrical
Engineering
11 7 146 37 95 13.97
8 Intermediate in Agriculture
Science
6 6 119 102 95 3.69
9 Total 277 178 7114 1110 99 3.56
Technical SLC Level Programs
1 Community Medical Assistant 76 60 2636 217 95 6.37
2 Auxiliary Nurse Midwifery 45 43 999 261 95 5.22
3 Civil Sub-overseer 17 12 560 63 95 11.64
4 Electrical Sub-overseer 6 3 70 17 95 20.83
5 Veterinary- Junior Technical
Assistant
21 9 503 77 95 10.29
6 Basic Surveying 8 8 158 68 95 9.00
7 Medical Lab-assistant 28 22 693 155 95 7.00
8 Junior Computer Technician 8 2 75 7 95 35.35
9 Total 209 159 5694 865 99 4.04
Note: CL = Confidence Level, ME= Margin of Error
Source : CTEVT, Controller of Examination, Administrative Data
The study instruments were pre-tested with 50 graduates randomly selected mainly from
Kathmandu Valley. Feedback received from pre- testing was helpful to minimize ambiguities,
enhance clarity and increasing internal consistency and reliability of the study instruments.
Necessary reviews of the questionnaire were made after consultation with client and feedback
received from pretesting.
1.5.1 Approaches of data collection The main data collection instruments included were field survey using semi-structured
questionnaire for graduates and rating scale type of questionnaire for employers. Likewise,
semi-structured interview checklists were used to interview key informants.

16 | P a g e
.
The questionnaires was developed around the key variables of investigation of: employment
situation of graduates, employment rate in both formal and informal, relevance and effectiveness
of learning in the institutions, waiting time to get first employment, employer satisfaction with
regard to their skills, skills gap and performance level and possible networking opportunities
between industries and training institutions.
1.5.2 Data analysis and report writing The collected data from more than 2009 graduates were first coded then entered in to the
specially designed format in SPSS (Statistical Program for Social Science). After completing the
data entry, some inconsistencies were revised and incomplete questionnaires were omitted during
the data cleaning process. In total, 2009 complete set of questionnaires were included in the
analysis.
Some qualitative information in the questionnaire were analyzed using cross tabulation and
frequency tables. Similarly, five points Likert Scale with responses “Excellent”, “Very Good”,
“Good”, “Poor” and “Very Poor” and another 4-point Likert scale with responses “ Very
Relevant” “Relevant” “Not much Relevant” and “ Completely Irrelevant” were used to collect
the responses of the graduates about the quality and relevancy of the TVET program that they
received. These information were analyzed calculating means and standard deviation considering
weightage of the points from 1 -5,1-4, and 1-3 respectively.
In the quantitative data analysis, tools like frequencies, cross tabulations, mean comparison were
basically used. In addition to these analytical tools, ANOVA, Chi-square, t-Test were also
considered as per the nature of data and necessity of analysis.
17 | P a g e
SECTION II: DATA PRESENTATION AND ANALYSIS
The analysis in this Tracer Study Report is based on quantitative data collected from two semi-
structured questionnaires, one was designed to collect information form graduates and another
was designed for employers' interview. Besides, some qualitative data were also gathered from
principals, teachers and member of related professional association either conducting their in-
depths interview or Focus Group Discussion (FGD) among them. These analyses are also
enriched by other sources of information including literature review and some advance statistical
analysis. Attempt is made to organize the analysis with respect to the study objectives.
Although, employment status and income level of graduates is the major focus area of analysis,
this report also attempts to provide brief overview on respondents profile, quality and relevancy
of the TVET programs, proficiency and satisfaction level of employed graduates and early
impact of the TVET programs. Moreover, analysis in this report also concentrates to spell out
and explore the factors that can affect the quality of the TVET programs.
The analyses of the tracer study are organized in the five thematic sections which are (a) Profile
of respondents (b) Employment status of graduates (c) Income level of the graduates, (d)
Proficiency and satisfaction level of graduates and; (e) Issues Related to the Quality and
Relevance of TVET Programs. Based on the analysis presented in this section, the next section
consisting of findings and followed by implications and institutional reforms, and
recommendations are presented.
2.1 Graduates' Profile As mentioned earlier, the sampling for this study was conducted in to two stages. At the first
stages, institutes were selected purposively covering all geographical and development region of
the country as far as possible. In the second stages, graduates were listed out of these institutes
and statistically representative sample size was drawn based on the criteria as mentioned in
methodology section. Since the previous classification as per the five development regions is no
more relevant after executing the New Constitution of Nepal 2072 B.S. (2015 A.D.), analysis in
this report is also made accordingly.
2.1.1 Gender of the Graduates Of the total 2009 traced graduates of sixteen different TVET programs, 55.5% were female and
44.5% were male. However, the programs like Proficiency Certificate in Nursing (Staff Nurse)
and Auxiliary Nurse Midwifery are accessed only for female. If we exclude these two trades, the
corresponding percentage of female and male becomes 37.4 and 62.6% respectively. Excluding
these two female friendly programs, female representation in this survey was found highest
(62.3) in TSLC Lab Assistant Program followed by Community Medicine Assistant (58.2%),
Certificate in Medical Lab Technology (53.9%). Unlike these three programs, participation of
female is comparatively lower in engineering related programs. As an example, participation of
female is nil in Diploma in Electrical Engineering, followed by 5.9% in Electrical Sub-overseer
and 13.2% in Basic Surveying. The detail figure of gender wise distribution of traced graduates
together with its corresponding proportion is depicted in Table 2.1.

18 | P a g e
Table 2.1: Gender of the Respondents
SN Name of Programs Gender of the respondents Total
Male Female
1 Diploma in Civil Engineering 109(85.2%) 19(14.8) 128(100)
2 Diploma in Computer Engineering 13(86.7) 2(13.3) 15(100)
3 Diploma in Electrical Engineering 37(100) 0 37(100)
4 Proficiency Certificate in Nursing 321(100) 321(100)
5 Diploma in General Medicine 138(75.4) 45(24.6) 183(100)
6 Diploma in Pharmacy 71(66.4) 36(33.6) 107(100)
7 Diploma in Agriculture 72(70.6) 30(29.4) 102(100)
8 Certificate in Medical Lab Technology 100(46.1) 117(53.9) 217(100)
9 Community Medical Assistant (CMA) 105(41.8) 146(58.2) 251(100)
10 Auxiliary Nurse Midwifery (ANM) 258(100) 261(100)
11 Lab Assistant 58(37.4) 97(62.6) 155(155)
12 Veterinary Junior Technical Assistant 57(74) 20(26) 77(100)
13 Civil Sub-overseer 54(85.7) 9(14.3) 63(100)
14 Electrical Sub Overseer 16(94.1) 1(5.9) 17(100)
15 Basic Surveying 59(86.8) 9(13.2) 68(100)
16 Junior Computer Assistant 5(71.4) 2(28.6) 7(100)
Total 894(44.5) 1115(55.5) 2009(100)
Note: Figures in parenthesis indicate the row percentage.
2.1.2 Provincial Distribution of Respondents The Table 2.2 depicts the distribution of respondent graduates as per their home address which
may be different than the address of their institutions. Of the total 2009 respondent graduates,
larger majority (23.5%) were from Province One, followed by Province Five 22.6%, Province
Seven 20.9%. Likewise, 12.7% were represented from Province Three, 5.6% were represented
from Province Six, 9% from Province Four.
Table 2.2: Provincial Distribution of Number of Graduates
SN Province Frequency Percent Cumulative Percent
1 Province One 476 23.7 23.7
2 Province Two 110 5.5 29.2
3 Province Three 256 12.7 41.9
4 Province Four 180 9.0 50.9
5 Province Five 455 22.6 73.5
6 Province Six 113 5.6 79.1
7 Province Seven 419 20.9 100.0
8 Total 2009 100.0
Source: Field data, 2015/16
19 | P a g e
2.1.3 Ethnicity of Respondents Graduates are also categorized as per 8 ethnicity or caste groups. On the total, majority of traced
graduates were from hill Brahmin/Chhetri group, which occupies 58.1% of the pie followed by
hill Janajati 21.5% and Tarai Janajati 10.7%. Rest of the ethnic groups such as Hill Dalit, Tarai
Dalit, Madhesi Middle Cast and Muslim have found very negligible representation in the sample
which is more or less similar with the real situation.
Table 2.3: Caste Group/Ethnicity of traced graduates
SN Caste Group Graduates Number Percent
1 Hill Brahmin/Chhetri 1168 58.1
2 Terai Brahmin/Chhetri 11 5
3 Hill Dalit 46 2.3
4 Tarai Dalit 33 1.6
5 Hill Janajati 432 21.5
6 Terai Janajati 214 10.7
7 Madhesi Middle Caste 100 5.0
8 Muslim 5 0.2
Total 2009 100
Source: Field data CTEVT, 2015/16
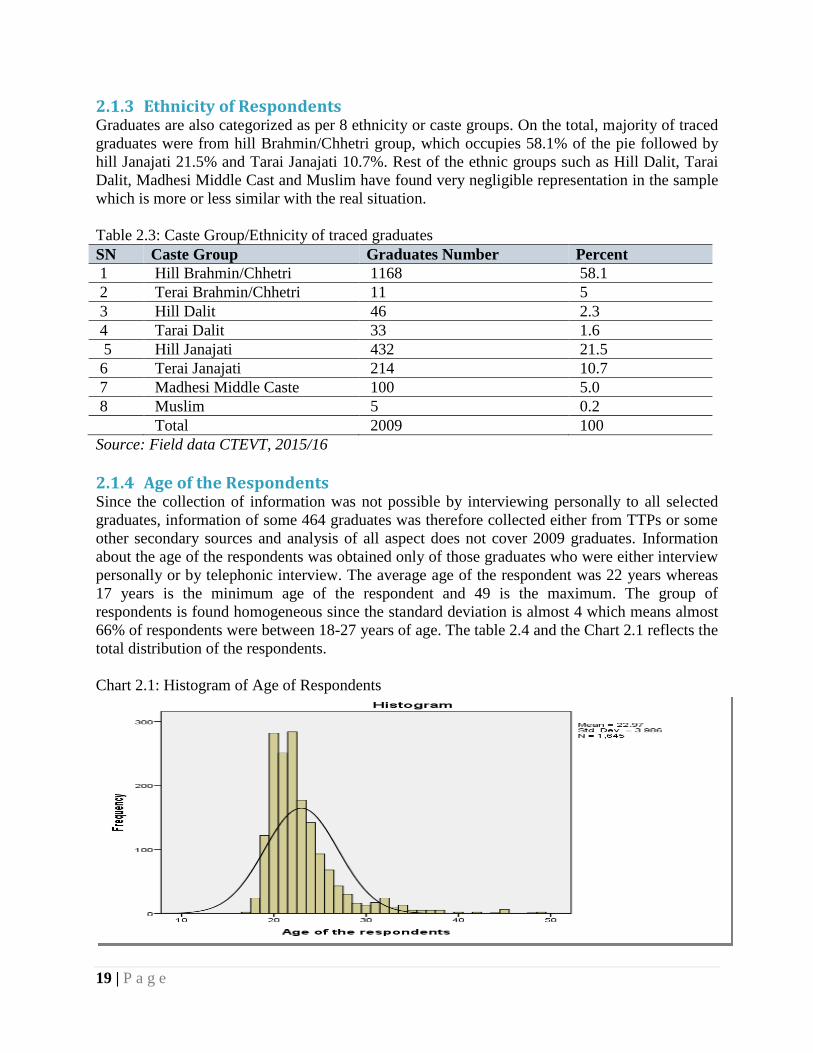
2.1.4 Age of the Respondents Since the collection of information was not possible by interviewing personally to all selected
graduates, information of some 464 graduates was therefore collected either from TTPs or some
other secondary sources and analysis of all aspect does not cover 2009 graduates. Information
about the age of the respondents was obtained only of those graduates who were either interview
personally or by telephonic interview. The average age of the respondent was 22 years whereas
17 years is the minimum age of the respondent and 49 is the maximum. The group of
respondents is found homogeneous since the standard deviation is almost 4 which means almost
66% of respondents were between 18-27 years of age. The table 2.4 and the Chart 2.1 reflects the
total distribution of the respondents.
Chart 2.1: Histogram of Age of Respondents

20 | P a g e
Table 2.4: Age Group of Graduates
Number of
Cases
Minimum
Age
Maximum
Age
Mean
Age
Standard Deviation
(Deviation from Mean)
Age of the
Graduates
1645 17 49 22.97 3.987
Valid N
(listwise)
1645
2.1.5 General Profile of the Employers: Beside post training information of the graduates, information about the performance level of the
graduates was also collected from the respective supervisors or employers' of the wage-employed
graduates. Despite previous plan to interview 33% employers of the paid employed graduates, 35
employers could be contacted and interviewed because of the political unrest, difficult situation
of the country due to the earthquake and undeclared stumbling blockade in the border. The large
majority (62.86%) of employers'-organization were private sector organization followed by
government organization (20%), NGO (11.43%) and Cooperative (5.71). The detail breakdown
of legal status of respondents is given in Table 2.5.
Table 2.5: Employer Organization by Legal Status
SN Nature of Organization Number Percent Remarks
1 Government 7 20.00
2 Non-government 4 11.43
3 Private 22 62.86
4 Co-operative 2 5.71
5 Total 35 100
The employer’s organizations are also classified as per the economic sector. In this classification,
large majority (77.15) of employers' organization were accumulated under Health and Social
Service Sector, followed by Education Sector 11.43%, Agriculture Sector (2.86%) and
Construction 2.86%. None of the employers were interviewed from Manufacturing sector. The
detail of the sector wise distribution is depicted in Table 2.6.
Table 2.6: Employer Organization by Economic Sector
SN Sector of Employer Number of employers Percent Remarks
1 Agriculture 3 8.57
2 Construction 1 2.86
3 Education 4 11.43
4 Health and Social Work 27 77.15
5 Total 35 100
2.2 Employment status of graduates This topics includes the analysis on employment status of graduates among various groups
including types and nature of employment, transition periods, role of soft skills getting
employment. Although information regarding employment status were gathered from all 2009
traced graduates, other information was missing of those graduates whose employment status
was gathered from secondary sources.
21 | P a g e
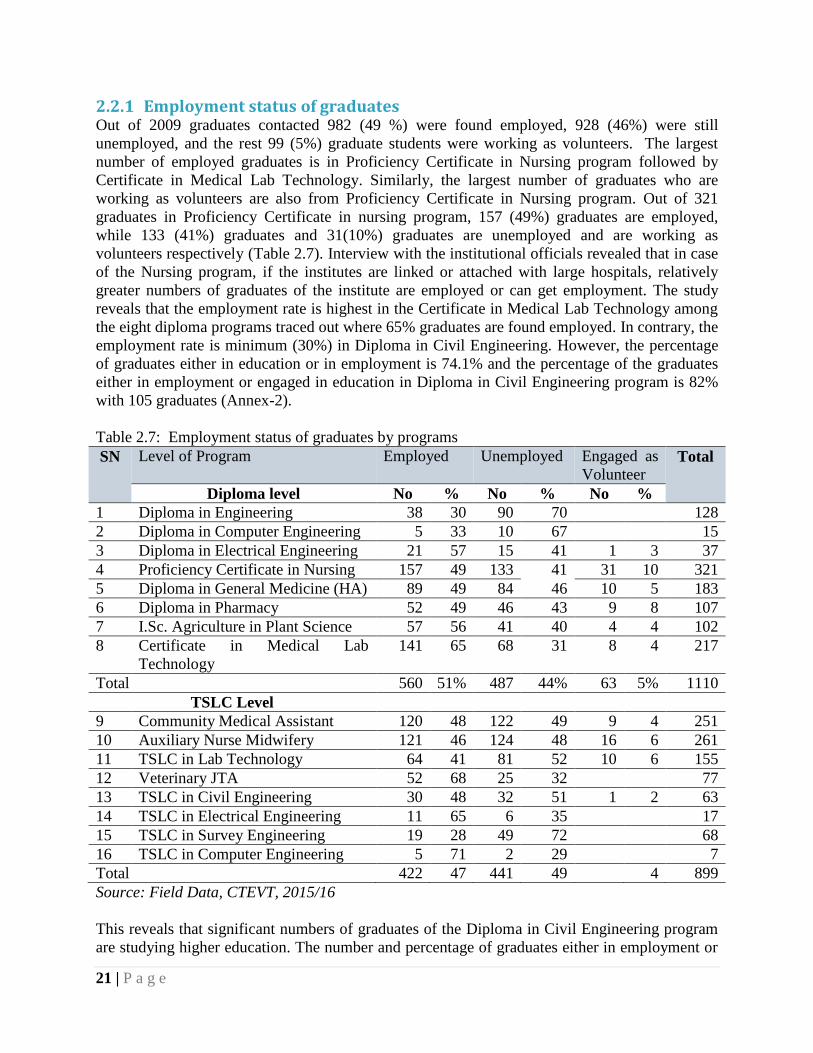
2.2.1 Employment status of graduates Out of 2009 graduates contacted 982 (49 %) were found employed, 928 (46%) were still
unemployed, and the rest 99 (5%) graduate students were working as volunteers. The largest
number of employed graduates is in Proficiency Certificate in Nursing program followed by
Certificate in Medical Lab Technology. Similarly, the largest number of graduates who are
working as volunteers are also from Proficiency Certificate in Nursing program. Out of 321
graduates in Proficiency Certificate in nursing program, 157 (49%) graduates are employed,
while 133 (41%) graduates and 31(10%) graduates are unemployed and are working as
volunteers respectively (Table 2.7). Interview with the institutional officials revealed that in case
of the Nursing program, if the institutes are linked or attached with large hospitals, relatively
greater numbers of graduates of the institute are employed or can get employment. The study
reveals that the employment rate is highest in the Certificate in Medical Lab Technology among
the eight diploma programs traced out where 65% graduates are found employed. In contrary, the
employment rate is minimum (30%) in Diploma in Civil Engineering. However, the percentage
of graduates either in education or in employment is 74.1% and the percentage of the graduates
either in employment or engaged in education in Diploma in Civil Engineering program is 82%
with 105 graduates (Annex-2).
Table 2.7: Employment status of graduates by programs
SN Level of Program Employed Unemployed Engaged as
Volunteer Total
Diploma level No % No % No %
1 Diploma in Engineering 38 30 90 70 128
2 Diploma in Computer Engineering 5 33 10 67 15
3 Diploma in Electrical Engineering 21 57 15 41 1 3 37
4 Proficiency Certificate in Nursing 157 49 133 41 31 10 321
5 Diploma in General Medicine (HA) 89 49 84 46 10 5 183
6 Diploma in Pharmacy 52 49 46 43 9 8 107
7 I.Sc. Agriculture in Plant Science 57 56 41 40 4 4 102
8 Certificate in Medical Lab
Technology
141 65 68 31 8 4 217
Total 560 51% 487 44% 63 5% 1110
TSLC Level
9 Community Medical Assistant 120 48 122 49 9 4 251
10 Auxiliary Nurse Midwifery 121 46 124 48 16 6 261
11 TSLC in Lab Technology 64 41 81 52 10 6 155
12 Veterinary JTA 52 68 25 32 77
13 TSLC in Civil Engineering 30 48 32 51 1 2 63
14 TSLC in Electrical Engineering 11 65 6 35 17
15 TSLC in Survey Engineering 19 28 49 72 68
16 TSLC in Computer Engineering 5 71 2 29 7
Total 422 47 441 49 4 899
Source: Field Data, CTEVT, 2015/16
This reveals that significant numbers of graduates of the Diploma in Civil Engineering program
are studying higher education. The number and percentage of graduates either in employment or
22 | P a g e
engaged in education in each program and by program level wise is given in Annex-2 and
Annex-3 respectively. Employment opportunity may scale up after the reconstruction work
expedites. Likewise, employment rate seems highest (71%) in the TSLC in the Computer
Engineering followed by Veterinary Junior Technical Assistant (68%). However, it is difficult to
conclude the highest employment rate in TSLC in the Computer Engineering only based on the
very small number (7) of graduates traced out.
In the same way, out of 15 graduates traced from Diploma in Computer Engineering Program, 5
(33%) graduates are employed. The following Table 2.7 depicts the number and percent of the
graduates from eight diploma level program and 8 TSLC level programs who are either
employed or unemployed or are engaged as volunteers in their related training areas.
Out of 1110 traced graduates of Diploma level program 560, (50.5%) were employed, while 487
(43.9 %) were unemployed, and only 63 (5.7%) were engaged as volunteers. Normally, those
who were working as volunteers were expected to be in employed status after completing their
volunteering terms. But, as reported by the traced graduates, they do not automatically get the
job after volunteer service agreement is over. They have to sit in the competition when job
vacancies are opened. There is no guarantee that they will get the job. So when they are turned
down, they have to go to another organization as volunteers. However, Graduates working as
volunteer are given preference when vacancy announced in the same hospital.
Likewise, 422 (46.9%) traced graduates of TSLC level programs were employed, and 441 and 36
graduates were either unemployed or were working as volunteers respectively.
Comparing the employment status between the diploma level graduates and TSLC level
graduates, more graduates of TSLC level program were unemployed, and more graduates of
Diploma level program were engaged as volunteers. According of qualitative information during
the field visit, the TSLC level graduates of Health trade (i.e. ANMs and CMAs) are being
replaced by Diploma level graduates such as Staff Nurse and Health Assistant. In the job also
employers are ready to take Diploma level graduates than TSLC level graduates, because the
formers have more skill and knowledge than the graduates of TSLC level. Due to this, TSLC
graduates are losing job opportunities. Staff nurse are working in the salary of ANM. However,
in private sector, CMA/ANM is working in position of staff nurse. The following Table 2.8
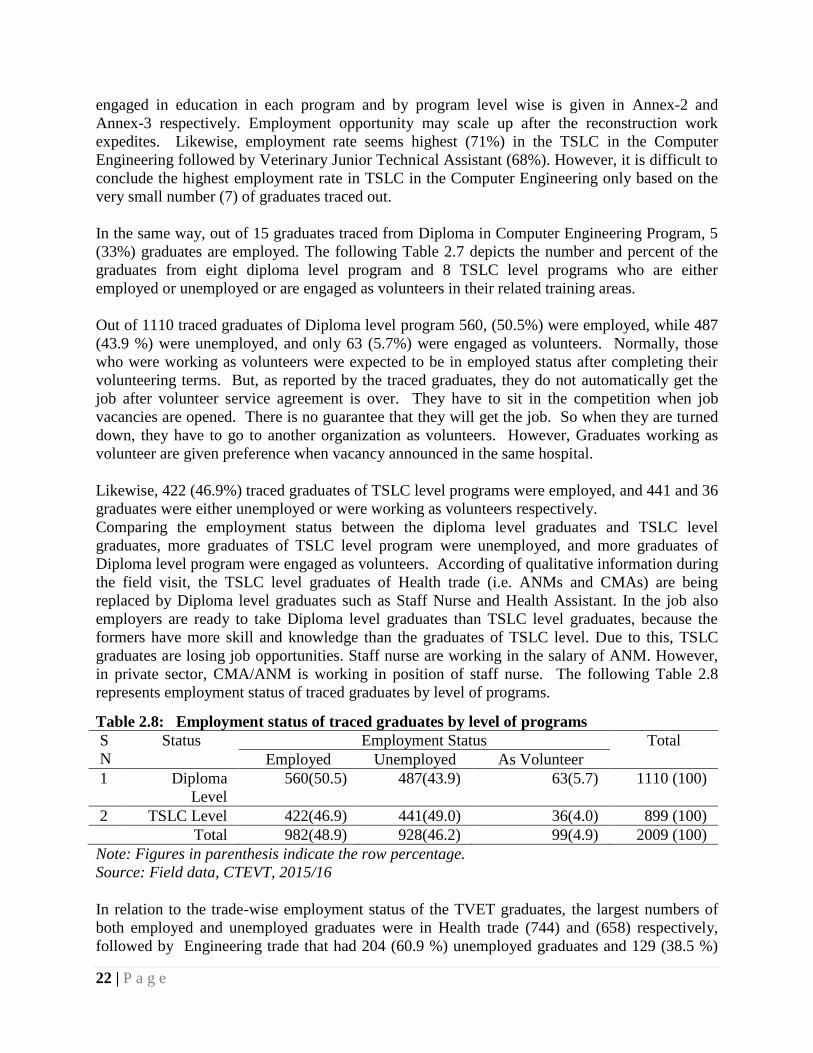
represents employment status of traced graduates by level of programs.
Table 2.8: Employment status of traced graduates by level of programs
S
N
Status Employment Status Total
Employed Unemployed As Volunteer
1 Diploma
Level
560(50.5) 487(43.9) 63(5.7) 1110 (100)
2 TSLC Level 422(46.9) 441(49.0) 36(4.0) 899 (100)
Total 982(48.9) 928(46.2) 99(4.9) 2009 (100)
Note: Figures in parenthesis indicate the row percentage.
Source: Field data, CTEVT, 2015/16
In relation to the trade-wise employment status of the TVET graduates, the largest numbers of
both employed and unemployed graduates were in Health trade (744) and (658) respectively,
followed by Engineering trade that had 204 (60.9 %) unemployed graduates and 129 (38.5 %)

23 | P a g e
employed out of 335 graduates traced. Similarly, the highest number of graduates (93) working
as volunteers were also from Health trade. Table 2.9 shows the trade-wise number of graduates
who are either employed or unemployed, and are working as volunteers.
Table 2.9: Trade-wise employment status of graduates
Trade Group Employment Status Total
Employed Unemployed As Volunteer
1 Engineering Group 129(38.5) 204(60.9) 2(0.6) 335(100)
2 Health Group 744(49.8) 658(44) 93(6.2) 1495(100)
3 Agriculture Group 109(60.9) 66(36.9) 4(2.2) 179(100)
4 Total 982(48.9) 928(46.2) 99(4.9) 2009(100)
Note: Figures in parenthesis indicate the row percentage.
Source: Field data, CTEVT, 2015/16
During field visit, it was observed that there were cases of Staff Nurses who were compelled to
work as volunteer for 6 months to one year. They have to work either as volunteer or to work in
the salary of ANM, which is one level low status job, even after completing volunteering service
agreement. It was also found that staff nurses are under paid with up to NRs. 4500.
Remuneration in private hospitals is low.
Looking at the employment status of TVET graduates among the seven Provinces of the country,
Province five had the highest number and rate of employed TVET graduates where 256 (56.3%)
are employed. Then comes Province one with 255 (53.6%) employed graduates. In case of
unemployed TVET graduates, Province seven had the highest number and rate of unemployed
graduates (259) among the traced graduates followed by Province One with 194 unemployed
graduates. Unemployment rate of TVET graduates in province 7 is 61.8 %. Similarly, province
five had the highest number of graduates working as volunteers. Then comes Province one with
27 numbers of graduates working as volunteers. The following Table 2.10 represents the status
of employment of traced TVET graduates in each seven provinces.
Table 2.10: Province-wise employment status of TEVT graduates
SN Name of Province Employment Status Total
Employed Unemployed Volunteers
1 Province One 255 (53.6) 194(40.8) 27(5.70) 476(100)2
2 Province Two 56(50.9) 53(48.2) 1(0.9) 110(100)
3 Province Three 123(48) 113(44.1) 20(7.8) 256(100)
4 Province Four 81(45) 84(46.7) 15(8.3) 180(100)
5 Province Five 256(56.3) 170(37.4) 29(6.4) 455(100)
6 Province Six 56(49.6) 55(48.7) 2(1.8) 113(100)
7 Province Seven 155(37) 259(61.8) 5(1.2) 419(100)
Total 982(48.9) 928(46.2) 99(4.9) 2009(100)
Note: Figures in parenthesis indicate the row percentage.
Source: Field data, CTEVT, 2015/16
24 | P a g e
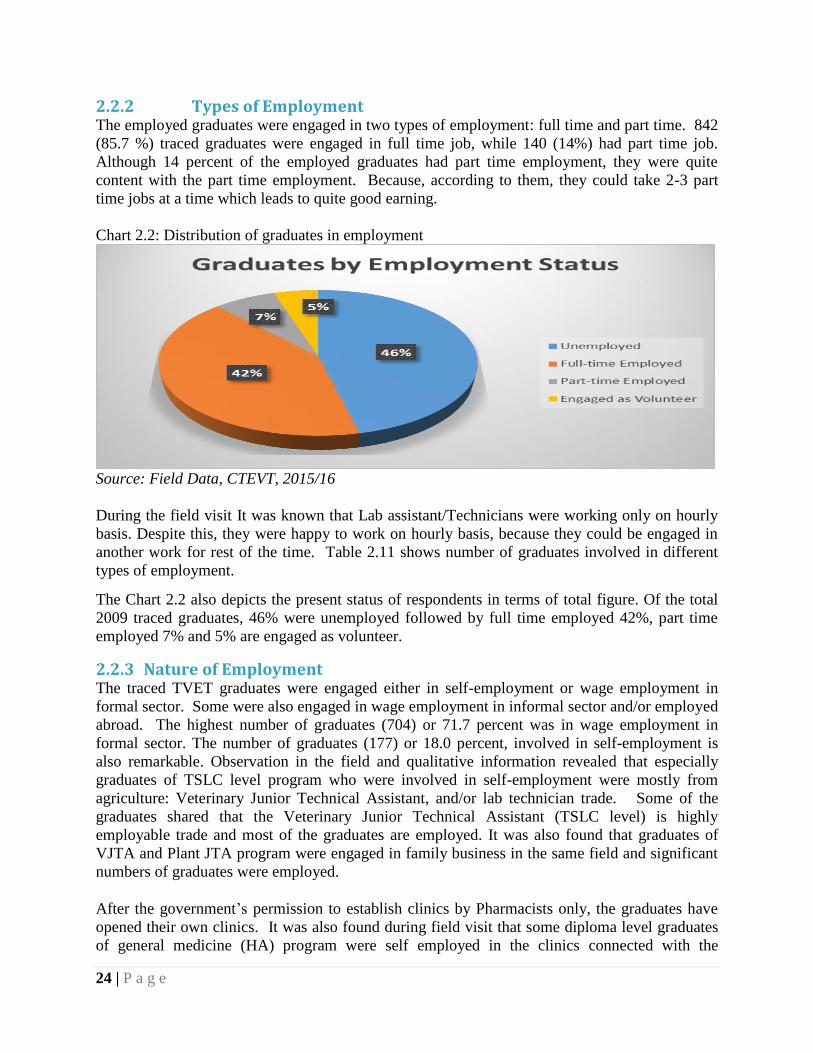
2.2.2 Types of Employment The employed graduates were engaged in two types of employment: full time and part time. 842
(85.7 %) traced graduates were engaged in full time job, while 140 (14%) had part time job.
Although 14 percent of the employed graduates had part time employment, they were quite
content with the part time employment. Because, according to them, they could take 2-3 part
time jobs at a time which leads to quite good earning.
Chart 2.2: Distribution of graduates in employment
Source: Field Data, CTEVT, 2015/16
During the field visit It was known that Lab assistant/Technicians were working only on hourly
basis. Despite this, they were happy to work on hourly basis, because they could be engaged in
another work for rest of the time. Table 2.11 shows number of graduates involved in different
types of employment.
The Chart 2.2 also depicts the present status of respondents in terms of total figure. Of the total
2009 traced graduates, 46% were unemployed followed by full time employed 42%, part time
employed 7% and 5% are engaged as volunteer.
2.2.3 Nature of Employment The traced TVET graduates were engaged either in self-employment or wage employment in
formal sector. Some were also engaged in wage employment in informal sector and/or employed
abroad. The highest number of graduates (704) or 71.7 percent was in wage employment in
formal sector. The number of graduates (177) or 18.0 percent, involved in self-employment is
also remarkable. Observation in the field and qualitative information revealed that especially
graduates of TSLC level program who were involved in self-employment were mostly from
agriculture: Veterinary Junior Technical Assistant, and/or lab technician trade. Some of the
graduates shared that the Veterinary Junior Technical Assistant (TSLC level) is highly
employable trade and most of the graduates are employed. It was also found that graduates of
VJTA and Plant JTA program were engaged in family business in the same field and significant
numbers of graduates were employed.
After the government’s permission to establish clinics by Pharmacists only, the graduates have
opened their own clinics. It was also found during field visit that some diploma level graduates
of general medicine (HA) program were self employed in the clinics connected with the
25 | P a g e
pharmacists, while some others were employed in NGOs and INGOs. Earning of a pharmacist
falls in the range of NRs. 15000 to NRs. 30000.
In the engineering field graduates were found working as contractor, and on part-time basis. It
was also revealed that there is greater possibility of engineering graduates to get job in the
earthquake affected 14 districts as the re-construction is being started. Normally salary range is
from NRs. 15000- NRs. 30000. It exceeds in INGOs.
There is no specified employment opportunity available in computer engineering trade. It was
found that very few graduates are wage employed. Some graduates have established computer
items selling business and are self employed. Some of them are engaged in developing software
like accounting software. Very few graduates are employed as trainer as well. Table 2.11 shows
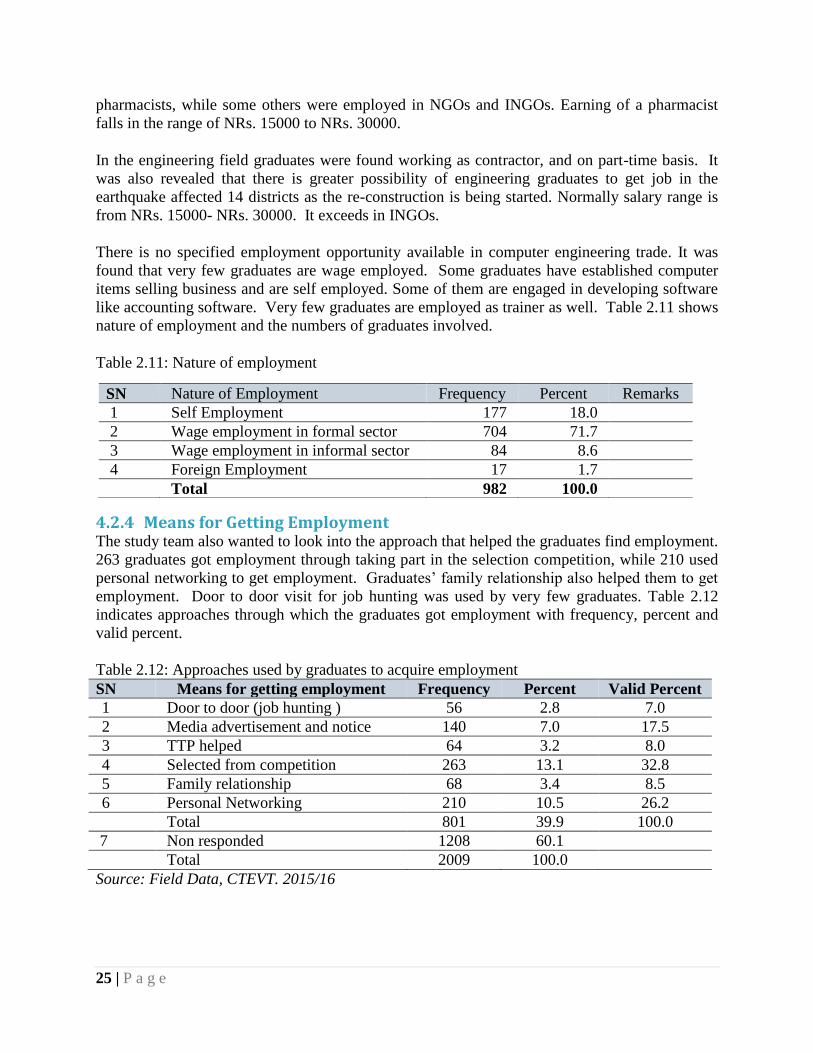
nature of employment and the numbers of graduates involved.
Table 2.11: Nature of employment
4.2.4 Means for Getting Employment The study team also wanted to look into the approach that helped the graduates find employment.
263 graduates got employment through taking part in the selection competition, while 210 used
personal networking to get employment. Graduates’ family relationship also helped them to get
employment. Door to door visit for job hunting was used by very few graduates. Table 2.12
indicates approaches through which the graduates got employment with frequency, percent and
valid percent.
Table 2.12: Approaches used by graduates to acquire employment
SN Means for getting employment Frequency Percent Valid Percent
1 Door to door (job hunting ) 56 2.8 7.0
2 Media advertisement and notice 140 7.0 17.5
3 TTP helped 64 3.2 8.0
4 Selected from competition 263 13.1 32.8
5 Family relationship 68 3.4 8.5
6 Personal Networking 210 10.5 26.2
Total 801 39.9 100.0
7 Non responded 1208 60.1
Total 2009 100.0
Source: Field Data, CTEVT. 2015/16
SN Nature of Employment Frequency Percent Remarks
1 Self Employment 177 18.0
2 Wage employment in formal sector 704 71.7
3 Wage employment in informal sector 84 8.6
4 Foreign Employment 17 1.7
Total 982 100.0
26 | P a g e
2.2.5 Status of Unemployed graduates Out of 928 unemployed graduates, 441 were from TSLC level program and 487 were from
Diploma level programs. Among these 928 unemployed graduates, 458 were still searching for
job, while 227 went for further study instead of looking for job, because they preferred to pursue
higher education to get higher level job rather than to stick on lower level job with their current
certificate level. This means, the unemployed graduates of Diploma level programs were
pursuing for Bachelor in Nursing, and graduates of TSLC level program were going in for
Diploma level course.
Some of the traced graduates have started higher education due to unavailability of job in the
field they studied. Significant numbers of graduates of General Medicine (HA) program of
Diploma level are also engaged in further study mostly in BPH (Bachelor in Public Health).
Likewise, 30 graduates were preparing for public service commission examination, and 19 were
preparing to open their own business. Graduates from lab technology program and Veterinary
Junior Technical Assistant program were willing to open their own business. During the field
visit, it was found that some graduates of these two programs had opened their own veterinary
clinic and laboratory in small scale and in partnership with 1 or 2 friends from same program.
They were happy with their job and the earning. Although the percentage of those graduates
who were willing to go for own business is very small, their effort is very appreciable. The
objective of TVET is to prepare youth not only for formal job, but for informal job as well.
These graduates of TVET programs were fulfilling the objectives of TVET. Following Table
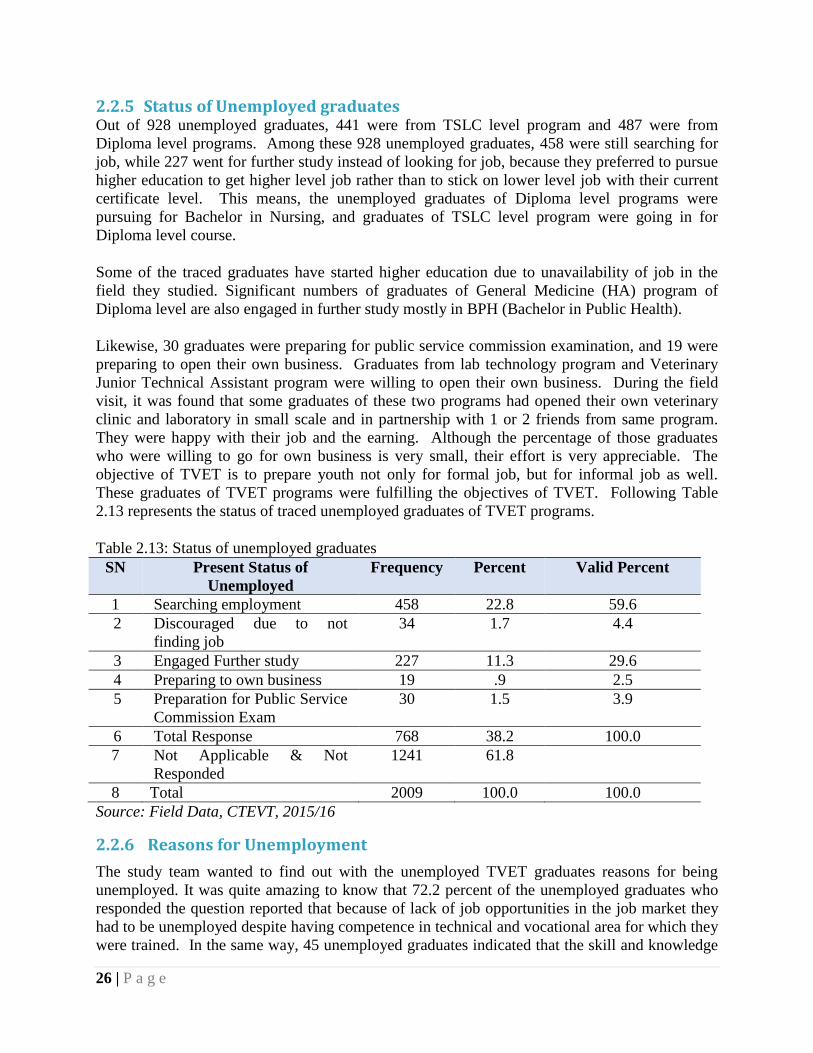
2.13 represents the status of traced unemployed graduates of TVET programs.
Table 2.13: Status of unemployed graduates
SN Present Status of
Unemployed
Frequency Percent Valid Percent
1 Searching employment 458 22.8 59.6
2 Discouraged due to not
finding job
34 1.7 4.4
3 Engaged Further study 227 11.3 29.6
4 Preparing to own business 19 .9 2.5
5 Preparation for Public Service
Commission Exam
30 1.5 3.9
6 Total Response 768 38.2 100.0
7 Not Applicable & Not
Responded
1241 61.8
8 Total 2009 100.0 100.0
Source: Field Data, CTEVT, 2015/16
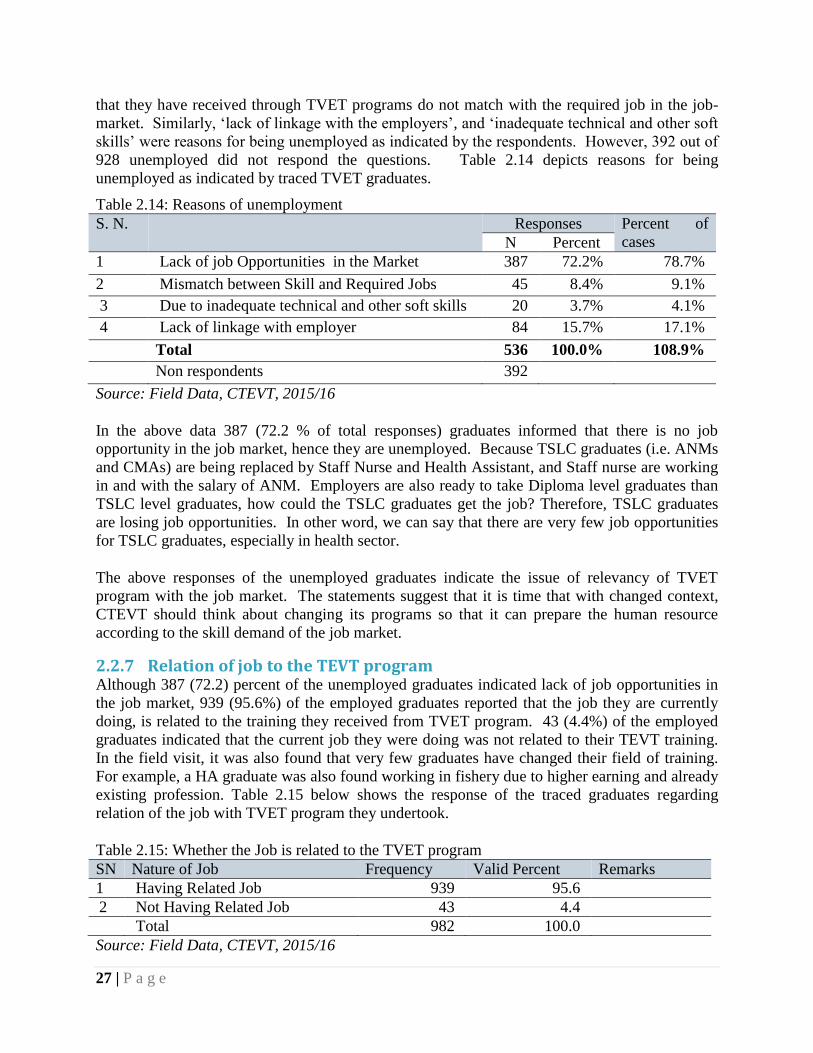
2.2.6 Reasons for Unemployment
The study team wanted to find out with the unemployed TVET graduates reasons for being
unemployed. It was quite amazing to know that 72.2 percent of the unemployed graduates who
responded the question reported that because of lack of job opportunities in the job market they
had to be unemployed despite having competence in technical and vocational area for which they
were trained. In the same way, 45 unemployed graduates indicated that the skill and knowledge
27 | P a g e
that they have received through TVET programs do not match with the required job in the job-
market. Similarly, ‘lack of linkage with the employers’, and ‘inadequate technical and other soft
skills’ were reasons for being unemployed as indicated by the respondents. However, 392 out of
928 unemployed did not respond the questions. Table 2.14 depicts reasons for being
unemployed as indicated by traced TVET graduates.
Table 2.14: Reasons of unemployment
S. N. Responses Percent of
cases N Percent
1 Lack of job Opportunities in the Market 387 72.2% 78.7%
2 Mismatch between Skill and Required Jobs 45 8.4% 9.1%
3 Due to inadequate technical and other soft skills 20 3.7% 4.1%
4 Lack of linkage with employer 84 15.7% 17.1%
Total 536 100.0% 108.9%
Non respondents 392
Source: Field Data, CTEVT, 2015/16
In the above data 387 (72.2 % of total responses) graduates informed that there is no job
opportunity in the job market, hence they are unemployed. Because TSLC graduates (i.e. ANMs
and CMAs) are being replaced by Staff Nurse and Health Assistant, and Staff nurse are working
in and with the salary of ANM. Employers are also ready to take Diploma level graduates than
TSLC level graduates, how could the TSLC graduates get the job? Therefore, TSLC graduates
are losing job opportunities. In other word, we can say that there are very few job opportunities
for TSLC graduates, especially in health sector.
The above responses of the unemployed graduates indicate the issue of relevancy of TVET
program with the job market. The statements suggest that it is time that with changed context,
CTEVT should think about changing its programs so that it can prepare the human resource
according to the skill demand of the job market.
2.2.7 Relation of job to the TEVT program Although 387 (72.2) percent of the unemployed graduates indicated lack of job opportunities in
the job market, 939 (95.6%) of the employed graduates reported that the job they are currently
doing, is related to the training they received from TVET program. 43 (4.4%) of the employed
graduates indicated that the current job they were doing was not related to their TEVT training.
In the field visit, it was also found that very few graduates have changed their field of training.
For example, a HA graduate was also found working in fishery due to higher earning and already
existing profession. Table 2.15 below shows the response of the traced graduates regarding
relation of the job with TVET program they undertook.
Table 2.15: Whether the Job is related to the TVET program
SN Nature of Job Frequency Valid Percent Remarks
1 Having Related Job 939 95.6
2 Not Having Related Job 43 4.4
Total 982 100.0
Source: Field Data, CTEVT, 2015/16

28 | P a g e
2.2.8 Transition Period between job and completion of TVET Program The study team wanted to find out the time duration that a graduate took to get a job after
completing the TVET program (receiving certificate after final examination). Out of 982
employed graduates, 823 graduates responded to this query. According to the responses, the
graduates took about four months to get job after completing the TVET program. According to
the FGD with the officials of training institutions also it was revealed that normally, the gap
between graduation and employment is around 3 months. The data in Table 2.16 shows that the
graduates got a job after about 4 months of completing the TVET program. This means they did
not have to wait for long period to get a job. Four months is reasonable period to wait until one
gets a job after completing his/her study period.
Table 2.16: Time taken by graduates to get job (Duration in Month)
Statement N Minimum Maximum Mean Std. Deviation
Transition Period in
Months
823 0 120 8.81 14.472
Source: Field Data, CTEVT, 2015/16
2.2.9 Activities during Transition period Out of 2009 traced graduates, only 709 (35.3 percent) graduates responded when asked about the
activities they did after completing the TVET program. The rest 64.7 percent did not response to
the question. On the basis of the responses it can be scrutinized that during transition period
between completing the TVET program and getting job, 8.3 percent of the total traced graduates
preferred to pursue higher education. 3.1 percent were engaged in their own business, while 2.7
percent did volunteer work in the related field of the TVET program. During the field visit it
was found that some of the staff nurse graduates were preparing for the exam of the nursing
council and not doing the job. Those who were working as volunteers, were mostly from health
and agriculture trades. However, most of the graduates (21.2 percent) went to look for job.
Following Table 2.17 represents frequency and percentage of the different activities that the
graduates did after completion of the TVET program.
Table 2.17: Activities during transition from training to employment
S.N. Type of Activities Frequen
cy
Percent Valid
Percent
Cumulative
Percent
1 Searching for employment 426 21.2 60.1 60.1
2 Engaged in further study 166 8.3 23.4 83.5
3 Engaged in own business 63 3.1 8.9 92.4
4 Doing Volunteer 54 2.7 7.6 100.0
5 Total 709 35.3 100.0
6 Not responded 1300 64.7
7 Total 2009 100.0
Source: Field Data, CTEVT, 2015/16
2.2.10 Holding More than One Job In response to the query whether the graduates hold more than one job at the moment 128 (6.4
percent) out of 779 graduates said that they hold more than one job at the moment. 651

29 | P a g e
graduates denied holding more than one job at present. Rest of the graduates i.e. 203 (20.7) out
of 982 (excluding unemployed graduates) did not respond the query.
It was also found that those who said that they were holding more than one job are the graduates
doing part time job. Those graduates doing part time employment were quite happy with the part
time employment. Because, according to them, they could take 2-3 part time jobs at a time
which gave them quite good earning. Especially graduates from health trades were holding more
than one job. Table 2.18 gives frequency and percent of the response that show number of
graduates holding more than one job at present.
Table 2.18: Graduates holding more than one job
S. N. Response Frequency Percent
1 Holding more than one job 128 13.0
2 Holding only one job 651 66.3
3 Total 779 79.3
4 Not Responded 203 20.7
Total 982 100.0
Source: Field Data, CTEVT, 2015/16
2.2.11 Soft Skill – how much important for employment? The graduates were also asked whether any soft skills were instrumental for getting employment
or to retain in the employment, 452 (55.5 percent) graduates out of 814 responses indicated
significance of soft skills for employment. On the contrary, 362 (44.5 percent) graduates
reported that soft skills are not important in employment. Rest 168 graduates did not response
to this question.
Likewise, communication skill was regarded as the most important soft skill by 295 (39.4
percent) graduates out of 749 respondents. 187 (25 percent) graduates pointed out that an
employee should have positive attitude and honesty in employment. In the same way,
interpersonal skill as well as English language also play vital role in maintaining good
performance in employment. 233 graduates did not response the question. Table 2.19 indicates
number and percentage of responses on the importance of four different types of soft skills.
Table 2.19: Types of soft skills and its importance given by graduates
S.N. Types of Soft Skills Responses Percent of Cases
(Distribution of 456) Number Percent
1 English Language 105 14.0% 23.2%
2 Communication Skill 295 39.4% 65.1%
3 Interpersonal Skill 162 21.6% 35.8%
4 Honesty Attitude 187 25.0% 41.3%
Total 749 100.0% 165.3%
Non- respondents 233
Source : Field Data, CTEVT, 2015/16
2.3 Income Level and Its Variation The employed graduates were further asked about their income status. Out of the 982 employed
graduates, only 814 graduates reported their income level. Large variation was found in the
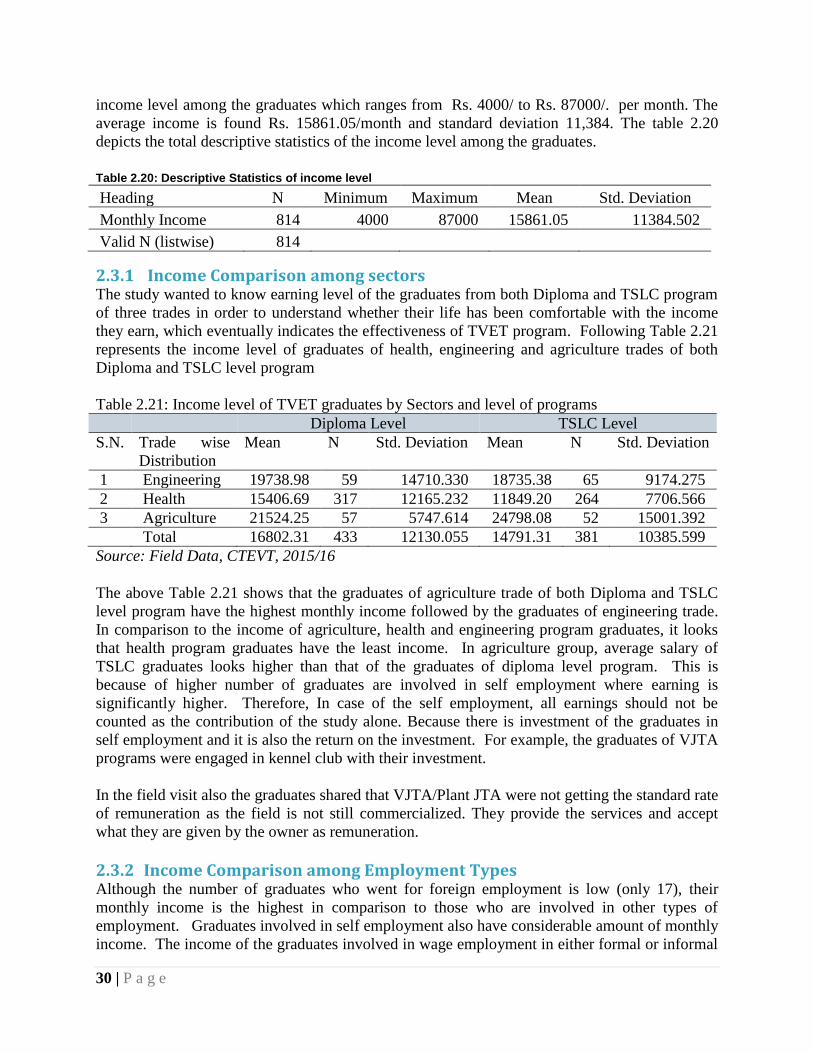
30 | P a g e
income level among the graduates which ranges from Rs. 4000/ to Rs. 87000/. per month. The
average income is found Rs. 15861.05/month and standard deviation 11,384. The table 2.20
depicts the total descriptive statistics of the income level among the graduates.
Table 2.20: Descriptive Statistics of income level
Heading N Minimum Maximum Mean Std. Deviation
Monthly Income 814 4000 87000 15861.05 11384.502
Valid N (listwise) 814
2.3.1 Income Comparison among sectors The study wanted to know earning level of the graduates from both Diploma and TSLC program
of three trades in order to understand whether their life has been comfortable with the income
they earn, which eventually indicates the effectiveness of TVET program. Following Table 2.21
represents the income level of graduates of health, engineering and agriculture trades of both
Diploma and TSLC level program
Table 2.21: Income level of TVET graduates by Sectors and level of programs
Diploma Level TSLC Level
S.N. Trade wise
Distribution
Mean N Std. Deviation Mean N Std. Deviation
1 Engineering 19738.98 59 14710.330 18735.38 65 9174.275
2 Health 15406.69 317 12165.232 11849.20 264 7706.566
3 Agriculture 21524.25 57 5747.614 24798.08 52 15001.392
Total 16802.31 433 12130.055 14791.31 381 10385.599
Source: Field Data, CTEVT, 2015/16
The above Table 2.21 shows that the graduates of agriculture trade of both Diploma and TSLC
level program have the highest monthly income followed by the graduates of engineering trade.
In comparison to the income of agriculture, health and engineering program graduates, it looks
that health program graduates have the least income. In agriculture group, average salary of
TSLC graduates looks higher than that of the graduates of diploma level program. This is
because of higher number of graduates are involved in self employment where earning is
significantly higher. Therefore, In case of the self employment, all earnings should not be
counted as the contribution of the study alone. Because there is investment of the graduates in
self employment and it is also the return on the investment. For example, the graduates of VJTA
programs were engaged in kennel club with their investment.
In the field visit also the graduates shared that VJTA/Plant JTA were not getting the standard rate
of remuneration as the field is not still commercialized. They provide the services and accept
what they are given by the owner as remuneration.
2.3.2 Income Comparison among Employment Types Although the number of graduates who went for foreign employment is low (only 17), their
monthly income is the highest in comparison to those who are involved in other types of
employment. Graduates involved in self employment also have considerable amount of monthly
income. The income of the graduates involved in wage employment in either formal or informal
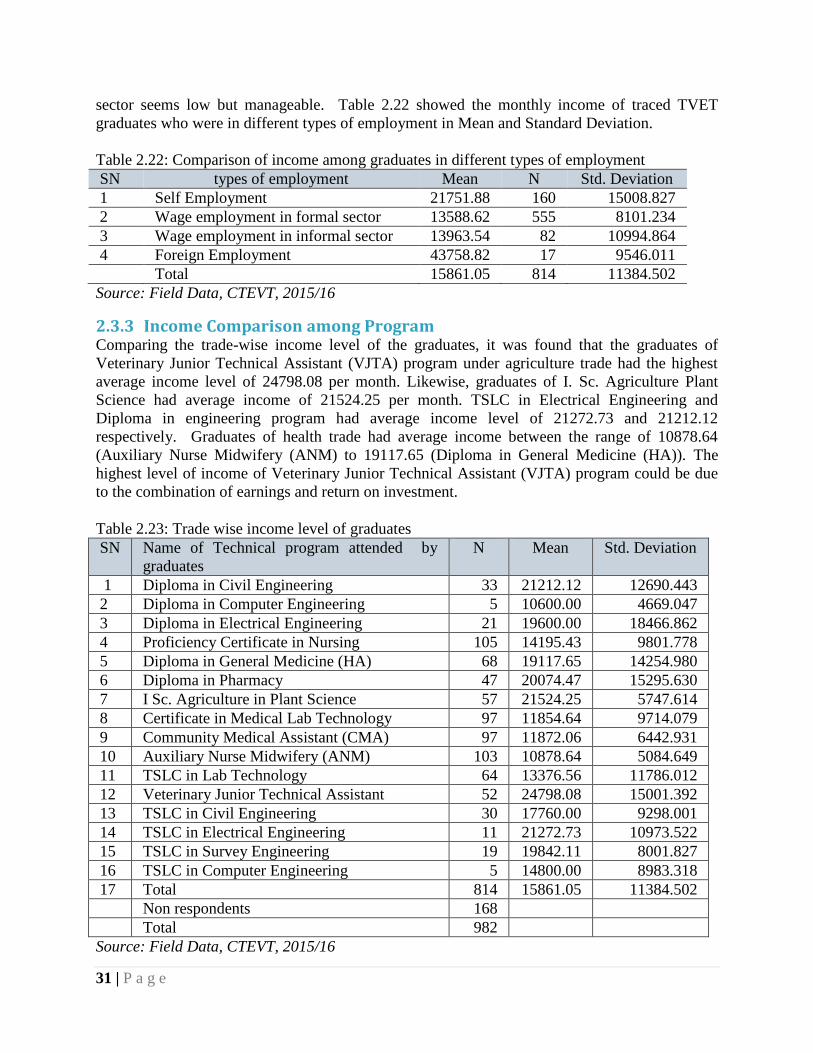
31 | P a g e
sector seems low but manageable. Table 2.22 showed the monthly income of traced TVET
graduates who were in different types of employment in Mean and Standard Deviation.
Table 2.22: Comparison of income among graduates in different types of employment
SN types of employment Mean N Std. Deviation
1 Self Employment 21751.88 160 15008.827
2 Wage employment in formal sector 13588.62 555 8101.234
3 Wage employment in informal sector 13963.54 82 10994.864
4 Foreign Employment 43758.82 17 9546.011
Total 15861.05 814 11384.502
Source: Field Data, CTEVT, 2015/16
2.3.3 Income Comparison among Program Comparing the trade-wise income level of the graduates, it was found that the graduates of
Veterinary Junior Technical Assistant (VJTA) program under agriculture trade had the highest
average income level of 24798.08 per month. Likewise, graduates of I. Sc. Agriculture Plant
Science had average income of 21524.25 per month. TSLC in Electrical Engineering and
Diploma in engineering program had average income level of 21272.73 and 21212.12
respectively. Graduates of health trade had average income between the range of 10878.64
(Auxiliary Nurse Midwifery (ANM) to 19117.65 (Diploma in General Medicine (HA)). The
highest level of income of Veterinary Junior Technical Assistant (VJTA) program could be due
to the combination of earnings and return on investment.
Table 2.23: Trade wise income level of graduates
SN Name of Technical program attended by
graduates
N Mean Std. Deviation
1 Diploma in Civil Engineering 33 21212.12 12690.443
2 Diploma in Computer Engineering 5 10600.00 4669.047
3 Diploma in Electrical Engineering 21 19600.00 18466.862
4 Proficiency Certificate in Nursing 105 14195.43 9801.778
5 Diploma in General Medicine (HA) 68 19117.65 14254.980
6 Diploma in Pharmacy 47 20074.47 15295.630
7 I Sc. Agriculture in Plant Science 57 21524.25 5747.614
8 Certificate in Medical Lab Technology 97 11854.64 9714.079
9 Community Medical Assistant (CMA) 97 11872.06 6442.931
10 Auxiliary Nurse Midwifery (ANM) 103 10878.64 5084.649
11 TSLC in Lab Technology 64 13376.56 11786.012
12 Veterinary Junior Technical Assistant 52 24798.08 15001.392
13 TSLC in Civil Engineering 30 17760.00 9298.001
14 TSLC in Electrical Engineering 11 21272.73 10973.522
15 TSLC in Survey Engineering 19 19842.11 8001.827
16 TSLC in Computer Engineering 5 14800.00 8983.318
17 Total 814 15861.05 11384.502
Non respondents 168
Total 982
Source: Field Data, CTEVT, 2015/16
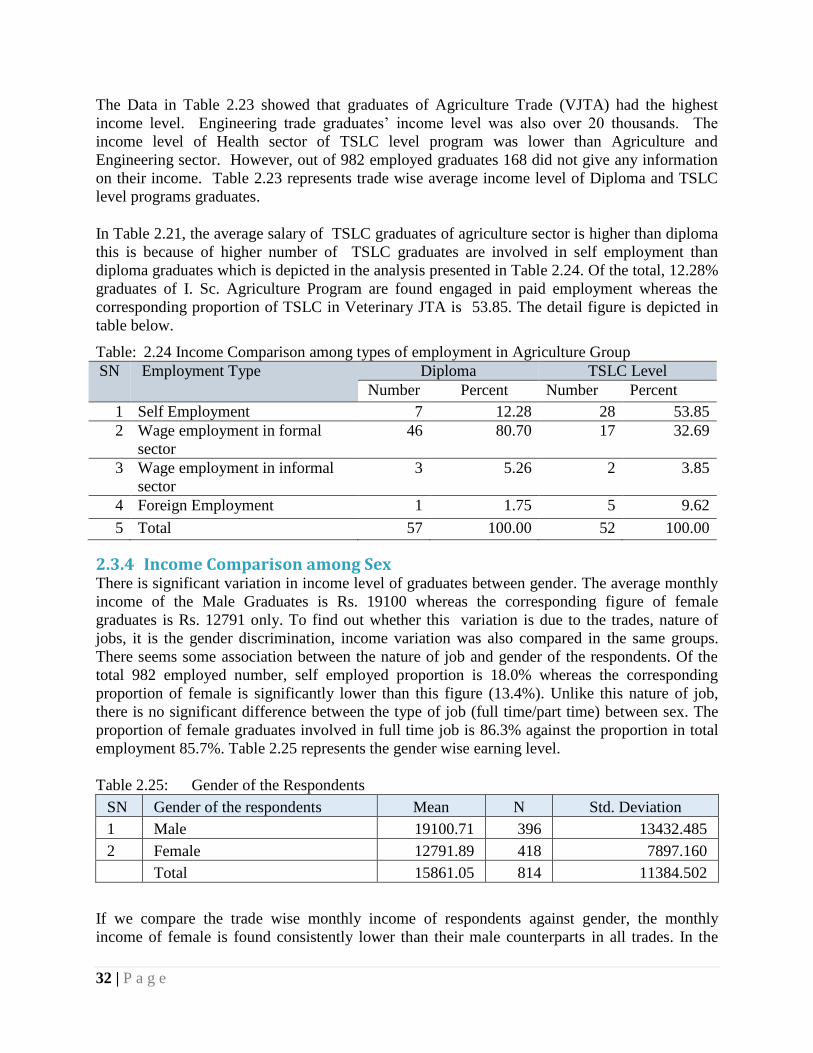
32 | P a g e
The Data in Table 2.23 showed that graduates of Agriculture Trade (VJTA) had the highest
income level. Engineering trade graduates’ income level was also over 20 thousands. The
income level of Health sector of TSLC level program was lower than Agriculture and
Engineering sector. However, out of 982 employed graduates 168 did not give any information
on their income. Table 2.23 represents trade wise average income level of Diploma and TSLC
level programs graduates.
In Table 2.21, the average salary of TSLC graduates of agriculture sector is higher than diploma
this is because of higher number of TSLC graduates are involved in self employment than
diploma graduates which is depicted in the analysis presented in Table 2.24. Of the total, 12.28%
graduates of I. Sc. Agriculture Program are found engaged in paid employment whereas the
corresponding proportion of TSLC in Veterinary JTA is 53.85. The detail figure is depicted in
table below.
Table: 2.24 Income Comparison among types of employment in Agriculture Group
SN Employment Type Diploma TSLC Level
Number Percent Number Percent
1 Self Employment 7 12.28 28 53.85
2 Wage employment in formal
sector
46 80.70 17 32.69
3 Wage employment in informal
sector
3 5.26 2 3.85
4 Foreign Employment 1 1.75 5 9.62
5 Total 57 100.00 52 100.00
2.3.4 Income Comparison among Sex There is significant variation in income level of graduates between gender. The average monthly
income of the Male Graduates is Rs. 19100 whereas the corresponding figure of female
graduates is Rs. 12791 only. To find out whether this variation is due to the trades, nature of
jobs, it is the gender discrimination, income variation was also compared in the same groups.
There seems some association between the nature of job and gender of the respondents. Of the
total 982 employed number, self employed proportion is 18.0% whereas the corresponding
proportion of female is significantly lower than this figure (13.4%). Unlike this nature of job,
there is no significant difference between the type of job (full time/part time) between sex. The
proportion of female graduates involved in full time job is 86.3% against the proportion in total
employment 85.7%. Table 2.25 represents the gender wise earning level.
Table 2.25: Gender of the Respondents
SN Gender of the respondents Mean N Std. Deviation
1 Male 19100.71 396 13432.485
2 Female 12791.89 418 7897.160
Total 15861.05 814 11384.502
If we compare the trade wise monthly income of respondents against gender, the monthly
income of female is found consistently lower than their male counterparts in all trades. In the
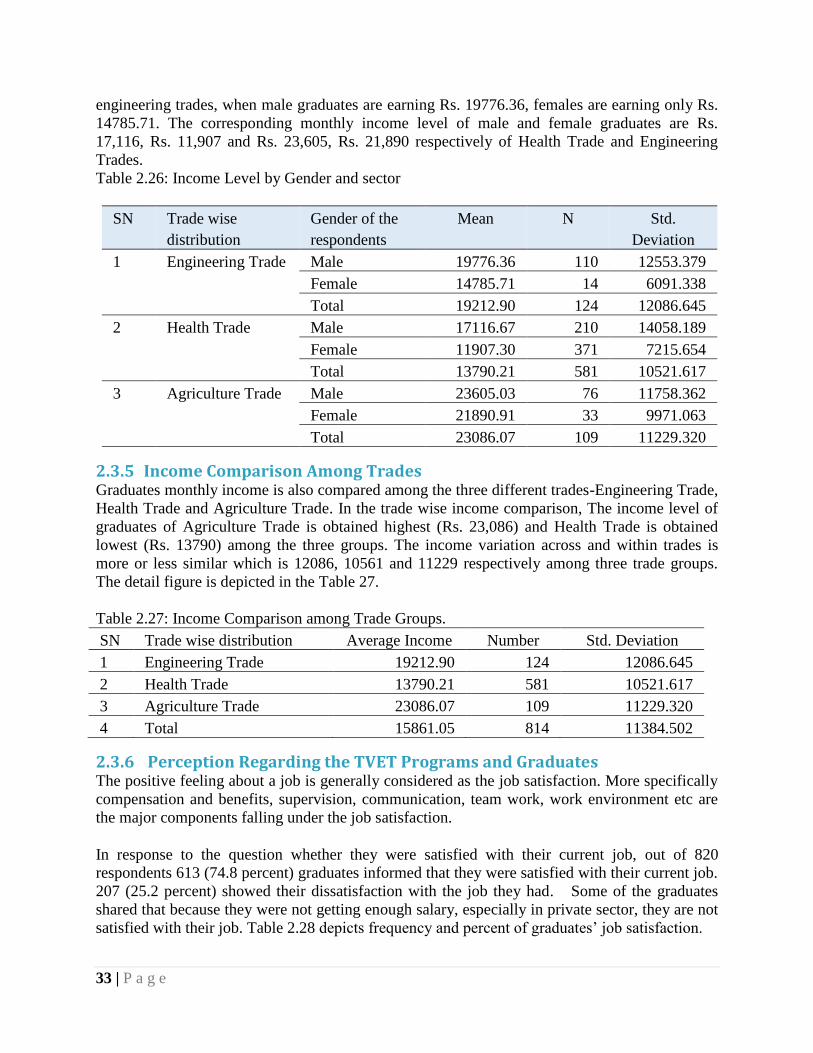
33 | P a g e
engineering trades, when male graduates are earning Rs. 19776.36, females are earning only Rs.
14785.71. The corresponding monthly income level of male and female graduates are Rs.
17,116, Rs. 11,907 and Rs. 23,605, Rs. 21,890 respectively of Health Trade and Engineering
Trades.
Table 2.26: Income Level by Gender and sector
SN Trade wise
distribution
Gender of the
respondents
Mean N Std.
Deviation
1 Engineering Trade Male 19776.36 110 12553.379
Female 14785.71 14 6091.338
Total 19212.90 124 12086.645
2 Health Trade Male 17116.67 210 14058.189
Female 11907.30 371 7215.654
Total 13790.21 581 10521.617
3 Agriculture Trade Male 23605.03 76 11758.362
Female 21890.91 33 9971.063
Total 23086.07 109 11229.320
2.3.5 Income Comparison Among Trades Graduates monthly income is also compared among the three different trades-Engineering Trade,
Health Trade and Agriculture Trade. In the trade wise income comparison, The income level of
graduates of Agriculture Trade is obtained highest (Rs. 23,086) and Health Trade is obtained
lowest (Rs. 13790) among the three groups. The income variation across and within trades is
more or less similar which is 12086, 10561 and 11229 respectively among three trade groups.
The detail figure is depicted in the Table 27.
Table 2.27: Income Comparison among Trade Groups.
SN Trade wise distribution Average Income Number Std. Deviation
1 Engineering Trade 19212.90 124 12086.645
2 Health Trade 13790.21 581 10521.617
3 Agriculture Trade 23086.07 109 11229.320
4 Total 15861.05 814 11384.502
2.3.6 Perception Regarding the TVET Programs and Graduates The positive feeling about a job is generally considered as the job satisfaction. More specifically
compensation and benefits, supervision, communication, team work, work environment etc are
the major components falling under the job satisfaction.
In response to the question whether they were satisfied with their current job, out of 820
respondents 613 (74.8 percent) graduates informed that they were satisfied with their current job.
207 (25.2 percent) showed their dissatisfaction with the job they had. Some of the graduates
shared that because they were not getting enough salary, especially in private sector, they are not
satisfied with their job. Table 2.28 depicts frequency and percent of graduates’ job satisfaction.
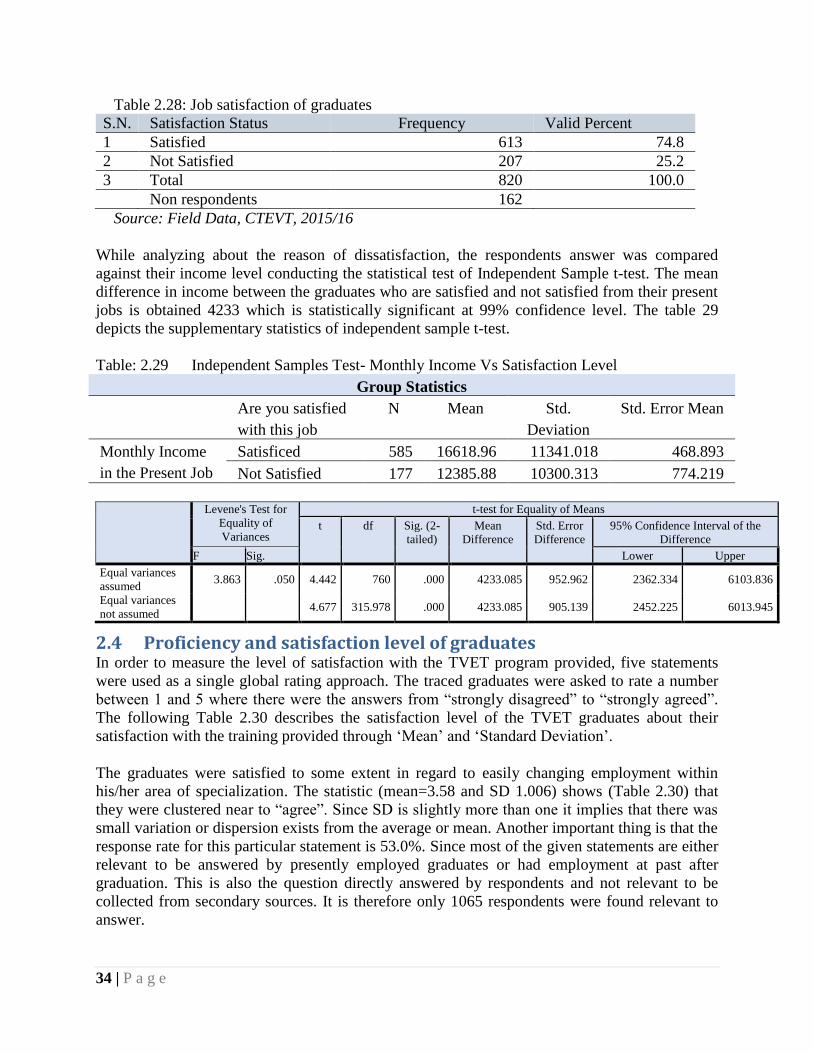
34 | P a g e
Table 2.28: Job satisfaction of graduates
S.N. Satisfaction Status Frequency Valid Percent
1 Satisfied 613 74.8
2 Not Satisfied 207 25.2
3 Total 820 100.0
Non respondents 162
Source: Field Data, CTEVT, 2015/16
While analyzing about the reason of dissatisfaction, the respondents answer was compared
against their income level conducting the statistical test of Independent Sample t-test. The mean
difference in income between the graduates who are satisfied and not satisfied from their present
jobs is obtained 4233 which is statistically significant at 99% confidence level. The table 29
depicts the supplementary statistics of independent sample t-test.
Table: 2.29 Independent Samples Test- Monthly Income Vs Satisfaction Level
Group Statistics
Are you satisfied
with this job
N Mean Std.
Deviation
Std. Error Mean
Monthly Income
in the Present Job
Satisficed 585 16618.96 11341.018 468.893
Not Satisfied 177 12385.88 10300.313 774.219
Levene's Test for
Equality of
Variances
t-test for Equality of Means
t df Sig. (2-
tailed)
Mean
Difference
Std. Error
Difference
95% Confidence Interval of the
Difference
F Sig. Lower Upper
Equal variances
assumed 3.863 .050 4.442 760 .000 4233.085 952.962 2362.334 6103.836
Equal variances
not assumed 4.677 315.978 .000 4233.085 905.139 2452.225 6013.945
2.4 Proficiency and satisfaction level of graduates In order to measure the level of satisfaction with the TVET program provided, five statements
were used as a single global rating approach. The traced graduates were asked to rate a number
between 1 and 5 where there were the answers from “strongly disagreed” to “strongly agreed”.
The following Table 2.30 describes the satisfaction level of the TVET graduates about their
satisfaction with the training provided through ‘Mean’ and ‘Standard Deviation’.
The graduates were satisfied to some extent in regard to easily changing employment within
his/her area of specialization. The statistic (mean=3.58 and SD 1.006) shows (Table 2.30) that
they were clustered near to “agree”. Since SD is slightly more than one it implies that there was
small variation or dispersion exists from the average or mean. Another important thing is that the
response rate for this particular statement is 53.0%. Since most of the given statements are either
relevant to be answered by presently employed graduates or had employment at past after
graduation. This is also the question directly answered by respondents and not relevant to be
collected from secondary sources. It is therefore only 1065 respondents were found relevant to
answer.

35 | P a g e
Table 2.30: Level of satisfaction with the skill provided
S
N
Statements N Mean Std.
Deviation
1 My training has adequately prepared me for work 1179 3.944 .89586
2 My employer is satisfied with my level of knowledge and
skill
1047 3.994 .82386
3 It is easy for me to get a job because of level of
knowledge and skill learned in the institute
1047 3.750 .99806
4 I find myself to be very effective in my current job 1006 3.854 .89599
5 I can easily change employment within my area of
specialization
1065 3.582 1.00612
6 I am being able to perform the skills required by the
job
1075 4.031 .78447
7 I am satisfied with my current job 1012 3.707 1.02463
8 I am fully satisfied with the TVET program I had 1199 3.975 .90551
9 Valid N (listwise) 917
Source: Field Data, CTEVT, 2015/16
The responses over other remaining six statements (Table 2.30) also indicates the more or less
same phenomenon like above analysis of statement one. The mean of all statements is near to 4.
It indicates that the participant graduates were clustered near to the “agree” region. The above
analysis shows that the satisfaction level of the graduates with the TVET program provided is
found acceptable. Specifically the graduates under the lab technician or lab assistant program
were not found confidence in obtained skill. However, there are many rooms for the
improvement. During field study also, it was found that the graduates of lab assistant/technician
program are lacking skills due to inadequate practical opportunities. Graduates revealed that the
practical opportunity is inadequate in all programs of the private institutes.
The graduates were satisfied in regard to being able to perform the skills required by the job.
The statistic (mean=4.0 and SD .78) shows (table 2.30) were clustered to “agree”. The response
rate of this particular statement is 53.3 %. Here again, it means out of 2009 sampled graduates
only 1075 graduates responded for this. Why the remaining graduates were not interested to rate
this particular statement? It shows that there was the problem of confidence about the skill they
obtained. Nonetheless, there is still room for improvement.
2.4.1 Satisfaction Level of Employers Regarding the Graduate's Performance Information about the satisfaction level of the employers’ on graduates’ job performance was
also collected from the respective supervisors or employers of the wage-employed graduates. In
this connection, they were asked to compare the performance of TEVT graduates with that of
other technical staffs who were trained from training institutes other than CTEVT. Out of 35
employees, 16 (61.5 percent) of them reported that there is no significant differences between the
job performances of the graduates trained at CTEVT institutions and other training institutions.
Eight employers found TVET graduates perform better than other technical staffs, while only 2
out of 26 respondents found the performance of TVET graduates poor. It can be said that TVET
graduates perform well in their job. Table 2.31 depicts responses of the employers regarding
comparison of work performance.
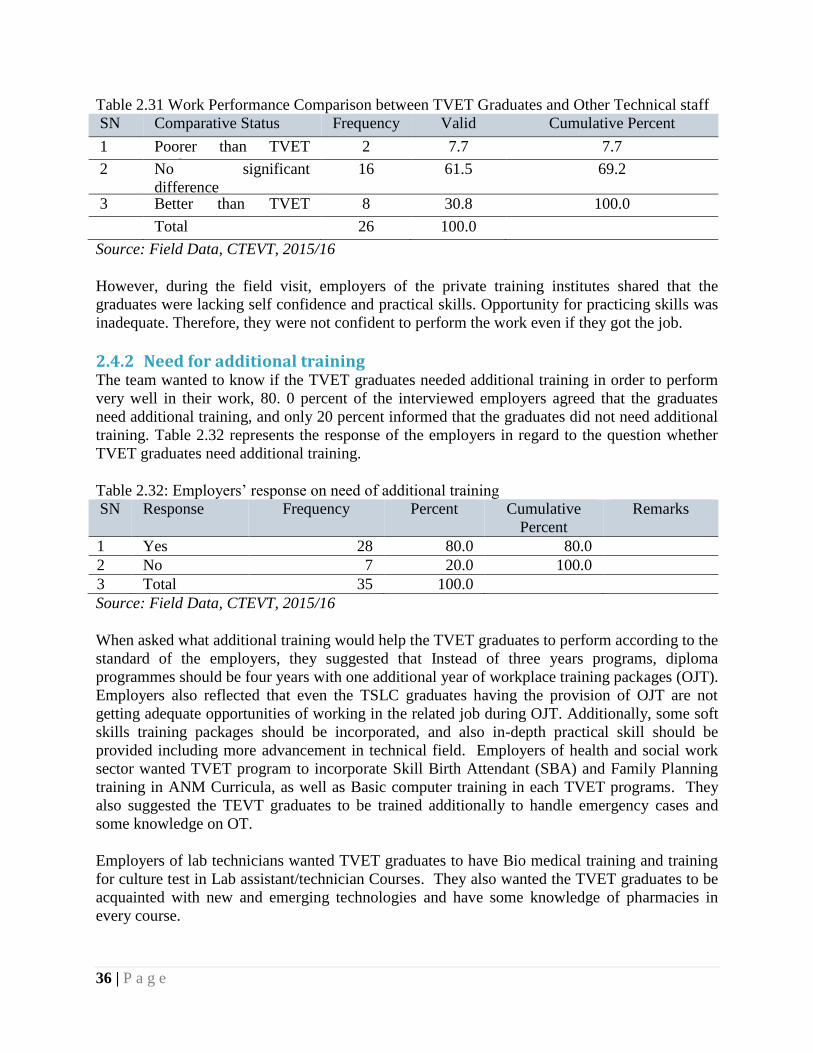
36 | P a g e
Table 2.31 Work Performance Comparison between TVET Graduates and Other Technical staff
SN Comparative Status Frequency Valid
Percent
Cumulative Percent
1 Poorer than TVET
graduates
2 7.7 7.7
2 No significant
difference
16 61.5 69.2
3 Better than TVET
Graduates
8 30.8 100.0
Total 26 100.0
Source: Field Data, CTEVT, 2015/16
However, during the field visit, employers of the private training institutes shared that the
graduates were lacking self confidence and practical skills. Opportunity for practicing skills was
inadequate. Therefore, they were not confident to perform the work even if they got the job.
2.4.2 Need for additional training The team wanted to know if the TVET graduates needed additional training in order to perform
very well in their work, 80. 0 percent of the interviewed employers agreed that the graduates
need additional training, and only 20 percent informed that the graduates did not need additional
training. Table 2.32 represents the response of the employers in regard to the question whether
TVET graduates need additional training.
Table 2.32: Employers’ response on need of additional training
SN Response Frequency Percent Cumulative
Percent
Remarks
1 Yes 28 80.0 80.0
2 No 7 20.0 100.0
3 Total 35 100.0
Source: Field Data, CTEVT, 2015/16
When asked what additional training would help the TVET graduates to perform according to the
standard of the employers, they suggested that Instead of three years programs, diploma
programmes should be four years with one additional year of workplace training packages (OJT).
Employers also reflected that even the TSLC graduates having the provision of OJT are not
getting adequate opportunities of working in the related job during OJT. Additionally, some soft
skills training packages should be incorporated, and also in-depth practical skill should be
provided including more advancement in technical field. Employers of health and social work
sector wanted TVET program to incorporate Skill Birth Attendant (SBA) and Family Planning
training in ANM Curricula, as well as Basic computer training in each TVET programs. They
also suggested the TEVT graduates to be trained additionally to handle emergency cases and
some knowledge on OT.
Employers of lab technicians wanted TVET graduates to have Bio medical training and training
for culture test in Lab assistant/technician Courses. They also wanted the TVET graduates to be
acquainted with new and emerging technologies and have some knowledge of pharmacies in
every course.
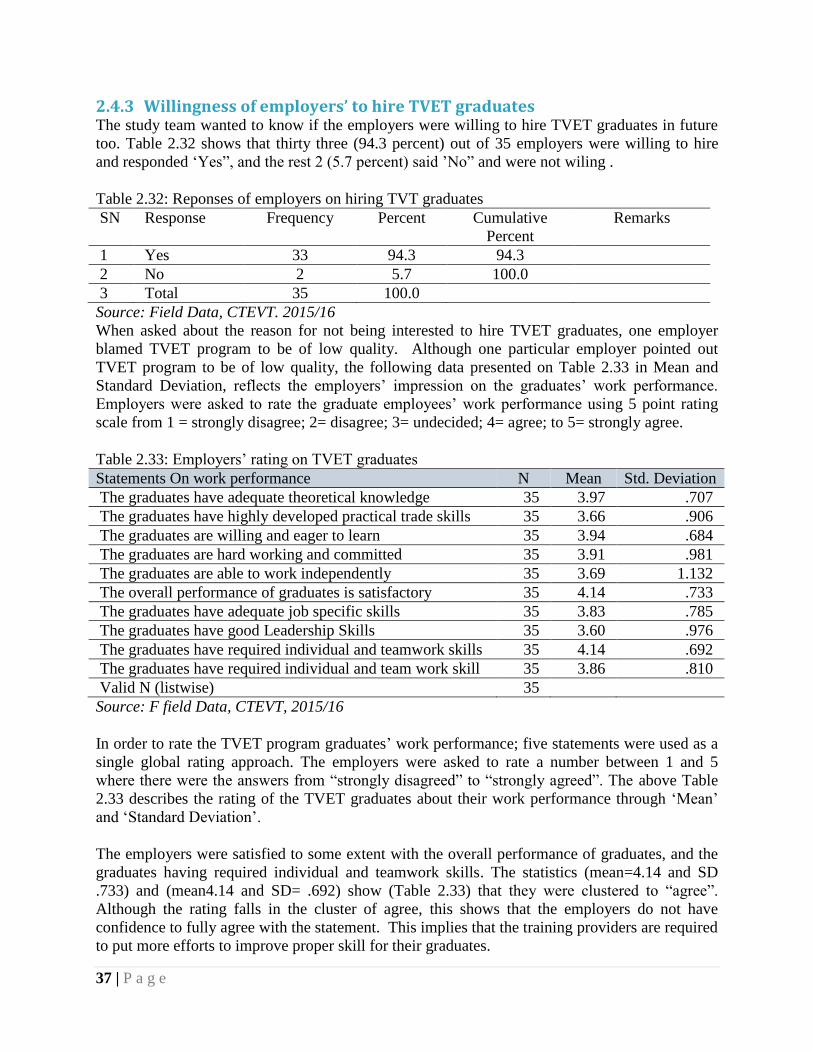
37 | P a g e
2.4.3 Willingness of employers’ to hire TVET graduates The study team wanted to know if the employers were willing to hire TVET graduates in future
too. Table 2.32 shows that thirty three (94.3 percent) out of 35 employers were willing to hire
and responded ‘Yes”, and the rest 2 (5.7 percent) said ’No” and were not wiling .
Table 2.32: Reponses of employers on hiring TVT graduates
SN Response Frequency Percent Cumulative
Percent
Remarks
1 Yes 33 94.3 94.3
2 No 2 5.7 100.0
3 Total 35 100.0
Source: Field Data, CTEVT. 2015/16
When asked about the reason for not being interested to hire TVET graduates, one employer
blamed TVET program to be of low quality. Although one particular employer pointed out
TVET program to be of low quality, the following data presented on Table 2.33 in Mean and
Standard Deviation, reflects the employers’ impression on the graduates’ work performance.
Employers were asked to rate the graduate employees’ work performance using 5 point rating
scale from 1 = strongly disagree; 2= disagree; 3= undecided; 4= agree; to 5= strongly agree.
Table 2.33: Employers’ rating on TVET graduates
Statements On work performance N Mean Std. Deviation
The graduates have adequate theoretical knowledge 35 3.97 .707
The graduates have highly developed practical trade skills 35 3.66 .906
The graduates are willing and eager to learn 35 3.94 .684
The graduates are hard working and committed 35 3.91 .981
The graduates are able to work independently 35 3.69 1.132
The overall performance of graduates is satisfactory 35 4.14 .733
The graduates have adequate job specific skills 35 3.83 .785
The graduates have good Leadership Skills 35 3.60 .976
The graduates have required individual and teamwork skills 35 4.14 .692
The graduates have required individual and team work skill 35 3.86 .810
Valid N (listwise) 35
Source: F field Data, CTEVT, 2015/16
In order to rate the TVET program graduates’ work performance; five statements were used as a
single global rating approach. The employers were asked to rate a number between 1 and 5
where there were the answers from “strongly disagreed” to “strongly agreed”. The above Table
2.33 describes the rating of the TVET graduates about their work performance through ‘Mean’
and ‘Standard Deviation’.
The employers were satisfied to some extent with the overall performance of graduates, and the
graduates having required individual and teamwork skills. The statistics (mean=4.14 and SD
.733) and (mean4.14 and SD= .692) show (Table 2.33) that they were clustered to “agree”.
Although the rating falls in the cluster of agree, this shows that the employers do not have
confidence to fully agree with the statement. This implies that the training providers are required
to put more efforts to improve proper skill for their graduates.
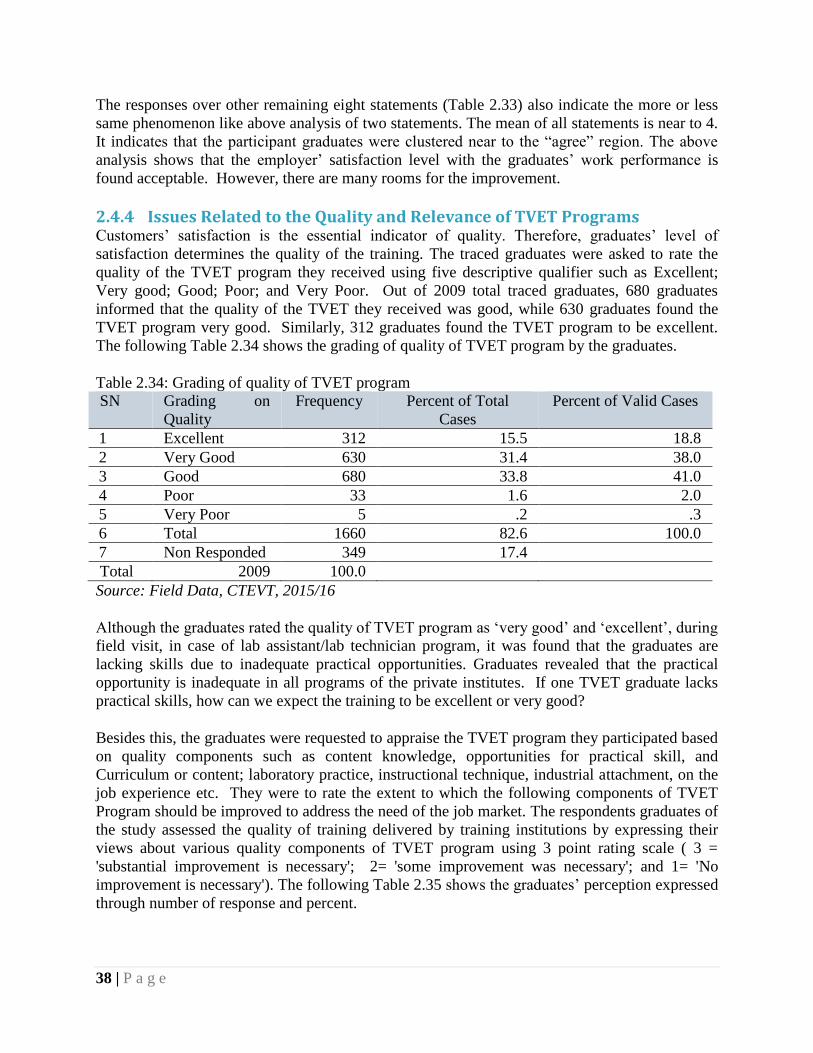
38 | P a g e
The responses over other remaining eight statements (Table 2.33) also indicate the more or less
same phenomenon like above analysis of two statements. The mean of all statements is near to 4.
It indicates that the participant graduates were clustered near to the “agree” region. The above
analysis shows that the employer’ satisfaction level with the graduates’ work performance is
found acceptable. However, there are many rooms for the improvement.
2.4.4 Issues Related to the Quality and Relevance of TVET Programs Customers’ satisfaction is the essential indicator of quality. Therefore, graduates’ level of
satisfaction determines the quality of the training. The traced graduates were asked to rate the
quality of the TVET program they received using five descriptive qualifier such as Excellent;
Very good; Good; Poor; and Very Poor. Out of 2009 total traced graduates, 680 graduates
informed that the quality of the TVET they received was good, while 630 graduates found the
TVET program very good. Similarly, 312 graduates found the TVET program to be excellent.
The following Table 2.34 shows the grading of quality of TVET program by the graduates.
Table 2.34: Grading of quality of TVET program
SN Grading on
Quality
Frequency Percent of Total
Cases
Percent of Valid Cases
1 Excellent 312 15.5 18.8
2 Very Good 630 31.4 38.0
3 Good 680 33.8 41.0
4 Poor 33 1.6 2.0
5 Very Poor 5 .2 .3
6 Total 1660 82.6 100.0
7 Non Responded 349 17.4
Total 2009 100.0
Source: Field Data, CTEVT, 2015/16
Although the graduates rated the quality of TVET program as ‘very good’ and ‘excellent’, during
field visit, in case of lab assistant/lab technician program, it was found that the graduates are
lacking skills due to inadequate practical opportunities. Graduates revealed that the practical
opportunity is inadequate in all programs of the private institutes. If one TVET graduate lacks
practical skills, how can we expect the training to be excellent or very good?
Besides this, the graduates were requested to appraise the TVET program they participated based
on quality components such as content knowledge, opportunities for practical skill, and
Curriculum or content; laboratory practice, instructional technique, industrial attachment, on the
job experience etc. They were to rate the extent to which the following components of TVET
Program should be improved to address the need of the job market. The respondents graduates of
the study assessed the quality of training delivered by training institutions by expressing their
views about various quality components of TVET program using 3 point rating scale ( 3 =
'substantial improvement is necessary'; 2= 'some improvement was necessary'; and 1= 'No
improvement is necessary'). The following Table 2.35 shows the graduates’ perception expressed
through number of response and percent.
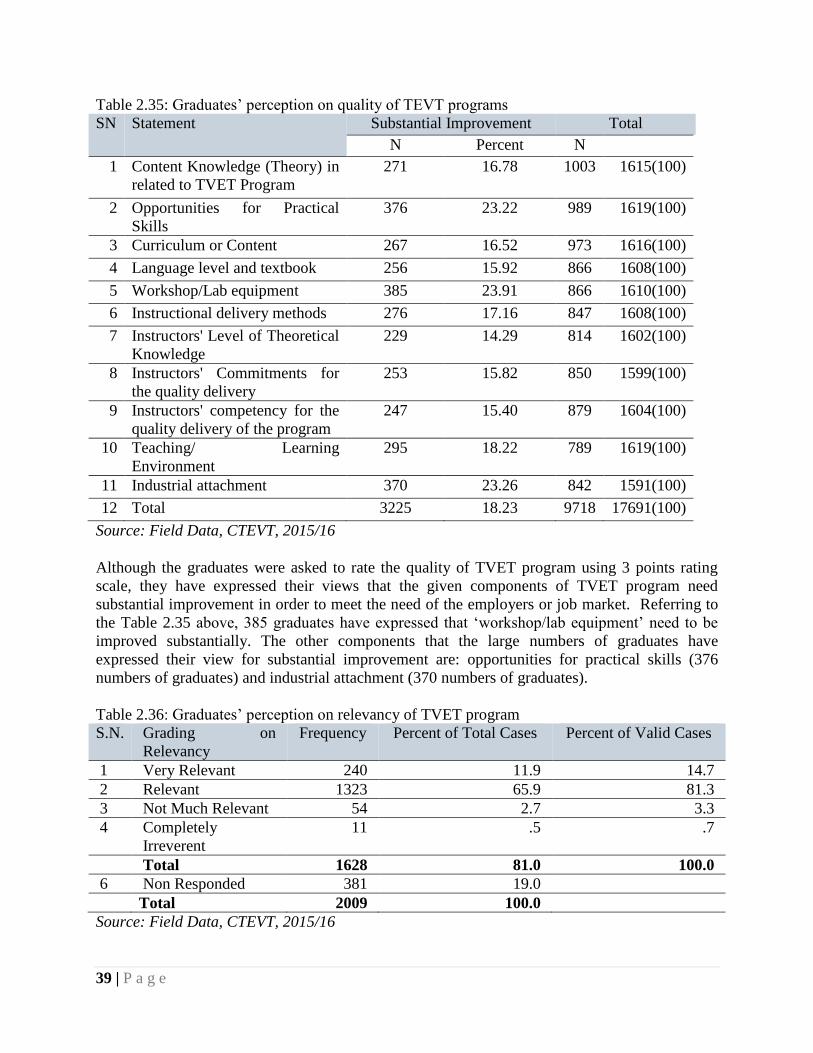
39 | P a g e
Table 2.35: Graduates’ perception on quality of TEVT programs
SN Statement Substantial Improvement Total
N Percent N
1 Content Knowledge (Theory) in
related to TVET Program
271 16.78 1003 1615(100)
2 Opportunities for Practical
Skills
376 23.22 989 1619(100)
3 Curriculum or Content 267 16.52 973 1616(100)
4 Language level and textbook 256 15.92 866 1608(100)
5 Workshop/Lab equipment 385 23.91 866 1610(100)
6 Instructional delivery methods 276 17.16 847 1608(100)
7 Instructors' Level of Theoretical
Knowledge
229 14.29 814 1602(100)
8 Instructors' Commitments for
the quality delivery
253 15.82 850 1599(100)
9 Instructors' competency for the
quality delivery of the program
247 15.40 879 1604(100)
10 Teaching/ Learning
Environment
295 18.22 789 1619(100)
11 Industrial attachment 370 23.26 842 1591(100)
12 Total 3225 18.23 9718 17691(100)
Source: Field Data, CTEVT, 2015/16
Although the graduates were asked to rate the quality of TVET program using 3 points rating
scale, they have expressed their views that the given components of TVET program need
substantial improvement in order to meet the need of the employers or job market. Referring to
the Table 2.35 above, 385 graduates have expressed that ‘workshop/lab equipment’ need to be
improved substantially. The other components that the large numbers of graduates have
expressed their view for substantial improvement are: opportunities for practical skills (376
numbers of graduates) and industrial attachment (370 numbers of graduates).
Table 2.36: Graduates’ perception on relevancy of TVET program
S.N. Grading on
Relevancy
Frequency Percent of Total Cases Percent of Valid Cases
1 Very Relevant 240 11.9 14.7
2 Relevant 1323 65.9 81.3
3 Not Much Relevant 54 2.7 3.3
4 Completely
Irreverent
11 .5 .7
Total 1628 81.0 100.0
6 Non Responded 381 19.0
Total 2009 100.0
Source: Field Data, CTEVT, 2015/16
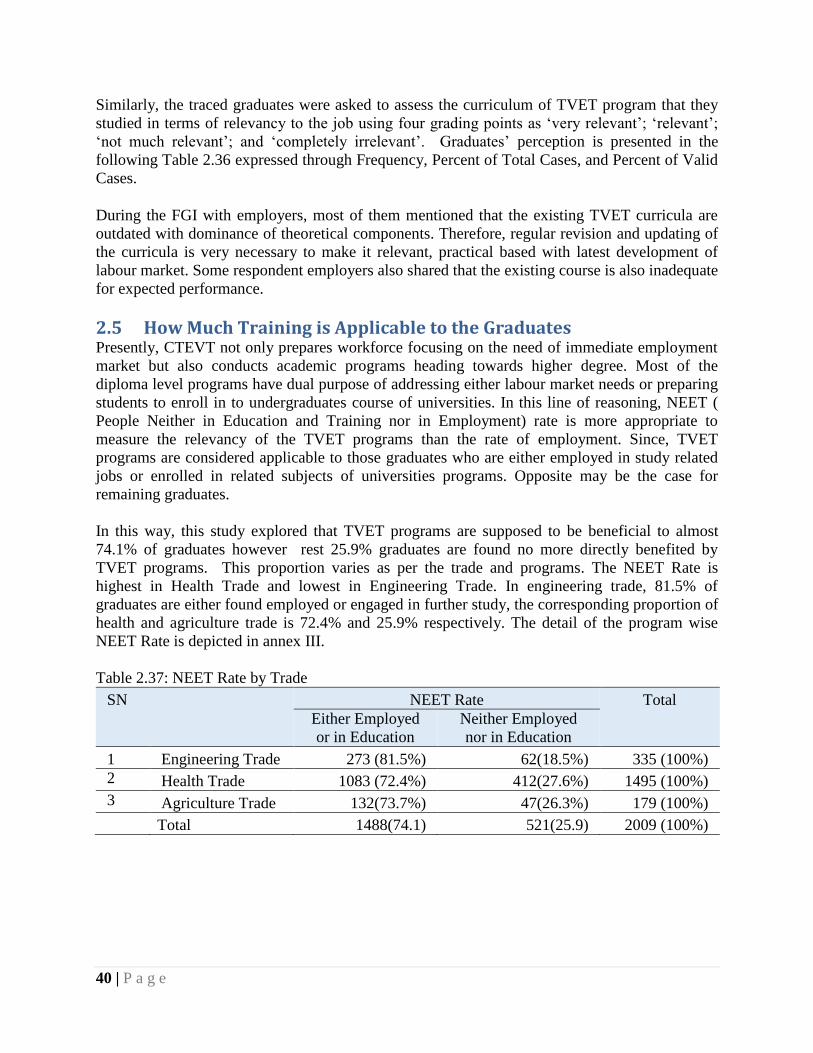
40 | P a g e
Similarly, the traced graduates were asked to assess the curriculum of TVET program that they
studied in terms of relevancy to the job using four grading points as ‘very relevant’; ‘relevant’;
‘not much relevant’; and ‘completely irrelevant’. Graduates’ perception is presented in the
following Table 2.36 expressed through Frequency, Percent of Total Cases, and Percent of Valid
Cases.
During the FGI with employers, most of them mentioned that the existing TVET curricula are
outdated with dominance of theoretical components. Therefore, regular revision and updating of
the curricula is very necessary to make it relevant, practical based with latest development of
labour market. Some respondent employers also shared that the existing course is also inadequate
for expected performance.
2.5 How Much Training is Applicable to the Graduates Presently, CTEVT not only prepares workforce focusing on the need of immediate employment
market but also conducts academic programs heading towards higher degree. Most of the
diploma level programs have dual purpose of addressing either labour market needs or preparing
students to enroll in to undergraduates course of universities. In this line of reasoning, NEET (
People Neither in Education and Training nor in Employment) rate is more appropriate to
measure the relevancy of the TVET programs than the rate of employment. Since, TVET
programs are considered applicable to those graduates who are either employed in study related
jobs or enrolled in related subjects of universities programs. Opposite may be the case for
remaining graduates.
In this way, this study explored that TVET programs are supposed to be beneficial to almost
74.1% of graduates however rest 25.9% graduates are found no more directly benefited by
TVET programs. This proportion varies as per the trade and programs. The NEET Rate is
highest in Health Trade and lowest in Engineering Trade. In engineering trade, 81.5% of
graduates are either found employed or engaged in further study, the corresponding proportion of
health and agriculture trade is 72.4% and 25.9% respectively. The detail of the program wise
NEET Rate is depicted in annex III.
Table 2.37: NEET Rate by Trade
SN NEET Rate Total
Either Employed
or in Education
Neither Employed
nor in Education
1 Engineering Trade 273 (81.5%) 62(18.5%) 335 (100%)
2 Health Trade 1083 (72.4%) 412(27.6%) 1495 (100%)
3 Agriculture Trade 132(73.7%) 47(26.3%) 179 (100%)
Total 1488(74.1) 521(25.9) 2009 (100%)

41 | P a g e
Chart 2.2 Graduates Engagement Status
Similarly, respondent’s status is also analyzed as per their education and employment status. Of
these 2009 respondents, 36 % respondents were only employed but not in study. Unlike, 24%
respondents are only in study but not in employment. Similarly, 15% respondents are involving
both in employment and study simultaneously. And, almost 25% of graduates are totally out of
education and employment. The pie Chart 2.2 presents detail picture regarding this matter.
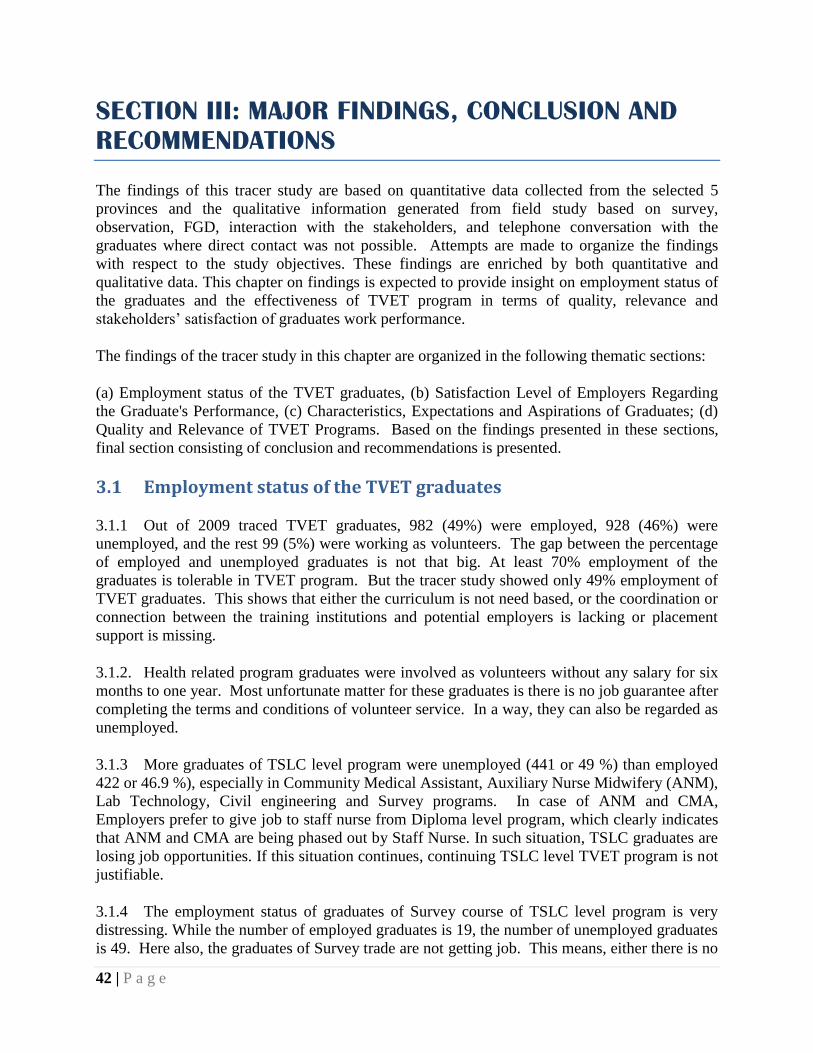
42 | P a g e
SECTION III: MAJOR FINDINGS, CONCLUSION AND
RECOMMENDATIONS
The findings of this tracer study are based on quantitative data collected from the selected 5
provinces and the qualitative information generated from field study based on survey,
observation, FGD, interaction with the stakeholders, and telephone conversation with the
graduates where direct contact was not possible. Attempts are made to organize the findings
with respect to the study objectives. These findings are enriched by both quantitative and
qualitative data. This chapter on findings is expected to provide insight on employment status of
the graduates and the effectiveness of TVET program in terms of quality, relevance and
stakeholders’ satisfaction of graduates work performance.
The findings of the tracer study in this chapter are organized in the following thematic sections:
(a) Employment status of the TVET graduates, (b) Satisfaction Level of Employers Regarding
the Graduate's Performance, (c) Characteristics, Expectations and Aspirations of Graduates; (d)
Quality and Relevance of TVET Programs. Based on the findings presented in these sections,
final section consisting of conclusion and recommendations is presented.
3.1 Employment status of the TVET graduates
3.1.1 Out of 2009 traced TVET graduates, 982 (49%) were employed, 928 (46%) were
unemployed, and the rest 99 (5%) were working as volunteers. The gap between the percentage
of employed and unemployed graduates is not that big. At least 70% employment of the
graduates is tolerable in TVET program. But the tracer study showed only 49% employment of
TVET graduates. This shows that either the curriculum is not need based, or the coordination or
connection between the training institutions and potential employers is lacking or placement
support is missing.
3.1.2. Health related program graduates were involved as volunteers without any salary for six
months to one year. Most unfortunate matter for these graduates is there is no job guarantee after
completing the terms and conditions of volunteer service. In a way, they can also be regarded as
unemployed.
3.1.3 More graduates of TSLC level program were unemployed (441 or 49 %) than employed
422 or 46.9 %), especially in Community Medical Assistant, Auxiliary Nurse Midwifery (ANM),
Lab Technology, Civil engineering and Survey programs. In case of ANM and CMA,
Employers prefer to give job to staff nurse from Diploma level program, which clearly indicates
that ANM and CMA are being phased out by Staff Nurse. In such situation, TSLC graduates are
losing job opportunities. If this situation continues, continuing TSLC level TVET program is not
justifiable.
3.1.4 The employment status of graduates of Survey course of TSLC level program is very
distressing. While the number of employed graduates is 19, the number of unemployed graduates
is 49. Here also, the graduates of Survey trade are not getting job. This means, either there is no
43 | P a g e
job in the job market for TSLC level graduates or the quality of the program does not match the
demand of the job. If such situation of unemployment for the graduates of Survey trade is valid
for other batches too, it will not be rational to continue this course.
3.1.5 The employment status of Diploma level graduates is also not that satisfactory. Although
50.5 % of total traced graduates were employed, 43.9 % were unemployed. The difference
between employed and unemployed is insignificant.
3.1.6 In Civil Engineering and Computer engineering trades of Diploma level program also
the number of unemployed graduates is greater (90 and 10) than employed graduates (38 and 5
respectively). This means graduates of these trades are not getting job. Either there is less job
opportunities in the job market or they are not well-trained to match the demand of the market or
there is lack of employment support program.
3.1.7 The graduates, especially graduates of VJTA program, who are involved in self
employment, are satisfied with their work. There is much room for self employment in this
trade. Similarly, those graduates of Lab technology program who are also involved in self-
employment or part time job are quite content with their job. They can take more than one work
at a time in their own discretion. TVET graduates need to be encouraged for self-employment.
3.1.8 Soft skills were instrumental for getting employment or to retain in the employment,
especially communication skill, honesty/positive attitude toward work and organization, and
interpersonal skills are very crucial for retaining in the job, especially in private sector.
3.1.9 Although the graduates employed in formal sector earn less than the graduates in
informal sector or self-employment or in foreign employment; they are quite satisfied with their
income. Graduates who are in self-employment earn better than graduates who are in wage
employment in both formal and informal sector. They should be encouraged to go for self-
employment.
3.1.10 Placement support to the graduates is crucial for promoting employment. It works better
if the Training Institutes establish functional placement and counseling unit and support
graduates linking with job market.
3.2 Satisfaction Level of Employers Regarding the Graduate's Performance
3.2.1 The performance level of the TVET graduates at the work place is to the acceptable level
of the employers. However, there is always space for doing better.
3.2.2 Employers are willing to hire TVET graduates if they are provided additional knowledge
and skills to perform according to the standard of the employers. In case of Diploma Course,
additional workplace training packages (OJT), some soft skills training packages and in-depth
knowledge and practical skill would be very much helpful for both the employers and the
graduates. Trade specific subjects such as Skill Birth Attendant (SBA) and Family Planning
training in ANM Curricula, and additional skills such as handling emergency cases and some
knowledge on OT would be advantageous to the TVET students. Bio medical training and
44 | P a g e
training for culture test in Lab assistant/technician Courses would be beneficial for graduates of
Lab Technology/ Assistant program for employment.
3.2.2 TSLC graduates, especially in health sector are not the preference of the employers over
Diploma level graduates, because they do not have adequate skills to handle the patients.
Practical opportunity is inadequate in both Diploma and TSLC level program. Therefore, the
graduates are not confident to perform the work even if they get the job. Hence, despite
acceptance of job performance level of the graduates by the employers, the graduates need to
improve their skills.
3.3 Characteristics, Expectations and Aspirations of Graduates 3.3.1 Among those who were unemployed (928 graduates), 458 (22.8%) graduates were still
hoping to get job. That's why, they were searching for job. The other 227 (11.3%) decided to
pursue higher education and progress in their academic level so that they can get higher level
job. This shows that the TVET graduates have choices; either to go into job market having skill
to perform well in the job or go in for higher education.
3.3.2 If the employers prefer to take Diploma level graduates than TSLC level graduates, what
would TSLC graduates expect from the TVET program? It is not that possible for all the TSLC
graduates to go in for higher education too. If TSLC graduates continue to lose job opportunities,
some alternatives should be thought for them.
3.4 Quality and Relevance of TVET Programs 3.4.1 It was found that the graduates are lacking skills due to inadequate practical
opportunities. Time for practicing skill is inadequate in all programs of the private institutes. If
one TVET graduate lacks practical skills, how can we expect the training to be excellent or very
good?
3.4.2 The unemployed graduates have reported that there are no job opportunities in the job
market. Such expressions indicate issue of relevancy of TVET program with the job market.
The statements suggest that either the curriculum of TVET program is not need based, or the
linkage between industries and training institutes is missing or it could be both reasons. It is time
that with changed context, CTEVT should think about changing its programs so that it can
prepare the human resource according to the skill demand of the job market.
3.5 Conclusion
With the broader objectives as to make significant contribution on employment creation or
poverty reduction of country either by preparing graduates as per the employment needs of
country or making them capable enough to create new employment (self-employment), CTEVT
has been running long term and short term training programs of vocational nature under the trade
of Health, Agriculture and Construction. Therefore, in order to make CTEVT well informed
about the employment status of their graduates as well as needs of the labour market this tracer
study was conducted with a view to trace the graduates to find out the employment status as well
as their income and performance level at workplace.
45 | P a g e
TVET program has been contributing to the employment and overall economic growth of the
country and needs to be further strengthen. However, the employment percentage is
comparatively low. Therefore, there is a high need to strengthen the linkage with the industry
and job market and also review the programs to address the changing market needs.
Practical opportunities for the participants are inadequate especially in Private Institutes as
specified in the curriculum. Effective monitoring mechanism has to be established and
implemented to ensure the effective implementation of the curriculum.
Overall income and earning of employed graduates was satisfactory. Not only the graduates but
the employers are also happy and satisfied with their employees' job performance, although some
additional skills and knowledge are required for the TVET graduates. Hence, it can be concluded
that TVET program of CTEVT has helped to improve the economic life of the targeted group to
some extent.
3.6 Recommendations
Based on data analysis and findings, following recommendations are made:
Labour market studies are recommended to conduct in a Periodic manner to identify the
changing needs of the labour market. Consequently, it is recommended to review
Curricula to cater the market demand. It is recommended to ensure that the soft skills are
incorporated while revising and developing the curricula of each program and be
implemented properly.
It is recommended to incorporate basic computer skills in the curriculum of each
program.
Recommended to ensure effective monitoring is carried out to ensure that the curriculum
is fully implemented. Specially to ensure adequate practical opportunities for the students
as envisaged by the curriculum. It was found lacking specially in private institutes.
Recommended to carry out the tracing of the graduates by each training institute in a
regular basis to update the market demand and course updating.
Linkage between institutions and industries or employers should be strengthened so that
the TEVT program is offered according to the human resource demand of the employers.
It is recommended to establish functional placement and counseling unit or any other
such mechanism in each training institute and in the CTEVT as well to support graduates
linking with job market.
It is recommended for assessing by subject experts regarding the necessity of on the job
training (work place practice) provision for diploma programs. For the existing TSLC
program with OJT provision, it is also recommended to ensure that the graduates get
opportunity of working in the related job during the OJT. Developing a roaster of
potential organizations for OJT placement in each program would be instrumental.
46 | P a g e
BIBLIOGRAPHY
Council for Technical Education and Vocational Training, (2007). Council for technical
education and vocational training: A glimpse. Sanothimi, Bhaktapur: CTEVT
CTEVT, (2010). A rapid assessment of potential labour market for rehabilitation on Maoist
Army Combatants: A desk study for GIZ.
CTEVT, (2011). Council for technical education and vocational training: A glimpse, 2011.
Kathmandu, Nepal: CTEVT
DCSI, (2072). Industrial promotion statistics 2072, Kathmandu, Nepal: Department of Cottage
and Small Industry
GoN, (2006). Council for technical education and vocational training act. 2045. Kathmandu,
Nepal: Ministry of Education.
Joshi, S. & Neupane, M. (2014). National skilled human resource projection in health and
engineering profession. Sanothimi, Bhaktapur: CTEVT.
Ministry of Education, (2012). Technical and vocational education and training policy, 2012.
Singadurbar, Kathmandu. Mininstry of Education
MoAC, (2004). Agriculture policy 2004. Lalitpur Nepal: Ministry of Agriculture and
Cooperative Development
MoCTCA, (2013). Nepal tourism statistics 2013. Kathmandu, Nepal: Ministry of Culture,
Tourism and Civil Aviation.
MoF, (2012). The economic survey, 2011/12. Kathmandu, Nepal : Ministry of Finance.
MoF, (2015). Economic Survey, 2014/15. MoF, 2015
National Planning Commission, (2015). Post disaster needs assessment (executive summary).
Kathmandu, Nepal: NPC
Neupane, B.M. (2010). Increasing access of technical education and vocational training (TVET)
programs and relevancy to the job market. Technical and Vocational Education and
Training Development Journal. Sanothimi, Bhaktapur: CTEVT
Pradhan, H., Ghimire, G.R., Subedi, S., (2014). Report on analysis of selected industry and
service sectors in Nepal. Lalitpur, Lalitpur: Swiss Agency for Development Cooperation
Pradhan, H., Neupane, B.R. and Sapkota, H., (2014). Analysis of skills gaps between selected
CTEVT curricula and demand in Labour Market. Kathmandu, Nepal:

47 | P a g e
ANNEXES :

48 | P a g e
Annex I: Location and number of employers interviewed SN Address of Employers Frequency Percent Cumulative
Percent
Remarks
1 Kathmandu Valley 4 11.4 11.4
2 Pokhara, Kaski 7 20.0 31.4
3 Bharatpur, Chitwan 5 14.3 45.7
4 Butwal, Rupandehi 2 5.7 51.4
5 Dhangadi, Kailali 1 2.9 54.3
6 Amarbhumi, Surkhet 1 2.9 57.1
7 Banepa, Kavrepalanchok 1 2.9 60.0
8 Bhairahawa, Rupandehi 1 2.9 62.9
9 Hetauda, Makwanpur 4 11.5 74.3
10 Khalanga, Jumla 3 8.6 82.9
11 Lamki, Kailali 1 2.9 85.7
12 Biratnagar, Morang 1 2.9 88.6
13 Tansen, Palpa 1 2.9 91.4
14 Sandhikharka,
Arghakhanchi 1 2.9 94.3
15 Tamgash, Gulmi 2 5.7 100.0
16 Total 35 100.0
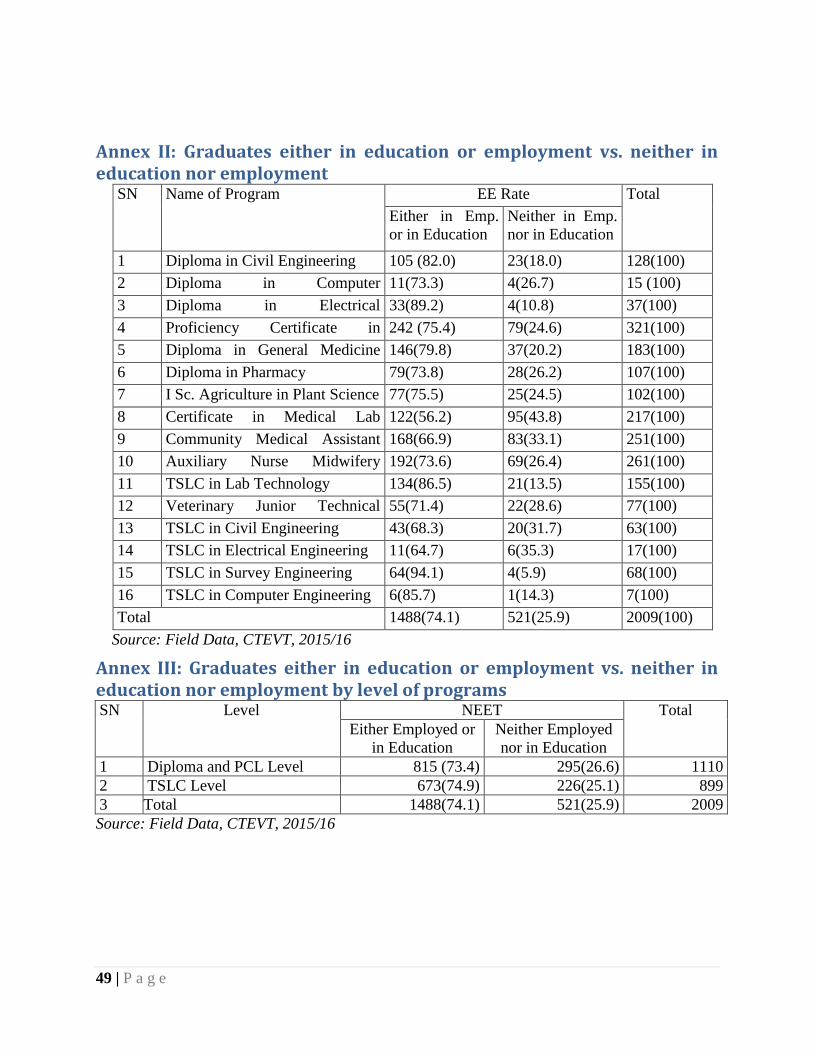
49 | P a g e
Annex II: Graduates either in education or employment vs. neither in education nor employment
SN Name of Program EE Rate Total
Either in Emp.
or in Education
Neither in Emp.
nor in Education
1 Diploma in Civil Engineering 105 (82.0) 23(18.0) 128(100)
2 Diploma in Computer
Engineering
11(73.3) 4(26.7) 15 (100)
3 Diploma in Electrical
Engineering
33(89.2) 4(10.8) 37(100)
4 Proficiency Certificate in
Nursing
242 (75.4) 79(24.6) 321(100)
5 Diploma in General Medicine
(HA)
146(79.8) 37(20.2) 183(100)
6 Diploma in Pharmacy 79(73.8) 28(26.2) 107(100)
7 I Sc. Agriculture in Plant Science 77(75.5) 25(24.5) 102(100)
8 Certificate in Medical Lab
Technology
122(56.2) 95(43.8) 217(100)
9 Community Medical Assistant
(CMA)
168(66.9) 83(33.1) 251(100)
10 Auxiliary Nurse Midwifery
(ANM)
192(73.6) 69(26.4) 261(100)
11 TSLC in Lab Technology 134(86.5) 21(13.5) 155(100)
12 Veterinary Junior Technical
Assistant
55(71.4) 22(28.6) 77(100)
13 TSLC in Civil Engineering 43(68.3) 20(31.7) 63(100)
14 TSLC in Electrical Engineering 11(64.7) 6(35.3) 17(100)
15 TSLC in Survey Engineering 64(94.1) 4(5.9) 68(100)
16 TSLC in Computer Engineering 6(85.7) 1(14.3) 7(100)
Total 1488(74.1) 521(25.9) 2009(100)
Source: Field Data, CTEVT, 2015/16
Annex III: Graduates either in education or employment vs. neither in education nor employment by level of programs SN Level NEET Total
Either Employed or
in Education
Neither Employed
nor in Education
1 Diploma and PCL Level 815 (73.4) 295(26.6) 1110
2 TSLC Level 673(74.9) 226(25.1) 899
3 Total 1488(74.1) 521(25.9) 2009
Source: Field Data, CTEVT, 2015/16

50 | P a g e
Annex IV Questionnaire for Graduates
Council for Technical Education and Vocational Training Tracer Study of Graduates of TSLC and Diploma Level Program under
CTEVT
Questionnaire for Graduates
Graduate Questionnaire
(Note: Get the personal information only if the interviewee is willing to provide it)
Source of Information Collection:
1. Face to Face interview 2. Telephonic Interview
3. Response from mail 4. If others, Mention………
In case the graduate is unavailable and any person who knows about the graduate can provide
some information, please note the available information on the blank space of last page.
SECTION A: BIOGRAPHICAL DATA AND SOCIOECONOMIC STATUS
1. Name of interviewee____________________________
2. Address: VDC/Municipality __________________________District__________________
Telephone______________ Email: __________________________
3. Age______________ Gender______________
4. Caste/ Ethnic group:
1. Hill Brahmin/Chhetri 2. Terai Brahmin/Chhetri 3. Hill Dalit
4. Terai Dalit
6. If Others,
mention………
5. Hill Janajati 6. Terai Janajati
5. Which of the followings best describes your annual family income range?
1) Less than Rs.25, 000
2) Rs.25, 001 - Rs.50, 000
3) Rs.50, 001- Rs.100, 000
4) More than Rs.100, 000
Dear Graduates,
You are kindly requested to spare some of few minutes to help to complete the survey regarding
the Tracer study of graduates of TSLC / Diploma level programs under CTEVT. The data
obtained will guide CTEVT to effectively formulate the training plans as well as making the
training programs relevant to the Labour market. All information obtained will be kept with
utmost confidentiality.

51 | P a g e
SECTION B: GENERAL INFORMATION
6. What was the name of the Technical Vocational Education and Training (TVET)
Programme you attended?
………………………………………………
7. What was the duration of the TVET Programme you attended?
1) 15 months
2) 29 months
3) 18 months
4) 3 Years
8. Why did you opt this TVET Programme? (Multiple response is permitted)
1 Due to high employment opportunity 2 My Guardians and seniors suggested
3 My friend opted the training 4. If others………
9. Mention the name and address of the Institute where you attended the TVET Programme.
Name of the Institute:
Address of the Institute:
SECTION C: QUALITY AND RELEVANCE OF THE TRAINING
10. What was the quality of the TVET Program you received?
1 Excellent 2. Very good 3. Good 4. Poor 5.
Very Poor
11. Did you find the curriculum relevant to the actual world of work?
1. Very relevant 2. Relevant
3. Not relevant 4. Irreverent
If not very relevant, mention the gap in the
curriculum……………………………………………..
12. Some of the key areas of the TVET Programme which you attended are given below. Please
rate the extent to which the following components of TVET Programme should be improved
to address the need of the job market using the given rating scale. Use a tick (√) inside the
box.
1= substantial improvement is necessary 2 = some improvement is necessary
3= no improvement needed
S. N. Area of Improvement 1 2 3
1. Content Knowledge (Theory) in related to TVET Programme
2. Opportunities for practical skills
3. Curriculum or content

52 | P a g e
4. Language level and textbook
5. Workshop/Lab equipment
6. Instructional delivery methods
7. Instructor’s level of theoretical knowledge
8. Instructor’s commitment for the quality delivery
9. Instructor’s competency for the quality delivery of the programme
10. Teaching/learning environment
11. Industrial attachments (collaboration with industry)
13. In the following box, some statements related to the adequacy of the market oriented TVET
programmes are given. Please put your opinion for every statements using tick (√) inside the
related small box using rating scale:
1 = strongly disagree; 2 = disagree; 3 = Neutral; 4 = agree; 5 = strongly agree.
S.N. Statements 1 2 3 4 5 NA
1 My training has adequately prepared me for work
2 My employer is satisfied with my level of knowledge and
skill
3 It was easy for me to get a job because of the level of
knowledge and skill learned in the institute
4 I find myself to be very effective in my current job
5 I can easily change employment within my area of
specialization
6 I am being able to perform the skills required by the job
7 I am satisfied with my current job
8 I am fully satisfied with the TVET program I had
NA: This is only for unemployed graduates.
SECTION D: TRANSITION PERIOD TO EMPLOYMENT
14. Which of the followings is your current employment status?
1. Employed 2. Unemployed (Jump to Question 26)
3. Engaged as a volunteer
If you are employed, give the following information.
15. Your employment is:
1. Full time 2. Part Time (less than 40 hrs/week)
16. What type of employment are you engaged in?
1. Self- employment 2. Wage employment in formal sector
3. Wage employment in informal sector 4. Foreign employment
17. Is this job related to the TVET Program you have completed?
1. Yes 2. No

53 | P a g e
If no, why did you take the job different from the job area in which you were trained?(Multiple
response is permitted)
1. Did not get job in training related area 2. Lack of career progression
3. Poor remuneration 4. Poor working conditions
5. If others, mention ………………………….
18. What is your monthly earning in the present job?
(Mention in Nepalese Rupees) Rs. …………………………
19. If you are employed in formal sector, please provide the following information
1. Name of employer organization:
2. Address and phone number:
20. How long did it take to get the employment after completing the TVET programme?
1. Mention the duration ……… Years ………..Months
2. Immediately after completion of the training
21. What did you do after graduation until you were employed?
1. Searching for employment 2. Engaged in further study/Training
3. Engaged in own business 4. Others (If others, mention the
activities………….
22. How did you get this job?
1. Door to door (Job hunting) 2. Media advertisement and notice
3. Technical Training Provider (TTP)/Trainer helped 4. Selected from competition
5. Family relationship 6. Personal networking
7. If others, mention…………………………………..
23. Did any other soft skills were instrumental to get the present job?
1. Yes 2. No
If yes, which of the soft skills becomes more instrumental? (Multiple response is permitted)
1. English language 2. Communication skills
3. Interpersonal skills 4. Honesty/attitude
5. If others, mention…………………..
24. Are you satisfied with this job?
1. Yes 2. No ,

54 | P a g e
If no, give reason
(s)……………………………………………………………………………………………
25. Are you holding more than one job?
1. Yes 2. No
(Skip 26 and 27 in case of employed graduates)
26. If you are the unemployed, which of the following is your status?
1. I am searching employment and not getting it .
2. I am discouraged because of not finding employment.
3. I would like to devote time for further study.
4. I am preparing to start own business.
5. If others, mention ………………………………………..
27. Graduates who tick on the 1 and 2 of Q No. 26, please mention the reason/s. (Multiple
response is permitted)
1 Lack of job opportunities in the market;
2 My skill and education did not match with the available jobs;
3 Due to inadequate employable skills (like soft skills and business skills ;)
4 I have lack of linkage with employers;
5 If others, mention ………………………..
SECTION E: FURTHER STUDY
28. Are you engaged in further study?
1. Yes 2. No
If No; why did you not want to carry on your study?
………………………………………………………….
If yes; why did you start further study?
1. Because of not getting job 2. Want to get higher education
3. Want to change the field of my study 4. If others, mention
……………….………………..
29. Were you working before you attended the TVET Programme?
1. Yes 2. No
If yes, what was your monthly income?
Rs. …………………………..

55 | P a g e
30. Please list out some suggestions to improve the quality of the TVET programs for better
employability and efficiency.
………………………………………………………………………………………………………
………………………………………………………………………………………………………
………………………………………………………………………………………..
THANK YOU FOR YOUR TIME AND COOPERATION

56 | P a g e
Annex V : Questionnaire for Employers
Council for Technical Education and Vocational Training Sanothimi, Bhaktapur
Tracer Study of Graduates of Diploma and TSLC Program under CTEVT
Questionnaire for Employer
(Use a tick (√) to indicate your response where appropriate)
Section A: Profile of Employer
1. Name of Employer/Organization: ………………………………………………………
2. Address: ……………………………………………………….......................................
3. Phone Number/ Mobile Number: ....……………………………………………………
4. Email address: …………………………………………………………………………
5. Name of interviewee: ……………………………………………………………………
6. Date of interview (dd/mm/yy): …………………………………………………………..
7. Program of traced graduate: …………………………………………………………..
8. Economic sub-sector of the enterprises:
1. Agriculture
2. Fishing (fisheries/ fish-keeping)
3. Mining & Quarrying
4. Manufacturing
5. Electricity, Gas and Water
6. Construction
7. Wholesale and Retail trade
8. Hotel and Restaurant
9. Transport, Storage and Communication
10. Financial Intermediation
11. Real estate, renting and business
activities
12. Public administration and defense
13. Education
14. Health and social work
15. Other community, social and personal
service
Dear Sir/Madam
You are kindly requested to spare some of few minutes to help complete a survey. All the
information will be kept confidential and will be used only for statistical purposes. The survey
is intended to assist CTEVT for preparing students for the work environment and will better
serve your company and industry needs. If you have any questions, please call 01-5639451.
Thank you for taking the time to fill out this questionnaire. Once again, we assure you that all
information obtained will be used with utmost confidentiality.
-Council for Technical Education and Vocational Training

57 | P a g e
Section B: Nature of Employer
1 To which of the following sector does your business/company belong? (Please choose only
one)?
1. Government 2. Non-government 3 Private
4. If other, mention …………..
2. Which is the nature of your company, please indicate?
1. Formal 2. Informal
3. How many employees are presently working in your office/enterprise?
No. of employees…………………
4. How many TVET graduates are presently employed in your organization?
TVET Program Number of Graduates Employed
Diploma
TSLC
Vocational
5. How do you recruit these people?
1 Media Advertisements or public notice
2 Personal contact to prospective employees
3 By the help of recruitment agencies
4 Direct contact to the TEVT institutions
5 Other (please specify)…………………………
6. Have you also recruited technical employees other than from TVET graduates?
1. Yes 2. No
If yes, how have you found their performance level?
1. Poorer than TVET Graduates 2. No significant difference
3. Better than TVET Graduates
7. Do you think that the TVET graduates need additional training in their respective technical
area in order to meet your company’s/business’s needs?
1. Yes 2. No
If yes, please specify the specific requirements of your company?
1. ……………………………………………………………………………………………

58 | P a g e
2. ………………………………………………………………………………………………
3. …………………………………………………………………………………………….
4. …………………………………………………………………………………………….
17. Would you be interested in hiring more graduates from CTEVT program in the future?
1. Yes 2. No
18. If ‘No’ why? please specify,
…………………………………………………………………………………………………
…………………………………………………………………………………………………
…………………………………………………………………………………………
Section C: Perception of Employer
1. How do you rate the following statements on the graduates of CTEVT program? (Scales
of answer ranges from: 1 = strongly disagree; 2= disagree; 3= undecided; 4= agree; to 5
= strongly agree)
1 2 3 4 5 Statements
The graduates have adequate theoretical technical knowledge
The graduates have highly developed practical trade skills
The graduates are willing and eager to learn
The graduates are hard-working and committed
The graduates are able to work independently
The overall performance of the graduates is satisfactory
The graduates have adequate job specific skills
The graduates have adequate problem solving skills
The graduates have required individual and teamwork skills
The graduates have good leadership skills

59 | P a g e
2. To what extent does/do your employee/s require knowledge and skills in the following
fields? (Scales of answer ranges between: 1 = Not at all; 2= barely; 3= to some extent; 4=
to high extent; 5 = To very high extent)
Rating Scale Area/fields
1 2 3 4 5
Practical skills
Theoretical knowledge
Entrepreneurial skills (how to run a business and
to treat customers, marketing)
Other soft skills/work ethics (Communication,
punctuality, team work etc.)
3. Do you have any suggestions for CTEVT so that its programs can be improved?
………………………………………………………………………………………………………
………………………………………………………………………………………………………
………………………………………………………………………………………………………
………………………………………………………………………………………………………
………………………………
Thank you for your time and cooperation