Trace Chemical and Major Constituents Measurements of the ...
17
1 American Institute of Aeronautics and Astronautics Trace Chemical and Major Constituents Measurements of the International Space Station Atmosphere by the Vehicle Cabin Atmosphere Monitor M. R. Darrach 1 , A. Chutjian 2 , B. J. Bornstein 3 , A. P. Croonquist 4 , V. Garkanian 5 , J. Hofman 6 , D. Karmon 7 , J. Kenny 8 , R. D. Kidd 9 , S. Lee 10 , J. A. MacAskill 11 , S. M. Madzunkov 12 , L. Mandrake 13 , R. T. Schaefer 14 , and N. Toomarian 15 Jet Propulsion Laboratory, California Institute of Technology, Pasadena CA 91109 We report on trace gas and major atmospheric constituents results obtained by the Vehicle Cabin Atmosphere Monitor (VCAM) following almost two years of operation aboard the International Space Station (ISS). VCAM is an autonomous environmental monitor based on a highly compact gas chromatograph/quadrupole ion trap mass spectrometer. It was flown to the International Space Station (ISS) on shuttle mission STS-131 and commenced operations on 6/10. VCAM is capable of providing measurements of both ppb levels of volatile trace-gas constituents, and of the atmospheric major constituents (nitrogen, oxygen, argon, and carbon dioxide) in a space vehicle or station. It is designed to operate autonomously and maintenance-free, approximately once per day, with a self-contained gas supply sufficient for a one-year lifetime. VCAM’s performance is sufficient to detect and identify 90% of the target compounds at their 180-day Spacecraft Maximum Allowable Concentration levels. Nomenclature AMDIS = Automated Mass Spectral Deconvolution and Identification System AMP = Atomic and Molecular Physics Group DU = Development Unit ECLSS = Environmental Control and Life Support System GC = Gas Chromatograph GC/DMS = Gas Chromatograph/Differential Mobility Spectrometer GC/MS = Gas Chromatograph/Mass Spectrometer HOSC = Huntsville Operations Support Center IFM = In Flight Maintenance ISS = International Space Station JPL = Jet Propulsion Laboratory JSC = Johnson Space Flight Center 1 Senior Technologist, Atomic and Molecular Physics Group, JPL/Caltech, Pasadena, CA 91109 2 Senior Scientist, Atomic and Molecular Physics Group, JPL/Caltech, Pasadena, CA 91109 3 Scientific Applications Engineer, Instrument Autonomy Group, JPL/Caltech, Pasadena, CA 91109 4 Systems Engineer, MicroDevices Group, JPL CalTech, Pasadena, CA 91109 5 Mechanical Engineer, Optical Communications Group, JPL/Caltech, Pasadena, CA 91109 6 Software Engineer, Instruments & Science Data Systems, JPL/Caltech, Pasadena, CA 91109 7 Program Project Manager, Instruments & Science Data Systems, JPL/Caltech, Pasadena, CA 91109 8 Engineer, Instrument Integration and Test, JPL/Caltech, Pasadena, CA 91109 9 Research Scientist, Planetary Chemistry and Astrobiology, JPL/Caltech, Pasadena, CA 91109 10 Technologist, High Capacity Computing and Modeling, JPL/Caltech, Pasadena, CA 91109 11 Research Scientist, Atomic and Molecular Physics Group, JPL/Caltech, Pasadena, CA 91109 12 Research Scientist, AMC, Atomic and Molecular Physics Group, JPL/Caltech, Pasadena, CA 91109 13 Informatics Researcher, Machine Learning and Instrument Autonomy Group, JPL/Caltech, Pasadena, CA 91109 14 Electrical Engineer, Advanced Computer Systems and Technology, JPL/Caltech, Pasadena, CA 91109 15 Program Manager, Advanced Instrument Concepts, JPL/Caltech, Pasadena, CA 91109
Transcript of Trace Chemical and Major Constituents Measurements of the ...

1
American Institute of Aeronautics and Astronautics
Trace Chemical and Major Constituents Measurements of
the International Space Station Atmosphere by the Vehicle
Cabin Atmosphere Monitor
M. R. Darrach
1, A. Chutjian
2, B. J. Bornstein
3, A. P. Croonquist
4, V. Garkanian
5,
J. Hofman6, D. Karmon
7, J. Kenny
8, R. D. Kidd
9, S. Lee
10, J. A. MacAskill
11,
S. M. Madzunkov12
, L. Mandrake13
, R. T. Schaefer14
, and N. Toomarian15
Jet Propulsion Laboratory, California Institute of Technology, Pasadena CA 91109
We report on trace gas and major atmospheric constituents results obtained by the Vehicle Cabin Atmosphere
Monitor (VCAM) following almost two years of operation aboard the International Space Station (ISS). VCAM is
an autonomous environmental monitor based on a highly compact gas chromatograph/quadrupole ion trap mass
spectrometer. It was flown to the International Space Station (ISS) on shuttle mission STS-131 and commenced
operations on 6/10. VCAM is capable of providing measurements of both ppb levels of volatile trace-gas
constituents, and of the atmospheric major constituents (nitrogen, oxygen, argon, and carbon dioxide) in a space
vehicle or station. It is designed to operate autonomously and maintenance-free, approximately once per day, with a
self-contained gas supply sufficient for a one-year lifetime. VCAM’s performance is sufficient to detect and
identify 90% of the target compounds at their 180-day Spacecraft Maximum Allowable Concentration levels.
Nomenclature
AMDIS = Automated Mass Spectral Deconvolution and Identification System
AMP = Atomic and Molecular Physics Group
DU = Development Unit
ECLSS = Environmental Control and Life Support System
GC = Gas Chromatograph
GC/DMS = Gas Chromatograph/Differential Mobility Spectrometer
GC/MS = Gas Chromatograph/Mass Spectrometer
HOSC = Huntsville Operations Support Center
IFM = In Flight Maintenance
ISS = International Space Station
JPL = Jet Propulsion Laboratory
JSC = Johnson Space Flight Center
1 Senior Technologist, Atomic and Molecular Physics Group, JPL/Caltech, Pasadena, CA 91109
2 Senior Scientist, Atomic and Molecular Physics Group, JPL/Caltech, Pasadena, CA 91109
3 Scientific Applications Engineer, Instrument Autonomy Group, JPL/Caltech, Pasadena, CA 91109
4 Systems Engineer, MicroDevices Group, JPL CalTech, Pasadena, CA 91109
5 Mechanical Engineer, Optical Communications Group, JPL/Caltech, Pasadena, CA 91109
6 Software Engineer, Instruments & Science Data Systems, JPL/Caltech, Pasadena, CA 91109
7 Program Project Manager, Instruments & Science Data Systems, JPL/Caltech, Pasadena, CA 91109
8 Engineer, Instrument Integration and Test, JPL/Caltech, Pasadena, CA 91109
9 Research Scientist, Planetary Chemistry and Astrobiology, JPL/Caltech, Pasadena, CA 91109
10 Technologist, High Capacity Computing and Modeling, JPL/Caltech, Pasadena, CA 91109
11 Research Scientist, Atomic and Molecular Physics Group, JPL/Caltech, Pasadena, CA 91109
12 Research Scientist, AMC, Atomic and Molecular Physics Group, JPL/Caltech, Pasadena, CA 91109
13 Informatics Researcher, Machine Learning and Instrument Autonomy Group, JPL/Caltech, Pasadena, CA 91109
14 Electrical Engineer, Advanced Computer Systems and Technology, JPL/Caltech, Pasadena, CA 91109
15 Program Manager, Advanced Instrument Concepts, JPL/Caltech, Pasadena, CA 91109
2
American Institute of Aeronautics and Astronautics
LDHF = Long Duration Human Spaceflight
MCA = Major Constituents Analyzer
MSFC = Marshall Space Flight Center
MCE = Monitor and Control Electronics
MPLM = Multi-Purpose Logistics Module
NCO = Numerically-Controlled Oscillator
NIST = National Institute of Science and Technology
ORU = Orbital Replacement Unit
PC = Preconcentrator
PFU = Protoflight Unit
PE = Processor Electronics
rf = Radiofrequency
RSD = Relative Standard Deviation
SMAC = Spacecraft Maximum Allowable Concentration
STDO = Station Detailed Test Objective
TG = Trace Gas
TReK = Telescience Research Kit
VCAM = Vehicle Cabin Atmosphere Monitor
VOA = Volatile Organic Analyzer
VOCs = Volatile Organic Compounds
I. Introduction
afeguarding astronaut health during long duration human flight (LDHF) through the characterization of the
cabin atmosphere for trace chemicals and the major constituents is vitally important. In support of this goal,
NASA has supported long term research and development into the analytical devices necessary to perform these
measurements. On the International Space Station (ISS) there are have been many types of sensors for the detection
and identification of atmospheric constituents, such as a magnetic sector mass spectrometer in the Major
Constituents Analyzer1 (MCA), a quadrupole MS for medical monitoring (breath analysis)
2, a gas chromatograph
differential ion-mobility spectrometer (GC/IMS and GC/DMS)3-5
for trace volatile organic compounds (VOCs), a
Fourier transform infrared spectrometer6, a variety of solid-state detectors for CO and combustion products
7, and
Draeger tubes for hydrazine detection in airlocks. The terrestrial methodology typically employs a gas
chromatograph mass spectrometer (GC/MSs). GC/MSs have been indispensible in robotic exploration of the solar
system where these instruments are powerful tools for identifying atomic, molecular, and biological species, and
their abundances, in plasmas, complex atmospheres, liquids, or on surfaces. There would be a significant savings in
mass, volume, power and cost -- with no loss in performance -- if some of these sensors could be replaced by a
single, miniature GC/MS instrument. A successful environmental monitor must operate autonomously, providing
accurate and precise results in the complex ISS cabin environment while satisfying all requirements for sensitivity,
identification (of both known and unexpected chemical targets), dynamic range, and instrument mass-volume-
power. Examination of the chemicals on the Spacecraft Maximum Allowable Concentration (SMAC) target list
illustrates the analytical difficulty of the task. Given the variety and concentrations of these chemicals, coupled with
the potential for unexpected and unknown chemical releases into the LDHF environment, a GC/MS appears to be
the best instrument to address these requirements. A description of the VCAM GC/MS approach was presented
earlier.8-12
The results presented here summarize VCAM’s analytical performance during over 20 months of
operation as both a trace-gas and major atmospheric constituents analyzer aboard the ISS.
II. Description of VCAM
A functional schematic of the GCMS in VCAM is shown in Fig.1. For the analysis of cabin air for VOCs,
VCAM operates in its TG mode where air is sampled through a filtered inlet and adsorbed onto a preconcentrator
(PC) module. After adsorption, the residual air is purged and the VOCs are thermally desorbed from the PC, in a
low flow of helium, and into the GC microinjector. A portion of the VOC desorption stream is captured within the
microinjector sample loop (approximately 20 ℓ) and is injected onto the head of the GC column. The GC elution
stream is directed into a Paul ion-trap mass spectrometer where a pulsed beam of electrons ionizes the analytes. The
resultant ions are then mass-analyzed by the Paul trap in its so-called selective mass-instability mode: the RF
amplitude is swept linearly in time, and the ionized species are “walked” off the edge of the Paul trap stability
S

3
American Institute of Aeronautics and Astronautics
region. The mass/charge-selected ions are ejected onto the front cone of a channel-type electron multiplier, and the
mass spectrum stored. The Paul trap electrodes are coated with an inert silanizing layer. Together with an internal
halogen bulb which maintains the mass spectrometer at approximately 100C during operation, these ensure surface
cleanliness. The PCGC, microinjector, heaters, valves, sample pump, and Paul trap sequencing is controlled by the
onboard Monitor and Control Electronics (MCE) and Processor Electronics (PE). The mass spectra are analyzed
either autonomously onboard, or the data transmitted to ground and analyzed. In addition to the TG Mode, VCAM
has a second operating path called the MCA mode. Identical plumbing and Paul trap are used for species analysis in
this second mode. Here, cabin air is introduced directly into the microinjector and subsequent GC column,
bypassing the PC. In this mode three of the major cabin-air constituents (N2, O2, and CO2), as well as Ar, are
identified and monitored. This provides dissimilar redundancy to the magnetic sector-based Major Constituents
Analyzer already aboard ISS. Air is typically sampled at the VCAM location. An optional method is possible
whereby astronauts can employ an evacuated sample bag to collect material at other locations on ISS, which are then
connected to the VCAM sample inlet and their contents analyzed.
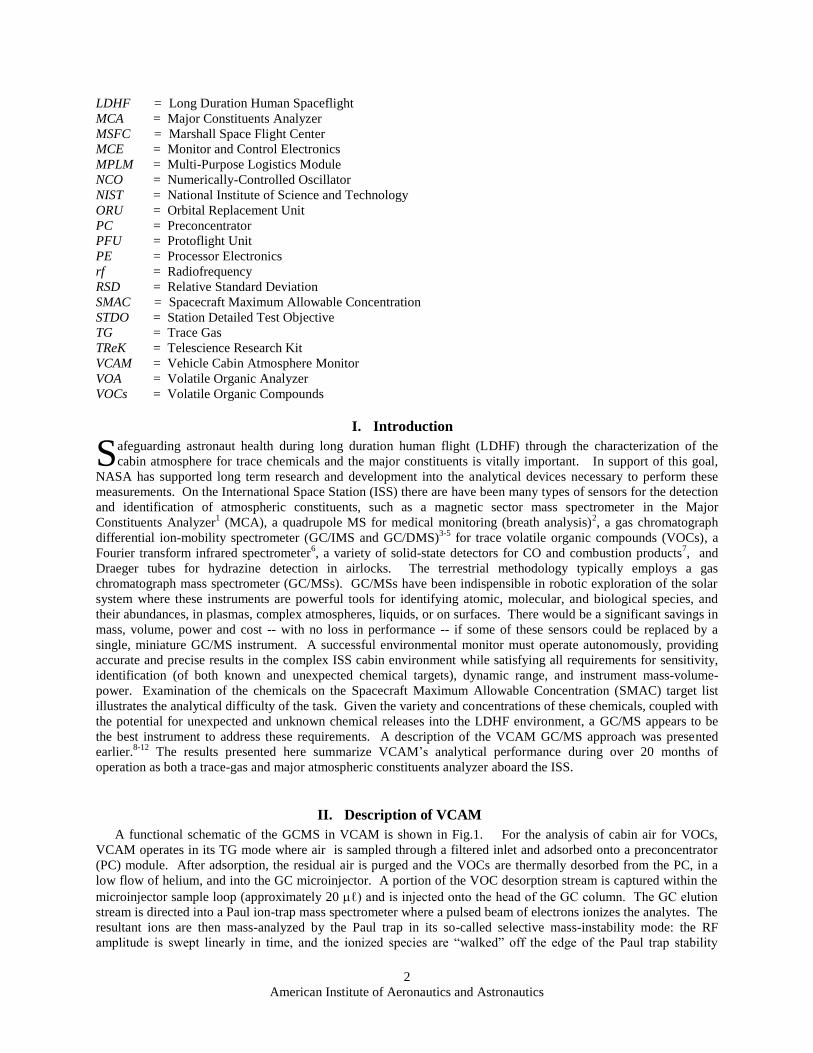
. A photograph of the VCAM PFU is shown in Fig. 2. Its mass is 25.2 kg (without consumables) and uses 140 W
(peak) and 100 W (nominal) power as derived from the EXPRESS 28V rack. Gas consumables sufficient for one
year of operational life comprise the orbital replacement unit (ORU). Its mass is 5.1 kg. The consumable gases are
contained in two tanks: one of pure helium used as the GC carrier gas, and the other of a calibrant gas mixture
(acetone, perfluropropane, and fluorobenzene in He) used to verify the GC and MS performance (e.g., mass range,
mass resolution, and mass cross-talk). Cooling is by means of forced air supplied from the ISS avionics air-cooling
loop; circulation through the VCAM interior is by a pair of internal fans. The VCAM sub-assemblies and packaging
were not optimized for volume as they occupy the standard 64.4 liter EXPRESS rack module. Downlink data
communication is through the ISS medium-rate data link, buffered onto the ISS high-rate outage recorder and
telemetered to Earth. The data are routed through the White Sands and Huntsville Operations Support Center
Turbo-Molecular
Drag Pump
Roughing
Pump
Gas
Chromatograph
Sample
<in>PreConcentrator
Calib. Gas
Carrier Gas
Sampling
Pump
Flow Restrictor
Detector
A
B
C
DPaul Ion Trap
Vacuum
Chamber
Ion
Source
Figure 1. Schematic Representation of the VCAM Subassemblies. The Paul ion trap is contained in the
high-vacuum Sensor Subassembly Module. The calibration and He carrier gases are part of the
Consumables ORU which can be replaced by the astronaut.
4
American Institute of Aeronautics and Astronautics
(HOSC), and then through the internet to JPL where they are presented via the Telescience Research Kit (TReK).
Uplink for on-orbit commanding is via the
inverse path. When necessary, new PFU
instrument sequences are first tested on the
VCAM Development Unit (DU). The DU is a
form-fit-function duplicate of the PFU. Once
operation is confirmed the sequence is
uploaded via TReK to the PFU on board ISS.
Typical measurement operations for trace gas
or major constituents are not performed via
direct ground commanding, but by uploading a
schedule for automated measurements several
days in advance.
Following successful completion of the
validation in 8/09, the PFU was delivered to
Kennedy Space Center (9/09) and packed into
the Leonardo MPLM (2/10). Launched
aboard STS-131 to the ISS occurred on 4/5/10,
VCAM was installed on 4/12/10 into Locker
#8 of EXPRESS Rack #2. After initial
checkout and startup procedures were
completed, the PFU commenced regular cabin-
air measurements on 6/6/10. Typical PFU
operations since that date have been to perform
3-7 trace VOC and two MCA measurements per
week. As part of VCAM’s on-orbit validation,
VCAM is performing co-temporal and co-
spatial measurements with Grab-Sample
Container (GSC) acquisitions made by the crew.
Periodically GSCs were returned to earth and
analyzed by the JSC toxicology personnel with
their GC/MS laboratory instrument. Where
possible comparisons of the two results became
the basis of gauging VCAM’s accuracy and
precision. Whenever possible, TG
measurements were also scheduled co-
temporally with those performed by the STDO
GC/DMS currently in the Destiny laboratory.
Unfortunately on 7/2/10, about one month
into operations, a halogen lamp inside the
vacuum chamber that is used to heat the Paul
ion trap mass spectrometer ceased nominal
operations. Therefore a series of
measurements were executed using both the
PFU and DU in the terrestrial laboratory in
order to extend the PFU quantization limits down to the characteristic ISS concentration levels and to recalibrate for
operations without the MS heater. Two recalibration methods were employed. The first used the existing PFU
instrument response curves, generated in the 2009 Validation test program, extrapolating from the high Validation
concentrations down to the lower ISS concentrations. The second method employed testing on the DU cocktails of
chemicals at ISS-like concentrations, then impressing the new response curves on the PFU. The two methods were
found to in excellent agreement and yielded only modest increases in the quantization error. Repeatability was not
affected by the loss of the heater. As such, trace gas measurements for the period between 08/2010 and 09/2011
were performed without the MS heater. Longer term, in order to recover nominal instrument performance, a patch
cable for VCAM was delivered to ISS on STS-134 such that when installed via an in-flight maintenance (IFM)
Figure 2. Photograph of the VCAM Protoflight Unit. Not
shown is the Orbital Replacement Unit (ORU) comprising the
helium GC carrier gas and calibrant gas.
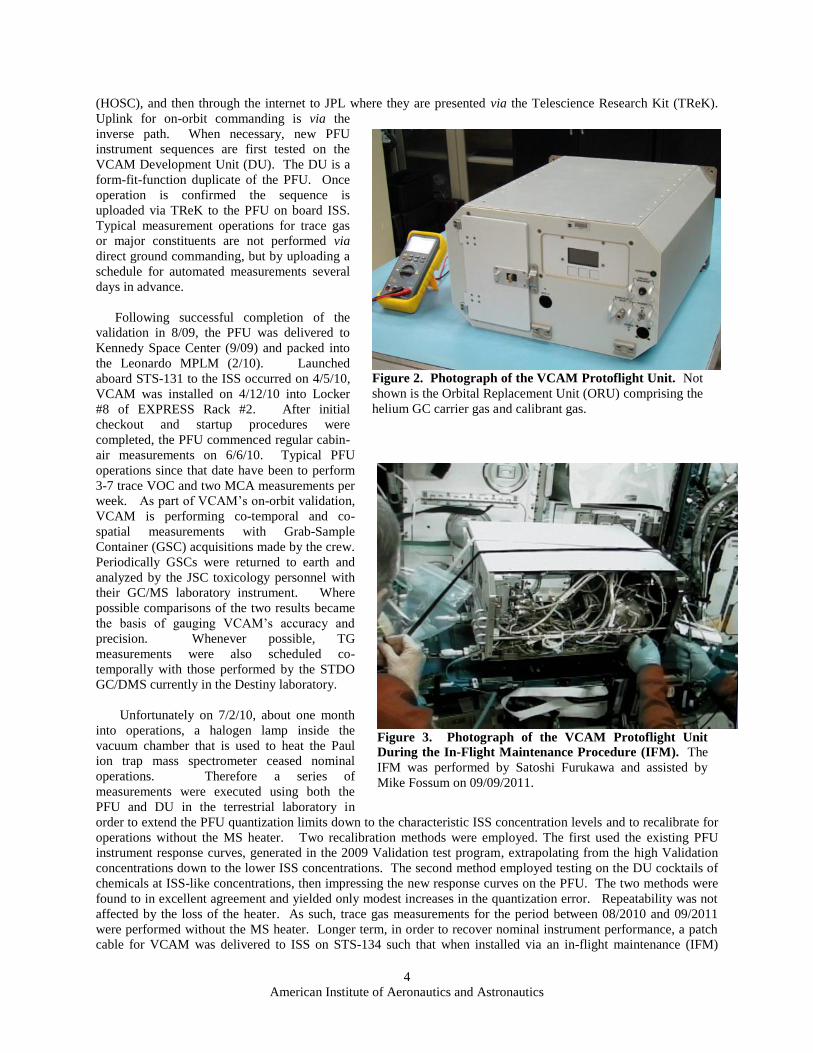
Figure 3. Photograph of the VCAM Protoflight Unit
During the In-Flight Maintenance Procedure (IFM). The
IFM was performed by Satoshi Furukawa and assisted by
Mike Fossum on 09/09/2011.

5
American Institute of Aeronautics and Astronautics
procedure a backup halogen heater bulb could be energized. On 09/09/2011, astronauts Staoshi Furukawa and
Mike Fossum successfully performed the IFM, as shown in Figure 3. The IFM procedure, in brief, was to remove a
VCAM side panel, de-mate a power supply cable from the vacuum chamber flange, and insert a patch cable between
the flange and the cable. The IFM also directed the astronauts to clean the inlet and outlet fan screens on the VCAM
avionics cooling air loop ports which had become slightly clogged over the last 20 months of operation. A series of
tests, discussed below, performed after the IFM demonstrated that VCAM had recovered all operational capabilities.
The increased airflow which resulted from the cleaned screens also slightly reduced the VCAM ambient
temperature, which yielded commensurate improvements in the chromatography. As of 03/2012 VCAM is
continuing operations, at the direction of NASA HQ, and is performing a scheduled TG and MCA measurement
once every two weeks.
III. VCAM Measurements
A. Measurements of Trace Volatile Organic Compounds in the ISS Atmosphere
Since the planning stages for the construction of the International Space Station (ISS) began the science
community recognized chemical exposure standards were required. The space station is a closed and complex
environment; some contamination of its internal atmosphere is unavoidable, where possibly a hundred or more
chemical contaminants are likely to be found in the closed-loop atmosphere of the space station. Important sources
of atmospheric contaminants include off-gassing of cabin materials, operation of equipment, and metabolic waste
products of crew members. Other potential sources of contamination are releases of toxic chemicals from
experiments, manufacturing activities performed on board the space station, and accidental spills and fires. The
water recycling system has also been shown to produce chemical contaminants that can enter the cabin air.
Therefore, the astronauts potentially can be chronically exposed to low levels of airborne contaminants and
occasionally to high levels of contaminants in the event of accidents, such as a leak, spill, or fire. In order to ensure
the health, functional abilities, and safety of the astronauts, chemical spacecraft maximum allowable concentrations
(SMACs) were developed for up to 180 days (for normal space-station operations) and for short-term (1-24 hr)
emergency exposures to high levels of contaminants. The SMAC species targeted by VCAM were divided into
three priority classes: Priority 1 species (nine total) including ethanol, acetone, dichloromethane, and
perfluoropropane; Priority 2 (16 total) including benzene, C5-C8 alkanes and C3-C8 aldehydes; and Priority 3 (12
total) including 2-butanone, freon-11, and freon-12. VCAM’s development history included an extensive validation
program to confirm that the PFU met or exceeded all requirements for identification (> 90%), quantization accuracy
(< 40%), and 24-hour precision (< 20%).11
The chemicals, the VCAM required concentration range, and their
typical ISS concentrations are summarized in Table 1.
The VCAM instrument was designed to operate autonomously per a scheduled set of sequences sent up by the
instrument science team. The schedule specified the date, time, and sequence number required to perform a VCAM
operation; typically 6 sequences were required to perform a trace gas measurement. Once these parameters were sent
to the VCAM, the instrument executed the run automatically. The automatic run execution includes instrument
conditioning steps, sample acquisition, sample introduction into the GC column and MS detector, and telemetry of
the instrument’s raw response data to the ground. An automated Data Analysis routine loaded in VCAM can be run
as part of a schedule or it can be performed on the ground; due to issues discussed above, the VCAM operations
team chose to execute the “extraction and analysis” routines on the ground. Once received on the ground the
instrument’s raw response data was analyzed by software. The first algorithm, AMDIS, identified valid elution
peaks and extracted from the raw data the total ion counts (signal) for each chemical detected. These ion counts
were then evaluated using an algebraic expression which converted the total ion counts into a concentration using
calibration parameters. Since the nominal concentrations of many of trace organic species in the ISS atmosphere
are actually much lower relative to originally-specified VCAM requirements, the PFU quantization limits were
extended downwards soon after commencing operations. This was done by modifying the calibration parameters
based upon additional testing with the DU and PFU.
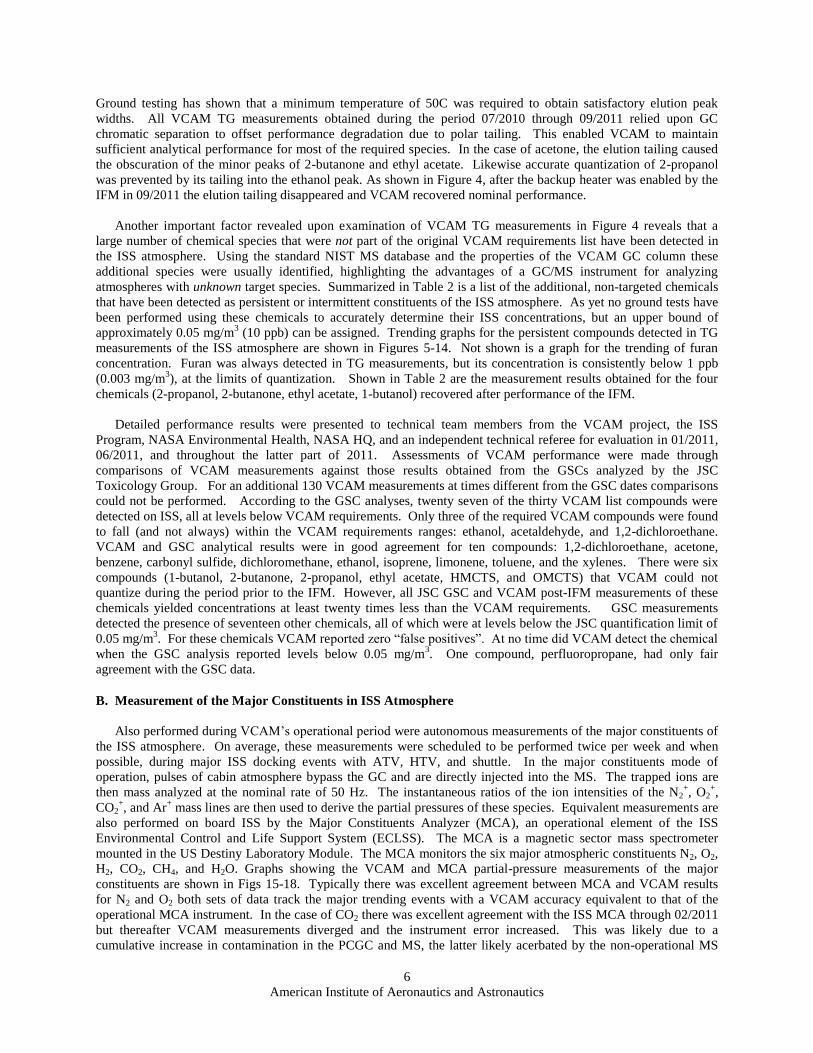
Shown in Figure 4 are examples of ion chromatograms normally obtained for TG measurements of the ISS
atmosphere after the IFM, with the MS heater is energized (Fig. 4 bottom) or not energized (Fig. 4 top). Polar
species admitted into an unheated MS exhibit significant tailing in the elution peaks due to surface effects in the MS,
a phenomenon often seen in terrestrial ion trap mass spectrometry. Polar species such as 1-butanol become
undetectable in an unheated ion trap MS even at concentrations higher than typically found in the ISS atmosphere.
6
American Institute of Aeronautics and Astronautics
Ground testing has shown that a minimum temperature of 50C was required to obtain satisfactory elution peak
widths. All VCAM TG measurements obtained during the period 07/2010 through 09/2011 relied upon GC
chromatic separation to offset performance degradation due to polar tailing. This enabled VCAM to maintain
sufficient analytical performance for most of the required species. In the case of acetone, the elution tailing caused
the obscuration of the minor peaks of 2-butanone and ethyl acetate. Likewise accurate quantization of 2-propanol
was prevented by its tailing into the ethanol peak. As shown in Figure 4, after the backup heater was enabled by the
IFM in 09/2011 the elution tailing disappeared and VCAM recovered nominal performance.
Another important factor revealed upon examination of VCAM TG measurements in Figure 4 reveals that a
large number of chemical species that were not part of the original VCAM requirements list have been detected in
the ISS atmosphere. Using the standard NIST MS database and the properties of the VCAM GC column these
additional species were usually identified, highlighting the advantages of a GC/MS instrument for analyzing
atmospheres with unknown target species. Summarized in Table 2 is a list of the additional, non-targeted chemicals
that have been detected as persistent or intermittent constituents of the ISS atmosphere. As yet no ground tests have
been performed using these chemicals to accurately determine their ISS concentrations, but an upper bound of
approximately 0.05 mg/m3 (10 ppb) can be assigned. Trending graphs for the persistent compounds detected in TG
measurements of the ISS atmosphere are shown in Figures 5-14. Not shown is a graph for the trending of furan
concentration. Furan was always detected in TG measurements, but its concentration is consistently below 1 ppb
(0.003 mg/m3), at the limits of quantization. Shown in Table 2 are the measurement results obtained for the four
chemicals (2-propanol, 2-butanone, ethyl acetate, 1-butanol) recovered after performance of the IFM.
Detailed performance results were presented to technical team members from the VCAM project, the ISS
Program, NASA Environmental Health, NASA HQ, and an independent technical referee for evaluation in 01/2011,
06/2011, and throughout the latter part of 2011. Assessments of VCAM performance were made through
comparisons of VCAM measurements against those results obtained from the GSCs analyzed by the JSC
Toxicology Group. For an additional 130 VCAM measurements at times different from the GSC dates comparisons
could not be performed. According to the GSC analyses, twenty seven of the thirty VCAM list compounds were
detected on ISS, all at levels below VCAM requirements. Only three of the required VCAM compounds were found
to fall (and not always) within the VCAM requirements ranges: ethanol, acetaldehyde, and 1,2-dichloroethane.
VCAM and GSC analytical results were in good agreement for ten compounds: 1,2-dichloroethane, acetone,
benzene, carbonyl sulfide, dichloromethane, ethanol, isoprene, limonene, toluene, and the xylenes. There were six
compounds (1-butanol, 2-butanone, 2-propanol, ethyl acetate, HMCTS, and OMCTS) that VCAM could not
quantize during the period prior to the IFM. However, all JSC GSC and VCAM post-IFM measurements of these
chemicals yielded concentrations at least twenty times less than the VCAM requirements. GSC measurements
detected the presence of seventeen other chemicals, all of which were at levels below the JSC quantification limit of
0.05 mg/m3. For these chemicals VCAM reported zero “false positives”. At no time did VCAM detect the chemical
when the GSC analysis reported levels below 0.05 mg/m3. One compound, perfluoropropane, had only fair
agreement with the GSC data.
B. Measurement of the Major Constituents in ISS Atmosphere
Also performed during VCAM’s operational period were autonomous measurements of the major constituents of
the ISS atmosphere. On average, these measurements were scheduled to be performed twice per week and when
possible, during major ISS docking events with ATV, HTV, and shuttle. In the major constituents mode of
operation, pulses of cabin atmosphere bypass the GC and are directly injected into the MS. The trapped ions are
then mass analyzed at the nominal rate of 50 Hz. The instantaneous ratios of the ion intensities of the N2+, O2
+,
CO2+, and Ar
+ mass lines are then used to derive the partial pressures of these species. Equivalent measurements are
also performed on board ISS by the Major Constituents Analyzer (MCA), an operational element of the ISS
Environmental Control and Life Support System (ECLSS). The MCA is a magnetic sector mass spectrometer
mounted in the US Destiny Laboratory Module. The MCA monitors the six major atmospheric constituents N2, O2,
H2, CO2, CH4, and H2O. Graphs showing the VCAM and MCA partial-pressure measurements of the major
constituents are shown in Figs 15-18. Typically there was excellent agreement between MCA and VCAM results
for N2 and O2 both sets of data track the major trending events with a VCAM accuracy equivalent to that of the
operational MCA instrument. In the case of CO2 there was excellent agreement with the ISS MCA through 02/2011
but thereafter VCAM measurements diverged and the instrument error increased. This was likely due to a
cumulative increase in contamination in the PCGC and MS, the latter likely acerbated by the non-operational MS

7
American Institute of Aeronautics and Astronautics
heater. Unfortunately for the period between 06/2011 and 02/2012 there was minimal ISS MCA data from the US
Laboratory for evaluation of VCAM performance before and after the IFM.
IV. Conclusions
VCAM returned excellent qualitative results and good quantitative results for the compounds for which direct
comparisons can be made to discrete concentrations reported from GSC samples. VCAM has been evaluated to be a
viable part of the overall technical solution to cabin-atmospheric monitoring for long-term human exploration.
Qualitative major constituents analysis and trending as compared to the ISS MCA is excellent. This capability
makes the VCAM a valuable backup to the ISS MCA for cabin-atmosphere major constituent analysis. Continued
development of VCAM toward improved quantitative performance and component reliability is highly
recommended and should receive priority by NASA and ISS Program technology development organizations.
VCAM demonstration on board the ISS will be continued as consumables and funding permit. Efforts should be
made to return the VCAM ISS to Earth post-flight evaluation on the Space-X Dragon spacecraft.
Acknowledgments
The authors would like to thank the following individuals for their dedicated effort in assisting with successful
VCAM operations, technical reviews, and management: D. Jan (JPL), J. Joshi (NASA HQ), T Limero (JSC), A.
Macatangay (JSC), P. Mudgett (JSC), Y. Park (JPL), and J. Perry (MSFC). This work was carried out at
JPL/Caltech, and was supported through agreement with the National Aeronautics and Space Administration
References
1Granahan, J. E., Thoresen, S. M., “Major Constituent Analyzer (MCA) Mass Spectrometer Operating Life Improvements”,
SAE International Journal of Aerospace April 2009 vol. 1 no. 1 25-32 2West, J. B.; Elliot, A. R.; Guy, H. J.; Prisk, G. K. “Pulmonary function in space.”, J. Am. Med. Assoc. 1997, 227, 1957–
1961. 3Limero, T., Reese, E., Trowbridge, J., Hohmann, R., James, J. “Validation of the Volatile Organic Analyzer (VOA) Aboard
the International Space Station”, SAE Technical Paper Series 2003-01-2646, 33rd International Conference on Environmental
Systems, Vancouver, British Columbia, Canada, July 2003. 4Limero, T., “Revalidation of the Volatile Organic Analyzer (VOA) Following a Major On-Orbit Maintenance Activity,” SAE
Technical Paper Series 2007-01-3320, 37th International Conference on Environmental Systems, Chicago, Illinois, July 2007. 5Limero, T., Reese, E., Cheng, P., “Demonstration of the MicroAnalyzer’s Measurement of Common Trace Volatile Organic
Compounds in Spacecraft Atmospheres”, SAE Technical Paper Series 2008-01-2128, 38th International Conference on
Environmental Systems, San Francisco, California, July 2009. 6Honne, A., Schumann, H., et al. “Evaluation of ANITA Air Monitoring on the International Space Station”, 2009-01-2520,
39th International Conference on Environmental Systems, Savannah, Georgia, July 2009. 7Limero, T., Beck, S.W., James, J., “The Portable Monitor for Measuring Combustion Products Aboard the International
Space Station”, SAE Technical Paper Series 2002-01-2298, 32nd International Conference on Environmental Systems, San
Antonio, TX, July 2002. 8 Shortt, B. J., Darrach, M. R.; Holland, P. M., Chutjian, A., Miniaturized System of a Gas Chromatograph Coupled with a
Paul Ion Trap Mass Spectrometer, J. Mass Spectrom 2005, 40, 36. 9 Chutjian, A., Darrach, M., et al., “Overview of the Vehicle Cabin Atmosphere Monitor, a Miniature Gas
Chromatograph/Mass Spectrometer for Trace Contamination Monitoring on the ISS and CEV”, SAE Technical Paper Series
2007-01-3150, 37th International Conference on Environmental Systems, Chicago, Illinois, July 2007. 10Chutjian, A., Darrach, M. et al., “Results Using the Vehicle Cabin Atmosphere Monitor: A Miniature Gas
Chromatograph/Mass Spectrometer for Trace Contamination Monitoring on the ISS and Orion”, SAE Technical Paper Series
2008-01-2045, 38th International Conference on Environmental Systems, San Francisco, California, July 2008. 11Darrach, M., Chutjian, A. et al., “Validation Test Results from the Vehicle Cabin Atmosphere Monitor”, J. Am. Inst.
Aeronautics & Astronautics, Electronic 2010-6094. 12Darrach, M., Chutjian, A. et al.,“On-orbit measurements of the ISS atmosphere by the Vehicle Cabin Atmosphere Monitor”.
J. Am. Inst. Aeronautics & Astronautics. Electronic, 2011-5214.

8
American Institute of Aeronautics and Astronautics
Trace Chemical Species
VCAM Requirements
Range (mg/m3)
Range of GSC Measurements
(mg/m3)
1,2-dichloroethane 0.04 - 4 TRACE - 0.054
acetone 2.2 – 11.9 0.45 - 0.21
benzene .03 - 3 < 0.05
carbonyl sulfide 0.025 – 2.5 not detected
dichloromethane 0.1 – 17.2 < 0.05
ethanol 1.9 – 18.8 2.4 – 4.6
isoprene 0.14 – 2.8 0.06 – 0.09
limonene 5.6 – 55.6 TRACE to 0.38
toluene 3.8 – 37.6 TRACE to 0.08
xylenes (o, m, p) 4.4 - 44 0.05 – 0.15
4-methyl 2-pentanone 8 - 41 < 0.05
acetaldehyde 0.18 – 5.4 0.05 – 0.19
chloroform 0.1 – 4.9 < 0.05
ethyl benzene 4.4 - 44 TRACE to < 0.05
freon 11 11.2 - 56 < 0.05
freon 113 15 - 76 < 0.05
furan 0.028 – 2.8 < 0.05
hexanal 0.4 – 8.2 < 0.05
hexane 7 - 70 < 0.05
pentanal 0.4 - 7 < 0.05
pentane 5.9 - 59 < 0.05
vinyl chloride 0.13 -2.6 < 0.05
1-butanol 4.4 - 44 0.08 - 0.16
2-butanone 1.5 – 14.7 TRACE to <0.05
2-propanol 2.4 - 24 0.11 - 0.3
ethyl acetate 3.6 - 36 TRACE to 0.15
HMCTS Identify only < 0.05
OMCTS 0.6 – 11.5 < 0.05
perfluoropropane 77 - 769 28 - 100
propylene glycol Identify only not detected
Table 1. List of Required VCAM Species with VCAM Required and
Typical ISS Concentration Ranges. JSC Toxicology reports TRACE
results for any measurement where the chemical’s presence is detected but is
below the level of quantization. Following the IFM on 09/09/2011, the
VCAM PFU recovered analytical performance for the siloxanes, aldehydes,
2-propanol, 1-butanol, ethyl acetate, and 2-butanone.
Chemical Species
1,3 dioxolane
1-butene
2-butanal
2-methyl-2-propanol
2-methyl butane
benzaladehyde
carbon disulfide
chlorobenzene
cyclohexanone
dichlorobenzene
decamethylcyclopentasiloxane
ethoxyethanol
methyl acetate
styrene
trimethylbenzene
trimethylsilanol
Table 2. Additional. Non-
Targeted Species Detected in ISS
Trace Gas Measurements. No
ground testing has been performed as
yet with these chemicals to
accurately determine the ISS
concentration. An upper bound of
approximately 10 ppb (0.05 mg/m3)
can be assigned.

9
American Institute of Aeronautics and Astronautics
VCAM TG Measurements Following IFM Comparison of Chromatograms With and Without MS Heater Bulb
Figure 4. Total Ion Chromatograms Obtained During VCAM ISS Trace Gas Measurements Before and
After the In-Flight Maintenance. Examples of ion chromatograms obtained during TG measurements of the
ISS atmosphere when the MS heater was off (top) on 8/11/10. Also shown is the ion chromatogram obtained
with the MS heater on (bottom) on 09/19/11. The chemical identification of the elution peaks is obtained by
matching the peak number to the chemicals listed in the text box on the right.

10
American Institute of Aeronautics and Astronautics
Figure 6. Dichloromethane Concentration in the ISS Atmosphere Obtained from VCAM TG
Measurements. Data are for PFU measurements obtained with MS heater ON (open circle) and MS Heater
OFF (closed circles). Absolute error in the dichloromethane concentration is currently about 60% with a
precision error of less than 20%. JSC reported GSC concentrations are shown in red, where JSC defines
TRACE as having a concentration great enough to report the presence of the chemical but not an analytical
quantity.
Figure 5. Acetone Concentration in the ISS Atmosphere Obtained from VCAM TG Measurements. Data
are for PFU measurements obtained with MS heater ON (open circle) and MS Heater OFF (closed circles).
Absolute error in the acetone concentration is currently about 70% with a precision error of less than 20%. JSC
reported GSC concentrations are shown with red crosses.

11
American Institute of Aeronautics and Astronautics
Figure 7. Ethanol Concentration in the ISS Atmosphere Obtained from VCAM TG Measurements. Data
are for PFU measurements obtained with MS heater ON (open circle) and MS Heater OFF (closed circles).
Absolute error in the ethanol concentration is currently about 50% with a precision error of less than 20%. JSC
reported GSC concentrations are shown with red crosses.
Figure 8. Ethyl Benzene Concentration in the ISS Atmosphere Obtained from VCAM TG Measurements.
Data are for PFU measurements obtained with MS heater ON (open circle) and MS Heater OFF (closed circles).
Absolute error in the ethyl benzene concentration is currently about 60% with a precision error of less than 20%.
JSC reported GSC concentrations are shown in red, where JSC defines TRACE as having a concentration great
enough to report the presence of the chemical but not an analytical quantity.
12
American Institute of Aeronautics and Astronautics
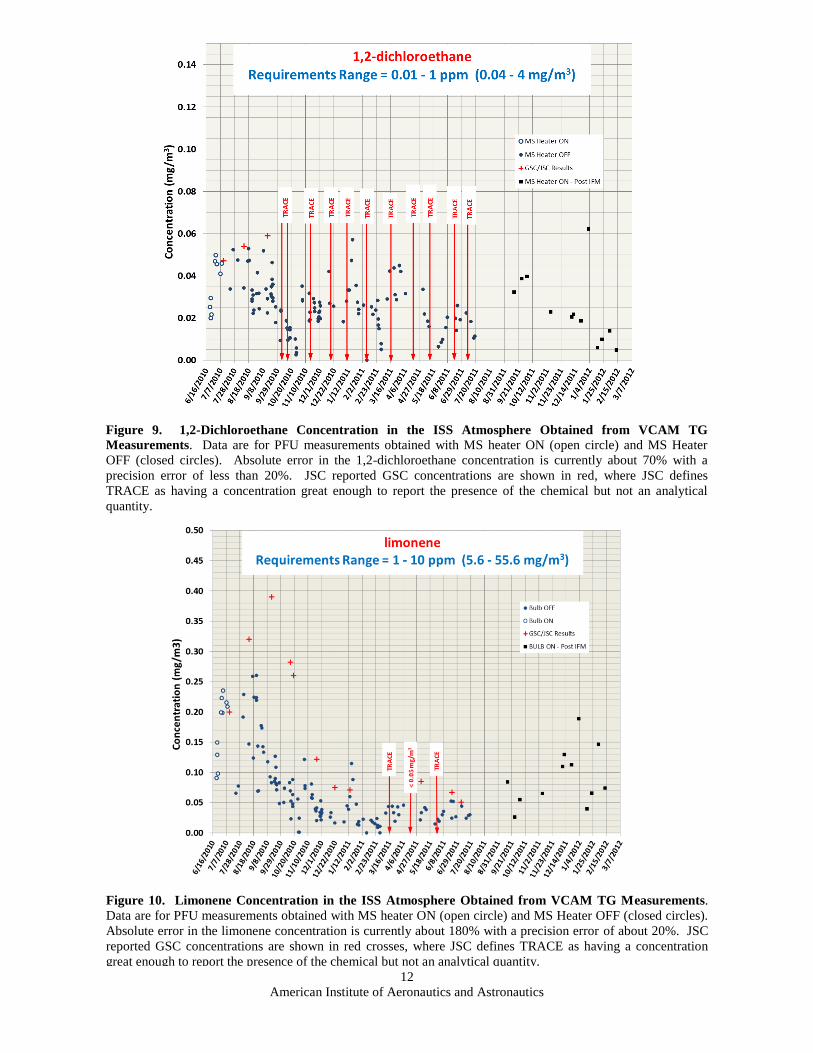
Figure 9. 1,2-Dichloroethane Concentration in the ISS Atmosphere Obtained from VCAM TG
Measurements. Data are for PFU measurements obtained with MS heater ON (open circle) and MS Heater
OFF (closed circles). Absolute error in the 1,2-dichloroethane concentration is currently about 70% with a
precision error of less than 20%. JSC reported GSC concentrations are shown in red, where JSC defines
TRACE as having a concentration great enough to report the presence of the chemical but not an analytical
quantity.
Figure 10. Limonene Concentration in the ISS Atmosphere Obtained from VCAM TG Measurements.
Data are for PFU measurements obtained with MS heater ON (open circle) and MS Heater OFF (closed circles).
Absolute error in the limonene concentration is currently about 180% with a precision error of about 20%. JSC
reported GSC concentrations are shown in red crosses, where JSC defines TRACE as having a concentration
great enough to report the presence of the chemical but not an analytical quantity.

13
American Institute of Aeronautics and Astronautics
Figure 11. Perfluoropropane Concentration in the ISS Atmosphere Obtained from VCAM TG
Measurements. Data are for PFU measurements obtained with MS heater ON (open circle) and MS Heater
OFF (closed circles). Absolute error in the perfluoropropane concentration is currently about 60% with a
precision error of about 20%. JSC reported GSC concentrations are shown in red. JSC reported GSC
concentrations are shown with red crosses.
Figure 12. Toluene Concentration in the ISS Atmosphere Obtained from VCAM TG Measurements.
Data are for PFU measurements obtained with MS heater ON (open circle) and MS Heater OFF (closed circles).
Absolute error in the toluene concentration is currently about 100% with a precision error of less than 20 JSC
reported GSC concentrations are shown in red crosses, where JSC defines TRACE as having a concentration
great enough to report the presence of the chemical but not an analytical quantity.
14
American Institute of Aeronautics and Astronautics
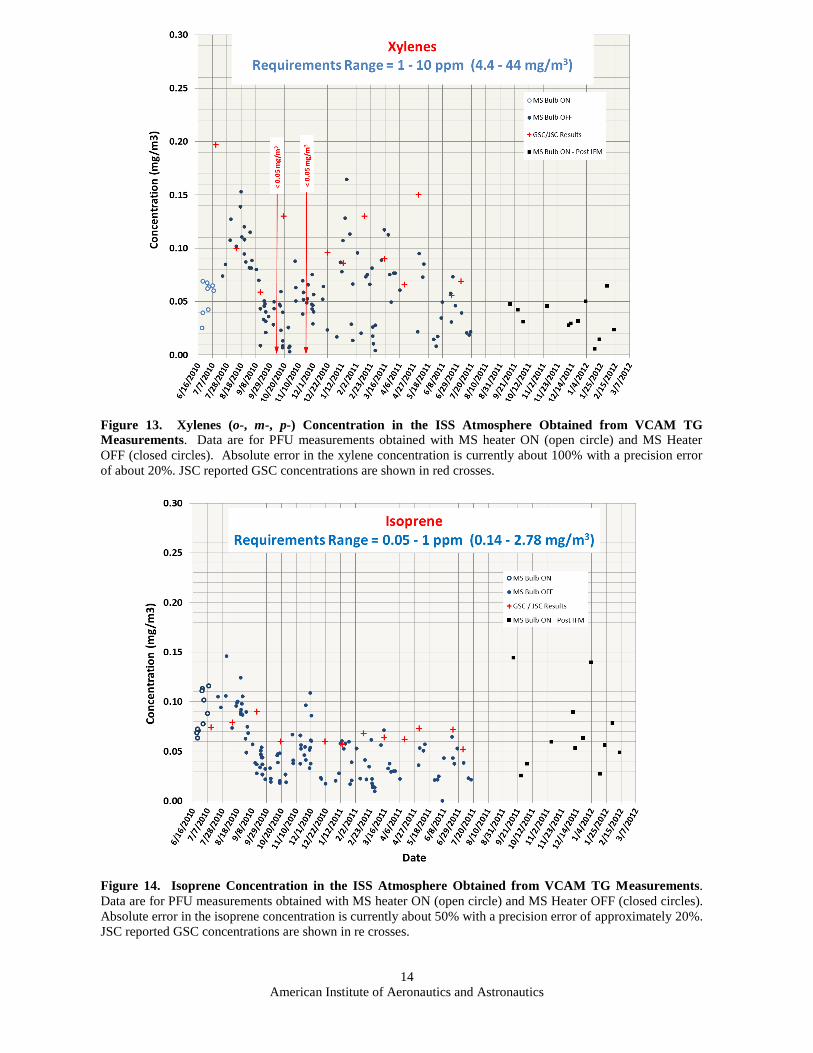
Figure 13. Xylenes (o-, m-, p-) Concentration in the ISS Atmosphere Obtained from VCAM TG
Measurements. Data are for PFU measurements obtained with MS heater ON (open circle) and MS Heater
OFF (closed circles). Absolute error in the xylene concentration is currently about 100% with a precision error
of about 20%. JSC reported GSC concentrations are shown in red crosses.
Figure 14. Isoprene Concentration in the ISS Atmosphere Obtained from VCAM TG Measurements.
Data are for PFU measurements obtained with MS heater ON (open circle) and MS Heater OFF (closed circles).
Absolute error in the isoprene concentration is currently about 50% with a precision error of approximately 20%.
JSC reported GSC concentrations are shown in re crosses.

15
American Institute of Aeronautics and Astronautics
Chemical
Concentration (mg/m3)
9/15
2011
9/26
2011
10/4
2011
11/8
2011
12/9
2011
12/12
2011
12/23
2011
1/3
2012
1/16
2012
1/23
2012
2/3
2012
2/13
2012
2/20
2012
2-propanol 1.5 0.4 0.4 1.0 0.2 0.6 0.7 NR 0.5 0.6 0.3 0.2 NR
2-butanone 0.04 0.03 0.03 0.04 0.03 0.04 0.03 0.02 0.01 ND 0.02 0.02 0.06
ethyl acetate 0.01 0.01 0.16 0.01 0.01 0.01 0.01 0.02 < 0.01 <0.01 0.01 0.01 0.03
n-butanol 0.4 0.3 0.3 0.4 0.3 0.3 0.3 0.2 0.1 0.2 0.2 0.2 0.2
Table 3. List of VCAM Measurements For Chemicals Recovered After the IFM. Following the IFM on 09/09/2011,
the VCAM PFU recovered analytical performance for 2-propanol, 1-butanol, ethyl acetate, and 2-butanone. Measurements
with entries of NR denote No Results, typically due to insufficient GC chromatic separation with the ethanol peak. There
are no results available, as yet, for GSCs during this timeframe for comparison. Note: during Validation testing chemical
cocktails exchanged between JSC Toxicology and VCAM typically indicated VCAM measurements of n-butanol
concentrations were approximately 3x greater than those measured by JSC Toxicology.
16
American Institute of Aeronautics and Astronautics
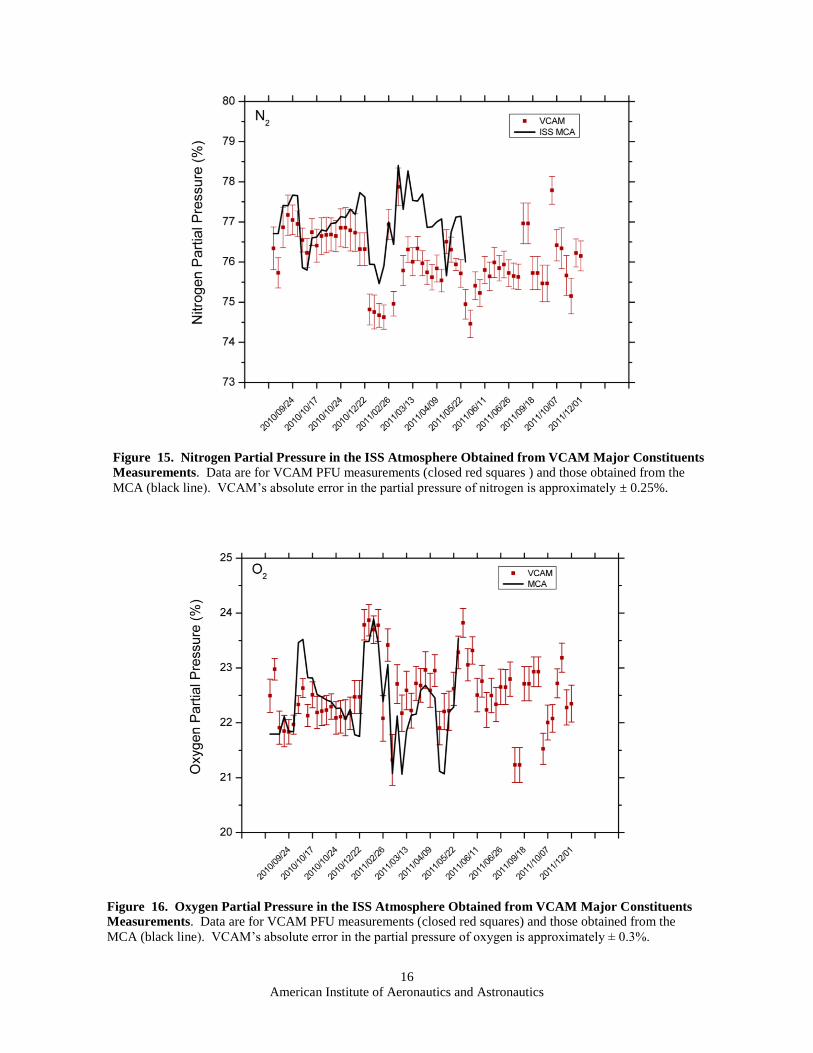
Figure 16. Oxygen Partial Pressure in the ISS Atmosphere Obtained from VCAM Major Constituents
Measurements. Data are for VCAM PFU measurements (closed red squares) and those obtained from the
MCA (black line). VCAM’s absolute error in the partial pressure of oxygen is approximately ± 0.3%.
Figure 15. Nitrogen Partial Pressure in the ISS Atmosphere Obtained from VCAM Major Constituents
Measurements. Data are for VCAM PFU measurements (closed red squares ) and those obtained from the
MCA (black line). VCAM’s absolute error in the partial pressure of nitrogen is approximately ± 0.25%.
17
American Institute of Aeronautics and Astronautics
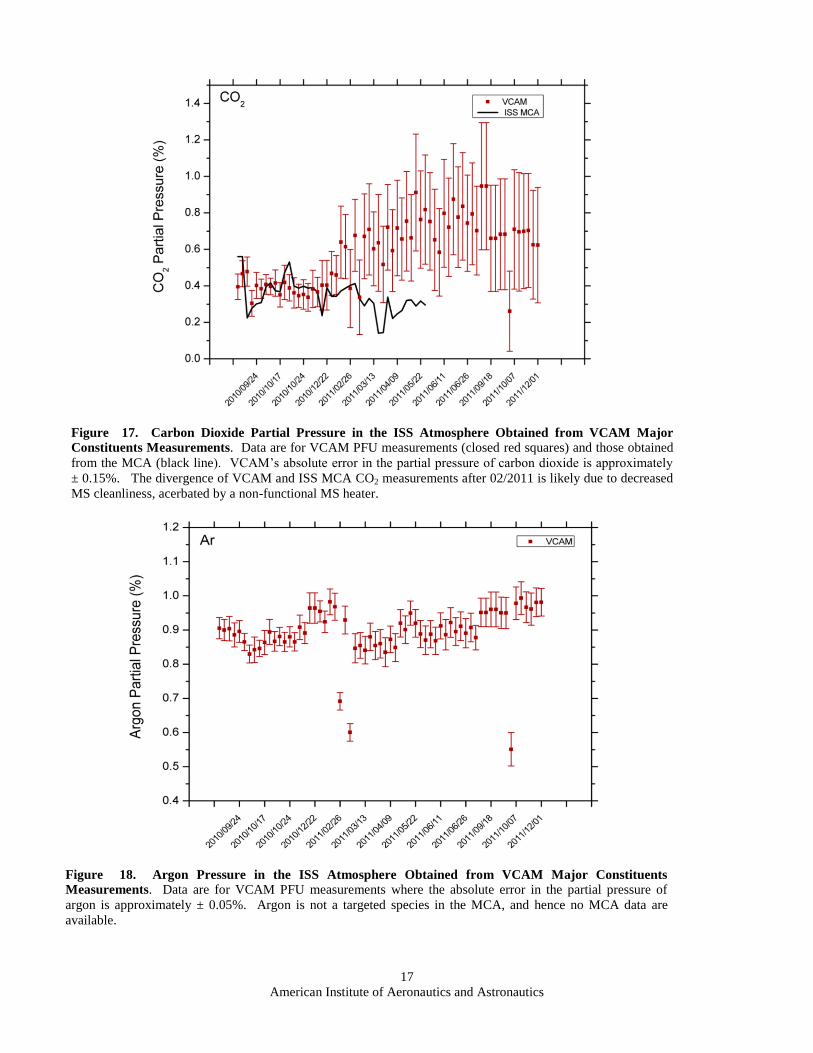
Figure 17. Carbon Dioxide Partial Pressure in the ISS Atmosphere Obtained from VCAM Major
Constituents Measurements. Data are for VCAM PFU measurements (closed red squares) and those obtained
from the MCA (black line). VCAM’s absolute error in the partial pressure of carbon dioxide is approximately
± 0.15%. The divergence of VCAM and ISS MCA CO2 measurements after 02/2011 is likely due to decreased
MS cleanliness, acerbated by a non-functional MS heater.
Figure 18. Argon Pressure in the ISS Atmosphere Obtained from VCAM Major Constituents
Measurements. Data are for VCAM PFU measurements where the absolute error in the partial pressure of
argon is approximately ± 0.05%. Argon is not a targeted species in the MCA, and hence no MCA data are
available.