TR European Growth Trust PLC Registered as an investment ...
66
TR European Growth Trust PLC – Annual Report 2017 HGI9228/2017 TR EUROPEAN GROWTH TRUST PLC Annual Report 2017
Transcript of TR European Growth Trust PLC Registered as an investment ...

HGI9228/2017
TR E
uropean Grow
th Trust PLC
– Annual R
eport 2017 H
GI9228/2017
TR EUROPEAN GROWTH TRUST PLCAnnual Report 2017
This report is printed on cocoon silk 50% recycled, a recycled paper containing 50% recycled waste and
50% virgin fibre and manufactured at a mill certified with ISO 14001 environmental management
standard. The pulp used in this product is bleached using an Elemental Chlorine Free process (ECF).
The FSC® logo identifies products which contain wood from well managed forests certified in
accordance with the rules of the Forest Stewardship Council®.
Typeset by 2112 Communications, London. Printed by Pureprint Group Limited
TR European Growth Trust PLC Registered as an investment company in England and Wales Registration Number 2520734 Registered office: 201 Bishopsgate, London EC2M 3AE
SEDOL/ISIN number: Ordinary Shares: 0906692/GB0009066928 London Stock Exchange (TIDM) Code: TRG Global Intermediary Identification Number (GIIN): JX9KYH.99999.SL.826 Legal Entity Identifier (LEI): 213800N1B1HCQG2W4V90
Telephone: 0800 832 832 Email: [email protected]
www.treuropeangrowthtrust.com
ShareholderCommunication
Awards
2017WINNER
ShareholderCommunication
Awards
2016
ShareholderCommunication
Awards
2016

Strategic Report
Performance Highlights 2-3
Business Model 4 Investment Objective 4 Investment Policy 4 General 4 Management arrangements 4
Chairman’s Statement 5 Performance 5 Revenue and dividends 5 Investment Objective and Policy 5 Annual General Meeting 5 Manager 5 Outlook 5
Portfolio Information 6 Ten largest investments 6 Sector exposure 6 Geographic exposure 6 Gearing levels over the year 6
Fund Managers’ Report 7-9 Introduction 7 The Portfolio 7-8 Outlook 9
Historical Performance and Financial Information 10
Total return performance 10 Share price movement against indices since launch 10 Financial information 10
Corporate Information 11-14 Directors 11 Registered office 12 Service providers 12 Independent auditors 12 Financial calendar 12 Information sources 12 Investing 12 Nominee share code 12 Status 13 Principal risks 13 Viability statement 13 Key performance indicators 14 Borrowings 14 Future developments 14 Responsible investment, voting and the
UK Stewardship Code 14 Employees, social, community,
human rights and environmental matters 14 Diversity 14
Glossary 15-16
Corporate Report
Directors’ Report 18
Statement of Directors’ Responsibilities 19
Directors’ Remuneration Report 20-22
Corporate Governance Statement 23-26
Audit Committee Report 27-28
Independent Auditors’ Report to the Members of TR European Growth Trust PLC 29-34
Consolidated Statement of Comprehensive Income 35
Consolidated and Parent Company Statements of Changes in Equity 36
Consolidated and Parent Company Balance Sheets 37
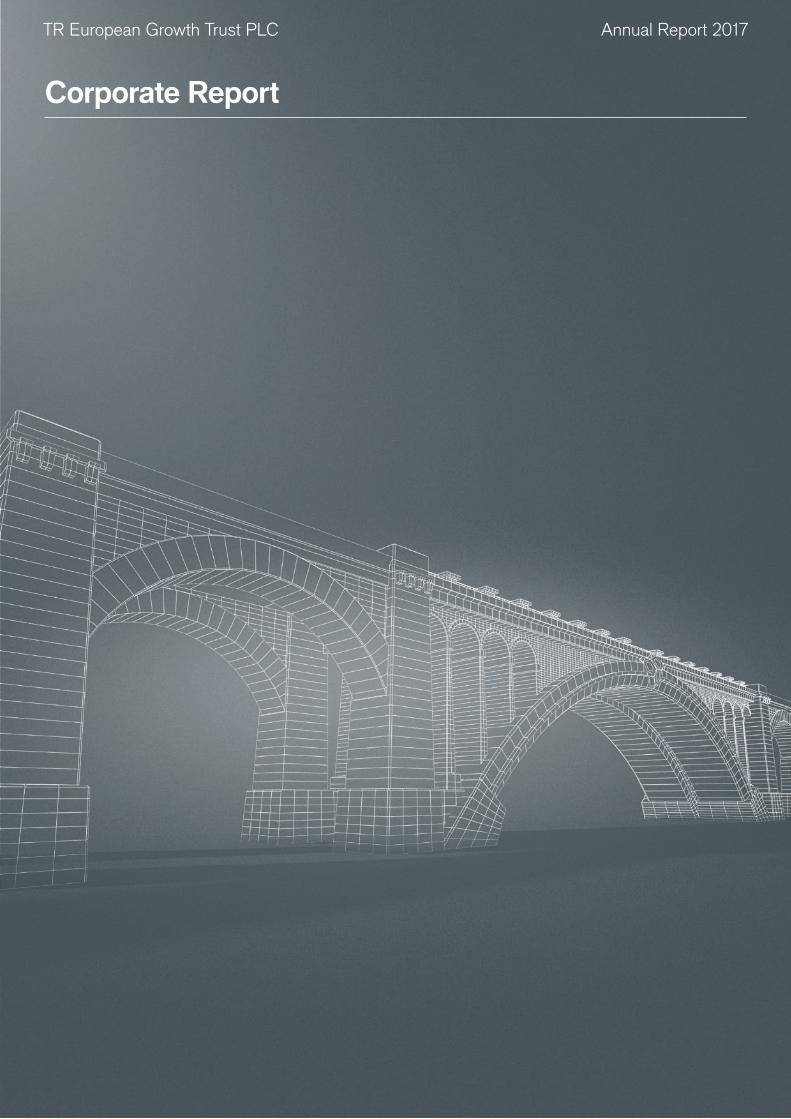
Consolidated and Parent Company Cash Flow Statements 38
Notes to the Financial Statements 39-58
General Shareholder Information 59
Investment Portfolio 60-62
Contents
TR European Growth Trust PLC Annual Report 2017
The image on the front cover is the Adolphe Bridge, Luxembourg.

Strategic Report
Investment ObjectiveThe Company seeks capital growth by investing in smaller and medium sized companies which are quoted, domiciled, listed or have operations in Europe (excluding the UK).
TR European Growth Trust PLC Annual Report 2017

Total Return Performance for year to 30 June 2017
800
900
1000
1100
1200
1300
1400
1500
1600
Benchmark
Source: Datastream
Share
NAV
May17
Apr17
Mar17
Feb17
Jan17
Dec16
Nov16
Oct16
Sep16
Aug16
Jul16
Jun17
Jun16
0
4
8
12
16
20
2017
18.0
6.5
2016
%
NAV1
+54.0
+35.8
+75.5
64
%
48
32
16
0 Benchmark2
Share price3
Discount at year end4
NAV and share price performance versus the benchmark6
Strategic Report: Performance Highlights
-20
-18
-16
-14
-12
-10
-8
-6
-4
May17
Apr17
Mar17
Feb17
Jan17
Dec16
Nov16
Oct16
Sep16
Aug16
Jul16
Jun17
Jun16
Company Sector
%
0
100
200
300
400
500
600
377.7
569.5
2017 2016
%
Discount5
Net assets at year end £millionPence
80
2
TR European Growth Trust PLC Annual Report 2017

Strategic Report: Performance Highlights (continued)
1 Net Asset Value per share total return (including dividends reinvested). This is based on preliminary estimates made by the AIC, which is the industry recognised source for performance data, and does not reflect any subsequent change in the year end NAVs reflected in this report
2 Euromoney European Smaller Companies Index (ex UK) expressed in Sterling3 Share price total return using mid-market closing price4 Graph shows the Company’s share price discount to NAV5 Calculated using published daily NAVs including current year revenue compared with the average discount of the AIC European Smaller Companies sector over the year
to 30 June 20176 Graph shows the Company’s NAV per share total return and share price total return compared to the total return of the benchmark over the year to 30 June 20177 This represents ordinary and special dividends recommended or paid for the year. See page 5 for more details8 Based on the ordinary and special dividends and the share price at the year end9 The ongoing charge excludes the performance fee. The charge including the performance fee is 1.56% (2016: 1.20%)10 Excludes those stocks valued at nil by the DirectorsSources: Morningstar for the AIC, Janus Henderson, DatastreamA glossary of terms is included on pages 15 and 16
NAV per share at year end Share price at year end
Dividend for year
2017 1,145.48p
2016 755.73pDividend yield8
2017 1,071.00p
2016 620.00p
2017 14.5p7
2016 11.5p2017 1.35%
2016 1.85%Ongoing charge for year9 Gearing at year end
2017 0.75%
2016 0.79%2017 9.1%
2016 9.5%Number of investments10 Performance fee
2017 139
2016 1422017 £3.8m
2016 £1.4m
3
TR European Growth Trust PLC Annual Report 2017

The Company operates as an investment trust. It aims to deliver capital growth to its shareholders in line with the Investment Objective and Policy. This is achieved through the appointment of specialised third-party service providers whose performance is monitored and challenged by a Board of independent non-executive directors. The Board is directly accountable to the Company’s shareholders.
Investment ObjectiveThe Company seeks capital growth by investing in smaller and medium sized companies which are quoted, domiciled, listed or have operations in Europe (excluding the UK).
Investment PolicyThe following investment ranges apply:
Equities: 80% – 100% Fixed Income and Cash: 0% – 20%
Smaller and medium sized companies are defined as those whose market capitalisation is equal to or below the largest member of the Euromoney Smaller European Companies ex-UK Index at the time of investing.
Investments may include shares, securities and related financial instruments, including derivatives. Unquoted investments are permitted with prior Board approval.
The Company maintains a diversified portfolio. The Company will not invest more than 7% of its total assets, calculated as at the time of investment, in any one holding.
The Company can, but normally does not, invest up to 15% of its gross assets in investment companies (including listed investment trusts). The Company will not invest more than 10% of its gross assets in companies that themselves may invest more than 15% of their gross assets in UK listed investment companies.
DerivativesThe Company may use financial instruments known as derivatives for the purpose of efficient portfolio management while maintaining a level of risk consistent with the risk profile of the Company.
GearingNet gearing (defined as all borrowings less cash balances and investments in cash funds) is limited by the Board to a maximum of 30% of Net Asset Value (“NAV”) at the time of investment.
GeneralWith appropriate approval, the Company may, but currently does not, hedge against currency movements.
Management arrangementsThe Company is an Alternative Investment Fund and has appointed Henderson Investment Funds Limited (“HIFL”) to act as its Alternative Investment Fund Manager (“AIFM”). HIFL delegates investment management services to Henderson Global Investors Limited. Both entities are authorised and regulated by the Financial Conduct Authority (“FCA”) and are part of the Janus Henderson group of companies. References to “Janus Henderson” or the “Manager” refer to the services provided by both entities.
The Manager is engaged under the terms of an Investment Agreement effective from 22 July 2014. The agreement is terminable on six months’ notice.
The base management fee is 0.6% per annum and is calculated as 0.15% of net assets at each quarter end. The Manager may also be eligible to receive a performance related fee. Performance is measured against, and expressed relative to, the benchmark, the Euromoney European Smaller Companies Index (ex UK) expressed in Sterling. Performance of the Company and the benchmark is measured on a NAV total return (with gross income reinvested) basis and is measured over a rolling three year period. In any given year in which a performance fee is payable, the rate is 15% of the positive difference between the average annual NAV total return and the average annual total return of the benchmark. The upper limit on the total fee, including the base fee and any performance fee, for any given accounting year is 2.0% of the NAV of the Company as at the last day of the relevant calculation period. A performance hurdle over the benchmark of 1.0% has to be reached before any performance fee can be earned. Performance is measured solely on the basis of NAV total return relative to the total return of the benchmark index. No account is taken of whether the NAV grows or shrinks in absolute terms.
The Manager, and its subsidiaries, provide accounting, company secretarial and general administrative services. Some of the administrative and accounting services are carried out, on behalf of the Manager, by BNP Paribas Securities Services. Henderson Secretarial Services Limited acts as the Company Secretary.
Strategic Report: Business Model
4
TR European Growth Trust PLC Annual Report 2017

Strategic Report: Chairman’s Statement
PerformanceI am pleased to be able to report that over the year to 30 June 2017 our net asset value per share total return was 54.0% compared to a total return for our benchmark of 35.8%. The share price total return for the year was 75.5%.
Over the three year qualifying period for the performance fee, the Company has delivered a net asset value per share total return of 84.2% against a benchmark of 54.5%, and share price total return of 96.3%. As a consequence of the outperformance over the three year qualifying period we will be paying a performance fee to the Manager for the year of £3,800,000 (2016: £1,389,000). This is equal to 0.7% of net assets as at 30 June 2017 (2016: 0.4%).
Revenue and dividendsRevenue return per share was 17.09p (2016: 13.48p), a rise of 27%. We are proposing, subject to shareholder approval at our Annual General Meeting, a final dividend per ordinary share of 11.50p, an increase of 27.8% over last year’s final dividend of 9.00p. We are also proposing a special dividend of 3.00p (2016: 2.50p) per ordinary share, making a total dividend of 14.50p. This represents an overall increase of 26.1% in the dividends paid last year.
During the year, the Board reviewed its approach to paying dividends. For the financial year ending 30 June 2018, it is our intention to move towards paying an interim and a final dividend. This will enable the Company to distribute returns to shareholders on a more frequent basis.
Investment Objective and PolicyAs part of its consideration of strategy, the Board reviewed the Investment Objective and Policy. Overall, we concluded these continued to appropriately reflect the securities held by the Company and the manner and jurisdictions in which it invests. In keeping with recommendations from the Financial Conduct Authority, we have clarified the wording used to define these, however, none of the changes were material.
Annual General MeetingShareholders are encouraged to attend the Annual General Meeting (“AGM”) on Monday 27 November 2017 at 201 Bishopsgate, London, EC2M 3AE. The meeting will start at 12.30 pm, will include a presentation by the Fund Manager, Ollie Beckett, and will be followed by an opportunity for shareholders to meet the Board and management team. The Notice of Meeting and full details of the resolutions to be proposed are included in a separate document which will be posted to shareholders with the Annual Report. The Directors recommend that shareholders vote in favour of all of the proposed resolutions as they intend to do in respect of their own beneficial holdings.
The Company’s AGM will be broadcast live on the internet. If you are unable to attend in person you can watch the meeting as it happens by visiting www.janushenderson.com/trustslive.
ManagerHenderson Group plc merged with Janus Capital Group, Inc on 30 May 2017. I am pleased to confirm this will not lead to any change in personnel responsible for the day to day management of your Company.
OutlookDespite the ongoing backdrop of fraught politics on both sides of the Atlantic, it has been another good year for European equity markets, especially in the smaller company arena. In this context it has been welcome to see the performance of the Company in the past year reflected in a narrowing discount. At 30 June 2017 the Company’s discount stood at 6.5% having been at 18% at 30 June the prior year in the wake of the unexpected outcome to the UK referendum to leave the European Union. More recently, at 29 September 2017, the discount stood at 5.6%, with the share price having been at a premium to NAV in preceding weeks.
Clearly there are serious issues that markets will need to navigate around in the coming year and no doubt the noisy political environment will periodically concern markets. A period of relative political stability within continental Europe would be most welcome, as would clarity around the expected shape of the UK relationship with the EU once the Article 50 period ends in March 2019. Our Fund Managers will continue to focus on finding undervalued stocks of companies that can thrive regardless of the political backdrop. They will also monitor the economic environment, but we are confident that there is still a large pool of investment opportunities for them to exploit in European smaller companies to deliver good returns for our shareholders.
Audley Twiston-Davies Chairman 2 October 2017
The Chairman of the Board, Audley Twiston-Davies, reports on the year to 30 June 2017
5
TR European Growth Trust PLC Annual Report 2017
Strategic Report: Portfolio Information
Gearing levels over the year to 30 June 2017
Sector exposure at 30 June 2017As a percentage of the investment portfolio excluding cash
1 Unquoted investment
Geographic exposure at 30 June 2017As a percentage of the investment portfolio excluding cash
Ten largest investments at 30 June 2017
0
2
4
6
8
10
12
14
Jul JunMayAprMarFebJanDecNovOctSepAug
%
9.88.4
10.7
13.6 13.9
10.6 10.2 10.19.2
7.97.1
9.1
Ranking 2017
Ranking 2016 Company Principal activities Geographical area
Valuation 2017
£’000Percentage of portfolio
1 2 Van Lanschot
Specialist independent wealth management, private and merchant banking www.vanlanschot.nl
Netherlands 13,986 2.3%
2 1 Brainlab1 Radiotherapy and image – guided surgery equipment www.brainlab.com
Germany 12,791 2.1%
3 33 FinecoBank Italian financial service company specialising in online brokerage www.finecobank.com
Italy 11,141 1.8%
4 27 Lenzing Man-made fibre production www.lenzing.com Austria 8,808 1.4%
5 34 Anima Provider of asset management services to retail and institutional customers www.animaholding.it
Italy 7,843 1.3%
6 84 Kaufman Real estate development and construction www.kaufmanbroad.fr
France 7,706 1.2%
7 – Meyer Burger
Precision products based on semiconductor technologies, with a focus on photovoltaics www.meyerburger.ch
Switzerland 7,314 1.2%
8 – Wallenius Wilhelmsen Logistics
Global shipping and logistics solutions for manufacturers of cars, trucks, heavy equipment and specialised cargo. www.2wglobal.com
Norway 7,213 1.2%
9 4 Criteo Digital advertising solutions www.criteo.com France 7,197 1.2%
10 3 OC Oerlikon Leading Swiss technology conglomerate manufacturing vacuum pumps, machinery for man made fibres, drive systems for agricultural and construction machinery and drilling and mining applications www.oerlikon.com
Switzerland 7,150 1.1%
91,149 14.8%
2017%
20.3 17.2 16.4 13.5 13.4 10.2 8.5 0.5
2016%
20.6 17.0 15.1 14.4 12.8 12.5
7.1 0.5
Industrial GoodsTechnologyBusiness ProvidersFinancialBasic MaterialsConsumer GoodsRetail ProvidersNatural Resources
2016
2017
2017%
2016%
Austria 1.4 2.1Belgium 3.6 4.7Denmark 3.5 3.5Finland 9.3 5.6France 12.2 15.2Germany 21.2 22.9Greece 1.0 1.4Ireland 0.8 2.8Italy 12.3 8.7Netherlands 8.8 9.2Norway 5.1 3.2Portugal 1.6 –Spain 3.0 2.7Sweden 6.7 6.8Switzerland 9.5 10.9Other – 0.3
2016
2017
Source: Janus Henderson6
TR European Growth Trust PLC Annual Report 2017

Strategic Report: Fund Managers’ Report
The PortfolioPortfolio PositioningWe have persisted in searching for stock specific ideas with valuation anomalies that can either deliver substantial growth or benefit from self-help in order to drive profitability. For instance we have built a position in Swedish online mid-range and premium fashion retailer Boozt that delivered 71% topline growth in 2016 and Bloomberg consensus forecasts sales growth of 39% in 2017. This topline growth should deliver a substantial improvement in margins in the year to come. In contrast we built a position in troubled photovoltaic, semiconductor and optoelectronic industry machine supplier Meyer Burger, following a rescue rights issue. New management have a clearly articulated plan to rebuild profitability assuming no help from a sales recovery, which, given the revived market interest in solar power and battery storage, provides opportunity.
Performance AttributionThe performance of the Company over the course of the year has come from a wide range of strong performing stocks offset by a relatively limited number of poorly performing ones. The largest contributor to return was outsourced research and development and drug discovery company Evotec. The Company, which returned 290% in the year after the stock market spotted the valuation disparity with the US listed peers, became excited about the internal drug discovery pipeline and understood the value accretion of recent mergers and acquisitions. Another strong contributor was our largest position Van Lanschot, a Dutch wealth manager that is tackling an inflated cost base, freeing up capital to return to shareholders and improving return on equity. Despite delivering a share price return of 50% last year the stock remains cheap and we are hopeful of further strong returns from our holding. There was also good contribution from: Lisi, a French manufacturer of fasteners for the automotive, aerospace and medical sector as recent years restructuring bore fruit; AMG, a Dutch listed producer of specialty metals including Lithium which is a key component for the batteries in electric vehicles; Lenzing, an Austrian listed global manufacturer of woven and non-woven viscose and specialty fibres that benefited from new managements actions to improve profitability and inflationary pricing in viscose.
IntroductionThe year to June 2017 has been another year of buoyant stock markets despite surprising political outcomes in the US and the UK. Despite much worry being devoted to elections such as those in Austria, the Netherlands and France, continental European politics has provided less drama than we have become accustomed to, a vacuum comprehensively filled by the United States and President Trump. Currency markets have been volatile with €1 being worth $1.11 at the start of the year before falling to $1.04 in December, giving a welcome boost to the European economy, before rallying to $1.14 by the end of the financial year (company downgrades/upgrades being largely driven by the US$). This appears to reflect market confidence in the Eurozone economy and an unwinding of the optimism that initially surrounded President Trump’s policy agenda of tax cuts and infrastructure spending which has proved difficult to progress through the US Legislature. Certainly the optimism injected by President Macron into both France and the wider EU is helpful, as are his initial policy suggestions. There is scope for some of the unresolved issues in the construction of the Euro to be resolved following German elections in September which would further boost the optimism around the Eurozone. However, French presidents have been in this position before and struggled to deliver change and consensus on how to progress is far from certain. Furthermore, slightly softening economic data in the US and in China, a more hawkish Federal Reserve and volatile world political leadership give cause for mild caution. As we have observed many times in the past, ultimately European smaller companies growth is a function of global growth. Overall we continue to believe that we are in the middle stages of a long protracted economic recovery, within which Europe has a significant distance to catch up with the rest of the world.
The financial year to June 2017 was kind to the Company with the Net Asset Value total return of 54.0% outperforming the benchmark by 18.2%. The fall in the value of the Pound versus the Euro over the period of 5% somewhat flatters the absolute return in the fund and it is important to understand that we do not hedge the currency exposure of the portfolio.
We continue to believe that European smaller companies provide earnings growth and value that is hard to capture in many other asset classes. Despite significant moves in markets we are still finding plenty of undervalued and neglected stocks in which to invest your capital.
The Fund Manager of the portfolio, Ollie Beckett, reports on the year to 30 June 2017
Rory Stokes assists Ollie Beckett with the management of the portfolio
7
TR European Growth Trust PLC Annual Report 2017

Strategic Report: Fund Managers’ Report (continued)
The Company also benefited in the year from bids for 3D printing machine manufacturer SLM Solutions by General Electric (that subsequently fell away due to the actions of an activist hedge fund, but which highlighted the underlying and strategic value of the business); and Irish listed tropical fruit importer Fyffes by Sumitomo Corp.
Performance was weighed down by our investment in Petroleum Geo-Services, a Norwegian oilfield service company that provides images from beneath the ocean floor that oil companies rely on to find oil and gas reserves. A weaker oil price and more prolonged capex holidays by the oil majors has meant the investment has not delivered for the Company. This was also a factor that weighed on Dutch listed Fugro, which collects, processes and interprets geological data for the oil and other industries. Technicolor, a French producer of digital set top boxes for the cable industry, DVDs and digital film production services was also a detractor after a shortage of Dynamic Random Access Memory (DRAM) a key component in set top boxes which drove prices up dramatically causing profitability to suffer.
Geographical and Sector DistributionOur investment process is fundamentally one of bottom up stock picking, rather than allocating capital to specific sectors or geographies, though we keep a keen eye on the overall portfolio structure in order to avoid risk concentrations. We do not use the benchmark as a guide to portfolio structure and are content to run the Company with substantial divergence from the benchmark.
The portfolio has reduced its German exposure, but continues to be overweight in Germany as there continues to be a large number of superb companies that can be bought at attractive valuations. We have invested in a number of fast growing companies such as Va-Q-Tec that is the technology leader in advanced thermal insulation products, which is showing substantial growth in medical cold-chain packaging for the drugs market. We are also overweight in Finland where we have found a number of cheap stocks that are benefiting from the growing economic recovery. For instance we invested in Alma Media, an online classifieds business under-rated as a regional newspaper company by the stockmarket; electronic invoicing market leader Basware and leading retailer and eye surgery company Silmaasema. The Netherlands is a further substantial geographic overweight where we topped up on existing positions already mentioned such as Van Lanschot and Fugro, and took positions in companies such as Kendrion, a leading manufacturer of electromagnetic and mechatronic components into the automotive and other sectors.
The portfolio is underweight in Sweden and Spain, which despite attractive macroeconomic fundamentals are sparse when it comes to appealingly valued stocks.
The sector exposure of the portfolio is heavily overweight in Consumer Discretionary, a weighting that has increased over the year with the addition of stocks such as Alma Media, Boozt and Silmaasema, but also through the topping up of positions such as French housebuilder Kaufman & Broad, Italian compact and mobile refrigeration company Indel B and Italian electrical equipment retailer Unieuro. The portfolio also remains heavily overweight in Industrials with the addition of stocks such as Swedish “rack-and-pinion” lift producer Alimak and German producer of carbon and graphite materials for the automotive industry, SGL Carbon.
The portfolio is heavily underweight in Real Estate where we struggle to find compelling value and in Consumer Staples where elevated valuation multiples are matched with pedestrian earnings growth.
Other PurchasesSubstantial purchases in the year include investing in Norwegian shipping and logistics services provider Wallenius Wilhelmsen which is cutting capacity in the industry and will hopefully also benefit from the recovery in the shipping of mining equipment. We also invested in Belgian producer of proton-beam cancer therapy machines Ion Beam Applications and in Portuguese cable and telecoms provider NOS.
Other DisposalsWe fully exited our position in Irish insulation and building envelope provider Kingspan, Swedish bus operator Nobina and Dutch wind turbine foundation provider Sif, French IT service provider Sopra Steria and French housebuilder Nexity which after pleasing stock performances looked too expensive.
BrexitThe Company does not normally invest directly in UK listed businesses, however a number of stocks within the portfolio do have substantial sales in the UK. Political fragility within the UK and the backdrop of Brexit negotiations will possibly drive some volatility within share prices and underlying economic fundamentals for these stocks. We continue to monitor the situation actively.
GearingGearing levels varied between 7.1% and 13.9% over the year and was at 9.1% at the financial year end. It should be noted that 2.1% of the portfolio is in unquoted investments. We used the debt facility to maintain flexibility and freedom of action over the year as opportunities arose, rather than raising cash by selling assets quickly at bad prices. The gearing also offers the potential to enhance returns.
Market Capitalisation RangeWe have continued to focus the portfolio towards small and medium sized companies, with a weighted average market capitalisation of £1.114bn as of 30 June 2017. The largest company in the portfolio was Puma at £4.447bn and the smallest was Softing at £77m.
Unquoted InvestmentsThe Company has substantially reduced the exposure to unquoted investments over the course of the year from 4.1% of the portfolio to 2.1% with the final disposal and capital return of Doughty Hanson & Co. Fund III as well as substantial return of capital from French private equity fund 21 Centrale Partners III. The exposure is now largely concentrated on the holding in Brainlab, a global leader in software for high precision radiotherapy and image-guided surgery. This is a good asset for which we continue to seek an exit for an appropriate value.
8
TR European Growth Trust PLC Annual Report 2017

Strategic Report: Fund Managers’ Report (continued)
OutlookThe world provides no shortage of things to worry about: the threat of war in the Korean peninsula; Brexit; European migration, banking and integration crises; the sustainability of the Chinese economic model; and an absence of global political leadership to name just a few. Whilst these keep headline writers busy, so far they have failed to hinder global stock markets or global economic growth.
As Europe has shaken off its reputation for being a crisis creation engine and the mantle has been taken on by the US and UK there has been a revival in interest in European equity. This has even begun to extend as far as European midcap equities. Multiples in the low volatility sectors that are rightly or (we believe) wrongly perceived as “quality companies” in the Consumer Staples and Health Care sectors have not attracted us. We have continued to search out and find undervalued companies across Europe. The stockmarket remains very focused on earnings momentum and whilst we are not blind to this factor, we continue to make value a key consideration in every decision.
Notwithstanding this the portfolio has a good measure of companies exhibiting strong structural growth. We continue to be enthusiastic about online advertising optimisation company Criteo, despite the growth having not translated into the valuation multiple yet. Finnish online retailer Verkkokauppa continues to deliver the kind of sales growth to warrant a premium valuation. Likewise Swedish listed global market leader in metal-based mesh panels Troax has the growth and dominant market position to warrant our continued ownership despite a price appreciation of 100% over the financial year. Since the year end we have added Swiss listed leading European online pharmacy Zur Rose to the portfolio that we anticipate will be a key beneficiary of the previously closed German pharmacy market being opened by an European Court of Justice ruling.
We are neither complacent about nor desperately focused on the global risks. These are a feature of the market we operate in. Whatever the eventual outcomes of the German elections, Brexit or even the seemingly imminent end to the period of extremely loose global monetary policy, there will continue to be management teams taking the right decisions to either fix or grow their businesses and we will continue to search these opportunities out in order to try and grow the value of the Company’s capital.
The debate around the benefits and costs of quantitative easing is often heated and not a topic to be resolved here. However, global central banks have long been signalling an intention to normalise monetary policy which has the potential to induce bouts of volatility in global markets and if executed poorly, especially in Europe, poses risk to asset values. We suspect any unwinding of the extraordinary monetary policy of recent years will be slow and after the ECB policy mistakes of 2011, with the Trichet interest rate rises, will be handled carefully. This process may begin to raise questions about the prices of bond proxy equities with rich valuations. We are alive to this risk. We have been careful about not overpaying for yield, though will happily accept strong income from companies with strong capital return disciplines such as French liquefied natural gas container technology company Gaztransport et Technigaz, there has to be more to the equity story than dividends.
Whilst European performance measurement indicators have picked up strongly in the last twelve months, US and Chinese economic data is more mixed, though overall we judge the global economic environment to be pretty benign. We keep one eye on the global macroeconomic environment and stay alert to any signs of euphoria in our markets. The deep pessimism surrounding European equities has clearly seen quite a reversal in the last year, but despite strong performance in our markets, valuations look anything but stretched, especially given the comparatively poor economic performance of Europe compared to the US and UK in recent years. There is clearly a substantial economic gap to close and this should show itself in the form of decent earnings growth in the coming years. We are confident that we will be able to search out the attractive investment opportunities in this environment and deliver solid returns for our investors in the coming year.
Ollie Beckett and Rory Stokes 2 October 2017
9
TR European Growth Trust PLC Annual Report 2017

Strategic Report: Historical Performance and Financial Information
Total return performance to 30 June 2017 (including dividends reinvested and excluding transaction costs)
Share price movement against indices since launch to 30 June 2017 (rebased to ordinary subscription price at launch)
1 Calculated from the end of September 1990 (the Company commenced business on 6 September 1990)2 Net asset value per ordinary share with income reinvested for 1, 3 and 5 years and capital NAV plus income reinvested for 10 years3 Euromoney European Smaller Companies Index (ex UK) total return and expressed in sterling4 The sector is the AIC European Smaller Companies sector5 Share price total return using middle market closing price6 Average share price for the AIC European Smaller Companies sector7 Share price total return8 Using total expense ratio methodology for 2011 and previous years; ongoing charge methodology thereafter. Data is not available for periods prior to 2010Sources: Janus Henderson, Morningstar for the AIC, Datastream
1 year %
3 years %
5 years %
10 years %
Since launch1
%
NAV2 54.0 84.2 232.4 129.2 3,094.4Benchmark index3 35.8 54.5 159.6 109.2 2,170.2Average sector4 NAV 36.7 67.5 177.0 124.2 3,102.6Share price5 75.5 96.3 311.6 144.4 3,123.2Average sector share price6 40.1 85.4 212.5 147.8 2,521.2
At 30 June
Net assets £’000
NAV p
Mid-market price per ordinary
share p
Discount %
Profit/(loss) for year
£’000
Revenue return
p
Capital return
p
Total return
p
Final dividend
p
Special dividend
p
Expenses8
%
2008 331,900 458.6 420.00 8.4 (84,515) 5.39 (115.02) (109.63) 3.00 2.00 –2009 215,400 334.1 303.00 9.3 (91,145) 5.79 (138.04) (132.25) 3.20 2.30 –2010 199,500 386.4 346.50 10.3 36,455 4.31 57.95 62.26 3.40 0.85 0.732011 264,400 522.2 427.13 18.2 70,917 3.79 135.36 139.15 3.60 0.65 0.752012 185,006 370.2 283.00 23.5 (75,149) 6.89 (155.73) (148.84) 4.50 1.50 0.722013 246,124 492.5 409.25 16.9 64,115 9.29 119.00 128.29 6.00 2.00 0.742014 325,676 651.7 573.75 12.0 83,548 11.15 156.02 167.17 6.50 2.70 0.692015 337,645 675.6 624.00 7.6 16,565 11.34 21.80 33.14 7.00 2.50 0.782016 377,683 755.7 620.00 18.0 44,782 13.48 76.12 89.60 9.00 2.50 0.792017 569,459 1,145.5 1,071.00 6.5 199,540 17.09 383.67 400.76 11.50 3.00 0.75
Financial information
0
200
400
600
800
1000
1200
060402009896949290 08 100503019997959391 07 09 14 15131211 17 16
BenchmarkTR European Growth7 S&P/Citigroup EMI Europe (ex UK) (£)FTSE World Europe (ex UK) (£)
Pence
10
TR European Growth Trust PLC Annual Report 2017

Strategic Report: Corporate Information
DirectorsThe Directors in office during the year and up to the date of this report are:
Audley Twiston-DaviesPosition: Chairman of the Board of Directors (the “Board”) and of the Nomination and Management Engagement committees
Date of appointment: 31 January 2000 (Chairman from May 2002)
Audley is currently chairman of BlackRock Frontiers Investment Trust plc. He was formerly Chairman of Taylor Young Investment Management Limited and previously Chief Executive Officer of Foreign & Colonial Emerging Markets Limited. He is Chairman of the Company’s subsidiary.
Christopher CaseyPosition: Chairman of the Audit CommitteeDate of appointment: 1 March 2010
Christopher was a partner of KPMG LLP and its predecessor firms from 1992, having joined Peat Marwick & Mitchell in 1977. He was an audit partner responsible for large and listed companies but latterly specialised in mergers and acquisitions advisory assistance. He retired from KPMG LLP in February 2010. He is a non-executive director of Eddie Stobart Logistics plc, BlackRock North American and Income Investment Trust plc and City Natural Resources High Yield Trust plc. He is a director of the Company’s subsidiary.
Simona HeidempergherPosition: DirectorDate of appointment: 1 September 2014
Simona is an executive director of Merifin Capital, a private investment company with its main office in Brussels. She is a member of the Board of Directors for Fondazione Bruno Kessler, Europa Investimenti SpA and Bim Banca Intermobiliare di Investimenti e Gestione S.p.A.
Andrew Martin SmithPosition: DirectorDate of appointment: 19 May 2008
Andrew currently works as an adviser and AIM EIS fund manager with Guinness Asset Management Limited. He holds a number of directorships including Church House Investments Limited.
Alexander MettenheimerPosition: DirectorDate of appointment: 1 July 2011
Alexander was spokesman of the executive directors of BHF Bank AG until March 2016 and Deputy Chairman of the Board of Administration for Bayerische Landesbank, the leading Bavarian commercial bank for large and middle-market corporate customers in Germany and Europe from 2010 to 2013. His previous appointments include Chief Executive Officer of Merck Finck & Co Privatbankiers and Confia SA as well as various positions with Citibank. He is Chairman of the Small and MidCap InvestmentBank AG and holds various other board positions in Germany.
All Directors are independent of the Manager and are members of the Nomination, Management Engagement and Audit committees.
11
TR European Growth Trust PLC Annual Report 2017

Strategic Report: Corporate Information (continued)
Registered office201 Bishopsgate London EC2M 3AE
Service providersAlternative Investment Fund ManagerHenderson Investment Funds Limited 201 Bishopsgate London EC2M 3AE
Depositary and CustodianHSBC Bank plc 8 Canada Square London E14 5HQ
StockbrokersWinterflood Investment Trusts The Atrium Building Cannon Bridge 25 Dowgate Hill London EC4R 2GA
Corporate SecretaryHenderson Secretarial Services Limited 201 Bishopsgate London EC2M 3AE Telephone: 020 7818 1818
RegistrarEquiniti Limited Aspect House Spencer Road Lancing West Sussex BN99 6DA
Telephone: 0371 384 2472 (or +44 121 415 7047 if calling from overseas). Lines are open 8.30 am to 5.30 pm, Monday to Friday.
There is a range of shareholder information online.
You can check your holding and find practical help on transferring shares or updating your details at www.shareview.co.uk.
Independent auditorsPricewaterhouseCoopers LLP Chartered Accountants and Statutory Auditors 7 More London Riverside London SE1 2RT
Financial calendarAnnual results announced October 2017 Ex dividend date 2 November 2017 Dividend record date 3 November 2017 Annual General Meeting 27 November 2017 Dividend payment date 30 November 2017 Half year results announced February 2018
Information sourcesFor more information about the Company, visit the website at www.treuropeangrowthtrust.com
HGiHGi is a content platform provided by Janus Henderson that offers online personalisation where you can “follow” investment experts, topics and the trusts that are of interest to you. By creating your HGi profile you will be updated regularly on the topics that interest you most, bringing you closer to Janus Henderson’s investment expertise.
Scan the QR code or use this short URL to register for HGi: http://HGi.co/rb
Follow Janus Henderson Investment Trusts on Twitter, YouTube and FacebookTo get the latest updates follow us on Twitter @JHiTrustsUK
InvestingShares can be purchased in the market via a stockbroker or through share dealing platforms. They can also be held through share plans, ISAs or pensions and links to various providers are included on the website. Individuals holding shares through Halifax Share Dealing Limited can write to them at Lovell Park Road, Leeds LS1 1NS or contact them via telephone 03457 22 55 25, email [email protected] or visit their website www.halifax.co.uk/sharedealing.
Potential investors are reminded that the value of investments and the income from them may go down as well as up and investors may not receive back the full amount invested. Tax benefits may vary as a result of statutory changes and their value will depend on individual circumstances.
Nominee share codeWhere notification has been provided in advance, the Company will arrange for copies of shareholder communications to be provided to the operators of nominee accounts. Nominee investors may attend general meetings and speak at them when invited to do so by the Chairman. Investors via Halifax Share Dealing receive all shareholder communications and a voting instruction form is provided to facilitate voting at general meetings of the Company.
1 At the Company’s registered office at 12.30 pm.
1
12
TR European Growth Trust PLC Annual Report 2017

Strategic Report: Corporate Information (continued)
StatusThe Company is registered as a public limited company and is an investment trust as defined under section 833 of the Companies Act 2006 (the “Act”). It has been approved as an investment company under sections 1158/1159 of the Corporation Tax Act 2010, as amended, and is a member of the Association of Investment Companies (“AIC”).
The Directors are of the opinion that the Company continues to conduct its affairs as an Approved Investment Trust under the Investment Trust (Approved Company)(Tax) Regulations 2011.
The Company maintains a primary listing on the London Stock Exchange and is subject to the Listing, Prospectus and Disclosure Guidance and Transparency Rules published by the FCA. The Company is governed by its Articles of Association, amendments to which must be approved by shareholders by way of a special resolution.
The Company has a wholly owned subsidiary, TREG Finance Limited, which was dormant throughout the year. The Company and subsidiary are referred to as the “Group”.
Principal risksThe Board, with the assistance of the Manager, has carried out a robust assessment of the principal risks, and uncertainties, facing the Company that would threaten its business model, future performance, solvency and liquidity. A matrix of these risks has been drawn up and steps taken to mitigate these. The principal risks and mitigating actions are as follows:
Investment activity and performance risksAn inappropriate investment strategy (for example, in terms of asset allocation or the level of gearing) may result in under performance against the Company’s benchmark index and the companies in its peer group.
The Board monitors investment performance at each Board meeting and regularly reviews the extent of its borrowings.
Portfolio and market price risksAlthough the Company invests almost entirely in securities that are listed on recognised markets, share prices may move rapidly. The companies in which investments are made may operate unsuccessfully, or fail entirely. Investments in European stock markets may be impacted by political events. A fall in the market value of the Company’s portfolio would have an adverse effect on shareholders’ funds.
The Fund Managers seek to maintain a diversified portfolio to mitigate against this risk. The Board regularly reviews the portfolio, activities and performance.
Tax and regulatory risksA breach of Section 1158/1159 could lead to a loss of investment trust status, resulting in capital gains realised within the portfolio being subject to corporation tax.
A breach of the Listing Rules could result in suspension of the Company’s shares, while a breach of the Act could lead to criminal proceedings, or financial or reputational damage.
The Manager provides investment, company secretarial, administration and accounting services through qualified professionals. The Board receives internal control reports produced by the Manager on a quarterly basis, which confirm regulatory compliance.
Operational risksDisruption to, or failure of, the Manager’s accounting, dealing or payment systems or the custodian’s records could prevent the accurate reporting and monitoring of the Company’s financial position. The Company is exposed to the operational risk that one or more of its service providers may not provide the required level of service.
The Board monitors the services provided by its third-party service providers and receives reports on the key elements in place to provide effective internal control.
Viability statementThe Board considers the Company’s viability over a three year period. The Directors believe this is a reasonable period reflecting the longer-term investment horizon of the Company, as well as that of its investors, and the inherent shorter term uncertainties in equity markets.
The Board considers the Company’s viability as part of their continuing programme of monitoring risk. In carrying out their assessment, the Board takes account of the likely impact of the principal risks facing the Company materialising in severe, but plausible, scenarios. In particular, the Board considers the investment strategy, market risk, level of gearing, specifically the duration of the Company’s borrowing facilities and how a breach of any covenants could impact on the Company’s net asset value and share price, and the liquidity of the portfolio. The evaluation of the mitigating controls currently in place, and their effectiveness, forms part of the assessment.
The Board concluded that the Company’s assets are liquid, its commitments are limited and the Company intends to continue operating as an investment trust. No significant changes to the current principal risks and the mitigating controls in place are anticipated. The Board does not currently envisage any material change in the Investment Objective or Policy, and are not aware of any events that would prevent the Company from continuing to operate in its current capacity.
Based on this assessment, the Board has a reasonable expectation that the Company will be able to continue in operation and meet its liabilities as they fall due over the next three year period.
In conjunction with this exercise, the Board considered the appropriateness of using the going concern approach to the preparation of the financial statements.
13
TR European Growth Trust PLC Annual Report 2017

Strategic Report: Corporate Information (continued)
Key performance indicatorsIn order to measure the success of the Company in meeting its Investment Objective and to evaluate the performance of the Manager, the Board take into account the following key performance indicators (“KPIs”):
Performance measured against the benchmarkThe Board reviews and compares, at each meeting, the performance of both the NAV per share and share price for the Company and its benchmark. The Board considers the benchmark to be its most important key performance indicator and has determined that it should also be used to calculate whether a performance fee is payable to the Manager.
Discount to NAVAt each Board meeting, the Board monitors the level of the Company’s discount to NAV per share (including income) and reviews the average discount/premium for the AIC European Smaller Companies sector. The Company publishes a NAV per share figure on a daily basis through the official newswire of the London Stock Exchange.
Performance against the Company’s peer groupThe Company is included in the AIC European Smaller Companies sector. In addition to comparison against the stated benchmark, the Board also considers at each meeting the performance of this AIC sector, as well as other European investment trusts and other European funds managed by the Manager.
The charts and tables on pages 2, 3 and 10 show how the Company has performed against these KPIs.
BorrowingsThe Company has a secured multicurrency overdraft arrangement with HSBC Bank plc that allows it to borrow up to the lesser of £80 million and 25% of custody assets as and when required. As at 30 June 2017 the facility was drawn up to £49 million.
Future developmentsThe future performance of the Company is dependent on international financial markets which are subject to various external factors, including political and economic conditions. It is the Board’s intention that the Company will continue to pursue its stated Investment Objective and Policy. The Chairman’s Statement and Fund Manager’s Report provide commentary on the outlook for the Company.
Responsible investment, voting and the UK Stewardship CodeThe Board delegates the Company’s investment management activities, including corporate governance and corporate responsibility in respect of investee companies, to Janus Henderson. The Board retains oversight as to how duties in this area are discharged by reviewing the Responsible Investment Policy (the “RI Policy”) and receiving regular reporting on how the RI Policy has been applied in respect of the shares in its portfolio.
The Manager’s RI Policy sets out its approach to corporate governance and corporate responsibility for all the companies in which it invests on behalf of its clients. This includes environmental, social and ethical issues, its approach to proxy voting and the application of the UK Stewardship Code.
The Board believes that voting at general meetings is an important aspect of corporate stewardship and a means of signalling shareholder views on Board policy, practices and performance. Voting recommendations are guided by the best interests of the investee companies’ shareholders and, depending on the nature of the resolution, the Fund Managers may give specific instructions on voting non-routine and unusual or controversial resolutions.
The RI Policy can be found on the Manager’s website at www.janushenderson.com.
Employees, social, community, human rights and environmental mattersAs an investment trust company, the Company’s own direct environmental impact is minimal. The Company has no greenhouse gas emissions to report from its operations, nor does it have responsibility for any other emissions producing sources under the Companies Act 2006 (Strategic Report and Directors’ Reports) Regulations 2013.
The Company has no employees. The Directors are satisfied that, to the best of their knowledge, the Company’s principle suppliers, listed on page 12, comply with the provisions of the UK Modern Slavery Act 2015 and maintain adequate safeguards in keeping with the provisions of the Bribery Act 2010.
DiversityThe Company’s affairs are overseen by a Board comprising five non-executive Directors. The Directors are diverse in their experience bringing knowledge of the global and European investment markets, banking and accounting and auditing expertise to discussions regarding the Company’s business.
The Directors regularly consider the leadership needs and specific skills required to achieve the Company’s Investment Objective, and are cognisant of diversity when making appointments to the Board.
The Company has no employees and therefore has no further disclosures to make in respect of gender representation within the Company.
For and on behalf of the Board
Christopher Casey Director 2 October 2017
14
TR European Growth Trust PLC Annual Report 2017

Strategic Report: Glossary
Alternative Investment Fund Managers Directive (“AIFMD”)Agreed by the European Parliament and the Council of the European Union and transposed into English law, the AIFMD classifies certain investment vehicles, including investment companies, as Alternative Investment Funds (“AIFs”) and requires them to appoint an Alternative Investment Fund Manager (“AIFM”) and depositary to manage and oversee the operations of the investment vehicle. The Board of the Company retains responsibility for strategy, operations and compliance and the Directors retain a fiduciary duty to shareholders.
Association of Investment Companies (“AIC”)The Company is a member of the AIC which is the trade body for investment companies and represents the industry in relation to various matters which impact the regulation of such entities.
BenchmarkAn index against which performance is compared. For the Company this is the Euromoney European Smaller Companies Index (ex UK) (in Sterling terms on a total return basis).
CustodianThe Custodian is responsible for ensuring the safe custody of the Company’s assets and that all transactions in the underlying holdings are transacted in an accurate and timely manner.
DepositaryWith effect from 22 July 2014 all AIFs were required to appoint a Depositary which has responsibility for overseeing the operations of the Company including safekeeping, cash monitoring and verification of ownership and valuation of the underlying holdings and is responsible for the appointment of a Custodian. The Depositary is strictly liable for the loss of any investments or other assets in its custody unless it has notified that it is has discharged its liability in certain markets. The Depositary has confirmed that it has not discharged liability in relation to any of the Company’s assets.
DerivativeA contract between two or more parties in relation to an underlying security. The value of a derivative will fluctuate in accordance with the value of the security and is a form of gearing as the fluctuations in value are usually greater than the fluctuations in the underlying security’s value. Examples of derivatives are put and call options, swap contracts, futures and contracts for difference. Foreign exchange, interest rates and commodities may also be traded using derivative contracts.
Dividend datesWhen declared or recommended, each dividend will have three key dates applied to it. The payment date is the date on which shareholders will receive their dividend, either by BACS transfer or by receipt of a dividend cheque. The record date applied to the dividend is used as a cut-off for the Company’s registrars to know which shareholders should be paid a dividend. Only shareholders on the register of members at the close of business on the record date will receive the dividend. The ex-dividend date is the business day before the record date and is the date upon which the Company’s Net Asset Value will be disclosed ex-dividend.
GearingGearing means borrowing money to buy assets with the expectation that the return on investments bought will exceed the interest cost of the borrowings. The gearing percentage reflects the amount of borrowings (e.g. bank loans or overdrafts) the Company has used to invest in the market and is calculated by taking the difference between total investments and equity shareholders’ funds, dividing this by equity shareholders’ funds and multiplying by 100. The Company can also use synthetic gearing through derivatives and foreign exchange hedging.
Investment trustsInvestment trusts are public limited companies, listed on the London Stock Exchange, which provide shareholders with a professionally managed portfolio of investments. Investment trusts are exempt from tax on the capital gains arising on their investments subject to meeting certain criteria. Income, net of expenses and tax, is substantially distributed to shareholders. Investment trusts are also known as investment companies, although the tax legislation retains the reference to investment trusts.
LiquidityIn the context of the liquidity of shares in the stock market, this refers to the availability of buyers in the market for the share in question. Where the market in a particular share is described as liquid, that share will be in demand and holders wishing to sell their shares should find ready buyers. Conversely, where the market in a share is illiquid the difficulty of finding a buyer will tend to depress the price that might be negotiated for a sale.
Market capitalisation (market cap)The market value of a company, calculated by multiplying the mid-market price per share by the number of shares in issue.
15
TR European Growth Trust PLC Annual Report 2017

Net Asset Value (“NAV”) per ordinary shareThe value of the Company’s assets (i.e. investments and cash held) less any liabilities (i.e. bank borrowings and debt securities) for which the Company is responsible, divided by the number of shares in issue. The aggregate NAV is also referred to as shareholders’ funds on the balance sheet. The NAV is published daily.
Ongoing chargeThe ongoing charge reflects those expenses of a type which are likely to recur in the foreseeable future, whether charged to capital or revenue, and which relate to the operation of the Company as a collective fund, excluding the costs of acquisition or disposal of investments, financing costs and gains or losses arising on investments. The ongoing charge is based on actual costs incurred in the year as being the best estimate of future costs, excluding any performance fees in accordance with the AIC methodology. It is the annualised ongoing charge expressed as a percentage of the average aggregate NAV for the period.
Premium/discountThe amount by which the market price per share of an investment company is either higher (premium) or lower (discount) than the NAV per share, expressed as a percentage of the NAV per share.
Revenue return per shareThe revenue return per share is the revenue profit for the year divided by the weighted average number of ordinary shares in issue during the year.
Total return performanceThis is the return on the share price or NAV taking into account both the rise and fall of share prices and the dividends and interest paid to shareholders. Any dividends received by a shareholder are assumed to have been reinvested in either additional shares (for share price total return) or the Company’s assets (for NAV total return).
YieldThe annual dividend expressed as a percentage of the share price.
Strategic Report: Glossary (continued)
TR European Growth Trust PLC Annual Report 2017
16
TR European Growth Trust PLC Annual Report 2017
Corporate Report

Directors’ Report
The Directors present their report and the audited financial statements of the Group for the year ended 30 June 2017.
The Corporate Governance Statement, Audit Committee Report and the Investment Portfolio on pages 22-28 and 60-62 form part of the Directors’ Report.
Share capitalAs at 30 June 2017 the Company’s paid up share capital consisted of 49,713,397 ordinary shares of 12.5p each. Holders of the Company’s ordinary shares are entitled to one vote for every two shares. As at 30 June 2017, the Company’s voting rights were 24,856,698.
The Company annually requests shareholders to authorise the Directors to allot shares. At the AGM held on 21 November 2016, shareholders authorised the Directors to allot up to 2,498,794 new ordinary shares. No shares have been issued during the reporting period or in the year to date. The authority is due to expire at the earlier of 15 months from the date of the passing of the resolution or the next AGM.
Annual shareholder authority is also sought for Directors to repurchase the Company’s own shares at a discount to the NAV per share. At the AGM held on 21 November 2016, shareholders gave Directors the authority to buy back 7,452,038 ordinary shares. A total of 262,500 shares have been repurchased in the reporting period, leaving Directors with authority to repurchase up to 7,189,538 shares. The authority is due to expire at the earlier of 15 months from the date of the passing of the resolution or the next AGM.
There are no restrictions concerning the transfer of securities in the Company, no special rights with regard to control attached to securities, no restrictions on voting, no agreements between holders of securities regarding their transfer known to the Company and no agreement which the Company is party to that affects its control following a takeover bid. To the extent that they exist, the revenue profits of the Company (including accumulated revenue reserves) are available for distribution by way of dividends to the holders of the ordinary shares. Upon a winding-up, after meeting the liabilities of the Company, the surplus assets would be distributed to the shareholders pro rata to their holding of ordinary shares.
Holdings in the Company’s sharesDeclarations of interests in the voting rights of the Company as at 30 June 2017 in accordance with the Disclosure Guidance and Transparency Rules were as follows:
% of voting rights
Lazard Asset Management LLC 7.0Investec Wealth & Management Limited 6.3Rathbone Brothers plc 5.1Wells Capital Management, Inc. 5.01607 Capital Partners 4.7
On 12 July 2017, Lazard Asset Management LLC notified an increase to their holding resulting in a position of 7.1%. No other notifications have been received in the period since the year end to 29 September 2017.
Related party transactionsThe Company’s transactions with related parties in the year were with the Directors, the subsidiary and the Manager, Janus Henderson. There have been no material transactions between the Company and its Directors during the year. The only amounts paid to them were in respect of expenses and remuneration for which there were no outstanding amounts payable at the year end.
The Company has paid expenses on behalf of the subsidiary as disclosed on page 58.
In relation to the provision of services by the Manager, other than fees payable by the Company in the ordinary course of business, there have been no material transactions affecting the financial position of the Company during the year under review. More details on transactions with the Manager, including amounts outstanding at the year end, are given in Note 22 on page 58.
Annual General MeetingThe AGM will be held on Monday 27 November 2017 at 12.30 pm at the Company’s registered office. The Notice of Meeting and the details of the resolutions to be put to shareholders are contained in the separate document enclosed with this report.
Duration of the CompanyThe Company’s Articles of Association require that at every third AGM an ordinary resolution be put to shareholders requesting them to approve the continuation of the Company. A resolution to this effect was last approved by shareholders, with a notable majority, at the AGM held on 21 November 2016. The next such resolution will be proposed at the AGM in 2019.
Directors’ statement as to disclosure of information to auditorsEach of the Directors who were members of the Board at the date of approval of this report confirms that to the best of his or her knowledge and belief, there is no information relevant to the preparation of the Annual Report which the Company’s auditors are unaware and he or she has taken all the steps a director might reasonably be expected to have taken to be aware of relevant audit information and to establish that the Company’s auditors are aware of that information.
Requirement of the Listing RulesListing Rule 9.8.4 requires the Company to include certain information in a single identifiable section of the Annual Report or a cross reference table indicating where the information is set out. The Directors confirm that there are no disclosures to be made in this regard.
By order of the Board
Henderson Secretarial Services Limited 2 October 2017
18
TR European Growth Trust PLC Annual Report 2017

Statement of Directors’ Responsibilities
The Directors are responsible for preparing the Annual Report and the financial statements in accordance with applicable law and regulations. Company law requires the Directors to prepare financial statements for each financial year. Under that law the Directors have prepared the Group and Parent Company financial statements in accordance with International Financial Reporting Standards (“IFRSs”) as adopted by the European Union.
Under company law the Directors must not approve the financial statements unless they are satisfied that they give a true and fair view of the state of affairs of the Group and the Company and of the profit or loss of the Group for that year.
In preparing these financial statements, the Directors are required to:
• select suitable accounting policies and then apply them consistently;
• make judgements and accounting estimates that are reasonable and prudent;
• state whether applicable IFRSs as adopted by the European Union have been followed, subject to any material departures disclosed and explained in the financial statements; and
• prepare the financial statements on the going concern basis unless it is inappropriate to presume that the Parent Company and the Group will continue in business.
The Directors are responsible for keeping adequate accounting records that are sufficient to show and explain the Company’s transactions and disclose with reasonable accuracy at any time the financial position of the Parent Company and the Group and enable them to ensure that the financial statements and the Directors’ Remuneration Report comply with the Companies Act 2006 and, as regards the Group financial statements, Article 4 of the International Accounting Standards Regulation. They are also responsible for safeguarding the assets of the Parent Company and the Group and hence for taking reasonable steps for the prevention and detection of fraud and other irregularities.
Directors’ Responsibility statementsEach of the Directors, listed on page 11, confirms that, to the best of his or her knowledge:
• the Group financial statements prepared in accordance with IFRSs adopted by the European Union, give a true and fair view of the assets, liabilities, financial position and profit and loss of the issuer and the undertakings included in the consolidation taken as a whole; and
• the Strategic Report includes a fair review of the development and performance of the business and the position of the Group and Parent Company, together with a description of the principal risks and uncertainties that it faces.
The Directors consider that the Annual Report, taken as a whole, is fair, balanced and understandable, and provides the information necessary for shareholders to assess the Group and Parent Company’s position and performance, business model and strategy.
For and on behalf of the Board
Christopher Casey Director 2 October 2017
The financial statements are published on www.treuropeangrowthtrust.com which is a website maintained by Janus Henderson. The maintenance and integrity of the website is the responsibility of the Manager. The work carried out by the auditors does not involve consideration of these matters and, accordingly, the auditors accept no responsibility for any changes that may have occurred to the Annual Report since it was initially presented on the website.
Legislation in the United Kingdom governing the preparation and dissemination of financial statements may differ from legislation in other jurisdictions.
19
TR European Growth Trust PLC Annual Report 2017

Directors’ Remuneration Report
Remuneration PolicyThe Remuneration Policy (the “Policy”) sets out the principles applied in the remuneration of the Company’s Directors. An ordinary resolution to approve the Policy was last put to shareholders at the AGM on 17 November 2014 and will be put to them again at the meeting on 27 November 2017.
The Board’s approach is that fees payable to the Directors should:
• reflect the time spent by them on the Company’s affairs;
• reflect the responsibilities borne by them as Directors;
• be sufficient to promote the long term success of the Company; and
• not exceed the aggregate limit of £200,000 per annum as established by the Articles of Association.
Directors are remunerated in the form of fees which are payable quarterly in arrears.
No Director is eligible to receive bonuses, pension benefits, share options or other benefits and no long-term incentive schemes are in place.
The Directors may be reimbursed for all reasonable and properly documented expenses incurred in the performance of their duties.
The level of remuneration paid to each Director is reviewed annually, although such review will not necessarily result in a change to the rate.
Table of Directors’ remuneration components
Component RoleRate as at 30 June 2017 (per annum) Purpose Operation
Annual fee Directors £24,000 For commitment as Directors of a listed public company
Determined by the Board
Annual fee Chairman of the Audit Committee
£26,000 For additional responsibility and time commitment
Determined by the Board
Annual fee Chairman of the Board £33,000 For additional responsibility and time commitment
Determined by the Board
Expenses All Directors n/a Reimbursement of expenses incurred in performing their duties
Reimbursement upon submission of appropriate evidence
Shareholders’ viewsAny feedback from shareholders on the fees paid to Directors would be taken into account by the Board when reviewing remuneration levels.
Letters of AppointmentAll Directors are non-executive and are appointed under a Letter of Appointment, which is an engagement for services and not a contract for employment. The appointment may be terminated at any time by written notice with no compensation payable.
The Company has no executive directors or employees.
Recruitment principlesAll Directors, including any new appointments to the Board, are paid at the same rate. The Chairman of the Board and Chairman of the Audit Committee are paid a higher fee in recognition of their additional responsibilities.
The Policy has been in place since 1 July 2013 and will remain in place unless it is amended by way of an ordinary resolution put to shareholders at a general meeting. The Policy, irrespective of any changes, should be put to shareholders at intervals of not more than three years. The Board may amend the levels of remuneration paid to individual Directors within the parameters of the Policy.
20
TR European Growth Trust PLC Annual Report 2017

Directors’ Remuneration Report (continued)
Report on ImplementationThe Directors’ Remuneration Report (the “Report”) is prepared in accordance with Schedule 8 of The Large and Medium-sized Companies and Groups (Accounts and Reports) Regulations 2008 as amended in August 2013 (the “Regulations”).
A resolution to approve this Report will be put to shareholders at the AGM to be held on 27 November 2017.
Statement from the ChairmanAs the Company has no employees and the Board is comprised entirely of non-executive Directors, the Board has not established a separate Remuneration Committee. Directors’ remuneration is determined by the Board as a whole, at its discretion with an aggregate ceiling of £200,000 per annum.
Directors’ fees for the year under review were £33,000 for the Chairman, £26,000 for the Chairman of the Audit Committee and £24,000 for the remaining Directors.
Following the annual review of Directors’ fees in July 2017, changes were agreed for the current financial year. With effect from 1 July 2017, fees paid to the Chairman of the Audit Committee were increased by £4,000 to £30,000 and for the remaining Directors by £2,000 to £26,000. The adjustment was made after consideration of the fees paid to the directors of other companies of a similar size and nature.
Directors’ fees, and the additional fee paid to the Chairman of the Audit Committee, were last increased on 1 July 2014.
No changes were made to the fee paid to the Chairman, which was last increased with effect from 1 July 2016.
Directors’ interests in shares (audited)The interests of the Directors in the ordinary shares of the Company at the beginning and end of the financial year under review are set out in the table below.
Ordinary shares of
12.5p 30 June 2017
£
Ordinary shares of
12.5p 1 July 2016
£
Audley Twiston-Davies 12,500 12,500Christopher Casey 6,000 6,000Simona Heidempergher 1,600 1,600Andrew Martin Smith 10,000 10,000Alexander Mettenheimer – –
There have been no changes to any of the Directors’ holdings in the period from 30 June 2017 to the date of this report. Alexander Mettenheimer does not hold shares in the Company as a result of penal tax treatment of investment trust holdings by the German tax authorities.
Relative importance of spend on payIn order to show the relative importance of spend on pay, the table below sets out the total level of remuneration compared to the distributions paid to shareholders by way of dividends. There were no other significant distributions, payments or other uses of the Company’s profit or cash flow deemed to assist in the understanding of the relative importance of spend on pay.
2017 £
2016 £
Change £
Total remuneration 132,200 131,700 500Ordinary dividend paid during the year
5,717,041
4,747,710
969,331
Directors’ remuneration (audited)The remuneration paid to the Directors who served during the years ended 30 June 2017 and 30 June 2016 was as follows:
Year ended 30 June 2017
Total salary and fees
£
Year ended 30 June 2017
Taxable benefits
£
Year ended 30 June 2017
Total £
Year ended 30 June 2016
Total salary and fees
£
Year ended 30 June 2016
Taxable benefits
£
Year ended 30 June 2016
Total £
Audley Twiston-Davies1 33,000 – 33,000 31,000 – 31,000Christopher Casey2 26,000 – 26,000 26,000 – 26,000Simona Heidempergher 24,000 – 24,000 24,000 – 24,000Andrew Martin Smith 24,000 – 24,000 24,000 – 24,000Alexander Mettenheimer3 24,000 1,200 25,200 24,000 2,700 26,700Total 131,000 1,200 132,200 129,000 2,700 131,700
No other remuneration or compensation was paid or is payable by the Company in respect of the reporting period to any of the current or former Directors, or third parties specified by them.
Notes:The table above omits other columns set out in the relevant regulations because no payments of other types such as performance related pay, vesting performance related pay and pension related benefits were made.1 Chairman and highest paid Director2 Chairman of the Audit Committee3 £1,200 of taxable benefits (2016: £2,700) relate to personal tax services provided by Creasys Group Limited (2016: PricewaterhouseCoopers LLP)
21
TR European Growth Trust PLC Annual Report 2017

PerformanceThe graph compares the Company’s share price total return over the eight year period ended 30 June 2017 with the return from the Euromoney European Smaller Companies Index (ex UK) expressed in Sterling, the Company’s benchmark, over the same period.
Statement of voting at AGMA binding ordinary resolution adopting the Directors’ Remuneration Policy was approved at the AGM held on 17 November 2014. The votes cast by proxy were as follows:
Remuneration Policy (2014 AGM)
For – % of votes cast 94.9%Against – % of votes cast 4.7%At Chairman’s discretion – % votes cast 0.4%Number of votes withheld 185,953
A non-binding ordinary resolution adopting the Directors’ Remuneration Report for the year ended 30 June 2016 was approved by shareholders at the AGM held on 21 November 2016. The votes cast by proxy were as follows:
Directors’ Remuneration Report (2016 AGM)
For – % of votes cast 99.3%Against – % of votes cast 0.5%At Chairman’s discretion – % votes cast 0.2%Number of votes withheld 1,572,435
For and on behalf of the Board
Christopher Casey Director 2 October 2017
Directors’ Remuneration Report (continued)
20172016201520142013201220112009 2010
Company’s share price total return, assuming the investment of £100 on 30 June 2009 and the reinvestment of all dividends (excluding dealing expenses)(Source: Morningstar for the AIC)
Index total return, assuming the notional investment of £100 on 30 June 2009 and the reinvestment of all income (excluding dealing expenses)(Source: Datastream)
0
50
100
150
200
250
300
350
400
450£
22
TR European Growth Trust PLC Annual Report 2017

Corporate Governance Statement
Applicable corporate governance codesThe Company is required by the Listing Rules and the Disclosure Guidance and Transparency Rules issued by the FCA to disclose how it has applied the principles and complied with the provisions of the corporate governance code to which the issuer is subject. The UK Corporate Governance Code (the “UK Code”) issued by the Financial Reporting Council (“FRC”) in April 2016 is applicable, along with the related Code of Corporate Governance issued by the AIC (the “AIC Code”) in July 2016 (together the “Governance Codes”).
The AIC Code addresses all of the applicable principles set out in the UK Code, as well as principles and recommendations which are of specific relevance to investment trust companies. The FRC has confirmed that by following the AIC Code, and associated AIC Guide, the boards of investment companies will meet their obligations in relation to the UK Code and the disclosure requirements of the Disclosure Guidance and Transparency Rules.
Copies of the AIC Code, the AIC Guide and the UK Code can be found on the respective organisations’ websites: www.theaic.co.uk and www.frc.org.uk.
Statement of complianceThe Board has considered the principles and recommendations of the Governance Codes and believe the Company has complied with the applicable provisions of the AIC Code throughout the period under review.
The UK Code includes provisions relating to the role of the chief executive, executive directors’ remuneration and the need for an internal audit function. For the reasons set out in the AIC Guide, and as explained in the AIC Code, the Board considers these provisions are not relevant to the position of the Company as it is an externally managed investment trust company. The Company has no executive directors, employees or internal operations and has therefore not reported further in these respects.
The BoardAs at the date of this report, the Board comprises five non-executive Directors who were in office throughout the period under review. Biographical details for each Director are set out on page 11.
Responsibilities of the Board The Board is responsible for providing leadership, setting the Investment Objective of the Company, establishing an appropriately robust internal control framework enabling effective risk management and monitoring the performance delivered by the Company’s third party service providers in meeting the Objective within the control framework.
The Board meets formally at least five times a year, with additional Board or committee meetings arranged when required. The Directors have regular contact with the Fund Managers and other employees of the Manager in connection with the delivery of company secretarial, sales and marketing and other administrative services.
The Board has a formal schedule of matters specifically reserved for its decision, which includes setting strategy and providing oversight of performance against agreed measures. It approves any changes to the structure and capital arrangements for the Company, has oversight of financial reporting and assesses the effectiveness of the internal control framework. The Board approves communications with shareholders, the appointments of new directors, oversees corporate governance matters and is responsible for determining the remuneration of Directors.
Each meeting follows an agenda agreed with the Chairman and includes a review of the Company’s investment performance, financial position, compliance with the investment parameters, reporting from the Depositary, a review of shareholder movements along with any sales or marketing activities undertaken and any other relevant business matters in order to ensure that control is maintained over the Company’s affairs.
The Board has delegated contractually to external third-party service providers the management of the investment portfolio, the custodial services (which encompasses the safeguarding of the Company’s assets by the Depositary and Custodian), the day-to-day accounting, company secretarial, administration and registration services. Each of these contracts was entered into after full and proper consideration by the Board of the quality and cost of the services offered, including the control systems in operation in so far as they relate to the affairs of the Company. The Board, and its committees, maintain oversight of the third party service providers through regular and ad hoc reporting addressing any specific areas which the Board has requested.
The Manager ensures that the Directors receive all relevant management, regulatory and financial information. Employees of the Manager attend each Board meeting enabling the Directors to probe further on matters of concern. The Chairman is able to attend meetings of all the chairmen of the investment trust companies managed by Janus Henderson which provides a forum to discuss industry matters. The Directors have access to the advice and services of the Company Secretary through its designated representative who is responsible for ensuring that Board and Committee procedures are followed and that the applicable rules and regulations are complied with. The proceedings of all Board and Committee meetings are minuted, with any particular concerns raised by the Directors appropriately recorded. The Board and the Manager operate in a supportive, co-operative and open environment.
The Company has a procedure for Directors to take independent professional advice in the furtherance of their duties at the expense of the Company. In order to enable them to discharge their responsibilities, all Directors have full and timely access to relevant information.
Internal controlsThe Board has overall responsibility for the Group’s system of internal control and for reviewing its effectiveness.
23
TR European Growth Trust PLC Annual Report 2017

Corporate Governance Statement (continued)
The Board has established an ongoing process for identifying, evaluating and managing the principal risks faced by the Group. The process accords with the FRC’s guidance on Risk Management, Internal Control and Related Business and Financial Reporting published in September 2014. The system was in operation throughout the year and up to the date of this report. The system is designed to meet the specific risks faced by the Company and takes account of the nature of the Company’s reliance on its service providers and their internal controls. The system therefore manages rather than eliminates the risk of failure to achieve the Group’s business objectives and provides reasonable, but not absolute assurance against material misstatement or loss.
The key components of the internal control framework include:
• clearly defined investment criteria, specifying levels of authority and exposure limits. The Board reviews reports on investment performance against and compliance with the criteria at each meeting.
• regular financial reporting which allows the Board to assess the Company’s financial position. The management accounts and forecasts are reviewed by the Board at each meeting.
• contractual agreements with the Manager and all other third party service providers. The Board reviews performance levels and adherence to relevant provisions in the agreements on regular basis through reporting to the Board and conducts a formal evaluation of the overall level of service provided at least annually.
• the review of controls at the Manager and other third party service providers. The Board receives quarterly reporting from the Manager and Depositary, and reviews annual assurance reports on the effectiveness of the control environments at the Company’s key service providers.
• review of additional reporting provided by:
– the Manager’s Operational Risk team on the control environment in operation at the Manager and their view of the control environments in place at the third party service providers used by the Company.
– the Manager’s Internal Audit team on areas of operation which are relevant to the Company.
The Board noted the service auditors’ qualification in respect of the assurance reports of two of the Company’s third party service providers which covered controls during the reporting period. The Board is aware that the Audit Committee has sought additional clarification in respect of the exceptions which resulted in the qualifications and is satisfied that the matter has been considered in sufficient detail.
The Board has reviewed the effectiveness of the Group’s system of internal controls for the year ended 30 June 2017. During the course of its review the Board has not identified or been advised of any failings or weaknesses that have been determined as significant.
Internal audit functionSystems are in operation to safeguard the Group’s assets and shareholders’ investments, to maintain proper accounting records and to ensure that financial information used within the business, or published, is reliable. The Group’s management functions are delegated to third parties and the Board monitors the controls in place with support from the Manager’s internal audit department. As such the Board has determined that there is currently no need for the Group to have its own internal audit function.
DirectorsAppointment, retirement and tenureThe Board may appoint Directors to the Board without shareholder approval. Any Director appointed during the year must stand for election by the shareholders at the next AGM in accordance with provisions of the Articles. Directors are generally expected to serve two terms of three years, which may be extended at the discretion of the Board and subject to satisfactory performance evaluation and re-election by shareholders.
All Directors retire at intervals of not more than three years and the Company’s Articles stipulate that at least one third of the Directors should retire at each AGM. The AIC Code recommends that all directors with a tenure exceeding nine years should stand for election by shareholders at each AGM.
The Articles permit shareholders to remove a Director before the end of his term by passing an ordinary resolution at a general meeting. An appointment may be terminated by either party giving written notice without compensation payable.
IndependenceThe independence of the Directors is determined with reference to the AIC Code and is reviewed by the Nomination Committee at least annually.
The Committee considers each of the Directors other appointments and commitments, as well as their tenure of service and any connections they may have with the Manager. Following conclusion of the evaluation in July 2017, the Committee concluded that all Directors continued to be independent in character and judgement.
Induction and ongoing trainingNewly appointed Directors are offered a bespoke induction programme which covers the legal and regulatory framework for investment trust companies and the operations of the Manager, including the compliance and risk management frameworks, accounting, sales and marketing, and other administrative services carried out by the Manager.
Directors are regularly provided with information on the Company’s policies, regulatory and statutory requirements affecting the Company, as well as changes to the Directors’ responsibilities as they arise.
24
TR European Growth Trust PLC Annual Report 2017

Corporate Governance Statement (continued)
Directors are encouraged to attend external training and industry seminars, any may do so at the expense of the Company.
Directors’ insurance and indemnificationDirectors’ and officers’ liability insurance cover is in place which indemnifies the Directors against certain liabilities arising from the carrying out of their duties. The Company’s Articles and the provisions of English law, permit a qualifying third party provision indemnity to be provided to Directors in respect of costs which they may incur relating to the defence of any proceedings brought against them arising out of their positions as Directors, in which they are acquitted or judgement is given in their favour by the Court. The Company has granted an indemnity to each Director to the extent permitted by law in respect of the liabilities that may attach to them in their capacity as Directors of the Company.
Directors’ conflicts of interestThe Articles permit the Board to consider and, if it sees fit, to authorise situations where a Director has an interest that conflicts, or may possibly conflict, with the interests of the Company (“situational conflicts”). The Board has a formal system in place for Directors to declare situational conflicts to be considered for authorisation by those Directors who have no interest in the matter being considered. In deciding whether to authorise a situational conflict, the non-conflicted Directors must act honestly and in good faith with a view to the best interests of the Company. The Directors may impose limits or conditions when giving the authorisation, or subsequently, if they think this is appropriate.
Any situational conflicts which are considered, and authorised, are recorded in the minutes. These are reviewed by the Nomination Committee at least annually.
Meeting attendanceThe meeting attendance of each Director is set out in the table below.
Board AC MEC NC AGM
Number of meetings 5 2 1 1 1Audley Twiston-Davies 5 2 1 1 1Christopher Casey 5 2 1 1 1Simona Heidempergher 5 2 1 1 1Andrew Martin Smith 5 2 1 1 1Alexander Mettenheimer 5 2 1 1 1
A Committee of the Board met twice during the year to approve the Company’s financial results.
Performance evaluationThe Board conducted a review of its own performance, together with that of its Committees and each individual Director. The evaluation was carried out through the use of a questionnaire. The outcome concluded that the Board continued to have an appropriate balance of skills and experience and that each Director continued to make a significant contribution to the affairs of the Company.
The Chairman of the Audit Committee undertook a performance evaluation of the Chairman, taking feedback from all Directors. The review of the Chairman’s performance concluded that he continued to display effective leadership.
Committees of the BoardThe Board has three principal committees: the Audit Committee, the Management Engagement Committee and the Nomination Committee. The terms of reference for these committees are available on the website www.treuropeangrowthtrust.com. The Board has also constituted an Insider Committee which meets when required to assist the Board in discharging its responsibilities under the Market Abuse Regulations.
Audit CommitteeThe Audit Committee is responsible for ensuring the integrity of the Group’s financial reporting, evaluating the effectiveness of the systems of internal control and risk management and monitoring the effectiveness and objectivity of the external auditors.
The Committee is chaired by a qualified chartered accountant and all of the independent non-executive Directors are members of the Committee. The Board is satisfied that at least one member has recent and relevant experience and the Committee as a whole has competence relevant to the sector in which the Company operates.
The Audit Committee Report can be found on pages 27 and 28.
Nomination CommitteeThe Nomination Committee is responsible for ensuring the Board retains an appropriate balance of skills, experience and diversity, has a formal, rigorous and transparent approach to the appointment of directors and maintains an effective framework for succession planning.
The Committee is chaired by the Chairman of the Board. All of the independent non-executive Directors are members of the Committee.
In discharging its duties over the course of the year, the Committee considered:
• the composition of the Board and each of its committees, taking account of the skills, experience and knowledge of each Director and whether the diversity of these continued to contribute to the success of the Company;
• the outcomes of the Board performance evaluation with a view as to whether adjustments should be made to the number of Directors or knowledge and skills represented on the Board;
• the tenure of each of the Directors, giving consideration as to whether the Board retained a sufficient balance of length of service without becoming ossified;
• the independence of the Directors taking account of the guidelines established by the AIC Code and the Directors’ other commitments;
25
TR European Growth Trust PLC Annual Report 2017

Corporate Governance Statement (continued)
• the time commitment of the Directors and whether this had been sufficient over the course of the year;
• succession planning for appointments to the Board taking account of the provisions of the Articles regarding the retirement and rotation of Directors and the tenure of the current Directors; and
• the performance and contribution of the Directors standing for re-election at the 2017 AGM.
Following completion of its reviews, the Committee concluded that no changes to the composition of the Board were required at present and that each Director continued to commit sufficient time to fulfilling their duties. Taking account of the performance of individual Directors, the Committee recommended to the Board that it should support the re-appointment of Messrs Twiston-Davies, Martin Smith, Mettenheimer and Mrs Heidempergher when resolutions regarding their re-election were put to shareholders at the 2017 AGM.
Management Engagement CommitteeThe Management Engagement Committee is responsible for formally evaluating the overall performance of the Manager and other third party service providers engaged by the Company.
The Committee is chaired by the Chairman of the Board. All of the independent non-executive Directors are members of the Committee.
In discharging its duties over the course of the year, the Committee considered:
• the investment performance of the Company, taking account of the benchmark and performance of competitors in the closed-ended and open-ended sectors, the share price, level of discount and gearing;
• the quality and experience of the team involved in managing all aspects of the Company’s business;
• the fee structures of its closed-ended competitors and other, similar sized investment trust companies;
• the key clauses of the investment agreement, how the Manager had fulfilled these and whether these continued to be appropriate; and
• the performance and fees of the Company’s other third-party service providers, including the brokers, Depositary, Registrar, sales, marketing and research providers, legal counsel and the Company’s accountants.
As part of its evaluation, the Committee considered the outcomes of the Client Satisfaction Survey which had been commissioned by the Manager across all of its onshore, managed investment trust companies. The survey provided a useful benchmark for measuring the quality of services delivered by the Manager.
Following completion of its reviews, the Committee concluded that the continued appointment of the Manager remained in the best interests of the Company and the shareholders, and therefore recommended to the Board the re-appointment of Janus Henderson for a further year.
Relations with shareholdersShareholder relations are given high priority by the Board. The prime medium by which the Company communicates with its shareholders is through the Annual Report and half year results which aim to provide shareholders with a clear understanding of the Company’s activities and financial position. This information is supplemented by the daily calculation and publication of the NAV per share and a monthly fact sheet which is available on the website. The Manager provides information on the Company and videos of the Fund Managers on the Company’s website, via various social media channels and through its HGi content platform.
The Board considers that shareholders should be encouraged to attend and participate in the AGM, which is available to watch live by visiting www.janushenderson.com/trustslive. Shareholders have the opportunity to address questions to the Chairman of the Board, the Fund Manager and all Directors. A summary of the proxy votes received on the resolutions proposed is displayed at the meeting and each substantial issue is dealt with in a separate resolution. It is the intention of the Board that the Annual Report and Notice of Meeting be issued to shareholders so as to provide at least 20 working days’ notice of the meeting. These documents are also available on the website. Shareholders wishing to lodge questions in advance of the meeting, or raise issues or concerns at any time, are invited to do so by writing to the Chairman at the registered office.
General presentations to both shareholders and analysts follow the publication of the annual results. All meetings between the Fund Managers and shareholders are reported to the Board.
By order of the Board
Henderson Secretarial Services Limited Corporate Secretary 2 October 2017
26
TR European Growth Trust PLC Annual Report 2017

Audit Committee Report
Role and responsibilitiesThe Audit Committee is responsible for ensuring the integrity of the Group’s financial reporting, evaluating the effectiveness of the systems of internal control and risk management and monitoring the effectiveness and objectivity of the external auditors.
All of the independent non-executive Directors are members of the Committee.
In discharging its duties over the course of the year, the Committee considered:
• the Company’s Annual Report and half-year financial statements, the appropriateness of the accounting policies applied and the use of the going concern statement;
• the assessment of the principal risks facing the Company and the long term viability statement in light of these risks;
• the areas of judgement in the financial statements including the valuation of the Company’s unquoted investments and performance fee calculation;
• the overall approach to paying dividends and the appropriate level of dividend to be paid in respect of the year ended 30 June 2017;
• the appointment and evaluation of the effectiveness and objectivity of the auditors, and determining their remuneration;
• agreeing the nature and scope of the statutory audit and reviewing the auditors’ findings;
• monitoring and evaluating the effectiveness of the Company’s system of internal controls, and assessing the need for a separate internal audit function;
• the revised policy on the provision of non-audit services by the auditors; and
• the whistle blowing arrangements in place at the Manager enabling staff to raise concerns about possible improprieties in confidence.
MeetingsThe Committee met twice during the year under review and invited the auditors to attend as appropriate. The Manager’s designated Financial Reporting Manager for the Company also attends meetings.
Significant issues In relation to the Annual Report for the year ended 30 June 2017 the following significant issues were considered by the Committee:
Significant issue How the Committee addressed the issue
Valuation and ownership of the Group’s investments
Actively traded investments are valued using stock exchange prices provided by third party pricing vendors. The Committee specifically considers the investments that are unquoted or not actively traded, which are valued using a variety of techniques to determine their fair value. These valuations are reviewed by the Manager’s Global Fair Value Pricing Committee. Ownership of listed investments are verified by reconciliation to the custodian’s records and for unquoted investments, verification is via reconciliation to the records of the investee entities.
Calculation of the performance fee The Committee reviews the calculation of the performance fee to ensure consistency with the Management Agreement and with the application of the methodology applied in prior years.
The Chairman of the Audit Committee, Christopher Casey, reports on the year to 30 June 2017
27
TR European Growth Trust PLC Annual Report 2017

Audit Committee Report (continued)
Significant issue How the Committee addressed the issue
Internal Control environment The annual assurance reports for several of the Company’s third party service providers, were qualified by the respective service auditors. The Committee sought additional detail on the exceptions resulting in the qualification and whether these had a direct impact on the Company. Assurance was also sought in respect of the remedial actions being taken to address the issues and tactical solutions in operation in the interim. The Committee receives ongoing reporting in terms of closing out actions to address the issues identified by the reports, but is satisfied that the Company’s internal controls continue to operate effectively.
Recognition of income Income received is accounted for in line with the Company’s accounting policies. The Committee considers if the capital/income allocation remains appropriate and considers the treatment of any special dividends received during the course of the year.
Compliance with Section 1158 of the Corporation Tax Act 2010
The Committee reviews the Manager’s procedures for ensuring compliance with relevant regulations for ensuring the Company maintains its investment trust status and regularly seeks confirmation of compliance with the relevant regulations.
Policy on non-audit servicesThe Committee reviewed and adopted a revised policy on the provision of non-audit services by the auditors. The policy aligns with the provisions of the new regulations which became effective on 17 June 2016.
The Company’s auditors will only be considered for non-audit work where these are not prohibited by the regulations and where they do not appear to affect the independence and objectivity of the auditors. Such services require approval in advance by the Audit Committee, or Audit Committee Chairman, following due consideration of the proposed services.
Audit tenderIn light of the tenure of the current auditors and the new regulations on audit firm rotation, the Company put the audit out to tender during the course of the year. PwC, as the current incumbent, were unable to participate in the process.
Invitations to present to the Audit Committee were extended to four audit firms. Of the four firms invited, KPMG were unable to participate given the non-audit work which they currently undertake for the Company in respect of reclaims for EU withholding tax. The remaining firms were requested to present their approach to conducting audits, the experience of the audit team, key tools and processes used in carrying out audits, proposed approach for the first and second year audits including their plans for transitioning from the current auditors and level of fees.
In addition to the content of the presentations, the Committee considered the culture of each firm and their progress in terms of the Audit Quality Inspection Reports published by the FRC, their approach to supporting a Board comprised solely of non-executive Directors, the process for verifying the valuation of unquoted investments, the approach to assessing the control environment, the stability of the proposed audit team and any existing relationships with the Company’s third party service providers.
Following conclusion of the audit tender process, the Committee recommended to the Board the appointment of Ernst & Young LLP (‘EY’) as the auditors. The Board has agreed to the recommendation and will put the appointment of EY to the shareholders at the 2017 AGM. The new auditors will be in place to carry out the statutory audit for the financial year ending 30 June 2018.
The Company would like to extend their thanks to PwC for the many years of good service received from them.
Auditors’ feesFees paid or payable to the auditors amounted to £28,200, which included an amount of £1,000 in respect of the Company’s subsidiary. Further detail can be found in note 5 on page 44.
For and on behalf of the Board
Christopher Casey Audit Committee Chairman 2 October 2017
28
TR European Growth Trust PLC Annual Report 2017

Independent Auditors’ Report to the members of TR European Growth Trust PLC
Report on the audit of the financial statements
OpinionIn our opinion, TR European Growth Trust PLC’s Group financial statements and Parent Company financial statements (the ‘financial statements’):
• Give a true and fair view of the state of the Group’s and of the Parent Company’s affairs as at 30 June 2017 and of the Group’s and the Parent Company’s profit and cash flows for the year then ended;
• Have been properly prepared in accordance with IFRSs as adopted by the European Union; and
• Have been prepared in accordance with the requirements of the Companies Act 2006 and, as regards the Group financial statements, Article 4 of the IAS Regulation.
We have audited the financial statements, included within the Annual Report, which comprise: the Consolidated and Parent Company Balance Sheets as at 30 June 2017; the Consolidated Statement of Comprehensive Income, the Consolidated and Parent Company Cash Flow Statements, and the Consolidated and Parent Company Statements of Changes in Equity; and the notes to the financial statements, which include a description of the significant accounting policies.
Our opinion is consistent with our reporting to the Audit Committee.
Basis for opinionWe conducted our audit in accordance with International Standards on Auditing (UK) (‘ISAs (UK)’) and applicable law. Our responsibilities under ISAs (UK) are further described in the Auditors’ responsibilities for the audit of the financial statements section of our report. We believe that the audit evidence we have obtained is sufficient and appropriate to provide a basis for our opinion.
IndependenceWe remained independent of the Group in accordance with the ethical requirements that are relevant to our audit of the financial statements in the UK, which includes the FRC’s Ethical Standard as applicable to listed public interest entities, and we have fulfilled our other ethical responsibilities in accordance with these requirements.
To the best of our knowledge and belief, we declare that non-audit services prohibited by the FRC’s Ethical Standard were not provided to the Group or the Parent Company and that we have provided no non-audit services to the Group or the Parent Company in the period from 1 July 2016 to 30 June 2017.
Our audit approach
Overview
• £5.7 million (2016: £3.7 million) – Group financial statements.
• Based on 1% of Net Assets.
• £5.7 million (2016: £3.7 million) – Parent Company financial statements.
• Based on 1% of Net Assets.
• The Group is structured as an investment entity and engages Henderson Investment Funds Limited (the ‘Manager’) to manage its assets. We audited the Parent Company, TR European Growth Trust PLC and the subsidiary, TREG Finance Limited.
• We conducted our audit of the financial statements using information from BNP Paribas Securities Services (the Administrator”) to whom the Manager has, with the consent of the Directors, delegated the provision of certain administrative functions.
• We tailored the scope of our audit taking into account the types of investments within the Group, the involvement of the third parties referred to above, the accounting processes and controls, and the industry in which the Group operates.
• Valuation and existence of investments.
• Dividend income.
• Performance fee.
29
TR European Growth Trust PLC Annual Report 2017

Independent Auditors’ Report to the members of TR European Growth Trust PLC (continued)
The scope of our auditAs part of designing our audit, we determined materiality and assessed the risks of material misstatement in the financial statements. In particular, we looked at where the Directors made subjective judgements, for example in respect of significant accounting estimates that involved making assumptions and considering future events that are inherently uncertain. As in all of our audits we also addressed the risk of management override of internal controls, including evaluating whether there was evidence of bias by the Directors that represented a risk of material misstatement due to fraud.
Key audit mattersKey audit matters are those matters that, in the auditors’ professional judgement, were of most significance in the audit of the financial statements of the current period and include the most significant assessed risks of material misstatement (whether or not due to fraud) identified by the auditors, including those which had the greatest effect on: the overall audit strategy; the allocation of resources in the audit; and directing the efforts of the engagement team. These matters, and any comments we make on the results of our procedures thereon, were addressed in the context of our audit of the financial statements as a whole, and in forming our opinion thereon, and we do not provide a separate opinion on these matters. This is not a complete list of all risks identified by our audit.
Key audit matter How our audit addressed the key audit matter
Valuation and existence of investmentsPlease refer to page 27 (Audit Committee Report), page 40 (Accounting Policies) and pages 46 and 47 (Notes).
The investment portfolio at the year-end comprised of listed investments (£608.1 million), a direct private equity investment (£12.8 million) and investments in private equity funds (£0.3 million).
We focused on the valuation and existence of investments because investments represent the principal element of the net asset value as disclosed on the Consolidated and Parent Company Balance Sheets in the financial statements
We tested the valuation of the investment portfolio as follows:
• For listed investments we agreed the prices used in the valuation to independent third party sources;
• For the direct private equity investment, we understood and evaluated how the Manager had determined fair value, which was done using an earnings multiple approach with reference to a basket of comparable companies. We also confirmed that the Directors had approved the valuation of the investment as determined by the Manager. Our work included testing inputs to the valuation model by agreeing these to the investee entity’s financial reports and comparable company information. We also tested the calculations in the valuation model and discussed the valuation of this investment with the Manager and the Directors to challenge the appropriateness of the methodology, key inputs and assumptions used, with reference to the International Private Equity and Venture Capital Valuation Guidelines; and
• For the private equity fund investments, we checked the valuations applied to net asset value statements received from the fund managers.
• We tested the existence of the investment portfolio by agreeing the holdings to an independent custodian confirmation from HSBC Bank plc or to confirmations from the investee entities, as appropriate.
• No material misstatements were identified by our testing which required reporting to those charged with governance.
30
TR European Growth Trust PLC Annual Report 2017

Independent Auditors’ Report to the members of TR European Growth Trust PLC (continued)
Key audit matter How our audit addressed the key audit matter
Dividend incomePlease refer to page 28 (Audit Committee Report), page 40 (Accounting Policies) and page 43 (Notes).
We focused on the accuracy and completeness of investment income recognition and its presentation in the Consolidated Statement of Comprehensive Income as set out in the requirements of The Association of Investment Companies Statement of Recommended Practice (the ‘AIC SORP’). This is because incomplete or inaccurate income could have a material impact on the Group’s net asset value and dividend cover.
We assessed the accounting policy for income recognition for compliance with accounting standards and the AIC SORP and performed testing to check that income had been accounted for in accordance with this stated accounting policy. We found that the accounting policies implemented were in accordance with accounting standards and the AIC SORP, and that income has been accounted for in accordance with the stated accounting policy.
We understood and assessed the design and implementation of relevant controls surrounding income recognition. We tested dividend receipts by agreeing the dividend rates from investments to independent third party sources. No material misstatements were identified by our testing which required reporting to those charged with governance.
To test for completeness, we tested that the appropriate dividends had been received in the year by reference to independent data of dividends declared by investment holdings in the portfolio. Our testing did not identify any unrecorded dividends.
We tested the allocation and presentation of dividend income between the income and capital return columns of the Consolidated Statement of Comprehensive Income in line with the requirements set out in the AIC SORP. We did not find any special dividends that were not treated in accordance with the AIC SORP.
Performance feePlease refer to page 27 (Audit Committee Report) and page 43 (Notes).
A performance fee is payable for the year of £3.8 million. We focused on this area because the performance fee is calculated using a complex methodology as set out in the Investment Management Agreement between the Group and the Manager.
We independently recalculated the performance fee of £3.8 million using the methodology set out in the Investment Management Agreement and agreed the inputs to the calculation, including the benchmark data, to independent third party sources, where applicable. No material misstatements were identified by our testing which required reporting to those charged with governance.
We tested the allocation of the performance fee between the revenue and capital return columns of the Consolidated Statement of Comprehensive Income with reference to the accounting policy as set out on page 40. We found that the allocation of the performance fee was consistent with the accounting policy.
How we tailored the audit scopeWe tailored the scope of our audit to ensure that we performed enough work to be able to give an opinion on the financial statements as a whole, taking into account the structure of the Group and the Parent Company, the accounting processes and controls, and the industry in which they operate.
The Company’s accounting is delegated to the Administrator who maintain their own accounting records and controls.
As part of our risk assessment, we assessed the control environment in place at both the Manager and the Administrator to the extent relevant to our audit. This assessment of the operating and accounting structure in place at both organisations involved obtaining and reading the relevant control reports issued by the independent auditor of the Manager and the Administrator in accordance with generally accepted assurance standards for such work. We then identified those relevant controls at the Administrator on which we could place reliance to provide audit evidence.
31
TR European Growth Trust PLC Annual Report 2017

Independent Auditors’ Report to the members of TR European Growth Trust PLC (continued)
MaterialityThe scope of our audit was influenced by our application of materiality. We set certain quantitative thresholds for materiality. These, together with qualitative considerations, helped us to determine the scope of our audit and the nature, timing and extent of our audit procedures on the individual financial statement line items and disclosures and in evaluating the effect of misstatements, both individually and in aggregate on the financial statements as a whole.
Based on our professional judgement, we determined materiality for the financial statements as a whole as follows:
Group financial statements Parent Company financial statements
Overall materiality £5.7 million (2016: £3.7 million). £5.7 million (2016: £3.7 million).
How we determined it 1% of Net Assets. 1% of Net Assets.
Rationale for benchmark applied
We have applied this benchmark, a generally accepted auditing practice for investment trust audits.
We have applied this benchmark, a generally accepted auditing practice for investment trust audits.
We agreed with the Audit Committee that we would report to them misstatements identified during our audit above £284,500 (Group audit) (2016: £188,000) and £284,500 (Parent Company audit) (2016: £188,000) as well as misstatements below those amounts that, in our view, warranted reporting for qualitative reasons.
Going concernIn accordance with ISAs (UK) we report as follows:
Reporting obligation Outcome
We are required to report if we have anything material to add or draw attention to in respect of the Directors’ statement in the financial statements about whether the Directors considered it appropriate to adopt the going concern basis of accounting in preparing the financial statements and the Directors’ identification of any material uncertainties to the Group’s and the Parent Company’s ability to continue as a going concern over a period of at least twelve months from the date of approval of the financial statements.
We have nothing material to add or to draw attention to. However, because not all future events or conditions can be predicted, this statement is not a guarantee as to the Group’s and Parent Company’s ability to continue as a going concern.
We are required to report if the Directors’ statement relating to Going Concern in accordance with Listing Rule 9.8.6R(3) is materially inconsistent with our knowledge obtained in the audit.
We have nothing to report.
Reporting on other informationThe other information comprises all of the information in the Annual Report other than the financial statements and our auditors’ report thereon. The Directors are responsible for the other information. Our opinion on the financial statements does not cover the other information and, accordingly, we do not express an audit opinion or, except to the extent otherwise explicitly stated in this report, any form of assurance thereon.
In connection with our audit of the financial statements, our responsibility is to read the other information and, in doing so, consider whether the other information is materially inconsistent with the financial statements or our knowledge obtained in the audit, or otherwise appears to be materially misstated. If we identify an apparent material inconsistency or material misstatement, we are required to perform procedures to conclude whether there is a material misstatement of the financial statements or a material misstatement of the other information. If, based on the work we have performed, we conclude that there is a material misstatement of this other information, we are required to report that fact. We have nothing to report based on these responsibilities.
With respect to the Strategic Report and Report of the Directors, we also considered whether the disclosures required by the UK Companies Act 2006 have been included.
Based on the responsibilities described above and our work undertaken in the course of the audit, the Companies Act 2006, (CA06), ISAs (UK) and the Listing Rules of the Financial Conduct Authority (FCA) require us also to report certain opinions and matters as described below (required by ISAs (UK) unless otherwise stated).
32
TR European Growth Trust PLC Annual Report 2017

Independent Auditors’ Report to the members of TR European Growth Trust PLC (continued)
Strategic Report and Report of the DirectorsIn our opinion, based on the work undertaken in the course of the audit, the information given in the Strategic Report and Report of the Directors for the year ended 30 June 2017 is consistent with the financial statements and has been prepared in accordance with applicable legal requirements. (CA06)
In light of the knowledge and understanding of the Group and Parent Company and their environment obtained in the course of the audit, we did not identify any material misstatements in the Strategic Report and Report of the Directors. (CA06)
The Directors’ assessment of the prospects of the Group and of the principal risks that would threaten the solvency or liquidity of the GroupWe have nothing material to add or draw attention to regarding:
• The Directors’ confirmation on page 13 of the Annual Report that they have carried out a robust assessment of the principal risks facing the Group, including those that would threaten its business model, future performance, solvency or liquidity.
• The disclosures in the Annual Report that describe those risks and explain how they are being managed or mitigated.
• The Directors’ explanation on page 13 of the Annual Report as to how they have assessed the prospects of the Group, over what period they have done so and why they consider that period to be appropriate, and their statement as to whether they have a reasonable expectation that the Group will be able to continue in operation and meet its liabilities as they fall due over the period of their assessment, including any related disclosures drawing attention to any necessary qualifications or assumptions.
We have nothing to report having performed a review of the Directors’ statement that they have carried out a robust assessment of the principal risks facing the Group and statement in relation to the longer-term viability of the Group. Our review was substantially less in scope than an audit and only consisted of making inquiries and considering the Directors’ process supporting their statements; checking that the statements are in alignment with the relevant provisions of the UK Corporate Governance Code (the ‘Code’); and considering whether the statements are consistent with the knowledge and understanding of the Group and Parent Company and their environment obtained in the course of the audit. (Listing Rules)
Other Code ProvisionsWe have nothing to report in respect of our responsibility to report when:
• The statement given by the Directors, on page 19, that they consider the Annual Report taken as a whole to be fair, balanced and understandable, and provides the information necessary for the members to assess the Group’s and Parent Company’s position and performance, business model and strategy is materially inconsistent with our knowledge of the Group and Parent Company obtained in the course of performing our audit.
• The section of the Annual Report on pages 27 and 28 describing the work of the Audit Committee does not appropriately address matters communicated by us to the Audit Committee.
The Directors’ statement relating to the Parent Company’s compliance with the Code does not properly disclose a departure from a relevant provision of the Code specified, under the Listing Rules, for review by the auditors.
Directors’ remunerationIn our opinion, the part of the Directors’ Remuneration Report to be audited has been properly prepared in accordance with the Companies Act 2006. (CA06)
Responsibilities for the financial statements and the audit
Responsibilities of the Directors for the financial statementsAs explained more fully in the Statement of Directors’ Responsibilities set out on page 19, the Directors are responsible for the preparation of the financial statements in accordance with the applicable framework and for being satisfied that they give a true and fair view. The Directors are also responsible for such internal control as they determine is necessary to enable the preparation of financial statements that are free from material misstatement, whether due to fraud or error.
In preparing the financial statements, the Directors are responsible for assessing the Group’s and the Parent Company’s ability to continue as a going concern, disclosing as applicable, matters related to going concern and using the going concern basis of accounting unless the Directors either intend to liquidate the Group or the Parent Company or to cease operations, or have no realistic alternative but to do so.
33
TR European Growth Trust PLC Annual Report 2017

Independent Auditors’ Report to the members of TR European Growth Trust PLC (continued)
Auditors’ responsibilities for the audit of the financial statementsOur objectives are to obtain reasonable assurance about whether the financial statements as a whole are free from material misstatement, whether due to fraud or error, and to issue an auditors’ report that includes our opinion. Reasonable assurance is a high level of assurance, but is not a guarantee that an audit conducted in accordance with ISAs (UK) will always detect a material misstatement when it exists. Misstatements can arise from fraud or error and are considered material if, individually or in the aggregate, they could reasonably be expected to influence the economic decisions of users taken on the basis of these financial statements.
A further description of our responsibilities for the audit of the financial statements is located on the FRC’s website at: www.frc.org.uk/auditorsresponsibilities. This description forms part of our auditors’ report.
Use of this reportThis report, including the opinions, has been prepared for and only for the Parent Company’s members as a body in accordance with Chapter 3 of Part 16 of the Companies Act 2006 and for no other purpose. We do not, in giving these opinions, accept or assume responsibility for any other purpose or to any other person to whom this report is shown or into whose hands it may come save where expressly agreed by our prior consent in writing.
Other required reporting
Companies Act 2006 exception reportingUnder the Companies Act 2006 we are required to report to you if, in our opinion:
• We have not received all the information and explanations we require for our audit; or
• Adequate accounting records have not been kept by the Parent Company, or returns adequate for our audit have not been received from branches not visited by us; or
• Certain disclosures of Directors’ remuneration specified by law are not made; or
• The Parent Company financial statements and the part of the Directors’ Remuneration Report to be audited are not in agreement with the accounting records and returns.
We have no exceptions to report arising from this responsibility.
AppointmentFollowing the recommendation of the Audit Committee, we were appointed in 1991 to audit the financial statements for the year ended 30 June 1991 and subsequent financial periods. The period of total uninterrupted engagement is 27 years, covering the years ended 30 June 1991 to 30 June 2017.
Jeremy Jensen (Senior Statutory Auditor) for and on behalf of PricewaterhouseCoopers LLP Chartered Accountants and Statutory Auditors London 2 October 2017
34
TR European Growth Trust PLC Annual Report 2017

Consolidated Statement of Comprehensive Income
Year ended 30 June 2017 Year ended 30 June 2016
Note
Revenue return £’000
Capital return £’000
Total return £’000
Revenue return £’000
Capital return £’000
Total return £’000
2 Investment income 10,656 – 10,656 8,215 – 8,2153 Other income – – – 43 – 4310 Gains on investments held at
fair value through profit or loss – 197,673 197,673 – 41,583 41,583Total income 10,656 197,673 208,329 8,258 41,583 49,841Expenses
4 Management and performance fee (597) (6,186) (6,783) (427) (3,099) (3,526)
5 Other operating expenses (582) – (582) (591) – (591)Profit before finance costs and taxation 9,477 191,487 200,964 7,240 38,484 45,724
6 Finance costs (114) (456) (570) (110) (441) (551)Profit before taxation 9,363 191,031 200,394 7,130 38,043 45,173
7 Taxation (854) – (854) (391) – (391)Profit for the year and total comprehensive income 8,509 191,031 199,540 6,739 38,043 44,782
8 Return per ordinary share – basic and diluted 17.09p 383.67p 400.76p 13.48p 76.12p 89.60p
The total column of this statement represents the Consolidated Statement of Comprehensive Income, prepared in accordance with IFRSs, as adopted by the European Union.
The revenue return and capital return columns are supplementary to this and are prepared under guidance published by the Association of Investment Companies.
All income is attributable to the equity holders of TR European Growth Trust PLC, the Parent Company.
The net profit of the Parent Company for the year was £199,540,000 (2016: £44,782,000).
The notes on pages 39 to 58 form part of these financial statements.
35
TR European Growth Trust PLC Annual Report 2017

Consolidated and Parent Company Statements of Changes in Equity
The notes on pages 39 to 58 form part of these financial statements.
Consolidated Year ended 30 June 2017
Note
Called up share capital
£’000
Share premium account
£’000
Capital redemption
reserve £’000
Other capital reserves
£’000
Revenuereserve
£’000Total
£’000
Total equity at 1 July 2016 6,247 115,451 13,931 218,118 23,936 377,683Total comprehensive income:Profit for the year – – – 191,031 8,509 199,540Transactions with owners, recorded directly to equity:
9 Ordinary dividends paid – – – – (5,717) (5,717)18 Buy back of ordinary shares for
cancellation (33) – 33 (2,047) – (2,047)Total equity at 30 June 2017 6,214 115,451 13,964 407,102 26,728 569,459
Consolidated Year ended 30 June 2016
Note
Called up share capital
£’000
Share premium account
£’000
Capital redemption
reserve £’000
Other capital reserves
£’000
Revenuereserve
£’000Total
£’000
Total equity at 1 July 2015 6,247 115,451 13,931 180,075 21,941 337,645Total comprehensive income:Profit for the year – – – 38,043 6,739 44,782Transactions with owners, recorded directly to equity:
9 Ordinary dividends paid – – – – (4,748) (4,748)19 Refund of unclaimed dividends over
12 years old – – – – 4 4Total equity at 30 June 2016 6,247 115,451 13,931 218,118 23,936 377,683
Company Year ended 30 June 2017
Note
Called up share capital
£’000
Share premium account
£’000
Capital redemption
reserve £’000
Other capital reserves
£’000
Revenuereserve
£’000Total
£’000
Total equity at 1 July 2016 6,247 115,451 13,931 219,161 22,893 377,683Total comprehensive income:Profit for the year – – – 191,029 8,511 199,540Transactions with owners, recorded directly to equity:
9 Ordinary dividends paid – – – – (5,717) (5,717)18 Buy back of ordinary shares for
cancellation (33) – 33 (2,047) – (2,047)Total equity at 30 June 2017 6,214 115,451 13,964 408,143 25,687 569,459
Company Year ended 30 June 2016
Note
Called up share capital
£’000
Share premium account
£’000
Capital redemption
reserve £’000
Other capital reserves
£’000
Revenuereserve
£’000Total
£’000
Total equity at 1 July 2015 6,247 115,451 13,931 181,120 20,896 337,645Total comprehensive income:Profit for the year – – – 38,041 6,741 44,782Transactions with owners, recorded directly to equity:
9 Ordinary dividends paid – – – – (4,748) (4,748)19 Refund of unclaimed dividends over
12 years old – – – – 4 4Total equity at 30 June 2016 6,247 115,451 13,931 219,161 22,893 377,683
36
TR European Growth Trust PLC Annual Report 2017

Consolidated and Parent Company Balance Sheets
Note
At 30 June 2017
Consolidated £’000
At 30 June 2016
Consolidated £’000
At 30 June 2017
Company £’000
At 30 June 2016
Company £’000
Non current assets10 Investments held at fair value through profit
or loss 621,237 413,379 622,209 414,353Current assets
13 Receivables 3,711 1,442 3,711 1,442Cash and cash equivalents 57 73 54 70
3,768 1,515 3,765 1,512Total assets 625,005 414,894 625,974 415,865Current liabilities
14 Payables (6,360) (3,686) (7,329) (4,657)Bank overdrafts (49,186) (33,525) (49,186) (33,525)
(55,546) (37,211) (56,515) (38,182)Net assets 569,459 377,683 569,459 377,683Equity attributable to equity shareholders of the parent company
16 Called up share capital 6,214 6,247 6,214 6,24717 Share premium account 115,451 115,451 115,451 115,45118 Capital redemption reserve 13,964 13,931 13,964 13,931
Retained earnings:18 Other capital reserves 407,102 218,118 408,143 219,16119 Revenue reserve 26,728 23,936 25,687 22,89320 Total equity 569,459 377,683 569,459 377,68320 Net asset value per ordinary share – basic and
diluted 1,145.48p 755.73p 1,145.48p 755.73p
The financial statements on pages 35 to 58 were approved and authorised for issue by the Board on 2 October 2017 and signed on its behalf by:
Christopher Casey Director
The notes on pages 39 to 58 form part of these financial statements.
37
TR European Growth Trust PLC Annual Report 2017
Consolidated and Parent Company Cash Flow Statements
Year ended 30 June 2017 Year ended 30 June 2016
Consolidated £’000
Company £’000
Consolidated £’000
Company £’000
Operating activitiesProfit before taxation 200,394 200,394 45,173 45,173Add back: interest payable 570 570 551 551Less: gains on investments held at fair value through profit or loss (197,673) (197,670) (41,583) (41,580)Sales of investments held at fair value through profit or loss 286,750 286,750 246,136 246,136Purchases of investments held at fair value through profit or loss (295,407) (295,407) (232,013) (232,013)Withholding tax on dividends deducted at source (1,304) (1,304) (990) (990)Increase in prepayments and accrued income (173) (173) (89) (89)(Increase)/decrease in amounts due from brokers (2,025) (2,025) 1,181 1,181Increase/(decrease) in accruals and deferred income 2,742 2,739 (291) (294)Decrease in amounts due to brokers (148) (148) (153) (153)Net cash (outflow)/inflow from operating activities before interest and taxation (6,274) (6,274) 17,922 17,922Interest paid (570) (570) (551) (551)Taxation recovered 459 459 482 482Net cash (outflow)/inflow from operating activities (6,385) (6,385) 17,853 17,853Financing activitiesEquity dividends paid (net of refund of unclaimed dividends – see note 9) (5,717) (5,717) (4,744) (4,744)Buy back of ordinary shares for cancellation (2,047) (2,047) – –Net cash outflow from financing (7,764) (7,764) (4,744) (4,744)(Decrease)/increase in cash and cash equivalents (14,149) (14,149) 13,109 13,109Cash and cash equivalents at the start of the year (33,452) (33,455) (40,325) (40,328)Exchange movements (1,528) (1,528) (6,236) (6,236)Cash and cash equivalents at the end of the year (49,129) (49,132) (33,452) (33,455)Comprising:Cash at bank 57 54 73 70Bank overdrafts (49,186) (49,186) (33,525) (33,525)
(49,129) (49,132) (33,452) (33,455)
The notes on pages 39 to 58 form part of these financial statements.
38
TR European Growth Trust PLC Annual Report 2017

Notes to the Financial Statements
1 Accounting policiesa) Basis of preparation TR European Growth Trust PLC is a Company incorporated and domiciled in the United Kingdom under the Companies Act 2006. The consolidated and Parent Company financial statements for the year ended 30 June 2017 have been prepared in accordance with International Financial Reporting Standards (“IFRSs”) as adopted by the European Union and with those parts of the Companies Act 2006 (the “Act”) applicable to companies reporting under IFRSs. IFRSs comprise standards and interpretations approved by the International Accounting Standards Board (“IASB”), together with interpretations of the International Accounting Standards and Standing Interpretation Committee approved by the IFRS Interpretations Committee (“IFRS IC”) that remain in effect to the extent that IFRSs have been adopted by the European Union. The accounting policies have been consistently applied in the current and previous year.
The preparation of financial statements in conformity with IFRSs requires the use of certain critical accounting estimates. It also requires management to exercise its judgement in the process of applying the Company’s accounting policies. The areas involving a higher degree of judgement or complexity, or areas which assumptions and estimates are significant to the financial statements are disclosed in notes 10 and 15.5.
The financial statements have been prepared on a going concern basis and on the historical cost basis, except for the revaluation of certain financial instruments at fair value through profit and loss. The principal accounting policies adopted are set out below. Where presentational guidance set out in the Statement of Recommended Practice (“SORP”) for investment trusts issued by the Association of Investment Companies (“AIC”) in November 2014 and updated in January 2017 with consequential amendments is consistent with the requirements of IFRSs, the Directors have sought to prepare the financial statements on a basis consistent with the recommendations of the SORP.
The financial position of the Group is described in the Strategic Report on pages 2 to 16. Note 15 to the financial statements includes the Group’s policies and process for managing its capital; its financial risk management objectives; and details of financial instruments and exposure to credit risk and liquidity risk.
Accounting standardsi) The following new and amended standards are relevant and applicable to the Company and have been adopted although they have no impact on the financial statements:
Amendments to IFRS as adopted by the EU. Pronouncements issued and effective for the current year end:
Standard
Effective for annual periods beginning
on or after
IAS 1 Amendment Disclosure Initiative 1 January 16
ii) Relevant new standards, amendments and interpretations issued but not effective for the current financial year and not early adopted by the Company:
Standard
Effective for annual periods beginning
on or after
IAS 7 Amendment Disclosure Initiative 1 January 17IAS 12 Amendment Recognition of Deferred Tax Assets for Unrealised Losses 1 January 18IFRS 9 Financial Instruments 1 January 18IFRS 15 Revenue from Contracts with Customers 1 January 18IFRS 15 Amendment Clarifications 1 January 18
b) Basis of consolidationThe Group financial statements consolidate the financial statements of the Company and of its sole subsidiary undertaking, TREG Finance Limited (the “subsidiary”). Consistent accounting policies have been used across the Group. The intragroup balances are eliminated on consolidation. The investment in the subsidiary is recognised at fair value in the financial statements of the Parent Company.
39
TR European Growth Trust PLC Annual Report 2017

Notes to the Financial Statements (continued)
c) Going concernThe Group’s shareholders are asked every three years to vote for the continuation of the Company. An ordinary resolution to this effect was put to the Annual General Meeting (“AGM”) held on 21 November 2016 and passed by the substantial majority of the shareholders. The next such resolution will be put to the shareholders at the AGM in 2019. The assets of the Group consist mainly entirely of securities that are listed and readily realisable and, accordingly, the Directors believe that the Group has adequate resources to continue in operational existence for at least twelve months from the date of approval of the financial statements. Having assessed these factors, the principal risks and other matters discussed in connection with the Viability Statement, the Board has decided that it is appropriate for the financial statements to be prepared on a going concern basis.
d) Investments held at fair value through profit or lossAll investments are designated upon initial recognition as held at fair value through profit or loss. Investment transactions are accounted for on a trade date basis. Proceeds are measured at fair value, which are regarded as the proceeds of sale less any transaction costs. The fair value of the financial instruments in the balance sheet is based on their quoted bid price at the balance sheet date, without deduction of the estimated future selling costs. Unquoted investments (including the Parent Company’s investment in its subsidiary) are valued by the Directors using primary valuation techniques such as earnings multiples, recent transactions and net assets. The valuation of private equity holdings are determined with regard to the International Private Equity and Venture Capital Guidelines (‘IPEV’). All such valuations are reviewed by the Manager’s Global Fair Value Pricing Committee and by the Directors at least twice each year. Where fair value cannot be reliably measured, the investment will be carried at the previous reporting date value unless there is evidence that the investment has since been impaired, in which case the value will be reduced.
Changes in the fair value of investments held at fair value through profit or loss and gains and losses on disposal are recognised in the Consolidated Statement of Comprehensive Income as “Gains or losses on investments held at fair value through profit or loss”. Also included within this caption are transaction costs in relation to the purchase or sale of investments, including the difference between the purchase price of an investment and its bid price at the date of purchase.
e) Presentation of Consolidated Statement of Comprehensive IncomeIn order to better reflect the activities of an investment trust company, and in accordance with guidance issued by the AIC, supplementary information which analyses the Consolidated Statement of Comprehensive Income between items of a revenue and capital nature has been presented alongside the Consolidated Statement of Comprehensive Income. Additionally, the net revenue is the measure the Directors believe appropriate in assessing the Group’s compliance with certain requirements set out in Section 1158 of the Corporation Tax Act 2010 (“Section 1158”).
f) IncomeDividends receivable on equity shares are recognised as revenue for the year on an ex-dividend basis. Special dividends are treated as revenue return or as capital return, depending on the facts of each individual case. Bank deposit interest is accounted for on an accrual basis.
Where the Company enters into a commitment to sub-underwrite an issue of securities in exchange for the receipt of commission, a derivative financial instrument is created. Any such derivatives are recognised initially at fair value. They are re-measured subsequently at fair value, with the related gains and losses being reflected in the Consolidated Statement of Comprehensive Income. Net losses arising from these derivatives, where the actual or expected loss from taking up the securities underwritten exceeds the commission income, are allocated to the capital return. Net gains are allocated to the revenue return.
g) ExpensesAll expenses and interest payable are accounted for on an accruals basis. On the basis of the Board’s expected long-term split of total returns in the form of capital and revenue returns of 80% and 20%, respectively, the Company charges 80% of its finance costs and management fees to capital. Any performance fees payable are allocated wholly to capital, reflecting the fact that although they are calculated on a total return basis they are expected to be attributable largely, if not wholly, to capital performance. Expenses which are incidental to the purchase or sale of an investment are charged to the capital return column of the Consolidated Statement of Comprehensive Income and allocated to the other capital reserves. All other operating expenses are charged to the revenue return column of the Consolidated Statement of Comprehensive Income.
1 Accounting policies (continued)
40
TR European Growth Trust PLC Annual Report 2017

Notes to the Financial Statements (continued)
h) TaxationThe tax expense represents the sum of the tax currently payable and deferred tax.
The tax currently payable is based on the taxable profit for the year. Taxable profit differs from net profit as reported in the Consolidated Statement of Comprehensive Income because it excludes items of income or expense that are taxable or deductible in other years and it further excludes items that are never taxable or deductible. The Group’s liability for current tax is calculated using the effective tax rate of corporation tax for the accounting period.
In line with the recommendations of the SORP, the allocation method used to calculate tax relief on expenses presented against capital returns in the supplementary information in the Consolidated Statement of Comprehensive Income is the “marginal basis”. Under this basis, if taxable income is capable of being offset entirely by expenses presented in the revenue return column of the Consolidated Statement of Comprehensive Income, then no tax relief is transferred to the capital return column.
Deferred tax is the tax expected to be payable or recoverable on differences between the carrying amounts of assets and liabilities in the financial statements and the corresponding tax bases used in the computation of taxable profit, and is accounted for using the balance sheet liability method. Deferred tax liabilities are recognised for all taxable temporary differences and deferred tax assets are recognised to the extent that it is probable that taxable profits will be available against which deductible temporary differences can be utilised. Investment trusts which have approval as such under Section 1158 are not liable for taxation on capital gains.
The carrying amount of deferred tax assets is reviewed at each balance sheet date and reduced to the extent that it is no longer probable that sufficient taxable profits will be available to allow all or part of the asset to be recovered.
Deferred tax is calculated at the tax rates that are expected to apply in the period when the liability is settled or the asset is realised. Deferred tax is charged or credited in the Consolidated Statement of Comprehensive Income, except when it relates to items charged or credited directly to equity, in which case the deferred tax is also dealt with in equity.
i) Dividend policyDividends payable to shareholders are recognised in the financial statements when they are paid or, in case of final dividends, when they are approved by shareholders. Dividends are dealt with in the Consolidated and Parent Company Statement of Changes in Equity. Following the change to the Company’s Articles of Association with effect from 21 November 2016 dividends may be paid from the revenue reserve or realised capital profits.
j) Foreign currencyFor the purposes of the consolidated financial statements, the results and financial position of each entity are expressed in pounds sterling, which is the functional currency of the Company and of its subsidiary and the presentational currency of the Group. Sterling is the functional currency because it is the currency of the primary economic environment in which the Company and its subsidiary operates.
Transactions recorded in overseas currencies during the year are translated into sterling at the appropriate daily exchange rates. Monetary assets and liabilities and equity investments held at fair value through profit or loss that are denominated in overseas currencies at the balance sheet date are translated into sterling at the exchange rates ruling at that date. Exchange gains and losses on investments held at fair value through profit or loss are included within “Gains or losses on investments held at fair value through profit or loss”.
k) Cash and cash equivalentsCash comprises cash in hand and demand deposits. Cash equivalents are short-term, highly liquid investments that are readily convertible to known amounts of cash and that are subject to an insignificant risk of changes in value. In the Consolidated and Parent Company Cash Flow Statements, cash and cash equivalents includes cash in hand, deposits held at call with banks and bank overdrafts. In the Consolidated and Parent Company Balance Sheets, bank overdrafts are shown within borrowings in current liabilities.
l) Bank borrowingsInterest bearing bank loans and overdrafts are recorded initially at fair value, being the proceeds received, net of direct issue costs. They are subsequently measured at amortised cost. Finance costs, including premiums payable on settlement or redemption and direct issue costs, are accounted for on an accruals basis in the Consolidated Statement of Comprehensive Income using the effective interest rate method and are added to the carrying amount of the instrument to the extent that they are not settled in the period in which they arise.
1 Accounting policies (continued)
41
TR European Growth Trust PLC Annual Report 2017

Notes to the Financial Statements (continued)
m) ReceivablesReceivables are amounts due from securities sold for future settlement, withholding tax recoverable, prepayments and accrued income in the ordinary course of business. If collection is expected in one year or less (or in the normal operating cycle of the business if longer), they are classified as current assets. If not, they are presented as non-current assets. Receivables are recognised initially at fair value and subsequently measured at amortised cost using the effective interest method.
n) PayablesPayables are obligations to pay for securities purchased for future settlement, amounts due to the subsidiary undertaking, accruals and deferred income that have been acquired/incurred in the ordinary course of business. Accounts payable are classified as current liabilities if payment is due within one year or less (or in the normal operating cycle of the business if longer). If not, they are presented as non-current liabilities. Payables are recognised initially at fair value and subsequently measured at amortised cost using the effective interest method.
o) Repurchase of ordinary sharesThe costs of repurchasing ordinary shares, including related stamp duty and transaction costs, are taken directly to equity and dealt with in the Consolidated and Parent Company Statement of Changes in Equity. Share repurchase transactions are accounted for on a trade date basis. The nominal value of ordinary share capital repurchased and cancelled is transferred out of called up share capital and into the capital redemption reserve.
p) Capital reservesOther Capital reserves – Capital reserve arising on investments sold The following are accounted for in this reserve:
• gains and losses on the disposals of investments;
• expenses and finance costs allocated to capital net of tax relief;
• realised foreign exchange differences of a capital nature; and
• costs of repurchasing ordinary share capital.
– Capital reserve arising on revaluation of investments held The following are accounted for in this reserve:
• increases and decreases in the valuation of investments held at the year end; and
• unrealised foreign exchange differences of a capital nature.
Revenue reserve The revenue reserve represents accumulated revenue profits retained by the Group that have not currently been distributed to shareholders as a dividend.
Capital redemption reserve The capital redemption reserve represents the nominal value of ordinary shares repurchased and cancelled.
Share capital Share capital represents the nominal value of ordinary shares issued.
Share premium The share premium account represents the premium above nominal value received by the Company on issuing shares net of issue costs.
1 Accounting policies (continued)
42
TR European Growth Trust PLC Annual Report 2017

Notes to the Financial Statements (continued)
q) Key estimates and assumptionsEstimates and assumptions used in preparing the financial statements are reviewed on an ongoing basis and are based on historical experience and various other factors that are believed to be reasonable under the circumstances. The result of these estimates and assumptions form the basis of making judgments about carrying values of assets and liabilities that are not readily apparent from other sources.
The only estimates and assumptions that may cause material adjustment to the carrying value of assets and liabilities relate to the valuation of unquoted investments. These are valued in accordance with the techniques set out in this note under the heading “Investments held at fair value through profit or loss”. At the year end, unquoted investments represented 2.3% of net assets (2016: 4.5%). These comprise the entirety of the Group’s Level 3 investments in Note 15.5.
r) Operating segmentsUnder IFRS 8, operating segments are considered to be components of an entity about which separate financial information is available that is evaluated regularly by the chief operating decision maker in deciding how to allocate resources and in assessing performance. The Directors meet regularly to consider investment strategy and monitor the Company’s performance. The Fund Managers, who have been appointed to manage the Company’s investments, attend all Board meetings at which investment strategy and performance are discussed. The Directors consider that the Group has one operating segment, being the Parent Company’s activity of investing in shares and securities primarily for capital appreciation in accordance with the Company’s published Investment Objective. Its subsidiary exists to trade in securities to enhance the Group’s returns but has not entered into any such transactions in recent years.
An analysis of investments by country has been provided on page 6. Further analyses of expenses, investment gains or losses, profit and other assets and liabilities by country have not been given as either it is not possible to prepare such information in a meaningful way or the results are not considered to be significant.
2 Investment income2017
£’0002016
£’000
UK dividend income from listed investments – 16Overseas dividend income from listed investments 10,656 8,199
10,656 8,215
All dividend income is derived from investments in Continental Europe.
3 Other income2017
£’0002016
£’000
Interest received on withholding tax refund – 43– 43
4 Management and performance fee2017 2016
Revenue return £’000
Capital return £’000
Total return £’000
Revenue return £’000
Capital return £’000
Total return £’000
Management fee 597 2,386 2,983 427 1,710 2,137Performance fee – 3,800 3,800 – 1,389 1,389Total 597 6,186 6,783 427 3,099 3,526
A summary of the terms of the management agreement is given on page 4.
1 Accounting policies (continued)
43
TR European Growth Trust PLC Annual Report 2017

Notes to the Financial Statements (continued)
5 Other operating expenses2017
£’0002016
£’000
Auditors’ remuneration:• audit services relating to the Group and Parent Company 30 27• audit services relating to the subsidiary undertaking 1 1Directors’ fees and expenses1 132 132Other expenses payable to the management company2 20 20Custody fees 111 100Depositary charges 55 45Printing 19 24AIC fee 20 20Irrecoverable VAT 41 43Other expenses 153 179
582 591
1 Included within this balance is £1,200 (2016: £2,700) in relation to personal tax services provided by Creasys Group Limited (2016: PricewaterhouseCoopers LLP) to a Director as disclosed on page 21. See Directors’ Remuneration Report on page 21 for more details on remuneration
2 Other expenses payable to the management company relate to marketing services
6 Finance costs2017 2016
Revenue return £’000
Capital return £’000
Total return £’000
Revenue return £’000
Capital return £’000
Total return £’000
Bank overdraft interest 114 456 570 110 441 551
7 Taxationa) Analysis of charge in year
2017 2016
Revenue return £’000
Capital return £’000
Total return £’000
Revenue return £’000
Capital return £’000
Total return £’000
Foreign withholding taxes 1,344 – 1,344 974 – 974Overseas tax reclaimable (490) – (490) (362) – (362)Refund of French withholding tax – – – (221) – (221)Total current tax for the year (see note 7 b) 854 – 854 391 – 391
44
TR European Growth Trust PLC Annual Report 2017

Notes to the Financial Statements (continued)
7 Taxation (continued)b) Factors affecting tax charge for the yearThe standard rate of corporation tax in the UK is 19% with effect from 1 April 2017.
The tax assessed for the year ended 30 June 2017 is lower than the effective rate of corporation tax of 19.75% (2016: 20.00%).
2017 2016
Revenue return £’000
Capital return £’000
Total return £’000
Revenue return £’000
Capital return £’000
Total return £’000
Net profit on ordinary activities before taxation 9,363 191,031 200,394 7,130 38,043 45,173Corporation tax at 19.75% (2016: 20.00%) 1,849 37,729 39,578 1,426 7,609 9,035Effects of:Gains on investments held not taxable – (39,040) (39,040) – (8,317) (8,317)Capital expense unutilised for tax purposes – 1,311 1,311 – 708 708Non-taxable dividends (2,053) – (2,053) (1,599) – (1,599)Overseas tax 854 – 854 612 – 612Losses available to be utilised 204 – 204 173 – 173Refund of French withholding tax – – – (221) – (221)Tax charge 854 – 854 391 – 391
c) Provision for deferred taxation No provision for deferred taxation has been made in the current year or in the prior year. Due to the Company’s tax status as an investment trust and the intention to continue meeting the conditions required to maintain approval of such status in the foreseeable future, the Company has not provided deferred tax on any capital gains arising on the revaluation or disposal of investments.
d) Factors that may affect future tax charges The Group has not recognised deferred tax assets of £5,171,000 (2016: £4,525,000) arising as a result of loan relationship deficits and excess management expenses. These expenses will only be utilised if the Group has profits chargeable to corporation tax in the future.
8 Return per ordinary share The return per ordinary share figure is based on the net profit for the year of £199,540,000 (2016: £44,782,000) and on the weighted average number of ordinary shares in issue during the year of 49,790,368 (2016: 49,975,897).
The return per ordinary share figure detailed above can be further analysed between revenue and capital, as below. The Company has no securities in issue that could dilute the return per ordinary share. Therefore the basic and diluted return per ordinary share are the same.
2017 £’000
2016 £’000
Net revenue profit 8,509 6,739Net capital profit 191,031 38,043Net profit 199,540 44,782Weighted average number of ordinary shares in issue during the year 49,790,368 49,975,897
2017 Pence
2016 Pence
Revenue return per ordinary share 17.09 13.48Capital return per ordinary share 383.67 76.12Total return per ordinary share 400.76 89.60
45
TR European Growth Trust PLC Annual Report 2017

Notes to the Financial Statements (continued)
9 Dividends2017
£’0002016
£’000
Amounts recognised as distributions to equity holders in the year:Final dividend of 9.00p and special dividend of 2.50p per ordinary share for the year ended 30 June 2016 (2015: final dividend of 7.00p and special dividend of 2.50p per ordinary share for the year ended 30 June 2015) 5,717 4,748
5,717 4,748
The final dividend of 9.00p and the special dividend of 2.50p per ordinary share in respect of the year ended 30 June 2016 were paid on 5 December 2016 to shareholders on the register of members at the close of business on 4 November 2016. The total dividend paid amounted to £5,717,000.
Subject to approval at the AGM in November 2017, the proposed final dividend of 11.50p and a special dividend of 3.00p per ordinary share will be paid on 30 November 2017 to shareholders on the register of members at the close of business on 3 November 2017. The shares will be quoted ex-dividend on 2 November 2017.
The total dividends payable in respect of the financial year which form the basis of the test under Section 1158 are set out below:
The proposed final and special dividends for the year ended 30 June 2017 have not been included as a liability in these financial statements. Under IFRSs, these dividends are not recognised until approved by shareholders.
During the year the Company received a refund of £nil of unclaimed dividends over 12 years old (2016: £4,000).
The total dividends payable in respect of the financial year which form the basis of Section 1158 are set out below:
Consolidated Company
2017 £’000
2016 £’000
2017 £’000
2016 £’000
Revenue available for distribution by way of dividends for the year 8,509 6,739 8,511 6,741Proposed total dividend for the year ended 30 June 2017 – 14.50p (2016: 11.50p) (comprising a final dividend of 11.50p and a special dividend of 3.00p) (based on 49,713,397 shares in issue at 2 October 2017) (7,208) (5,739) (7,208) (5,739)Revenue surplus 1,301 1,000 1,303 1,002
For Section 1158 purposes the Company’s undistributed revenue represents 13.5% (2016: 13.0%) of total income.
10 Investments held at fair value through profit or lossa) Consolidated
2017 £’000
2016 £’000
Cost at start of year 376,283 367,981Investment holding gains at start of year 37,096 11,702Valuation at start of year 413,379 379,683Movements in the year:Acquisitions at cost 295,407 232,013Disposals at cost (215,615) (223,711)Movements in investment holding gains 128,066 25,394Valuation at 30 June 621,237 413,379Cost at 30 June 456,075 376,283Investment holding gains 165,162 37,096Valuation at 30 June 621,237 413,379
Included in the total investments are investments shown at the Directors’ fair valuation of £13,139,000 and classified as Level 3 investments (2016: £17,009,000). Further detail is provided in note 15.5 on page 54.
At 30 June 2017 no convertible or fixed interest securities were held in the portfolio (2016: none).
46
TR European Growth Trust PLC Annual Report 2017

Notes to the Financial Statements (continued)
10 Investments held at fair value through profit or loss (continued)b) Company
2017Investments
£’000
Subsidiary undertaking
£’000Total
£’000
Cost at 1 July 2016 376,283 – 376,283Investment holding gains at 1 July 2016 37,096 974 38,070Valuation at 1 July 2016 413,379 974 414,353Movement in the year:Acquisitions at cost 295,407 – 295,407Disposals at cost (215,615) – (215,615)Movements in investment holding gains 128,066 (2) 128,064Valuation at 30 June 2017 621,237 972 622,209Cost at 30 June 2017 456,075 – 456,075Investment holding gains 165,162 972 166,134Valuation at 30 June 2017 621,237 972 622,209
Included in the total investments are unquoted investments shown at the Directors’ fair valuation of £14,111,000 and classified as Level 3 investments (2016: £17,983,000). Further detail is provided in note 15.5 page 54.
Purchase and sale transaction costs for the Company during the year ended 30 June 2017 were £299,000 and £252,000 respectively (2016: transaction costs of purchases £315,000; transaction costs of sales £238,000). These comprise mainly stamp duty and commission.
2016Investments
£’000
Subsidiary undertaking
£’000Total
£’000
Cost at 1 July 2015 367,981 – 367,981Investment holding gains at 1 July 2015 11,702 976 12,678Valuation at 1 July 2015 379,683 976 380,659Movement in the year:Acquisitions at cost 232,013 – 232,013Disposals at cost (223,711) – (223,711)Movements in investment holding gains 25,394 (2) 25,392Valuation at 30 June 2016 413,379 974 414,353Cost at 30 June 2016 376,283 – 376,283Investment holding gains 37,096 974 38,070Valuation at 30 June 2016 413,379 974 414,353
Included in the total investments are unquoted investments shown at the Directors’ fair valuation of £17,983,000 (2015: £14,220,000).
c) Total capital gains from investments2017
£’0002016
£’000
Realised gains based on historical cost 71,135 22,425Less revaluation gains recognised in previous years (44,840) (16,179)Gains on investments sold in year on carrying value at the previous balance sheet date 26,295 6,246Revaluation of investments held at 30 June 172,906 41,573Exchange losses (1,528) (6,236)Total 197,673 41,583
47
TR European Growth Trust PLC Annual Report 2017

Notes to the Financial Statements (continued)
11 Subsidiaries and related undertakingsThe Company has one related undertaking, a wholly owned subsidiary, TREG Finance Limited, which is registered in England and Wales and operates in the United Kingdom as an investment dealing company. The entire issued share capital of £2 consists of two ordinary shares. Its registered office is 201 Bishopsgate, London EC2M 3AE. The investment is stated in the Company’s financial statements at the NAV, which is considered by the Directors to equate to fair value. The amount due to the subsidiary company at 30 June 2017 amounted to £972,000 (2016: £974,000). The subsidiary is consolidated and this payable has been eliminated on consolidation. The subsidiary’s loss for the year was £2,000 (2016: £2,000).
12 Substantial interestsThe Group has interests of 3% or more of any class of capital in six investee companies. At 30 June 2017 Brainlab represented 2.1% of the investments. These investments are not considered by the Directors to be significant in the context of these financial statements.
Company
Valuation £’000
% of issued share
capital
Brainlab 12,791 6.9Silmaasema 5,091 4.9Indel 4,244 3.2Heijmans 4,021 3.1SAES Getters 3,610 4.321 Centrale Partners III 181 3.0
The Company also has an interest of more than 3% in Safwood. Safwood is a Level 3 security and valued at zero in the portfolio at 30 June 2017.
13 ReceivablesConsolidated Company
2017 £’000
2016 £’000
2017 £’000
2016 £’000
Securities sold for future settlement 2,787 762 2,787 762 Withholding tax recoverable 625 554 625 554 Prepayments and accrued income 299 126 299 126
3,711 1,442 3,711 1,442
14 PayablesConsolidated Company
2017 £’000
2016 £’000
2017 £’000
2016 £’000
Securities purchased for future settlement 1,376 1,524 1,376 1,524 Amounts due to subsidiary undertaking – – 972 974Accruals and deferred income 4,984 2,162 4,981 2,159
6,360 3,686 7,329 4,657
48
TR European Growth Trust PLC Annual Report 2017

Notes to the Financial Statements (continued)
15 Risk management policies and procedures As an investment trust the Company invests in equities and other investments for the long term so as to secure its Investment Objective as stated in the Strategic Report. In pursuing its Investment Objective, the Group is exposed to a variety of financial risks that could result in either a reduction in the Group’s net assets or a reduction in the profits available for distribution by way of dividends.
These financial risks: market risk (comprising market price risk, currency risk and interest rate risk), liquidity risk and credit risk, and the Directors’ approach to the management of these risks, are set out below. The Board and Janus Henderson co-ordinate the Group’s risk management and there are various risk management systems in place as detailed below.
• Straight-through processing via a deal order and management system (“OMS”) is utilised for listed securities with connectivity to third-party affirmation and trade repository services.
• Portfolio modelling and investment management functions (including order-raising, dealing and trade execution) are performed using one of, or a combination of, the following third-party software applications: Charles River Development OMS and/or Imagine.
• Fund pricing and accounting services are outsourced to a third-party administrator (currently BNP Paribas Securities Services) which utilises HiPortfolio software.
• The IT tools to which the Janus Henderson risk, compliance and operations teams have access for the independent monitoring and risk measurement purposes include:
– Charles River Compliance module for investment restrictions monitoring; – OneSumX (formerly ArcLogics); – RiskMetrics, UBS Delta, Style Research, FinAnalytica and Barra Aegis for market risk measurement; – Bloomberg for market data and price-checking; and – HiPortfolio for portfolio holdings and valuations.
The Board determines the objectives, policies and processes for managing risks, and these are set out below under the relevant risk category. The policies for management of risk have not changed from the previous accounting period.
15.1 Market risk The fair value of a financial instrument held by the Group may fluctuate due to changes in market prices. Market risk comprises
market price risk (see note 15.1.1), currency risk (see note 15.1.2) and interest rate risk (see note 15.1.3). Janus Henderson assesses the exposure to market risk when making each investment decision and monitors the overall level of market risk on the whole of the investment portfolio on an ongoing basis.
15.1.1 Market price risk Market price risks (i.e. changes in market prices other than those arising from interest rate risk or currency risk) may affect the fair
value of the listed and unquoted investments.
Management of the risk The Board manages the risks inherent in the investment portfolio by ensuring full and timely reporting of relevant information from
Janus Henderson. Investment performance is reviewed at each Board meeting. The Board monitors Janus Henderson’s compliance with the Group’s objectives and is directly responsible for investment strategy and asset allocation, including between countries and economies.
The Group’s exposure to changes in market prices on equity investments was £621,237,000 (2016: £413,379,000).
Concentration of exposure to market price risk A geographical analysis of the Group’s investment portfolio is shown on page 6. There is a concentration of exposure to Germany,
Italy, France, Switzerland, and Finland though it is recognised that an investment’s country of domicile or of listing does not necessarily equate to its exposure to the economic conditions in that country.
Market price risk sensitivity The sensitivity of (a) the return after taxation for the year and (b) the Group’s net assets to an increase or decrease of 20% in the fair
values of the Company’s investments at each balance sheet date is given on page 50. This level of change is considered to be reasonably possible, based on observation of current market conditions.
49
TR European Growth Trust PLC Annual Report 2017

Notes to the Financial Statements (continued)
15 Risk management policies and procedures (continued) 15.1.1 Market price risk (continued)
The impact of a 20% increase in the value of the investments on the revenue return as at 30 June 2017 is a decrease of £149,000 (2016: £99,000) and on the capital return is an increase of £123,651,000 (2016: £82,279,000). Accordingly, the total impact on shareholders’ funds is an increase of £123,502,000 (2016: £82,180,000).
The impact of a 20% decrease in the value of the investments on the revenue return as at 30 June 2017 is an increase of £149,000 (2016: £99,000) and on the capital return is a decrease of £123,651,000 (2016: £82,279,000). Accordingly, the total impact on shareholders’ funds is a decrease of £123,502,000 (2016: £82,180,000).
15.1.2 Currency risk A proportion of the Group’s assets, liabilities, income and expenses are denominated in currencies other than Sterling (the Group’s
functional currency and presentational currency). As a result, movements in exchange rates may affect the sterling value of those items.
Management of the risk Janus Henderson monitors the Group’s exposure to foreign currencies on a daily basis and reports to the Board at each Board
meeting. Janus Henderson measures the risk to the Group of the foreign currency exposure by considering the effect on the Group’s NAV and total return of a movement in the exchange rate to which the Group’s assets, liabilities, income and expenses are exposed.
Foreign currency borrowing and financial instruments may be used to limit the Group’s exposure to future changes in exchange rates which might otherwise adversely affect the value of the portfolio of investments. Borrowings are limited to 30% of NAV.
Investment income denominated in foreign currencies is converted into sterling on receipt. The Group does not use financial instruments to mitigate the currency exposure in the period between the time that income is included in the financial statements and its receipt.
Foreign currency exposure The fair values of the Group’s monetary items that have foreign currency exposure at the year end are shown below. Where the
Group’s equity investments (which are not monetary items) are denominated in a foreign currency, they have been included separately in the analysis so as to show the overall level of exposure.
2017Euro
£’000
US dollar £’000
Swiss franc
£’000Other £’000
Receivables (securities sold for future settlement, dividends and other income receivable) 3,279 – 70 305Payables (securities purchased for future settlement, accruals and other payables) (854) – (653) –Bank overdrafts (49,186) – – –Total foreign currency exposure on net monetary items (46,761) – (583) 305Investments 465,655 7,364 53,343 94,875Total net foreign currency exposure 418,894 7,364 52,760 95,180
2016Euro
£’000
US dollar £’000
Swiss franc
£’000Other £’000
Receivables (securities sold for future settlement, dividends and other income receivable) 1,351 – 21 59Payables (securities purchased for future settlement, accruals and other payables) (1,102) – (381) (99)Bank overdrafts (33,525) – – –Total foreign currency exposure on net monetary items (33,276) – (360) (40)Investments 306,441 10,746 40,441 55,751Total net foreign currency exposure 273,165 10,746 40,081 55,711
The above amounts are not representative of the exposure to risk during each year, as levels of monetary foreign currency exposure change significantly throughout the year.
50
TR European Growth Trust PLC Annual Report 2017

Notes to the Financial Statements (continued)
Foreign currency sensitivity The following tables illustrate the sensitivity of the total profit after tax for the year and the net assets in regard to movements in the
Company’s foreign currency financial assets and financial liabilities caused by changes in the exchange rates for the Euro/Sterling, US dollar/Sterling, Swiss Franc/Sterling and other/Sterling.
It assumes the following changes in exchange rates:
Euro/Sterling +/- 10% (2016: 10%). US dollar/Sterling +/- 10% (2016: 10%). Swiss Franc/Sterling +/- 10% (2016: 10%). Other/Sterling +/- 10% (2016: 10%).
These percentages are deemed reasonable based on the average market volatility in exchange rates in the previous 12 months. The sensitivity analysis is based on the Group’s foreign currency financial assets and financial liabilities held at each balance sheet date.
The impact on the total profit after tax and the year end net assets of a depreciation in the year end exchange rate for Sterling against the currencies shown would have been as follows:
2017 2016
Euro £’000
US dollar £’000
Swiss franc
£’000Other £’000
Euro £’000
US dollar £’000
Swiss franc
£’000Other £’000
Profit after taxRevenue return 4,060 17 203 1,075 534 13 76 96Capital return 51,471 814 5,898 10,486 33,883 1,188 4,471 5,899Change to profit after tax for the year 55,531 831 6,101 11,561 34,417 1,201 4,547 5,995Impact on net assets 55,531 831 6,101 11,561 34,417 1,201 4,547 5,995
The impact on the total profit after tax and the year end net assets of an appreciation in the year end exchange rate for sterling against the currencies shown would have been as follows:
2017 2016
Euro £’000
US dollar £’000
Swiss franc
£’000Other £’000
Euro £’000
US dollar £’000
Swiss franc
£’000Other £’000
Profit after taxRevenue return (4,512) (19) (226) (697) (738) (14) (84) (104)Capital return (42,107) (666) (4,825) (8,580) (27,721) (972) (3,658) (5,043)Change to profit after tax for the year (46,619) (685) (5,051) (9,277) (28,459) (986) (3,742) (5,147)Impact on net assets (46,619) (685) (5,051) (9,277) (28,459) (986) (3,742) (5,147)
In the opinion of the Directors, the above sensitivity analyses are not representative of the year as a whole since the level of exposure changes frequently as part of the currency risk management process used to meet the Group’s objective.
15 Risk management policies and procedures (continued) 15.1.2 Currency risk (continued)
51
TR European Growth Trust PLC Annual Report 2017

Notes to the Financial Statements (continued)
15 Risk management policies and procedures (continued) 15.1.3 Interest rate risk
Interest rate movements may affect the level of interest receivable from cash and cash equivalents and the interest payable on the Group’s short term borrowings. Interest rate changes may also have an impact on the market value of the Company’s equity investments. In particular, the effect of interest rate changes on the earnings of companies held within the portfolio may have a significant impact on the valuations of those companies.
Management of the risk The Group finances part of its activities through borrowings at levels approved and monitored by the Board. Derivative contracts are
not used to hedge against the exposure to interest rate risk.
Interest rate exposure The exposure of financial assets and liabilities to floating interest rate risk can be found on the Consolidated and Parent Company
Balance Sheets under the headings “Cash and cash equivalents” and “Bank overdrafts”. These amounts are not necessarily representative of the exposure to interest rates during the year as the level of exposure changes as investments are made, borrowings are drawn down and repaid. The Group does not have any fixed interest rate exposure.
Interest received on cash balances or paid on the bank overdraft is at a margin over the applicable base rate (2016: same).
Interest rate sensitivity The impact on the total profit after tax and the year end net assets of an increase or decrease of 100 basis points (2016: 100 basis
points) in interest rates would have been as follows:
Consolidated Statement of Comprehensive IncomeIncrease in rates
2017 £’000
Decrease in rates
2017 £’000
Increase in rates
2016 £’000
Decrease in rates
2016 £’000
Profit after taxRevenue return (98) 98 (66) 66Capital return (393) 393 (268) 268Change to net profit and net assets (491) 491 (334) 334
This level of change is considered to be reasonable based on current market conditions.
In the opinion of the Directors, these sensitivity analyses are not representative of the year as a whole since exposure changes as investments are made and borrowings are drawn down or repaid throughout the year.
15.2 Liquidity risk This is the risk that the Group will encounter difficulty in meeting obligations associated with financial liabilities.
Management of the risk Liquidity risk is not significant as the majority of the Group’s assets are investments in listed securities that are readily realisable.
During the year the Group had a secured multi-currency overdraft facility equal to the lesser of £80,000,000 (2016: £50,000,000) and 25% (2016: same) of custody assets with HSBC Bank plc, the Company’s Depositary and Custodian.
The amount drawn down at 30 June 2017 was £49,186,000 (2016: £33,525,000) in Euros (2016: same).
The Board gives guidance to Janus Henderson as to the maximum amount of the Company’s resources that should be invested in any one company. The policy is that the Company should generally remain fully invested and that short term borrowings be used to manage short term cash requirements.
52
TR European Growth Trust PLC Annual Report 2017
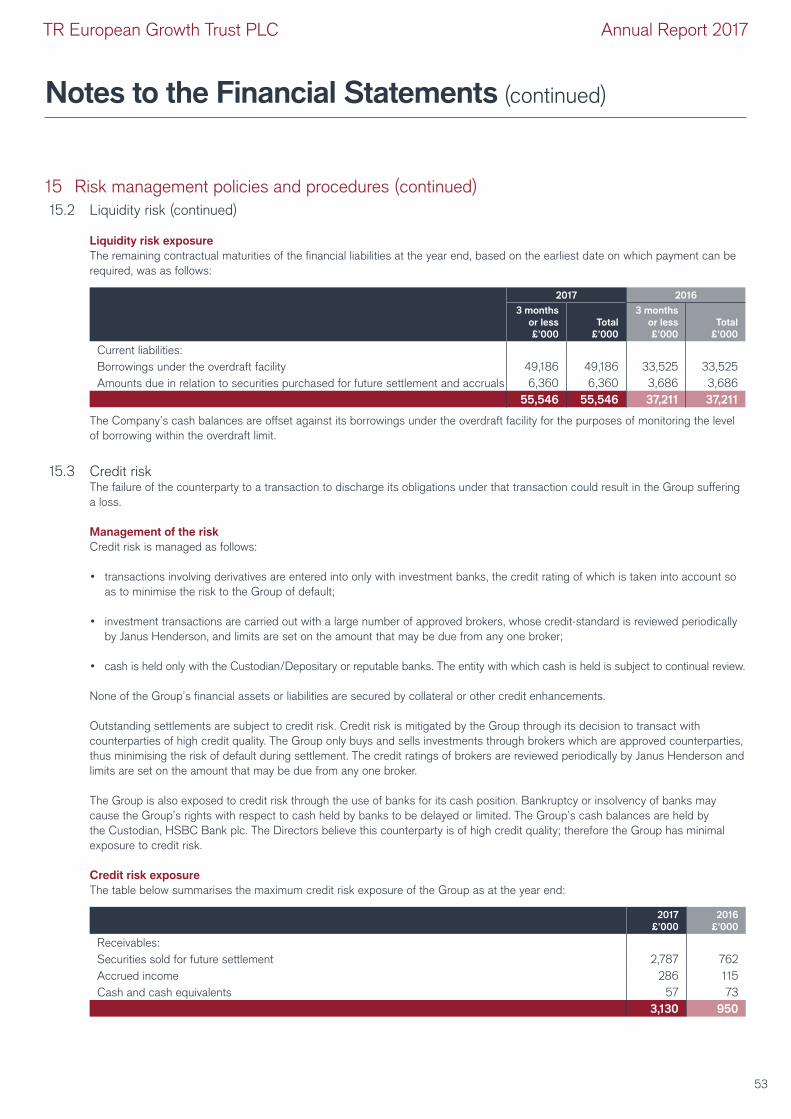
Notes to the Financial Statements (continued)
15 Risk management policies and procedures (continued) 15.2 Liquidity risk (continued)
Liquidity risk exposure The remaining contractual maturities of the financial liabilities at the year end, based on the earliest date on which payment can be
required, was as follows:
2017 2016
3 months or less £’000
Total £’000
3 months or less £’000
Total £’000
Current liabilities:Borrowings under the overdraft facility 49,186 49,186 33,525 33,525Amounts due in relation to securities purchased for future settlement and accruals 6,360 6,360 3,686 3,686
55,546 55,546 37,211 37,211
The Company’s cash balances are offset against its borrowings under the overdraft facility for the purposes of monitoring the level of borrowing within the overdraft limit.
15.3 Credit risk The failure of the counterparty to a transaction to discharge its obligations under that transaction could result in the Group suffering
a loss.
Management of the risk Credit risk is managed as follows:
• transactions involving derivatives are entered into only with investment banks, the credit rating of which is taken into account so as to minimise the risk to the Group of default;
• investment transactions are carried out with a large number of approved brokers, whose credit-standard is reviewed periodically by Janus Henderson, and limits are set on the amount that may be due from any one broker;
• cash is held only with the Custodian/Depositary or reputable banks. The entity with which cash is held is subject to continual review.
None of the Group’s financial assets or liabilities are secured by collateral or other credit enhancements.
Outstanding settlements are subject to credit risk. Credit risk is mitigated by the Group through its decision to transact with counterparties of high credit quality. The Group only buys and sells investments through brokers which are approved counterparties, thus minimising the risk of default during settlement. The credit ratings of brokers are reviewed periodically by Janus Henderson and limits are set on the amount that may be due from any one broker.
The Group is also exposed to credit risk through the use of banks for its cash position. Bankruptcy or insolvency of banks may cause the Group’s rights with respect to cash held by banks to be delayed or limited. The Group’s cash balances are held by the Custodian, HSBC Bank plc. The Directors believe this counterparty is of high credit quality; therefore the Group has minimal exposure to credit risk.
Credit risk exposure The table below summarises the maximum credit risk exposure of the Group as at the year end:
2017 £’000
2016 £’000
Receivables:Securities sold for future settlement 2,787 762Accrued income 286 115Cash and cash equivalents 57 73
3,130 950
53
TR European Growth Trust PLC Annual Report 2017

Notes to the Financial Statements (continued)
15 Risk management policies and procedures (continued) 15.4 Fair values of financial assets and financial liabilities
Financial assets and financial liabilities are either carried in the balance sheet at their fair value (investments) or their carrying amount is a reasonable approximation of fair value due to their short term to maturity (amounts due from securities sold for future settlement, dividends and interest receivable, amounts related to securities purchased for future settlement, accruals, cash and cash equivalents and bank overdrafts).
15.5 Fair value hierarchy disclosures The table below sets out the fair value measurements using the IFRS 13 fair value hierarchy.
Categorisation within the hierarchy has been determined on the basis of the lowest level of input that is significant to the fair value measurement of the relevant asset as follows:
Level 1 – valued using quoted prices in active markets for identical assets.
Level 2 – valued by reference to valuation techniques using observable inputs other than quoted prices included within Level 1.
Level 3 – valued by reference to valuation techniques using inputs that are not based on observable market data.
The valuation techniques used by the Company are explained in the accounting policies note on page 40.
Fair value hierarchy
Group 2017
£’000
Company 2017
£’000
Equity InvestmentsLevel 1 608,098 608,098Level 2 – –Level 3 13,139 14,111Total 621,237 622,209
Level 3 represents the Group’s and Company’s unquoted investments. There were no transfers between levels during the year (2016: nil). A reconciliation of fair value movements within Level 3 is set out below:
Level 3 investments at fair value through profit or loss
Group 2017
£’000
Company 2017
£’000
Opening balance 17,009 17,983Acquisitions – –Disposal proceeds (1,987) (1,987)Transfers into level – –
15,022 15,996Total gains included in the Consolidated Statement of Comprehensive IncomeOn assets sold 2,179 2,179On assets held at the year end (4,062) (4,064)
(1,883) (1,885)Closing balance 13,139 14,111
Fair value hierarchy
Group 2016
£’000
Company 2016
£’000
Equity InvestmentsLevel 1 396,370 396,370Level 2 – –Level 3 17,009 17,983Total 413,379 414,353
54
TR European Growth Trust PLC Annual Report 2017

Notes to the Financial Statements (continued)
15 Risk management policies and procedures (continued) 15.5 Fair value hierarchy disclosures (continued)
Level 3 investments at fair value through profit or loss
Group 2016
£’000
Company 2016
£’000
Opening balance 13,244 14,220Acquisitions – –Disposal proceeds (237) (237)Transfers into level – –
13,007 13,983Total gains included in the Consolidated Statement of Comprehensive IncomeOn assets sold (322) (322)On assets held at the year end 4,324 4,322
4,002 4,000Closing balance 17,009 17,983
The key inputs into the valuation of Brainlab, an unquoted investment within Level 3, are comparable company multiples and a discount. The value of Brainlab as at 30 June 2017 was £12,791,000 (2016: £13,134,000). If the multiples used in calculating the price used in the valuation of this unquoted investment would change by +/- 20%, the impact would be an increase or decrease in revenue after tax of £3,000 (2016: £3,000), capital return after tax of £2,549,000 (2016: £2,616,000) and total profit after tax of £2,546,000 (2016: £2,613,000). If the discount rate that has been applied to the valuation of this unquoted investment within Level 3 would change by +/- 20%, the impact would be an increase or decrease in revenue after tax of £9,000 (2016: £9,000), capital return after tax of £7,269,000 (2016: £7,472,000) and total profit after tax of £7,260,000 (2016: £7,463,000). The key inputs to the other unquoted investments (i.e the holdings in Doughty Hanson & Co. Fund III and 21 Centrale Partners III) included within Level 3 are net asset value statements provided by investee entities, which represent fair value.
The total value of unquoted investments as at 30 June 2017 was £13,139,000 (2016: £17,009,000).
15.6 Capital management policies and procedures The Group’s capital management objectives are:
• to ensure that it will be able to continue as a going concern; and
• to maximise the income and capital return to its equity shareholders through an appropriate balance of equity capital and debt.
The portfolio includes unquoted investments which total 2.1% of the total portfolio (2016: 4.1%). These unquoted investments include limited liability partnerships (where the valuations are based on accounts produced by those companies) and unquoted holdings (which are held at Directors’ valuation).
The Group’s capital at 30 June 2017 comprised its equity share capital, reserves and debt that are shown in the Consolidated and Parent Company Balance Sheets at a total of £618,645,000 (2016: £411,208,000).
The Board, with assistance of the Manager, monitors and reviews the broad structure of the Group’s capital on an ongoing basis. This review includes:
• the need to buy back equity shares for cancellation, which takes account of the difference between the NAV per share and the share price (i.e. the level of share price discount or premium);
• the need for new issues of equity shares;
• the extent to which revenue in excess of that which is required to be distributed should be retained.
The Company’s policies and processes for managing capital are unchanged from the preceding accounting period.
The Company is subject to the following externally imposed capital requirements:
• as a public company, the Company has a minimum share capital of £50,000;
• in order to be able to pay dividends out of profits available for distribution by way of dividends, the Company has to be able to meet one of the two capital restriction tests imposed on investment companies by law.
These requirements are unchanged since last year, and the Company has complied with them.
55
TR European Growth Trust PLC Annual Report 2017

Notes to the Financial Statements (continued)
16 Called up share capital (Group & Company)2017 2016
number of shares £’000
number of shares £’000
Allotted, issued and fully paidOrdinary shares of 12.5p 49,713,397 6,214 49,975,897 6,247
During the year 262,500 ordinary shares (2016: no ordinary shares) were bought back for cancellation at a cost of £2,047,000 (2016: £nil). In the current financial year ending 30 June 2018, the Company has not repurchased any shares.
17 Share premium accountGroup and Company
£’000
At 1 July 2016 and at 30 June 2017 115,451
18 Capital redemption reserve and other capital reservesa) Consolidated
2017
Capital redemption reserve
£’000
Capital reserve arising on revaluation of investments
held £’000
Capital reserve arising on investments sold
£’000
Other capital
reserves £’000
At 1 July 2016 13,931 37,099 181,019 218,118Transfer on disposal of investments (see note 10 c) – (44,840) 44,840 –Capital gains for the year – 172,906 26,295 199,201Expenses, finance costs and taxation charged to capital – – (6,642) (6,642)Buy back of Ordinary shares for cancellation 33 – (2,047) (2,047)Net loss on foreign exchange – – (1,528) (1,528)At 30 June 2017 13,964 165,165 241,937 407,102
The capital reserve arising on revaluation of investments held at 30 June 2017 includes a loss of £9,593,000 in respect of the revaluation of unquoted investments (2016: loss of £18,486,000).
b) Company
2017
Capital redemption reserve
£’000
Capital reserve arising on revaluation of investments
held £’000
Capital reserve arising on investments sold
£’000
Other capital
reserves £’000
At 1 July 2016 13,931 38,073 181,088 219,161Transfer on disposal of investments (see note 10 c) – (44,840) 44,840 –Capital gains for the year – 172,904 26,295 199,199Expenses, finance costs and taxation charged to capital – – (6,642) (6,642)Buy back of Ordinary shares for cancellation 33 – (2,047) (2,047)Net loss on foreign exchange – – (1,528) (1,528)At 30 June 2017 13,964 166,137 242,006 408,143
The capital reserve arising on revaluation of investments held at 30 June 2017 includes a loss of £8,619,000 in respect of the revaluation of unquoted investments (2016: loss of £17,512,000).
56
TR European Growth Trust PLC Annual Report 2017

Notes to the Financial Statements (continued)
18 Capital redemption reserve and other capital reserves (continued)a) Consolidated
2016
Capital redemption reserve
£’000
Capital reserve arising on revaluation of investments
held £’000
Capital reserve arising on investments sold
£’000
Other capital
reserves £’000
At 1 July 2015 13,931 11,705 168,370 180,075Transfer on disposal of investments – (16,179) 16,179 –Capital gains for the year – 41,573 6,246 47,819Expenses, finance costs and taxation charged to capital – – (3,540) (3,540)Net loss on foreign exchange – – (6,236) (6,236)At 30 June 2016 13,931 37,099 181,019 218,118
The capital reserve arising on revaluation of investments held at 30 June 2016 includes a loss of £18,486,000 in respect of the revaluation of unquoted investments (2015: loss of £22,810,000).
b) Company
2016
Capital redemption reserve
£’000
Capital reserve arising on revaluation of investments
held £’000
Capital reserve arising on investments sold
£’000
Other capital
reserves £’000
At 1 July 2015 13,931 12,681 168,439 181,120Transfer on disposal of investments – (16,179) 16,179 –Capital gains for the year – 41,571 6,246 47,817Expenses, finance costs and taxation charged to capital – – (3,540) (3,540)Net loss on foreign exchange – – (6,236) (6,236)At 30 June 2016 13,931 38,073 181,088 219,161
The capital reserve arising on revaluation of investments held at 30 June 2016 includes a loss of £17,512,000 in respect of the revaluation of unquoted investments (2015: loss of £21,834,000).
19 Retained earnings – revenue reserve Consolidated Company
2017 £’000
2016 £’000
2017 £’000
2016 £’000
At 1 July 23,936 21,941 22,893 20,896Ordinary dividends paid (5,717) (4,748) (5,717) (4,748)Revenue return for the year 8,509 6,739 8,511 6,741Refund of unclaimed dividends over 12 years old – 4 – 4At 30 June 26,728 23,936 25,687 22,893
As permitted by Section 408 of the Act, the Company has not presented its own Statement of Comprehensive Income. The return after taxation of the Company amounted to £199,540,000 (2016: £44,782,000).
57
TR European Growth Trust PLC Annual Report 2017

Notes to the Financial Statements (continued)
20 Net asset value per ordinary shareThe NAV per ordinary share is based on the net assets attributable to the ordinary shares of £569,459,000 (2016: £377,683,000) and on the 49,713,397 ordinary shares in issue at 30 June 2017 (2016: 49,975,897). The Company has no securities in issue that could dilute the NAV per ordinary share (2016: same). The NAV per ordinary share at 30 June 2017 was 1,145.48p (2016: 755.73p).
The movements during the year in assets attributable to the ordinary shares were as follows:
2017 £’000
2016 £’000
Net assets attributable to Ordinary shares at 1 July 2016 377,683 337,645Profit for the year 199,540 44,782Dividends paid in the year (5,717) (4,748)Buy back of Ordinary shares for cancellation (2,047) –Refund of unclaimed dividends over 12 years old – 4Net assets at 30 June 569,459 377,683
21 Capital commitments and contingent liabilitiesCapital commitments At 30 June 2017 there were capital commitments of £nil (2016: £402,000) in respect of the Company’s holdings in limited partnerships.
Contingent liabilities At 30 June 2017 there were no contingent liabilities in respect of sub underwriting participations (2016: same).
22 Transactions with the Manager and related parties Under the terms of an agreement effective from 22 July 2014, the Company has appointed the wholly owned subsidiaries of Janus Henderson Group plc (“Janus Henderson”) to provide investment management, accounting, administration and secretarial services. Janus Henderson has contracted with BNP Paribas Securities Services to provide accounting and administration services.
Details of the arrangements are given on page 4 in the Strategic Report. The total of the management fees paid or payable to Janus Henderson under the management agreement in respect of the year ended 30 June 2017 was £6,783,000 (2016: £3,526,000), of which £4,662,000 was outstanding at 30 June 2017 (2016: £1,958,000).
In addition to the above services, Janus Henderson has provided the Company with sales and marketing services. The total fees payable for these services for the year ended 30 June 2017 amounted to £20,000 (excluding VAT) (2016: £20,000), of which £5,000 (excluding VAT) was outstanding at 30 June 2017 (2016: £5,000).
The compensation payable to key management personnel in respect of short term employment benefits was £131,000. This disclosure relates wholly to the fees of £131,000 payable to the Directors in respect of the year (2016: £129,000); the Directors are all non-executive and receive no other compensation. The Directors’ Remuneration Report on pages 20 and 22 provides more detail. The Company has no employees.
The Company has paid administrative expense on behalf of its subsidiary, TREG Finance Limited, totalling £2,000 (2016: £2,000).
58
TR European Growth Trust PLC Annual Report 2017

General Shareholder Information
AIFMD DisclosuresIn accordance with the Alternative Investment Fund Managers Directive (‘AIFMD’), information in relation to the Company’s leverage and remuneration of Janus Henderson, as the Company’s Alternative Investment Fund Manager (‘AIFM’) are required to be made available to investors. These disclosures, including those on the AIFM’s remuneration policy, are contained in a Key Investor Information Document (‘KIID’) which can be found on the Company’s website www.treuropeangrowthtrust.com.
BACSDividends can be paid by means of BACS (Bankers’ Automated Clearing Services); mandate forms for this purpose are available from the registrar. Alternatively, shareholders can write to the registrar (the address is given on page 12) to give their instructions; these must include the bank account number, the bank account title and the sort code of the bank to which payments are to be made.
Common Reporting StandardWith effect from 1 January 2016 new tax legislation under The Organisation for Economic Co-operation and Development Common Reporting Standard for Automatic Exchange of Financial Account Information is being introduced. The legislation requires the Company to provide personal information to HMRC on certain investors who purchase shares in investment trusts. This information is provided annually to the local tax authority of the tax residencies of a number of non-UK based certificated shareholders and corporate entities.
Equality Act 2010Copies of this report and other documents issued by the Company are available from the Company Secretary. If needed, copies can be made available in a variety of formats, including Braille or larger type as appropriate. You can contact the registrar, Equiniti Limited, which has installed textphones to allow speech and hearing impaired people who have their own textphone to contact them directly, without the need for an intermediate operator by dialling 0871 384 2455. Specially trained operators are available during normal business hours to answer queries via this service. Alternatively, if you prefer to go through a ‘typetalk’ operator (provided by the Royal National Institute for Deaf People) dial 18001 followed by the number you wish to dial.
FATCA The Foreign Account Tax Compliance Act (FATCA) is a United States federal law enacted in 2010 whose intent is to enforce the requirement for United States persons (including those living outside the U.S.) to file yearly reports on their non-U.S. financial accounts. As a result of HMRC’s change of interpretation on the meaning of shares and securities ‘regularly traded on an established securities market’, investment trusts now need to monitor each year the trading volume and frequency of their shares and securities to assess whether they have financial accounts. The Company will therefore need to make an annual assessment, before the FATCA return is due, to determine if the shares represent financial accounts and, where they do, will need to identify and report U.S. reportable accounts to HMRC, as required.
Non-mainstream pooled investments (NMPI) statusThe Company currently conducts its affairs so that its ordinary shares of 12.5p each can be recommended by IFAs to ordinary retail investors in accordance with the Financial Conduct Authority’s (“FCA”) rules in relation to non-mainstream investment products and intends to continue to do so for the foreseeable future. The shares are excluded from the FCA’s restrictions which apply to non-mainstream investment products because they are shares in an investment trust.
ISAThe Company intends to continue to manage its affairs in order to qualify as an eligible investment for a stocks and shares ISA.
Share price listingsThe market price of the Company’s ordinary shares is published daily in The Financial Times, which also shows figures for the estimated net asset value (“NAV”) per share and discount.
Performance details/share price informationDetails of the Company’s share price and NAV per share can be found on the website www.treuropeangrowthtrust.com. The Company’s NAV is published daily.
Shareholder detailsShareholders who hold their shares in certificated form can check their shareholding with the registrar, Equiniti Limited, via www.shareview.co.uk. Please note that to gain access to your details on the Equiniti site you will need the holder reference number shown on your share certificate.
Warning to shareholders Many companies are aware that their shareholders have received unsolicited phone calls or correspondence concerning investment matters. These are typically from overseas based ‘brokers’ who target UK shareholders offering to sell them what often turn out to be worthless or high risk shares in US or UK investments. They can be very persistent and extremely persuasive. Shareholders are therefore advised to be very wary of any unsolicited advice, offers to buy shares at a discount or offers of free company reports. Please note that it is very unlikely that either the Company or the Company’s registrar, Equiniti Limited, would make unsolicited telephone calls to shareholders and that any such calls would relate only to official documentation already circulated to shareholders and never in respect of investment ‘advice’. If you are in any doubt about the veracity of an unsolicited phone call, please call the Corporate Secretary at the number provided on page 12.
59
TR European Growth Trust PLC Annual Report 2017

Investment Portfolio as at 30 June 2017 (unaudited)
Ranking 2017
Ranking 2016 Company Principal activities Geographical area
Valuation 2017 £’000
Percentage of portfolio
1 2 Van Lanschot Banks Netherlands 13,986 2.3
2 1 Brainlab1 Technology hardware & equipment Germany 12,791 2.1
3 33 Finecobank Banks Italy 11,141 1.8
4 27 Lenzing Chemicals Austria 8,808 1.4
5 34 Anima Financial services Italy 7,843 1.3
6 84 Kaufman Household goods & home
construction
France 7,706
1.2
7 – Meyer Burger Industrial Engineering Switzerland 7,314 1.2
8 – Wallenius Wilhelmsen Logistics Industrial Transportation Norway 7,213 1.2
9 4 Criteo Software & computer services France 7,197 1.2
10 3 OC Oerlikon Industrial engineering Switzerland 7,150 1.1
10 largest 91,149 14.8%
11 13 Nexans Electronic & electrical equipment France 7,137 1.1
12 6 Verkkokauppa Online retail Finland 6,897 1.1
13 5 EVS Broadcast Equipment Electronic & electrical equipment Belgium 6,862 1.1
14 – Lisi Aerospace & defense France 6,787 1.1
15 16 DFDS Industrial transportation Denmark 6,581 1.1
16 12 Aurelius Financial services Germany 6,412 1.0
17 75 S&T General retailers Germany 6,237 1.0
18 – Alma Media Media Finland 6,101 1.0
19 7 Aareal Bank Financial services Germany 6,046 1.0
20 23 Europcar Travel & leisure France 5,980 1.0
20 largest 156,189 25.3%
21 – Banca Farmafactoring Banks Italy 5,926 0.9
22 9 ASM International Technology hardware & equipment Netherlands 5,921 0.9
23 39 Credito Emiliano Banks Italy 5,913 0.9
24 31 Borregaard Chemicals Norway 5,867 0.9
25 15 Origin Enterprises Food producers Switzerland 5,680 0.9
26 14 Puma Personal goods Germany 5,642 0.9
27 – Ion Beam Applications Health care equipment & services Belgium 5,506 0.9
28 21 NKT Electronic & electrical equipment Denmark 5,504 0.9
29 – SGL Carbon Industrial engineering Germany 5,500 0.9
30 139 Lehto Construction & materials Finland 5,491 0.9
30 largest 213,139 34.3%
31 41 OVS Personal goods Italy 5,484 0.9
32 58 Gaztransport Et Techniga Support services France 5,473 0.9
33 17 CFE Construction & materials Belgium 5,350 0.9
34 – NOS Media Portugal 5,335 0.9
35 81 Nordic Waterproofing Construction & materials Sweden 5,298 0.8
36 90 Arnoldo Mondadori Media Italy 5,227 0.8
37 124 Flsmidth & Co Construction & materials Denmark 5,164 0.8
38 38 Elmos Semiconductor Technology hardware & equipment Germany 5,127 0.8
39 – Silmaasema Health care equipment & services Finland 5,091 0.8
40 54 Dometic Leisure goods Sweden 5,064 0.8
40 largest 265,752 42.7%
41 42 SRP General retailers France 5,049 0.8
42 51 TKH Electronic & electrical equipment Netherlands 5,029 0.8
43 – Alimak Industrial engineering Sweden 4,958 0.8
44 132 Evotec Pharmaceuticals & biotechnology Germany 4,898 0.8
45 115 Datalogic Electronic & electrical equipment Italy 4,889 0.8
46 52 Dalata Hotel Travel & leisure Ireland 4,860 0.8
47 43 Carl Zeiss Meditec Health care equipment & services Germany 4,853 0.8
48 – Ahlsell Construction & materials Sweden 4,831 0.8
49 – Intertrust Financial services Netherlands 4,809 0.8
50 65 Fugro Oil equipment services & distribution Netherlands 4,800 0.8
50 largest 314,728 50.7%
1 Unquoted investment
60
TR European Growth Trust PLC Annual Report 2017

Investment Portfolio as at 30 June 2017 (unaudited) (continued)
Ranking 2017
Ranking 2016 Company Principal activities Geographical area
Valuation 2017 £’000
Percentage of portfolio
51 8 Comet Electronic & electrical equipment Switzerland 4,780 0.8
52 – Viscofan Food producers Spain 4,779 0.8
53 56 Cargotec Industrial engineering Finland 4,762 0.8
54 107 Jungheinrich Machinery Germany 4,754 0.8
55 26 AMG Advanced Metallurgical Industrial engineering Netherlands 4,748 0.8
56 101 Kendrion Industrial engineering Netherlands 4,705 0.8
57 – Vaisala Electronic & electrical equipment Finland 4,662 0.7
58 79 Groupe Guillin General industrials France 4,662 0.7
59 – ALSO Technology hardware & equipment Switzerland 4,575 0.7
60 – Vapiano Travel & leisure Germany 4,473 0.7
60 largest 361,628 58.3%
61 20 Sixt Leasing General retailers Germany 4,459 0.7
62 – Basware Software & computer services Finland 4,439 0.7
63 – Asiakastieto Financial services Finland 4,391 0.7
64 – Unieuro General retailers Italy 4,383 0.7
65 106 Mersen Electronic & electrical equipment France 4,375 0.7
66 – Corticeira Amorim General industrials Portugal 4,288 0.7
67 – Ströer Media Germany 4,281 0.7
68 45 Tessenderlo Chemie Chemicals Belgium 4,274 0.7
69 – Cairo Communications Media Italy 4,264 0.7
70 – Indel Electronic & electrical equipment Italy 4,244 0.7
70 largest 405,026 65.3%
71 18 Jyske Bank Banks Denmark 4,185 0.7
72 – Fnac Darty General retailers France 4,148 0.7
73 50 Lindab Construction & materials Sweden 4,096 0.7
74 49 Heijmans Construction & materials Netherlands 4,021 0.7
75 53 BE Semiconductor Technology hardware & equipment Netherlands 3,993 0.6
76 72 ADVA Optical Networking Technology hardware & equipment Germany 3,972 0.6
77 – Ambea Health care equipment & services Sweden 3,963 0.6
78 22 Nobia Household goods & home
construction
Sweden 3,933 0.6
79 78 Cramo Support services Finland 3,911 0.6
80 25 Tarkett Construction & materials France 3,900 0.6
80 largest 445,148 71.7%
81 – Tomra Systems Industrial engineering Norway 3,843 0.6
82 – Stratec Biomedical Health care equipment & services Germany 3,833 0.6
83 77 Cewe Shiftung General retailers Germany 3,820 0.6
84 46 Korian Health care equipment & services France 3,799 0.6
85 – Mobilezone General retailers Switzerland 3,789 0.6
86 – CTS Eventim Support services Germany 3,774 0.6
87 66 AMS Technology hardware & equipment Switzerland 3,722 0.6
88 10 Valmet Industrial machinery Finland 3,715 0.6
89 – Boozt General retailers Sweden 3,657 0.6
90 – Parques Reunidos Travel & leisure Spain 3,654 0.6
90 largest 482,754 77.7%
91 111 SAES Getters Di Risp Electronic & electrical equipment Italy 3,610 0.6
92 – XXL General retailers Norway 3,603 0.6
93 76 Yoox General retailers Italy 3,581 0.6
94 – Va Q Tec General industrials Germany 3,560 0.6
95 61 Technicolor Media France 3,540 0.6
96 44 Grupo Catalana Occidente Nonlife insurance Spain 3,483 0.6
97 29 SLM Solutions Electronic & electrical equipment Germany 3,453 0.6
98 126 Stabilus Industrial engineering Germany 3,381 0.5
99 37 Melia Hotels International Travel & leisure Spain 3,291 0.5
100 102 Süss Microtec Electronic & electrical equipment Germany 3,276 0.5
100 largest 517,532 83.4%
1 Unquoted investment
61
TR European Growth Trust PLC Annual Report 2017

Investment Portfolio as at 30 June 2017 (unaudited) (continued)
Ranking 2017
Ranking 2016 Company Principal activities Geographical area
Valuation 2017 £’000
Percentage of portfolio
101 119 Gbl Dominion Support services Spain 3,269 0.5
102 63 Europris General retailers Norway 3,262 0.5
103 121 Mytilineos Industrial metals & mining Greece 3,261 0.5
104 – Somfy Electronic & electrical equipment France 3,257 0.5
105 48 MPC Financial services Germany 3,232 0.5
106 129 Bauer Construction & materials Germany 3,207 0.5
107 86 Forbo Household durables Switzerland 3,160 0.5
108 112 Nexus Software & computer services Germany 3,149 0.5
109 141 Sanoma Media Finland 3,132 0.5
110 24 Thule Leisure goods Sweden 3,122 0.5
110 largest 549,583 88.4%
111 123 Jumbo Leisure goods Greece 3,081 0.5
112 – De’Longhi Household goods & home
construction
Italy 3,077
0.5
113 73 Haulotte Industrial engineering France 3,048 0.5
114 87 Gurit Chemicals Switzerland 3,035 0.5
115 80 Troax Industrial metals & mining Sweden 3,031 0.5
116 69 Senvion Alternative energy Germany 3,030 0.5
117 – Technopolis Real estate investment services Finland 2,972 0.5
118 – Fjord Industrial transportation Norway 2,932 0.5
119 134 Komax Industrial engineering Switzerland 2,927 0.5
120 89 SFS General industrials Switzerland 2,920 0.5
120 largest 579,636 93.4%
121 122 KSB Industrial engineering Germany 2,805 0.5
122 131 SAF Holland Automobiles & parts Germany 2,736 0.4
123 95 Conzzeta Industrial engineering Switzerland 2,670 0.4
124 110 Technogym Leisure goods Italy 2,648 0.4
125 93 Manz Industrial engineering Germany 2,613 0.4
126 127 Swissquote Financial services Switzerland 2,552 0.4
127 85 Hexagon General industrials Norway 2,483 0.4
128 118 Bossard Construction & materials Switzerland 2,413 0.4
129 108 Safilo Personal goods Italy 2,349 0.4
130 11 Inficon Industrial engineering Switzerland 2,339 0.4
130 largest 605,244 97.5%
131 – Wuestenrot & Wuerttembergische Financial services Germany 2,335 0.4
132 – Softing Software & computer services Germany 2,306 0.4
133 – Petroleum Geo-Services Oil equipment services & distribution Norway 2,283 0.4
134 135 Ferratum Financial services Finland 2,241 0.4
135 109 SNP Schneider-Neureither & Partner Software & computer services Germany 2,223 0.3
136 – Shop-Apotheke Food & drug retailers Netherlands 2,222 0.3
137 19 Cerved Information Solutions Support services Italy 2,035 0.3
138 71 21 Centrale Partners III1 Financial services France 181 0.0
139 137 Doughty Hanson & Co. Fund III1 Investment fund Other 167 0.0
Total investments 621,237 100.0%
1 Unquoted investment
62
TR European Growth Trust PLC Annual Report 2017

Strategic Report
Performance Highlights 2-3
Business Model 4 Investment Objective 4 Investment Policy 4 General 4 Management arrangements 4
Chairman’s Statement 5 Performance 5 Revenue and dividends 5 Investment Objective and Policy 5 Annual General Meeting 5 Manager 5 Outlook 5
Portfolio Information 6 Ten largest investments 6 Sector exposure 6 Geographic exposure 6 Gearing levels over the year 6
Fund Managers’ Report 7-9 Introduction 7 The Portfolio 7-8 Outlook 9
Historical Performance and Financial Information 10
Total return performance 10 Share price movement against indices since launch 10 Financial information 10
Corporate Information 11-14 Directors 11 Registered office 12 Service providers 12 Independent auditors 12 Financial calendar 12 Information sources 12 Investing 12 Nominee share code 12 Status 13 Principal risks 13 Viability statement 13 Key performance indicators 14 Borrowings 14 Future developments 14 Responsible investment, voting and the
UK Stewardship Code 14 Employees, social, community,
human rights and environmental matters 14 Diversity 14
Glossary 15-16
Corporate Report
Directors’ Report 18
Statement of Directors’ Responsibilities 19
Directors’ Remuneration Report 20-22
Corporate Governance Statement 23-26
Audit Committee Report 27-28
Independent Auditors’ Report to the Members of TR European Growth Trust PLC 29-34
Consolidated Statement of Comprehensive Income 35
Consolidated and Parent Company Statements of Changes in Equity 36
Consolidated and Parent Company Balance Sheets 37
Consolidated and Parent Company Cash Flow Statements 38
Notes to the Financial Statements 39-58
General Shareholder Information 59
Investment Portfolio 60-62
Contents
TR European Growth Trust PLC Annual Report 2017
The image on the front cover is the Adolphe Bridge, Luxembourg.

HGI9228/2017
TR E
uropean Grow
th Trust PLC
– Annual R
eport 2017 H
GI9228/2017
TR EUROPEAN GROWTH TRUST PLCAnnual Report 2017
This report is printed on cocoon silk 50% recycled, a recycled paper containing 50% recycled waste and
50% virgin fibre and manufactured at a mill certified with ISO 14001 environmental management
standard. The pulp used in this product is bleached using an Elemental Chlorine Free process (ECF).
The FSC® logo identifies products which contain wood from well managed forests certified in
accordance with the rules of the Forest Stewardship Council®.
Typeset by 2112 Communications, London. Printed by Pureprint Group Limited
TR European Growth Trust PLC Registered as an investment company in England and Wales Registration Number 2520734 Registered office: 201 Bishopsgate, London EC2M 3AE
SEDOL/ISIN number: Ordinary Shares: 0906692/GB0009066928 London Stock Exchange (TIDM) Code: TRG Global Intermediary Identification Number (GIIN): JX9KYH.99999.SL.826 Legal Entity Identifier (LEI): 213800N1B1HCQG2W4V90
Telephone: 0800 832 832 Email: [email protected]
www.treuropeangrowthtrust.com
ShareholderCommunication
Awards
2017WINNER
ShareholderCommunication
Awards
2016
ShareholderCommunication
Awards
2016


![DATED [ ] 2019 AMRYT PHARMA HOLDINGS PLC DEED POLL ... · AMRYT PHARMA HOLDINGS PLC, a public limited company incorporated in England with registered number 12107859, whose registered](https://static.fdocuments.net/doc/165x107/5f7ed2b243a7d84da72489d2/dated-2019-amryt-pharma-holdings-plc-deed-poll-amryt-pharma-holdings-plc.jpg)