

ppt 41972 2014 Toyota FJ Cruiser for Henderson and Las Vegas
Upload
waseem-khanCategory
view
5.384download
6
GROUP MEMBERS
WASEEM
AFTAB
TWINKLE
JYOTI
RIDHI
INTRODUCTION
Sakichi toyoda, the founder of the toyota
group of companies, started toyota as a
textile machine company.
Launched first car in 1947
Toyota production system formed in 1950
based on just-in-time principle
Overseas production starts in 1959
(BRAZIL).
Ranked 6th in fortune global 500 list
TOYOTA Public company traded on the NYSE and the
ADR exchange in Tokyo
Employed 400000 people in 2012
Revenue of $272,749 Million in 2012
Year end of March
Toyota seeks to create a more
prosperous society through automotive
manufacturing and to sustain profitable
growth by providing the best customer
experience and dealer support
VISION
Produce reliable vehicles &
sustainable development of society
by employing innovation & high
quality of product & services.
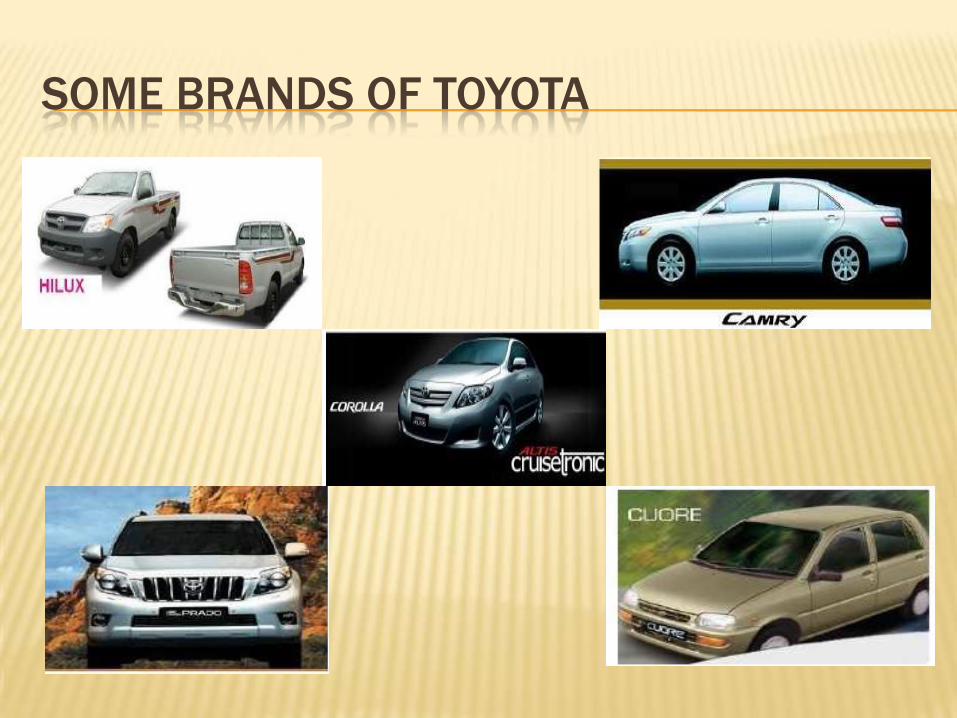
SOME BRANDS OF TOYOTA

OBJECTIVES
Waste of over production
Waste of time on in hand
Waste of transportation
Waste of stock in hand
Waste of movement
Waste of making defective product

WHERE THEY ARE TODAY
Second Largest automaker, but most profitable
51 manufacturing companies in 26 countries
- Produce a vehicle every 6 seconds
Brands: Toyota, Lexus, Scion
Business partners with Daihatsu and Hino
automotive business accounted for 90% of revenues
Other 10%: housing, marine, GAZOO,
telecommunications, ITS, Biotechnology and
Afforestation
Success attributed to Toyota Production System
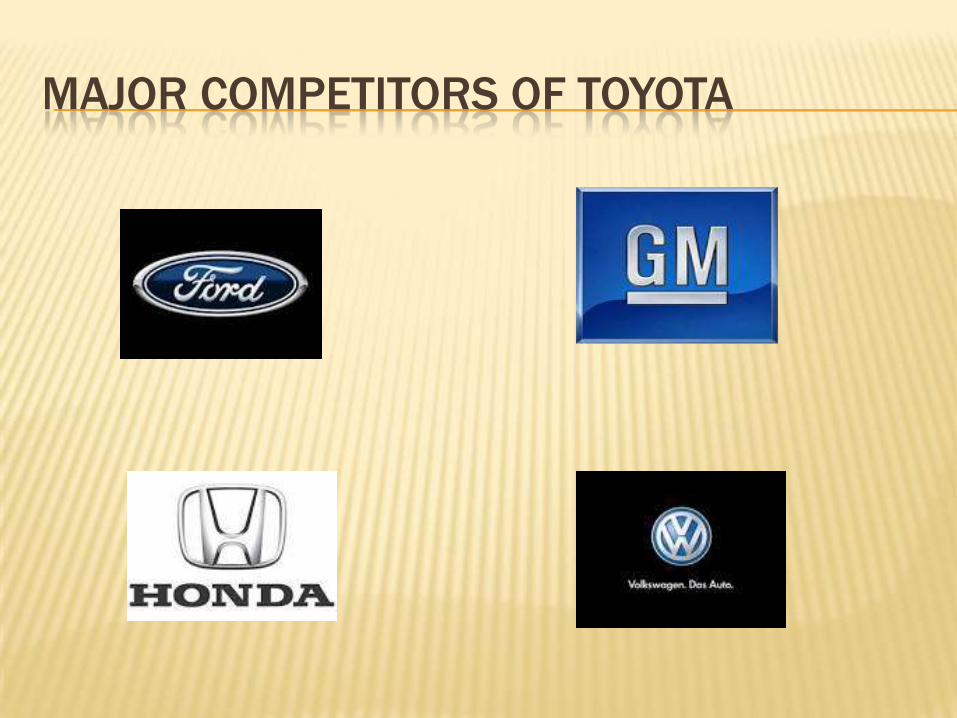
MAJOR COMPETITORS OF TOYOTA
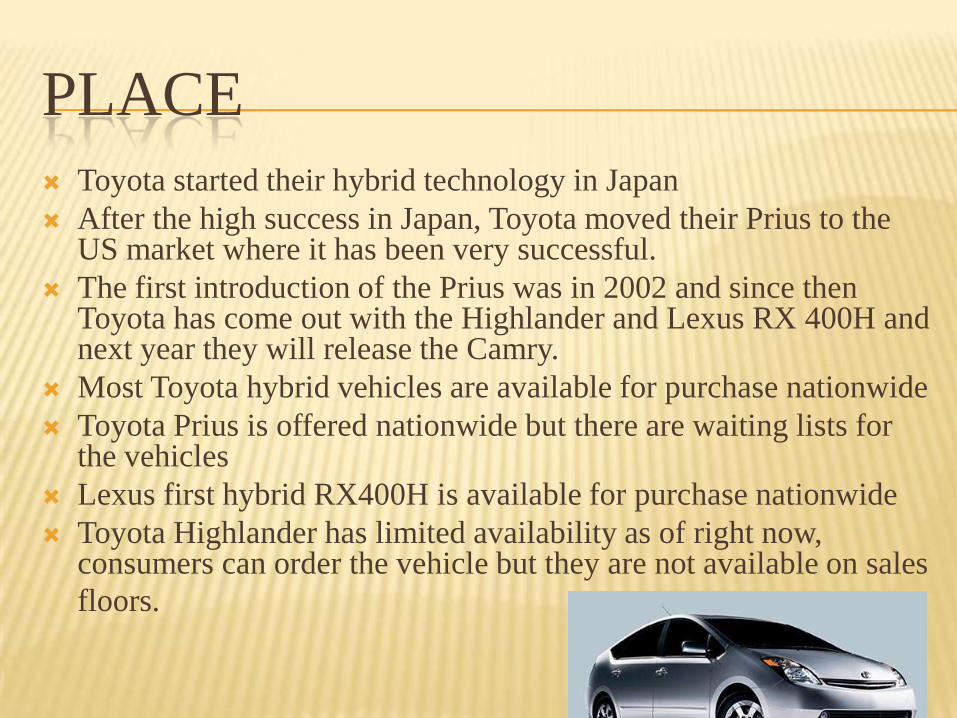
PLACE
Toyota started their hybrid technology in Japan
After the high success in Japan, Toyota moved their Prius to the US market where it has been very successful.
The first introduction of the Prius was in 2002 and since then Toyota has come out with the Highlander and Lexus RX 400H and next year they will release the Camry.
Most Toyota hybrid vehicles are available for purchase nationwide
Toyota Prius is offered nationwide but there are waiting lists for the vehicles
Lexus first hybrid RX400H is available for purchase nationwide
Toyota Highlander has limited availability as of right now, consumers can order the vehicle but they are not available on sales
floors.

PROMOTION Toyota Overall Promotion
The main promotion for Toyota hybrids is the tax deduction given to consumers who purchase hybrid vehicles
Toyota Promotions
Bluetooth technology
Option with in the Prius that if the consumer has a Bluetooth mobile phone, that allows customers with onboard navigation system and hands free phone capabilities with the vehicle
Land Speed
Aiming for the younger market by having a race car that reached the speed of 130.794 mph
PRODUCT
The Toyota Prius and Highlander are both in transition from
the introduction stage to the growth stage of the product life
cycle
Limited number of products are available through few
competitors
Other competitors are becoming attracted to the market and
will have similar offerings soon
They are focused on building brand and customer loyalty.
The Toyota Sienna and Camry are still in development but
will be ready for the introduction stage soon
They are focused on promoting these products to create
awareness
PRICE Toyota is offering high quality at a relatively low price in
order to penetrate the market
The Prius is priced the same as other five seater hybrids in its class but gets much better gas mileage
Same price as the Honda Insight but holds three more people
A hybrid Highlander SUV costs $5,000 more than the conventional Highlander
It delivers more horsepower than the conventional Highlander (30 horsepower)
It gets 10 more miles to the gallon
It greatly reduces the tail pipe emissions
SWOT ANALYSIS
STRENGTHS
Dedication to R&D
High market share
High durability
Easy availability of spare parts
Comfortable ride
High good will
Good resale value
Low fuel consumption
WEAKNESSES
Over dependency on Japan & U.S. Market..
Risk that R&D outlays will not generate new competitive advantages.
Poor organisational structure
The cars steering is a bit light and driver can not feel the road
The body of the car is too heavy.
The rims and tyres of the car are not impressive.

OPPORTUNITIES
Expanding HEV line in U.S. – gain more
market share
Demand growth in China and India
Modifying designs that are proven for other
countries
Consolidation through acquisition –
European foothold
Develop new variety and style

THREATS Supply chain costs tied to oil (materials,
production and shipping)
Foreign exchange fluctuations
Growth of competitor.
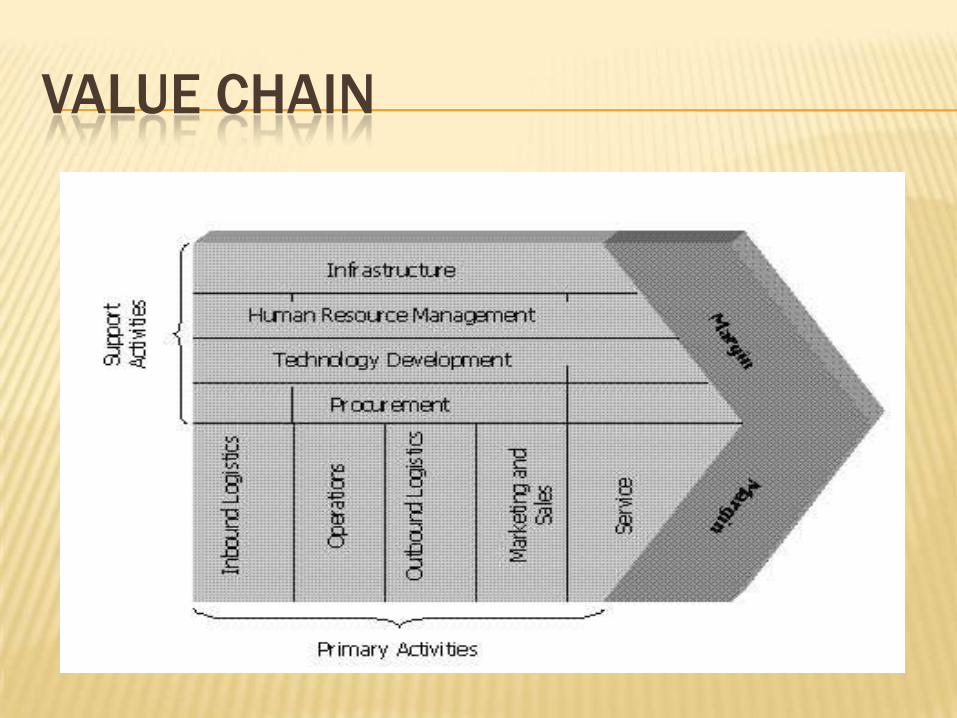
VALUE CHAIN
INBOUND LOGISTICS
Primary activities logistics toyota in
obtaining-Raw material
They do not process their own, or create
your on, they use a third party.
LIKE- leather seats, stearing, wheel, tyre to
local companies.

TOYOTA PRODUCTION SYSTEM(TPS)
The production system developed by toyota motor corporation to provide best quality, lowest cost, and shortest lead time through the eliminating of waste.
The toyota production system was established on two concepts:
JIDOKA: Automation with a human touch, means that when the problem occurs, the equipment stops immediately, preventing defective product from being produced.
JUST-IN-TIME: In which each process produces only what is needed by the next process in a continuous flow.
OUTBOUND LOGISTICS
Outbound logistics means Collecting, storing
& distribution the product to buyers.
Toyota cars directly sent to toyota dealer, its
for local.
If sending more distance or export its
delivery using container.
MARKETING & SALES
Its provide means & incentives which allow buyers to purchase the product.
Corporate Environmental Awareness: In 2003, Toyota embarked on its first pan-European corporate advertising campaign conducted by its Corporate Affairs department.
In order to better communicate its environmental principals and activities – and support the "Aim: Zero Emissions" message – Toyota created an Environmental Brochure in early 2004. The Environmental Brochure was designed and published to target the general public, presenting Toyota’s basic environmental messages with a clear focus on the environmental technologies that are beneficial to consumers.

C0NTINUED...
1-Brand Environmental
Awareness:
a) Toyota vehicles stand at the
Brussels International Airport.
b) Toyota vehicles advertisement on
the front of Toyota Motor Europe’s
head office in Brussels, Belgium.

CONTINUED,,,,Survey: Customer Satisfaction.
Greening the Supply Chain: Toyota therefore enlists the participation of those suppliers in the effort to provide environmentally friendly parts and materials to its customers. To do this, Toyota developed a set of Environmental Purchasing Guidelines, which the company encourages suppliers to follow.
Remanufactured Parts.
SMART Repairs.
Chemicals & Oils.

SERVICE
Service means it enhance or maintain the
value of the product.
PARAMETERS- Quality of service, type of
problem, service user friendly, service
advisor, service delivery.
TOYOTA PHILOSOPHY
Selling price-cost=profit
Customer decide the selling price
Profit is what remains after subtracting the cost
from it.
The main way to increase profit is to reduce
cost.

SUPPORTIVE ACTIVITIES

FIRM INFRASTRUCTURE
Modern and sophisticated
Robotic system used with human as the
operator

HUMAN RESOURCE MANAGEMENT
Toyota has approximately 400000 employees
world wide
In placement of an employee, the co. hold
the test continued with the training according
to its disciplines and expertise
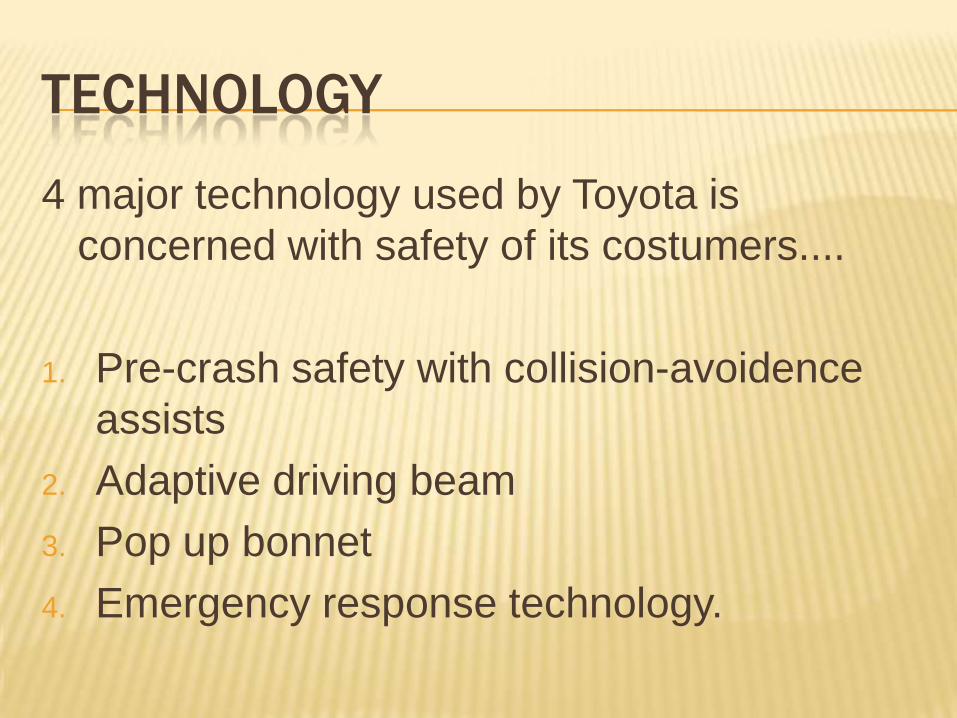
TECHNOLOGY
4 major technology used by Toyota is
concerned with safety of its costumers....
1. Pre-crash safety with collision-avoidence
assists
2. Adaptive driving beam
3. Pop up bonnet
4. Emergency response technology.

PROCUREMENT
1. Acquire our supplier to provide quality item
at low price and in timely manner.
2. We co-operate with them to promote
environmental preservation and meet the
other demand of our society.
3. Long term view toward our relationship with
supplier based on fair business practices..

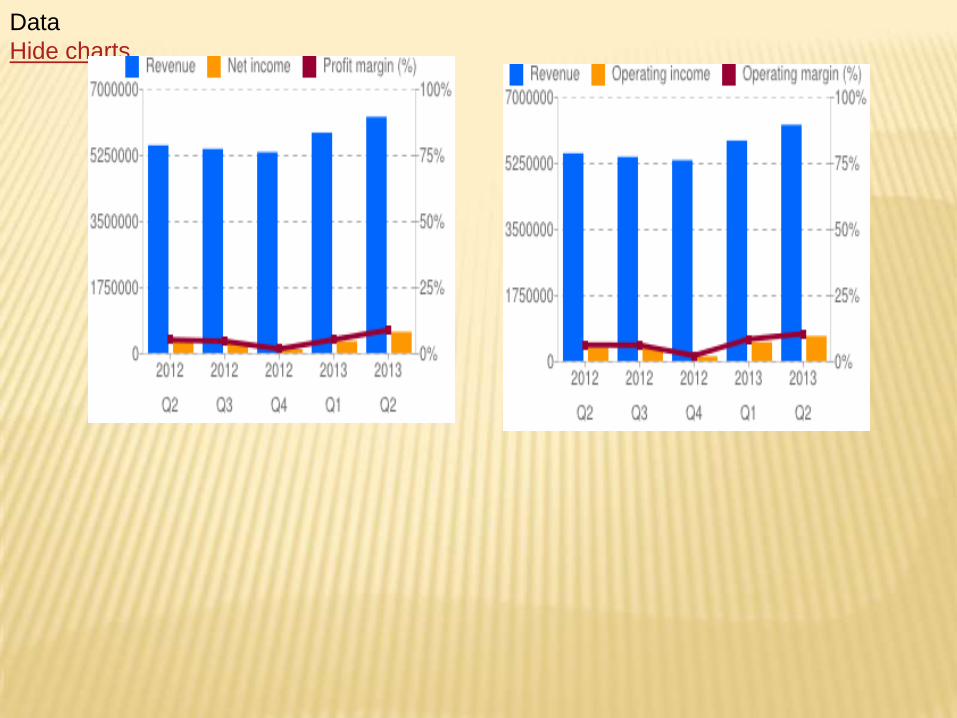
FINANCIAL INFORMATION

TOYOTA
Revenue - $172,749 million
Gross Profit - $43,517 million
Operating Income - $15,571 million
Total Net Income - $10,907 million

COMPETITORS
Annual Revenue
Ford - $171,652 million
General Motors - $193,517
Honda - $80,705
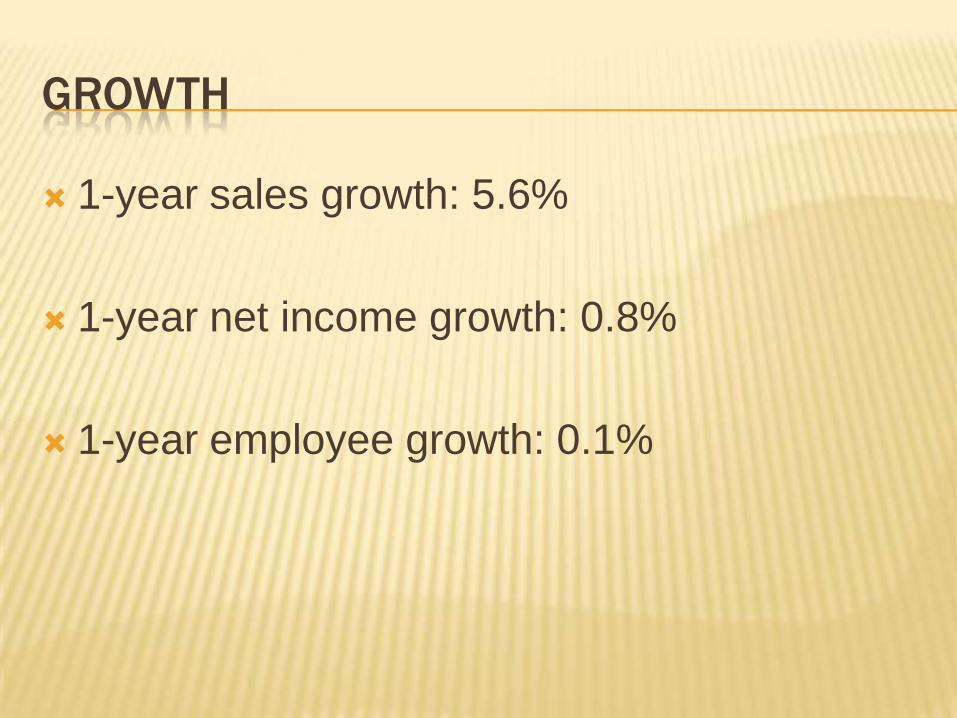
GROWTH
1-year sales growth: 5.6%
1-year net income growth: 0.8%
1-year employee growth: 0.1%

millions of Japanese Yens'
As of:
Mar 31
2010
JPY
Mar 31
2011
JPY
Mar 31
2012
JPY
Mar 31
2013
JPY
4 Year
Trend
Revenues 17,724,729.0 17,820,520.0 17,511,916.0 20,914,150.0
TOTAL REVENUES 18,950,973.0 18,993,688.0 18,583,653.0 22,064,192.0
Cost of Goods Sold 15,971,496.0 15,985,783.0 15,795,918.0 18,010,569.0
GROSS PROFIT 2,267,176.0 2,378,362.0 2,195,089.0 3,423,197.0
Selling General & Admin
Expenses, Total2,119,660.0 1,910,083.0 1,839,462.0 2,012,309.0
OTHER OPERATING
EXPENSES, TOTAL2,119,660.0 1,910,083.0 1,839,462.0 2,012,309.0
OPERATING INCOME 147,516.0 468,279.0 355,627.0 1,410,888.0
Interest Expense -33,409.0 -29,318.0 -22,922.0 -22,967.0
Interest and Investment Income 78,224.0 90,771.0 99,865.0 98,673.0
Other Non-Operating Expenses,
Total147,031.0 256,489.0 251,835.0 240,678.0
Other Non-Operating Income
(Expenses)33,372.0 27,168.0 17,029.0 3,608.0
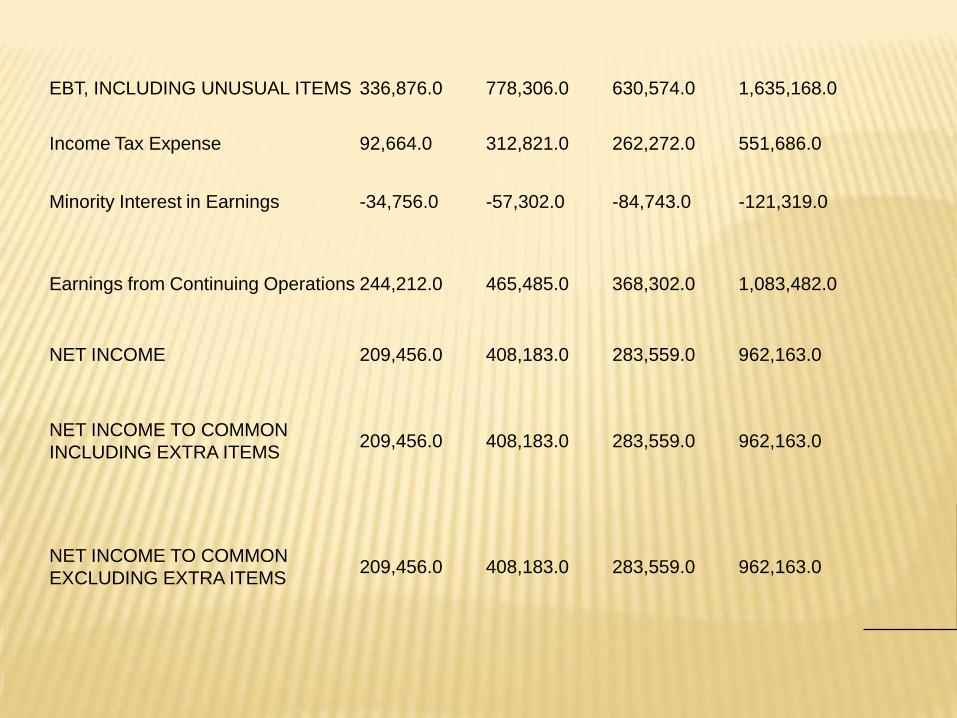
EBT, INCLUDING UNUSUAL ITEMS 336,876.0 778,306.0 630,574.0 1,635,168.0
Income Tax Expense 92,664.0 312,821.0 262,272.0 551,686.0
Minority Interest in Earnings -34,756.0 -57,302.0 -84,743.0 -121,319.0
Earnings from Continuing Operations 244,212.0 465,485.0 368,302.0 1,083,482.0
NET INCOME 209,456.0 408,183.0 283,559.0 962,163.0
NET INCOME TO COMMON
INCLUDING EXTRA ITEMS209,456.0 408,183.0 283,559.0 962,163.0
NET INCOME TO COMMON
EXCLUDING EXTRA ITEMS209,456.0 408,183.0 283,559.0 962,163.0

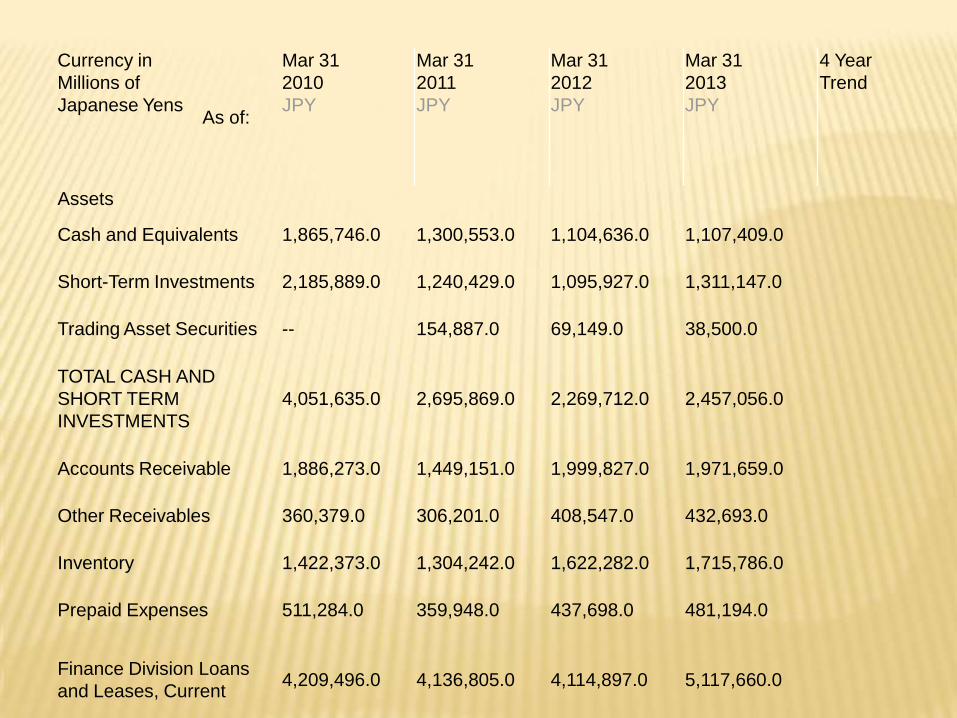
Currency in
Millions of
Japanese YensAs of:
Mar 31
2010
JPY
Mar 31
2011
JPY
Mar 31
2012
JPY
Mar 31
2013
JPY
4 Year
Trend
Assets
Cash and Equivalents 1,865,746.0 1,300,553.0 1,104,636.0 1,107,409.0
Short-Term Investments 2,185,889.0 1,240,429.0 1,095,927.0 1,311,147.0
Trading Asset Securities -- 154,887.0 69,149.0 38,500.0
TOTAL CASH AND
SHORT TERM
INVESTMENTS
4,051,635.0 2,695,869.0 2,269,712.0 2,457,056.0
Accounts Receivable 1,886,273.0 1,449,151.0 1,999,827.0 1,971,659.0
Other Receivables 360,379.0 306,201.0 408,547.0 432,693.0
Inventory 1,422,373.0 1,304,242.0 1,622,282.0 1,715,786.0
Prepaid Expenses 511,284.0 359,948.0 437,698.0 481,194.0
Finance Division Loans
and Leases, Current4,209,496.0 4,136,805.0 4,114,897.0 5,117,660.0

LIABILITIES & EQUITY
Accounts Payable 1,956,505.0 1,503,072.0 2,242,583.0 2,113,778.0
Accrued Expenses 1,735,930.0 1,008,864.0 988,689.0 1,182,514.0
Short-Term Borrowings 160,735.0 192,309.0 410,276.0 227,829.0
Current Portion of Long-
Term Debt/Capital
Lease
249,416.0 303,369.0 334,492.0 205,866.0
Finance Division Debt,
Current5,087,846.0 5,528,179.0 5,258,899.0 6,399,948.0
Finance Division Other
Current Liabilities-- -- 10,434.0 15,331.0
Other Current Liabilities 1,342,395.0 2,127,477.0 2,397,904.0 2,603,061.0
TOTAL CURRENT
LIABILITIES10,686,214.0 10,790,990.0 11,781,574.0 12,912,520.0
Long-Term Debt 955,060.0 913,737.0 608,134.0 583,538.0
Minority Interest 570,720.0 587,653.0 516,217.0 624,821.0
Finance Division Debt,
Non-Current6,060,349.0 5,669,456.0 5,555,112.0 6,876,849.0
Finance Division Other
Non-Current Liabilities-- 7,104.0 8,191.0 11,752.0

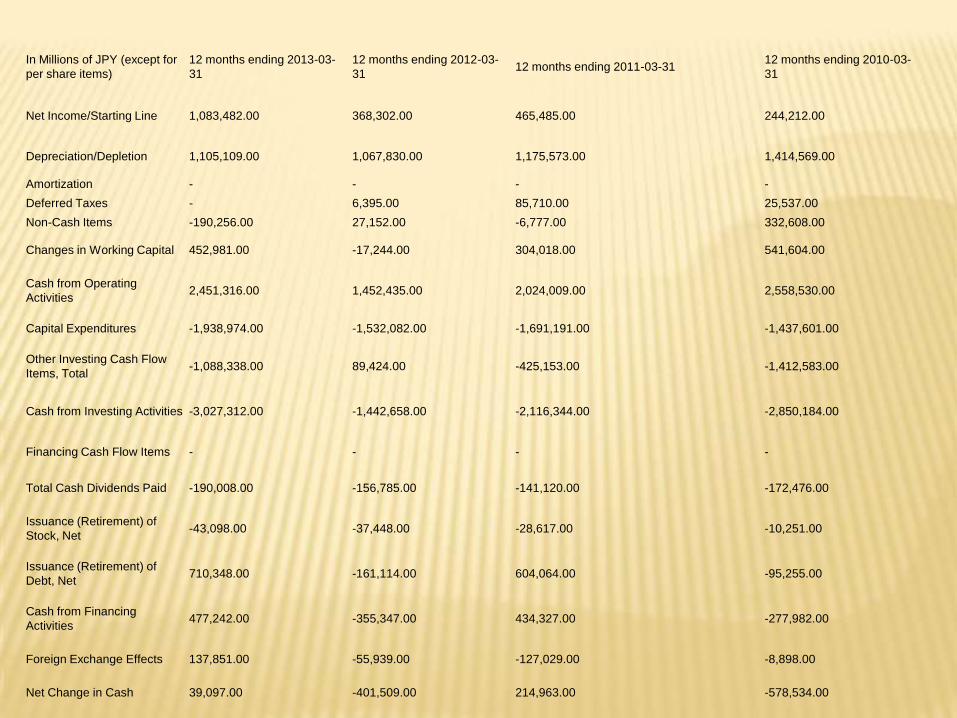
In Millions of JPY (except for
per share items)
12 months ending 2013-03-
31
12 months ending 2012-03-
31 12 months ending 2011-03-31
12 months ending 2010-03-
31
Net Income/Starting Line 1,083,482.00 368,302.00 465,485.00 244,212.00
Depreciation/Depletion 1,105,109.00 1,067,830.00 1,175,573.00 1,414,569.00
Amortization - - - -
Deferred Taxes - 6,395.00 85,710.00 25,537.00
Non-Cash Items -190,256.00 27,152.00 -6,777.00 332,608.00
Changes in Working Capital 452,981.00 -17,244.00 304,018.00 541,604.00
Cash from Operating
Activities 2,451,316.00 1,452,435.00 2,024,009.00 2,558,530.00
Capital Expenditures -1,938,974.00 -1,532,082.00 -1,691,191.00 -1,437,601.00
Other Investing Cash Flow
Items, Total -1,088,338.00 89,424.00 -425,153.00 -1,412,583.00
Cash from Investing Activities -3,027,312.00 -1,442,658.00 -2,116,344.00 -2,850,184.00
Financing Cash Flow Items - - - -
Total Cash Dividends Paid -190,008.00 -156,785.00 -141,120.00 -172,476.00
Issuance (Retirement) of
Stock, Net -43,098.00 -37,448.00 -28,617.00 -10,251.00
Issuance (Retirement) of
Debt, Net 710,348.00 -161,114.00 604,064.00 -95,255.00
Cash from Financing
Activities 477,242.00 -355,347.00 434,327.00 -277,982.00
Foreign Exchange Effects 137,851.00 -55,939.00 -127,029.00 -8,898.00
Net Change in Cash 39,097.00 -401,509.00 214,963.00 -578,534.00
Cash Interest Paid,


COMPETITIVE ADVANTAGES
Cost leadership scm in Toyota vendor
manufacture dealer customer
Local part receiving pc(panama city) store
production dock dealer.
Internal and vendor local part stock reduction
using kanban cycle
Use “pull” system to avoid over production
Best mini MPV (toya avanza)
SUGGESTED STRATEGY
Developed and produced multi product line
for different income class.
Design less fuel consuming engines.
Developing new brands with unique features.
RECOMMENDATION
Invest in other product line
Make more hybrid car.

QUESTIONS FOR AUDIENCE
Q1-When Toyota motors
launched his first car?

Answer- In 1947
Q2- Full form of TPS?
Answer- Toyota Production
System
Q3- What is the two concept of
Toyota Production System?
Answer- JIDOKA & JIT


![AOL VUOSIKATSAUS 2014.ppt [Yhteensopivuustila]€¦ · Toyota Hybrid Synergy Drive 1 x 2 6 1 0 Jm-henkilöst ...](https://static.fdocuments.net/doc/165x107/5b202b1c7f8b9ae15a8b4fbc/aol-vuosikatsaus-2014ppt-yhteensopivuustila-toyota-hybrid-synergy-drive-1.jpg)