TOXICOLOGICAL PROFILE FOR BARIUM AND BARIUM - ATSDR
33
107 BARIUM AND BARIUM COMPOUNDS 6. POTENTIAL FOR HUMAN EXPOSURE 6.1 OVERVIEW Barium has been identified in at least 798 of the 1,684 hazardous waste sites that have been proposed for inclusion on the EPA National Priorities List (NPL) (HazDat 2006). However, the number of sites evaluated for barium is not known. The frequency of these sites can be seen in Figure 6-1. Of these sites, 794 are located within the United States, 1 is in the Territory of Guam, and 3 are located in the Commonwealth of Puerto Rico (the Territory of Guam and the Commonwealth of Puerto Rico are not shown). Barium is a naturally occurring component of minerals that are found in small but widely distributed amounts in the earth's crust, especially in igneous rocks, sandstone, shale, and coal (Kunesh 1978; Miner 1969a). Barium enters the environment naturally through the weathering of rocks and minerals. Anthropogenic releases are primarily associated with industrial processes. Barium is present in the atmosphere, urban and rural surface water, soils, and many foods. Under natural conditions, barium is stable in the +2 valence state and is found primarily in the form of inorganic complexes. Conditions such as pH, Eh (oxidation-reduction potential), cation exchange capacity, and the presence of sulfate, carbonate, and metal oxides (e.g., oxides of aluminum, manganese, silicon, and titanium) will affect the partitioning of barium and its compounds in the environment. The major features of the biogeochemical cycle of barium include wet and dry deposition to land and surface water, leaching from geological formations to groundwater, adsorption to soil and sediment particulates, and biomagnification in terrestrial and aquatic food chains. The general population is exposed to barium through consumption of drinking water and foods, usually at low levels. Workers in barium mining or processing industries and individuals who reside near such industries might be exposed to relatively high levels, primarily through the inhalation of fugitive dust containing barium compounds. The most recent occupational exposure estimates indicate that about 10,000 people were potentially exposed to barium and about 474,000 to barium compounds in workplace environments in the United States in 1980 (NIOSH 1989a).
Transcript of TOXICOLOGICAL PROFILE FOR BARIUM AND BARIUM - ATSDR
107 BARIUM AND BARIUM COMPOUNDS
6. POTENTIAL FOR HUMAN EXPOSURE
6.1 OVERVIEW
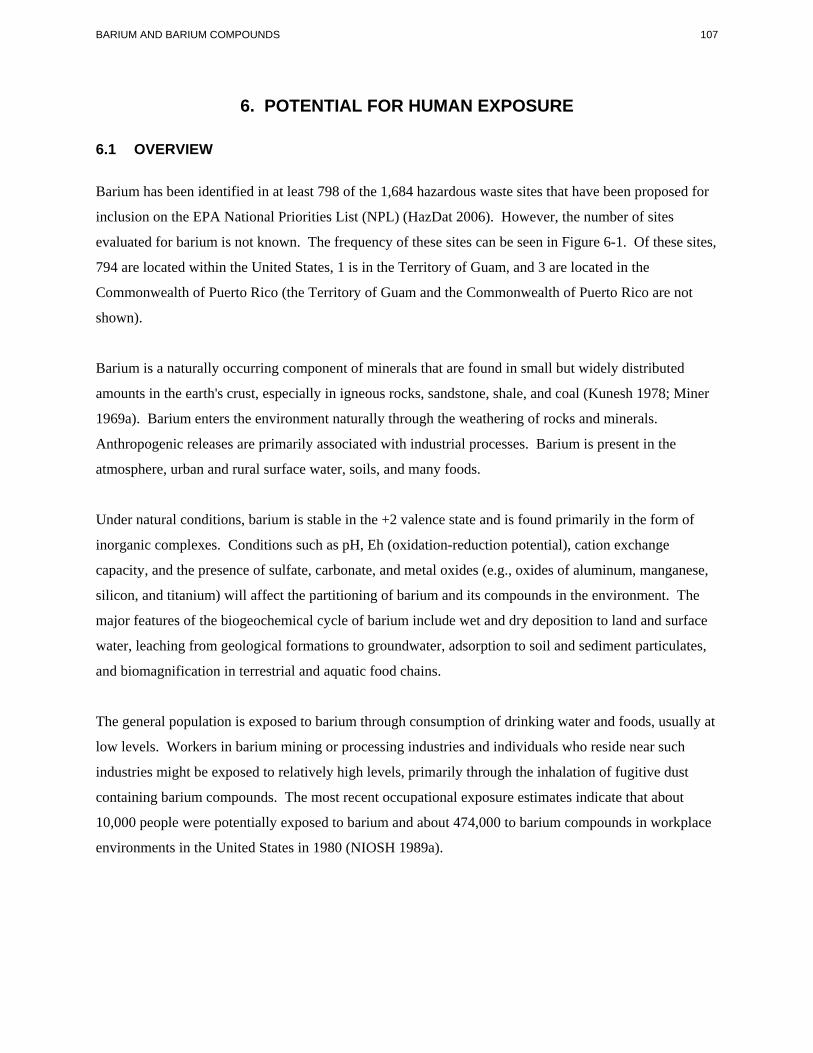
Barium has been identified in at least 798 of the 1,684 hazardous waste sites that have been proposed for
inclusion on the EPA National Priorities List (NPL) (HazDat 2006). However, the number of sites
evaluated for barium is not known. The frequency of these sites can be seen in Figure 6-1. Of these sites,
794 are located within the United States, 1 is in the Territory of Guam, and 3 are located in the
Commonwealth of Puerto Rico (the Territory of Guam and the Commonwealth of Puerto Rico are not
shown).
Barium is a naturally occurring component of minerals that are found in small but widely distributed
amounts in the earth's crust, especially in igneous rocks, sandstone, shale, and coal (Kunesh 1978; Miner
1969a). Barium enters the environment naturally through the weathering of rocks and minerals.
Anthropogenic releases are primarily associated with industrial processes. Barium is present in the
atmosphere, urban and rural surface water, soils, and many foods.
Under natural conditions, barium is stable in the +2 valence state and is found primarily in the form of
inorganic complexes. Conditions such as pH, Eh (oxidation-reduction potential), cation exchange
capacity, and the presence of sulfate, carbonate, and metal oxides (e.g., oxides of aluminum, manganese,
silicon, and titanium) will affect the partitioning of barium and its compounds in the environment. The
major features of the biogeochemical cycle of barium include wet and dry deposition to land and surface
water, leaching from geological formations to groundwater, adsorption to soil and sediment particulates,
and biomagnification in terrestrial and aquatic food chains.
The general population is exposed to barium through consumption of drinking water and foods, usually at
low levels. Workers in barium mining or processing industries and individuals who reside near such
industries might be exposed to relatively high levels, primarily through the inhalation of fugitive dust
containing barium compounds. The most recent occupational exposure estimates indicate that about
10,000 people were potentially exposed to barium and about 474,000 to barium compounds in workplace
environments in the United States in 1980 (NIOSH 1989a).
109 BARIUM AND BARIUM COMPOUNDS
6. POTENTIAL FOR HUMAN EXPOSURE
6.2 RELEASES TO THE ENVIRONMENT
The Toxics Release Inventory (TRI) data should be used with caution because only certain types of
facilities are required to report (EPA 2005d). This is not an exhaustive list. Manufacturing and
processing facilities are required to report information to the TRI only if they employ 10 or more full-time
employees; if their facility is included in Standard Industrial Classification (SIC) Codes 10 (except 1011,
1081, and 1094), 12 (except 1241), 20–39, 4911 (limited to facilities that combust coal and/or oil for the
purpose of generating electricity for distribution in commerce), 4931 (limited to facilities that combust
coal and/or oil for the purpose of generating electricity for distribution in commerce), 4939 (limited to
facilities that combust coal and/or oil for the purpose of generating electricity for distribution in
commerce), 4953 (limited to facilities regulated under RCRA Subtitle C, 42 U.S.C. section 6921 et seq.),
5169, 5171, and 7389 (limited S.C. section 6921 et seq.), 5169, 5171, and 7389 (limited to facilities
primarily engaged in solvents recovery services on a contract or fee basis); and if their facility produces,
imports, or processes ≥25,000 pounds of any TRI chemical or otherwise uses >10,000 pounds of a TRI
chemical in a calendar year (EPA 2005d).
Barium is a highly reactive metal that occurs naturally only in a combined state. The element is released
to environmental media by both natural processes and anthropogenic sources.
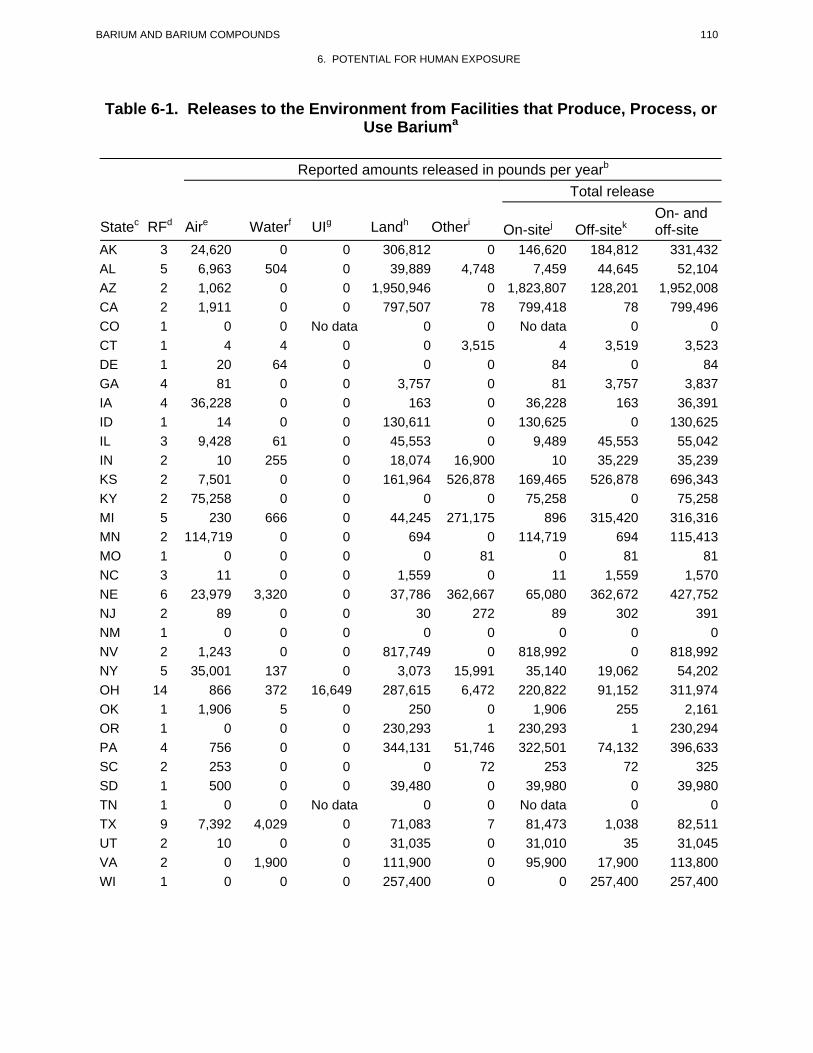
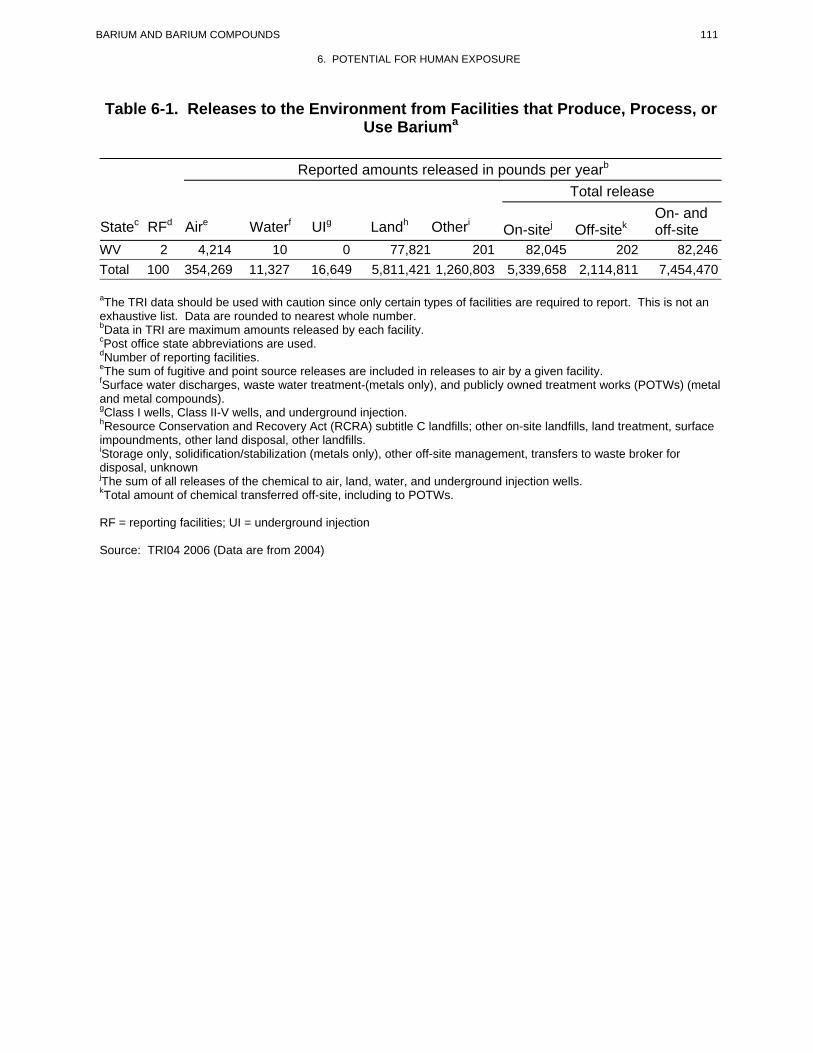
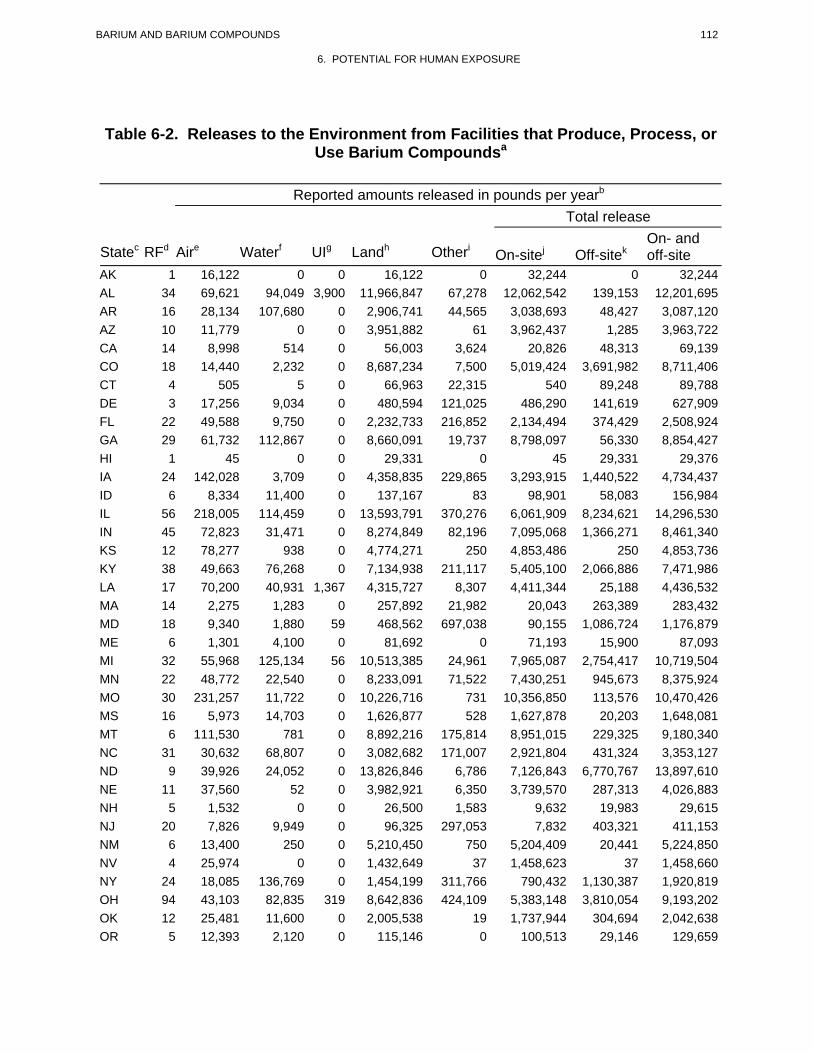
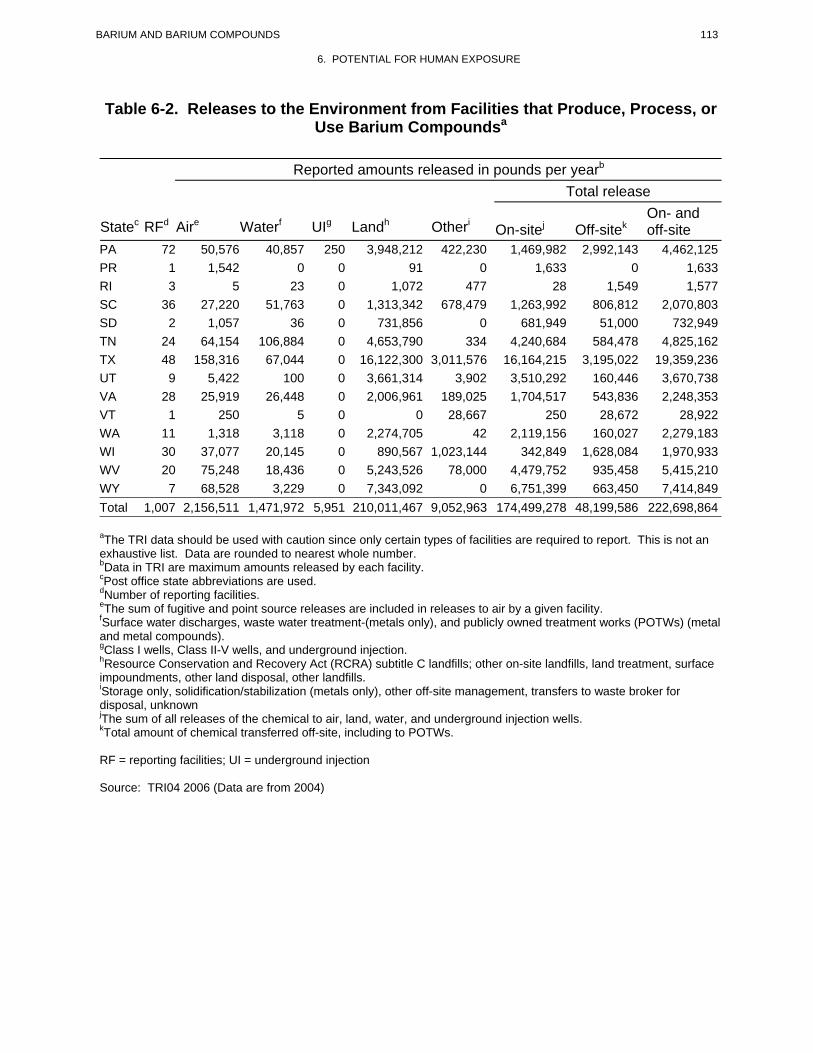
According to the SARA Section 313 Toxics Release Inventory (TRI), an estimated total of 230 million
pounds (105,000 metric tons) of barium and barium compounds were released to the environment from
manufacturing and processing facilities in the United States in 2004 (TRI04 2006) (see Tables 6-1 and
6-2). Most of these barium releases were to land. The TRI data must be viewed with caution since only
certain types of facilities were required to report. This is not an exhaustive list.
6.2.1 Air
Estimated combined releases of 2.51 million pounds (1,140 metric tons) of barium (0.35 million pounds)
and barium compounds (2.16 million pounds) to the atmosphere from 1,107 domestic manufacturing and
processing facilities in 2004, accounted for about 1.09% of the estimated total environmental releases
from facilities required to report to the TRI (TRI04 2006). These releases are summarized in Tables 6-1
and 6-2.
Barium is released primarily to the atmosphere as a result of industrial emissions during the mining,
refining, and production of barium and barium chemicals, fossil fuel combustion (Miner 1969a), and
110 BARIUM AND BARIUM COMPOUNDS
6. POTENTIAL FOR HUMAN EXPOSURE
Table 6-1. Releases to the Environment from Facilities that Produce, Process, or Use Bariuma
Reported amounts released in pounds per yearb
Total release
Statec RFd Aire Waterf UIg Landh Otheri On-sitej Off-sitek On- and off-site
AK 3 24,620 0 0 306,812 0 146,620 184,812 331,432 AL 5 6,963 504 0 39,889 4,748 7,459 44,645 52,104 AZ 2 1,062 0 0 1,950,946 0 1,823,807 128,201 1,952,008 CA 2 1,911 0 0 797,507 78 799,418 78 799,496 CO 1 0 0 No data 0 0 No data 0 0 CT 1 4 4 0 0 3,515 4 3,519 3,523 DE 1 20 64 0 0 0 84 0 84 GA 4 81 0 0 3,757 0 81 3,757 3,837 IA 4 36,228 0 0 163 0 36,228 163 36,391 ID 1 14 0 0 130,611 0 130,625 0 130,625 IL 3 9,428 61 0 45,553 0 9,489 45,553 55,042 IN 2 10 255 0 18,074 16,900 10 35,229 35,239 KS 2 7,501 0 0 161,964 526,878 169,465 526,878 696,343 KY 2 75,258 0 0 0 0 75,258 0 75,258 MI 5 230 666 0 44,245 271,175 896 315,420 316,316 MN 2 114,719 0 0 694 0 114,719 694 115,413 MO 1 0 0 0 0 81 0 81 81 NC 3 11 0 0 1,559 0 11 1,559 1,570 NE 6 23,979 3,320 0 37,786 362,667 65,080 362,672 427,752 NJ 2 89 0 0 30 272 89 302 391 NM 1 0 0 0 0 0 0 0 0 NV 2 1,243 0 0 817,749 0 818,992 0 818,992 NY 5 35,001 137 0 3,073 15,991 35,140 19,062 54,202 OH 14 866 372 16,649 287,615 6,472 220,822 91,152 311,974 OK 1 1,906 5 0 250 0 1,906 255 2,161 OR 1 0 0 0 230,293 1 230,293 1 230,294 PA 4 756 0 0 344,131 51,746 322,501 74,132 396,633 SC 2 253 0 0 0 72 253 72 325 SD 1 500 0 0 39,480 0 39,980 0 39,980 TN 1 0 0 No data 0 0 No data 0 0 TX 9 7,392 4,029 0 71,083 7 81,473 1,038 82,511 UT 2 10 0 0 31,035 0 31,010 35 31,045 VA 2 0 1,900 0 111,900 0 95,900 17,900 113,800 WI 1 0 0 0 257,400 0 0 257,400 257,400
111 BARIUM AND BARIUM COMPOUNDS
6. POTENTIAL FOR HUMAN EXPOSURE
Table 6-1. Releases to the Environment from Facilities that Produce, Process, or Use Bariuma
Reported amounts released in pounds per yearb
Total release
Statec RFd Aire Waterf UIg Landh Otheri On-sitej Off-sitek On- and off-site
WV 2 4,214 10 0 77,821 201 82,045 202 82,246 Total 100 354,269 11,327 16,649 5,811,421 1,260,803 5,339,658 2,114,811 7,454,470
aThe TRI data should be used with caution since only certain types of facilities are required to report. This is not an exhaustive list. Data are rounded to nearest whole number.bData in TRI are maximum amounts released by each facility.cPost office state abbreviations are used. dNumber of reporting facilities.eThe sum of fugitive and point source releases are included in releases to air by a given facility. fSurface water discharges, waste water treatment-(metals only), and publicly owned treatment works (POTWs) (metal and metal compounds). gClass I wells, Class II-V wells, and underground injection. hResource Conservation and Recovery Act (RCRA) subtitle C landfills; other on-site landfills, land treatment, surface impoundments, other land disposal, other landfills. iStorage only, solidification/stabilization (metals only), other off-site management, transfers to waste broker for disposal, unknown jThe sum of all releases of the chemical to air, land, water, and underground injection wells. kTotal amount of chemical transferred off-site, including to POTWs.
RF = reporting facilities; UI = underground injection
Source: TRI04 2006 (Data are from 2004)
112 BARIUM AND BARIUM COMPOUNDS
6. POTENTIAL FOR HUMAN EXPOSURE
Table 6-2. Releases to the Environment from Facilities that Produce, Process, or Use Barium Compoundsa
Reported amounts released in pounds per yearb
Total release On- and
Statec RFd Aire Waterf UIg Landh Otheri On-sitej Off-sitek off-site AK 1 16,122 0 0 16,122 0 32,244 0 32,244 AL 34 69,621 94,049 3,900 11,966,847 67,278 12,062,542 139,153 12,201,695 AR 16 28,134 107,680 0 2,906,741 44,565 3,038,693 48,427 3,087,120 AZ 10 11,779 0 0 3,951,882 61 3,962,437 1,285 3,963,722 CA 14 8,998 514 0 56,003 3,624 20,826 48,313 69,139 CO 18 14,440 2,232 0 8,687,234 7,500 5,019,424 3,691,982 8,711,406 CT 4 505 5 0 66,963 22,315 540 89,248 89,788 DE 3 17,256 9,034 0 480,594 121,025 486,290 141,619 627,909 FL 22 49,588 9,750 0 2,232,733 216,852 2,134,494 374,429 2,508,924 GA 29 61,732 112,867 0 8,660,091 19,737 8,798,097 56,330 8,854,427 HI 1 45 0 0 29,331 0 45 29,331 29,376 IA 24 142,028 3,709 0 4,358,835 229,865 3,293,915 1,440,522 4,734,437 ID 6 8,334 11,400 0 137,167 83 98,901 58,083 156,984 IL 56 218,005 114,459 0 13,593,791 370,276 6,061,909 8,234,621 14,296,530 IN 45 72,823 31,471 0 8,274,849 82,196 7,095,068 1,366,271 8,461,340 KS 12 78,277 938 0 4,774,271 250 4,853,486 250 4,853,736 KY 38 49,663 76,268 0 7,134,938 211,117 5,405,100 2,066,886 7,471,986 LA 17 70,200 40,931 1,367 4,315,727 8,307 4,411,344 25,188 4,436,532 MA 14 2,275 1,283 0 257,892 21,982 20,043 263,389 283,432 MD 18 9,340 1,880 59 468,562 697,038 90,155 1,086,724 1,176,879 ME 6 1,301 4,100 0 81,692 0 71,193 15,900 87,093 MI 32 55,968 125,134 56 10,513,385 24,961 7,965,087 2,754,417 10,719,504 MN 22 48,772 22,540 0 8,233,091 71,522 7,430,251 945,673 8,375,924 MO 30 231,257 11,722 0 10,226,716 731 10,356,850 113,576 10,470,426 MS 16 5,973 14,703 0 1,626,877 528 1,627,878 20,203 1,648,081 MT 6 111,530 781 0 8,892,216 175,814 8,951,015 229,325 9,180,340 NC 31 30,632 68,807 0 3,082,682 171,007 2,921,804 431,324 3,353,127 ND 9 39,926 24,052 0 13,826,846 6,786 7,126,843 6,770,767 13,897,610 NE 11 37,560 52 0 3,982,921 6,350 3,739,570 287,313 4,026,883 NH 5 1,532 0 0 26,500 1,583 9,632 19,983 29,615 NJ 20 7,826 9,949 0 96,325 297,053 7,832 403,321 411,153 NM 6 13,400 250 0 5,210,450 750 5,204,409 20,441 5,224,850 NV 4 25,974 0 0 1,432,649 37 1,458,623 37 1,458,660 NY 24 18,085 136,769 0 1,454,199 311,766 790,432 1,130,387 1,920,819 OH 94 43,103 82,835 319 8,642,836 424,109 5,383,148 3,810,054 9,193,202 OK 12 25,481 11,600 0 2,005,538 19 1,737,944 304,694 2,042,638 OR 5 12,393 2,120 0 115,146 0 100,513 29,146 129,659
113 BARIUM AND BARIUM COMPOUNDS
6. POTENTIAL FOR HUMAN EXPOSURE
Table 6-2. Releases to the Environment from Facilities that Produce, Process, or Use Barium Compoundsa
Reported amounts released in pounds per yearb
Total release On- and
Statec RFd Aire Waterf UIg Landh Otheri On-sitej Off-sitek off-site PA 72 50,576 40,857 250 3,948,212 422,230 1,469,982 2,992,143 4,462,125 PR 1 1,542 0 0 91 0 1,633 0 1,633 RI 3 5 23 0 1,072 477 28 1,549 1,577 SC 36 27,220 51,763 0 1,313,342 678,479 1,263,992 806,812 2,070,803 SD 2 1,057 36 0 731,856 0 681,949 51,000 732,949 TN 24 64,154 106,884 0 4,653,790 334 4,240,684 584,478 4,825,162 TX 48 158,316 67,044 0 16,122,300 3,011,576 16,164,215 3,195,022 19,359,236 UT 9 5,422 100 0 3,661,314 3,902 3,510,292 160,446 3,670,738 VA 28 25,919 26,448 0 2,006,961 189,025 1,704,517 543,836 2,248,353 VT 1 250 5 0 0 28,667 250 28,672 28,922 WA 11 1,318 3,118 0 2,274,705 42 2,119,156 160,027 2,279,183 WI 30 37,077 20,145 0 890,567 1,023,144 342,849 1,628,084 1,970,933 WV 20 75,248 18,436 0 5,243,526 78,000 4,479,752 935,458 5,415,210 WY 7 68,528 3,229 0 7,343,092 0 6,751,399 663,450 7,414,849 Total 1,007 2,156,511 1,471,972 5,951 210,011,467 9,052,963 174,499,278 48,199,586 222,698,864
aThe TRI data should be used with caution since only certain types of facilities are required to report. This is not an exhaustive list. Data are rounded to nearest whole number.bData in TRI are maximum amounts released by each facility.cPost office state abbreviations are used. dNumber of reporting facilities.eThe sum of fugitive and point source releases are included in releases to air by a given facility. fSurface water discharges, waste water treatment-(metals only), and publicly owned treatment works (POTWs) (metal and metal compounds). gClass I wells, Class II-V wells, and underground injection. hResource Conservation and Recovery Act (RCRA) subtitle C landfills; other on-site landfills, land treatment, surface impoundments, other land disposal, other landfills. iStorage only, solidification/stabilization (metals only), other off-site management, transfers to waste broker for disposal, unknown jThe sum of all releases of the chemical to air, land, water, and underground injection wells. kTotal amount of chemical transferred off-site, including to POTWs.
RF = reporting facilities; UI = underground injection
Source: TRI04 2006 (Data are from 2004)
114 BARIUM AND BARIUM COMPOUNDS
6. POTENTIAL FOR HUMAN EXPOSURE
entrainment of soil and rock dust into the air (Schroeder 1970). In addition, coal ash, containing widely
variable amounts of barium, is also a source of airborne barium particulates (Miner 1969a; Schroeder
1970). In 1969, an estimated 18% of the total U.S. barium emissions to the atmosphere resulted from the
processing of barite ore, and more than 28% of the total was estimated to be from the production of
barium chemicals. The manufacture of various end products (e.g., drilling well muds, and glass, paint,
and rubber products) and the combustion of coal were estimated to account for an additional 23 and 26%
of the total barium emissions for 1969, respectively (Davis 1972).
Estimates of barium releases from individual industrial processes are available for particulate emissions
from the drying and calcining of barium compounds and for fugitive dust emissions during the processing
of barite ore. Soluble barium compounds (unspecified) are emitted as particulates from barium chemical
dryers and calciners to the atmosphere during the processing of barium carbonate, barium chloride, and
barium hydroxide (Reznik and Toy 1978). Uncontrolled particulate emissions of soluble barium
compounds from chemical dryers and calciners during barium processing operations may range from
0.04 to 10 g/kg of final product. Controlled particulate emissions are less than 0.25 g/kg of final product.
Based on an uncontrolled emission factor of 5 g/kg and a controlled emission factor of 0.25 g/kg, total
particulate emissions from the drying and calcining of barium carbonate, barium chloride, and barium
hydroxide are estimated to be 160 metric tons (352,800 pounds) per year (Reznik and Toy 1978).
Fugitive dust emissions occur during processing (grinding and mixing) of barite ore and may also occur
during the loading of bulk product of various barium compounds into railroad hopper cars (Reznik and
Toy 1978). Based on an emission factor of 1 g/kg, total emissions of fugitive dust from the domestic
barium chemicals industry during the grinding of barite ore have been estimated to be approximately
90 metric tons (198,450 pounds) per year (Reznik and Toy 1978). Other particulate emissions from the
industrial production of barium compounds include an estimated 820 metric tons (1.8 million pounds) per
year from uncontrolled kilns during the processing of barite ore and 8 metric tons (17,640 pounds) per
year from black ash (i.e., barium sulfide) rotary kilns during the production of barium hydroxide (Reznik
and Toy 1978). Electric utilities that burn bituminous coal emit a small fraction of the barium contained
in coal into the air. For example, it is estimated that 830 pounds/year of barium are released to air from a
650 megawatt (MW) plant, in comparison to 270,000 pounds/year released as ash to land-based waste
sites (Rubin 1999).
The use of barium in the form of organometallic compounds as a smoke suppressant in diesel fuels results
in the release of solids to the atmosphere (Miner 1969a; Ng and Patterson 1982; Schroeder 1970). The
115 BARIUM AND BARIUM COMPOUNDS
6. POTENTIAL FOR HUMAN EXPOSURE
maximum concentration of soluble barium in exhaust gases containing barium-based smoke suppressants
released from test diesel engines and operating diesel vehicles is estimated to be 12,000 μg/m3, when the
barium concentration in the diesel fuel is 0.075% by weight and 25% of the exhausted barium (at a
sampling point 10 feet from the engine and upstream from the muffler) is soluble (Golothan 1967). Thus,
1 L of this exhaust gas contains an estimated 12 μg soluble barium or 48 μg total barium (Schroeder
1970). However, recent legislation requiring the use of low-sulfur fuel in diesel engines has eliminated
the need for barium as a sulfur-scavenging additive and, therefore, has greatly reduced the emissions of
barium from diesel engine exhaust (Schauer et al. 1999; Winkler 2002).
6.2.2 Water
Estimated combined releases of 1.48 million pounds (674 metric tons) of barium (0.01 million pounds)
and barium compounds (1.47 million pounds) to surface water from 1,107 domestic manufacturing and
processing facilities in 2004, accounted for about 0.64% of the estimated total environmental releases
from facilities required to report to the TRI (TRI04 2006).
The primary source of naturally occurring barium in drinking water results from the leaching and eroding
of sedimentary rocks into groundwater (Kojola et al. 1978). Although barium occurs naturally in most
surface water bodies (i.e., approximately 99% of those examined) (DOI 1970), releases of barium to
surface waters from natural sources are much lower than those to groundwater (Kojola et al. 1978).
About 80% of the barium produced is used as barite to make high-density oil and gas well drilling muds,
and during offshore drilling operations there are periodic discharges of drilling wastes in the form of
cuttings and muds into the ocean (Ng and Patterson 1982). For example, in the Santa Barbara Channel
region, about 10% of the muds used are lost into the ocean (Ng and Patterson 1982). Operations
involving three drilling platforms in the Santa Maria Basin off the coast of central California released
approximately 1.8x10⁶ kg of barium to the ocean in discharged muds, cuttings, and waste water from
1986 to 1994 (Phillips et al. 1998). The use of barium in offshore drilling operations may increase
barium pollution, especially in coastal sediments (Ng and Patterson 1982).
6.2.3 Soil
Estimated combined releases of 216 million pounds (98,095 metric tons) of barium (5.81 million pounds)
and barium compounds (210 million pounds) to soils from 1,107 domestic manufacturing and processing
facilities in 2004, accounted for about 93.7% of the estimated total environmental releases from facilities
BARIUM AND BARIUM COMPOUNDS 116
6. POTENTIAL FOR HUMAN EXPOSURE
required to report to the TRI (TRI04 2006). An additional combined total of 0.023 million pounds
(10 metric tons) from barium (0.017 million pounds) and barium compounds (0.006 million pounds),
constituting about 0.01% of the total environmental emissions, were released via underground injection
(TRI04 2006). These releases are summarized in Tables 6-1 and 6-2.
The process of drilling for crude oil and natural gas generates waste drilling fluids or muds, which are
often disposed of by land farming. Most of these fluids are water based and contain barite and other
metal salts. Thus, barium may be introduced into soils as the result of land farming these slurried reserve
pit wastes (Bates 1988).
The use of barium fluorosilicate and carbonate as insecticides (Beliles 1979; Meister 2004) might also
contribute to the presence of barium in agricultural soils.
Barium has been detected with a positive geometric mean concentration of 100.5 ppm in soil samples
from approximately 52% of the hazardous waste sites that have had samples analyzed by the CLP
(CLPSD 1989). Note that these data from the CLPSD represent frequency of occurrence and
concentration data for NPL sites only.
6.3 ENVIRONMENTAL FATE
6.3.1 Transport and Partitioning
Most barium released to the environment from industrial sources is in forms that do not become widely
dispersed (Ng and Patterson 1982). In the atmosphere, barium is likely to be present in particulate form
(EPA 1984). Although chemical reactions may cause changes in speciation of barium in air, the main
mechanisms for the removal of barium compounds from the atmosphere are likely to be wet and dry
deposition (EPA 1984).
In aquatic media, barium is likely to precipitate out of solution as an insoluble salt (i.e., as BaSO4 or
BaCO3). Waterborne barium may also adsorb to suspended particulate matter through the formation of
ion pairs with natural anions such as bicarbonate or sulfate in the matter (Bodek et al. 1988; EPA 1984;
Giusti et al. 1993; Lagas et al. 1984; Tanizaki et al. 1992). Precipitation of barium sulfate salts is
accelerated when rivers enter the ocean because of the high sulfate content (905 mg/L) in the ocean
(Bowen 1966; WHO 2001). It is estimated that only 0.006% of the total barium input into oceans from
freshwater sources remains in solution (Chow et al. 1978; WHO 2001). Sedimentation of suspended
117 BARIUM AND BARIUM COMPOUNDS
6. POTENTIAL FOR HUMAN EXPOSURE
solids removes a large portion of the barium content from surface waters (Benes et al. 1983). There is
evidence to suggest that the precipitation of barium from the surface of fresh and marine waters occurs, in
part, as the result of the barite crystal formation in microorganisms (González-Muñoz et al. 2003).
Barium in sediments is found largely in the form of barium sulfate (barite). Coarse silt sediment in a
turbulent environment will often grind and cleave the barium sulfate from the sediment particles leaving a
buildup of dense barites (Merefield 1987). Estimated soil:water distribution coefficients (Kd) (i.e., the
ratio of the quantity of barium sorbed per gram of sorbent to the concentration of barium remaining in
solution at equilibrium) range from 200 to 2,800 for sediments and sandy loam soils (DOE 1984; Rai et
al. 1984).
The uptake of barium by fish and marine organisms is also an important removal mechanism (Bowen
1966; Schroeder 1970). Barium levels in sea water range from 2 to 63 μg/L with a mean concentration of
about 13 μg/L (Bowen 1979). Barium was found to bioconcentrate in marine plants by a factor of 400–
4,000 times the level present in the water (Bowen 1966). Bioconcentration factors in marine animals,
plankton, and brown algae of 100, 120, and 260, respectively, have been reported (Schroeder 1970). In
freshwater, a bioconcentration factor of 129 was estimated in fish where the barium in water was
0.07 mg/L (Hope et al. 1996).
Barium added to soils (e.g., from the land farming of waste drilling muds) may either be taken up by
vegetation or transported through soil with precipitation (Bates 1988). Relative to the amount of barium
found in soils, little is typically bioconcentrated by plants (Schroeder 1970). For example, a
bioconcentration factor of 0.4 has been estimated for plants in a Virginia floodplain with a barium soil
concentration of 104.2 mg/kg (Hope et al. 1996). However, there are some plants, such as legumes,
forage plants, Brazil nuts, and mushrooms that accumulate barium (Aruguete et al. 1998; IPCS 1991;
WHO 2001). Bioconcentration factors from 2 to 20 have been reported for tomatoes and soybeans (WHO
2001).
Barium is not very mobile in most soil systems, due to the formation of water-insoluble salts and an
inability of the barium ion to form soluble complexes with fulvic and humic acids (WHO 2001). The rate
of transportation of barium in soil is dependent on the characteristics of the soil material. Soil properties
that influence the transportation of barium to groundwater are cation exchange capacity, calcium
carbonate (CaCO3) content and pH. In soil with a high cation exchange capacity (e.g., fine textured
mineral soils or soils with high organic matter content), barium mobility will be limited by adsorption
(Bates 1988; Kabata-Pendias and Pendias 1984). High CaCO3 content limits mobility by precipitation of
BARIUM AND BARIUM COMPOUNDS 118
6. POTENTIAL FOR HUMAN EXPOSURE
the element as BaCO3 (Lagas et al. 1984). Barium will also precipitate as barium sulfate in the presence
of sulfate ions (Bodek et al. 1988; Lagas et al. 1984). Barium is more mobile and is more likely to be
leached from soils in the presence of chloride due to the high solubility of barium chloride as compared to
other chemical forms of barium (Bates 1988; Lagas et al. 1984). Barium may become more mobile in
soils under acid conditions as barium in water-insoluble salts, such as barium sulfate and carbonate,
becomes more soluble (WHO 2001). Barium complexes with fatty acids (e.g., in acidic landfill leachate)
will be much more mobile in the soil due to the lower charge of these complexes and subsequent
reduction in adsorption capacity (Lagas et al. 1984).
Barium mobility in soil is reduced by the precipitation of barium carbonate and sulfate. Humic and fulvic
acid have not been found to increase the mobility of barium (EPA 1984).
6.3.2 Transformation and Degradation
6.3.2.1 Air
Elemental barium undergoes oxidation in air and is oxidized readily in moist air (Boffito 2002; EPA
1983; Kresse et al. 2007; Kunesh 1978). The residence time of barium in the atmosphere may be several
days, depending on the size of the particulate formed, the chemical nature of the particulate, and
environmental factors such as rainfall (EPA 1984; WHO 2001).
6.3.2.2 Water
Under natural conditions, barium will form compounds in the +2 oxidation state. Barium does not
hydrolyze appreciably except in highly alkaline environments (i.e., at pH levels ≥10) (Bodek et al. 1988).
Appreciable levels of barium sulfate occur because natural water often contains high sulfate
concentrations, especially ocean water. Since the solubility of barium sulfate is low, only trace amounts
of barium dissolve in surface water (Bodek et al. 1988; NAS 1977). At pH levels of 9.3 or below, barium
sulfate may limit barium concentrations in natural waters (Bodek et al. 1988). The solubility of barium
sulfate increases considerably in the presence of chloride (Cl-) and other anions (e.g., NO3- and CO3
-2),
and at pH levels of 9.3 or below, the barium ion (Ba2+) is the dominant species (Bodek et al. 1988; NAS
1977). The Ba2+ ion is stable under the pH-Eh range of natural systems. However, natural and treated
waters usually contain sufficient sulfate so that a barium ion concentration of more than 1,000–
119 BARIUM AND BARIUM COMPOUNDS
6. POTENTIAL FOR HUMAN EXPOSURE
1,500 μg/L cannot be maintained in solution (EPA 1983; Hem 1959; Lagas et al. 1984; McCabe et al.
1970).
As pH levels increase above 9.3 and in the presence of carbonate, barium carbonate becomes the
dominant species (Bodek et al. 1988; Singer 1974). Barium carbonate also exhibits fast precipitation
kinetics and very low solubility and in alkaline environments limits the soluble barium concentration
(Faust and Aly 1981; Hem 1959; Rai et al. 1984; Singer 1974). Barium forms salts of low solubility with
arsenate, chromate, fluoride, oxalate, and phosphate ions (Bodek et al. 1988; EPA 1983; Kunesh 1978).
The chloride, hydroxide, and nitrate of barium are water-soluble (Bodek et al. 1988; EPA 1983;
Kirkpatrick 1978) and are frequently detected in aqueous environments (Rai et al. 1984).
Barium also forms complexes with natural organics in water (e.g., fatty acids in acidic landfill leachates)
to a limited extent (Lagas et al. 1984; Morel 1983; Rai et al. 1984).
6.3.2.3 Sediment and Soil
Barium reacts with metal oxides and hydroxides in soil and is subsequently adsorbed onto soil
particulates (Hem 1959; Rai et al. 1984). Adsorption onto metal oxides in soils and sediments probably
acts as a control over the concentration of barium in natural waters (Bodek et al. 1988). Under typical
environmental conditions, barium displaces other adsorbed alkaline earth metals from MnO2, SiO2, and
TiO2 (Rai et al. 1984). However, barium is displaced from Al2O3 by other alkaline earth metals (Rai et al.
1984). The ionic radius of the barium 2+ ion, its typical oxidation state, makes isomorphous substitution
possible only with strontium, and generally not with the other members of the alkaline earth elements
(Kirkpatrick 1978). Among the other elements that occur with barium in nature, substitution is common
only with potassium but not with the smaller ions of sodium, iron, manganese, aluminum, and silicon
(Kirkpatrick 1978).
Barium is also adsorbed onto soil and subsoil through electrostatic interactions (Bodek et al. 1988; Singer
1974). The cation exchange capacity of the sorbent largely controls the retention of barium in soils
(Bodek et al. 1988). Barium is strongly adsorbed by clay minerals (Kabata-Pendias and Pendias 1984;
Lagas et al. 1984).
120 BARIUM AND BARIUM COMPOUNDS
6. POTENTIAL FOR HUMAN EXPOSURE
Barium can also form salts with acetate, nitrate, chloride, and hydroxide ions in soil. The mobility of
barium in soils increases upon formation of these water soluble salts (Bodek et al. 1988). In general, the
solubility of barium compounds increases with decreasing pH.
6.4 LEVELS MONITORED OR ESTIMATED IN THE ENVIRONMENT
Reliable evaluation of the potential for human exposure to barium depends in part on the reliability of
supporting analytical data from environmental samples and biological specimens. Concentrations of
barium in unpolluted atmospheres and in pristine surface waters are often so low as to be near the limits
of current analytical methods. In reviewing data on barium levels monitored or estimated in the
environment, it should also be noted that the amount of chemical identified analytically is not necessarily
equivalent to the amount that is bioavailable. The analytical methods available for monitoring barium in
a variety of environmental media are detailed in Chapter 7.
6.4.1 Air
The concentration of barium in ambient air is estimated to be <0.05 μg/m3 (IPCS 1991). Airborne barium
likely exists as the carbonate or sulfate salts and is carried on particulate matter that results as a
consequence of natural processes (e.g., suspension of soil dust) or anthropogenic activities (e.g.,
combustion process, mining and calcining of barium ores) (WHO 2001). However, there is no apparent
correlation between the degree of industrialization and barium concentrations in ambient air (Winkler
2002). Particulate matter from diesel exhaust was once a source of barium in ambient air. However,
barium emissions from diesel engines has been greatly diminished to near zero emissions with the current
use of low-sulfur diesel fuels, which do not require the addition of barium as a sulfur-scavenging agent
(Hildemann et al. 1991; Schauer et al. 1999; Shahin et al. 2000; Winkler 2002).
Tabor and Warren (1958) report urban and suburban air concentrations of barium ranging from <0.005 to
1.5 μg/m3. In another study of barium concentrations in ambient air, values ranged from 0.0015 to
0.95 mg/m3 (EPA 1984). No distinct pattern related to industrialization appeared in the results reported
on 754 samples from 18 cities and four suburban areas in the United States. For example, in Houston,
Texas and its suburbs, 76% of the samples contained barium at levels ranging from 0.005 to 1.5 μg/m3,
whereas in Fort Worth, Texas, 66% of the samples had values <0.005 μg/m3 (Tabor and Warren 1958).
Another compilation of atmospheric data shows barium concentrations in urban atmospheres of North
America ranging from 2x10⁻⁴ to 2.8x10⁻² μg/m3 with a mean concentration of 1.2x10⁻² μg/m3 (Bowen
121 BARIUM AND BARIUM COMPOUNDS
6. POTENTIAL FOR HUMAN EXPOSURE
1979). In contrast, barium levels in samples from the South Pole and northern Norway were 1.6x10⁻⁵ and
7.3x19-4 μg/m3, respectively (Bowen 1979). Mean barium concentrations in background air collected
between April and October 2002 on the campus of the University of Birmingham, United Kingdom, were
0.32 and 1.4 ng/m3 in the <0.5 and 3.0–7.2 μm particular matter fractions, respectively (Birmili et al.
2006).
Maximum ground-level barium concentrations (as soluble compounds) associated with uncontrolled
atmospheric particulate emissions from chemical dryers and calciners at barium-processing plants have
been estimated (using dispersion modeling) to range from 1.3 to 330 μg/m3 over a 24-hour averaging time
at locations along facility boundaries (i.e., away from the source of emission) (Reznik and Toy 1978).
Barium has been measured in dust samples taken from 49 residences in Ottawa, Canada. Mean and
median concentrations of 405.56 and 222.22 mg barium/kg dust, respectively, were measured within a
sub-fraction of the dust samples where the particulate sizes ranged from 100 to 250 μm (Butte and
Heinzow 2002; Rasmussen et al. 2001).
Barium has been measured in rain and snow collected near Claremont, New Hampshire in 1996–1997
(Feng et al. 2000). Barium concentrations in rain ranged from 0.22 to 0.84 μg/L with a mean
concentration of 0.39 μg/L. In snow, barium concentrations ranged from 0.64 to 7.44 μg/L with a mean
concentration of 1.5 μg/L.
Barium has been detected in air samples collected at 24 of the 798 hazardous waste sites where barium
has been detected in some environmental medium (HazDat 2006). The HazDat information includes data
from both NPL and other Superfund sites. Concentrations of barium in air ranged from 0.015 to
327,000,000 μg/m3 in 16 onsite (HazDat 2006). In comparison, concentrations of barium in air ranged
from 0.0135 to 561,000,000 μg/m3 in 12 offsite samples (HazDat 2006).
6.4.2 Water
Barium has been found in almost all raw surface waters and public drinking water supplies sampled (i.e.,
approximately 99%) (Kopp 1969) at concentrations ranging from ≤5 to 15,000 μg/L with mean
concentrations generally on the order of 10–60 μg/L (Barnett et al. 1969; Bowen 1979; DOI 1970; Durfor
and Becker 1964; Durum and Haffty 1961; Elinder and Zenz 1994; EPA 2005c; Kopp 1969; Longerich et
al. 1991; McCabe et al. 1970; Neal et al. 1996; Saleh and Wilson 1999; Tuovinen et al. 1980). Barium
122 BARIUM AND BARIUM COMPOUNDS
6. POTENTIAL FOR HUMAN EXPOSURE
concentrations are lowest (mean value of 15 μg/L) in the drainage basins of the western Great Lakes and
highest (mean value of 90 μg/L) in the southwestern drainage basins of the lower Mississippi Valley
(EPA 2005c). Barium concentrations in the shallow aquifer below Denver, Colorado, have been reported
to range from 18 to 594 μg/L with a median value of 104 μg/L (Bruce and McMahon 1996). Barium
concentrations in most drinking water supplies are <200 μg/L with a mean concentration of 28.6 μg/L
(EPA 2005c). In California, mean and median values of 302 and 160 μg/L, respectively, were measured
for barium concentrations in drinking water supplies (Storm 1994).
Barium concentrations in groundwater supplies have been known to exceed EPA's maximum contaminant
level (MCL) of 2.0 mg/L (2,000 μg/L) (EPA 2002a); this may be due to leaching and erosion of barium
from sedimentary rocks (Calabrese 1977; Kojola et al. 1978). For example, community water supplies
from deep rock and drift wells in northeastern Illinois have been found to have barium concentrations
ranging from 1,100 to 10,000 μg/L (Calabrese 1977). Many communities in Kentucky, Pennsylvania, and
New Mexico have drinking water where the barium content is up to ten times higher than the MCL (EPA
2005c). Water samples taken from groundwater wells in Texas that are within 750 m of brine injection,
dry, or plugged gas/oil wells contain barium ranging in concentration from 1.2 to 2,300 μg/L (Hudak and
Wachal 2001).
A mean concentration of 167 μg/L for barium was measured in influent streams of a public waste water
treatment plant in Melbourne, Australia (Wilkie et al. 1996). The amount of barium in the influent
streams could not be accounted for based on the mean concentrations of barium in domestic water
supplies (20 μg/L) or domestic sewage (38 μg/L). Instead, it is likely that the barium unaccounted for in
the influent stream is the result of barium carried in effluents from industries that are discharged into the
catchment area of the treatment plant.
Barium has also been found in sea water at concentrations ranging from 2 to 63 μg/L with a mean
concentration of 13 μg/L (Bowen 1979).
Barium has been detected in surface water and groundwater samples collected at 257 and 561 of the
798 hazardous waste sites, respectively, where barium has been detected in some environmental medium
(HazDat 2006). The HazDat information includes data from both NPL and other Superfund sites.
Maximum concentrations of barium in surface water (lakes, streams, ponds, etc.) ranged from 0.33 to
18,100,000 μg/L in 77 onsite samples (HazDat 2006). In comparison, maximum concentrations of
barium in surface water (lakes, streams, ponds, etc.) ranged from 10 to 73,8000 μg/L in 112 offsite
123 BARIUM AND BARIUM COMPOUNDS
6. POTENTIAL FOR HUMAN EXPOSURE
samples (HazDat 2006). The maximum concentrations of barium in groundwater ranged from 0.064 to
2,100,000 μg/L in 442 onsite samples (HazDat 2006). In comparison, maximum concentrations of
barium in groundwater ranged from 0.05 to 803,000 μg/L in 260 offsite samples (HazDat 2006).
6.4.3 Sediment and Soil
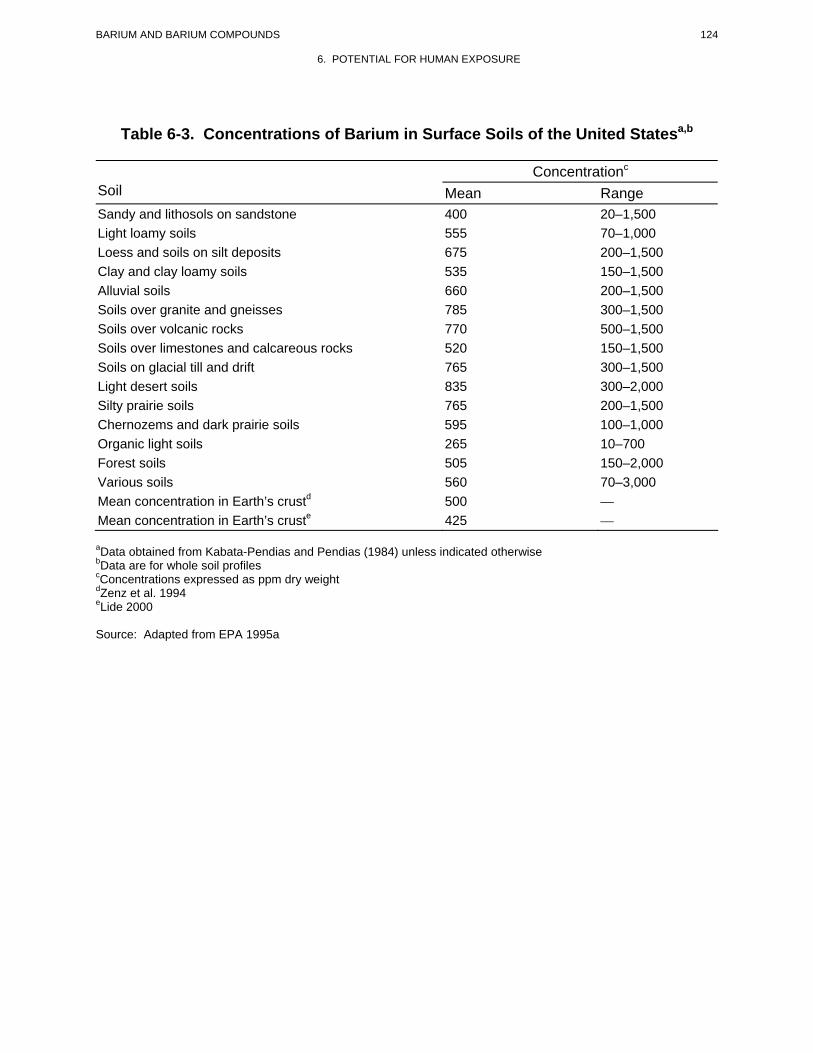
Barium is relatively abundant in the earth's crust and is found in most soils at concentrations (Table 6-3)
ranging from about 15 to 3,500 ppm (dry weight) and mean values ranging between 265 and 835 ppm,
depending on soil type (EPA 1995a; Kabata-Pendias and Pendias 1984; Lide 2005; Zenz et al. 1994).
The barium content in cultivated and uncultivated soil samples collected during a number of field studies
ranged from 15 to 1,000 ppm (mean concentration of 300 ppm) for B horizon soils (subsurface soils) in
the eastern United States and from 70 to 5,000 ppm (mean concentration of 560 ppm) for B horizon soils
in the western United States (Bowen 1979; Schroeder 1970; Shacklette and Boerngen 1984). Barium
content ranged from 150 to 1,500 ppm for surface horizon soils collected in Colorado (mean
concentration of 550 ppm) (Connor and Shacklette 1975). Soil samples (0–6 inch depth) taken from three
New England cities, Boston, Providence and Springfield, were reported to have mean barium
concentrations of 53.95, 45.29 and 45.17 mg/kg, respectively, and upper 95% interval values of 66.25,
59.43, and 51.03 mg/kg, respectively (Bradley et al. 1994). Soil samples were obtained from areas that
were not influenced by industrial activity, such as along roads and sidewalks, parks and open lots, and
may account for why the mean values for barium concentration were well below a mean value of
420 mg/kg for the United States.
Geometric mean concentrations of barium in sediments taken from 16 sampling sites along the southern
shore of Lake Ontario and southeastern shore of Lake Erie ranged from 6.0 to 143.6 μg/g (dry weight)
(Lowe and Day 2002). Thirteen of the 16 sites had mean barium concentrations that exceeded EPA’s
guidelines (20–60 μg barium/g dry weight) for defining moderately polluted harbor sediments for this
metal. However, these concentrations are lower than the mean barium concentration of 482.1 μg/g in
sediments collected from Lake Pontchartrain near New Orleans, Louisiana (USGS 2002c). The barium
content in total suspended solids collected from the Mississippi River before it enters Lake Pontchartrain
was 599 μg/g.
Barium concentrations in sediments near offshore drilling platforms are typically higher than unaffected
sediments. Surficial and suspended sediments collected within 500 m of a drilling platform in the Santa
Maria Basin offshore of central California contained barium at concentrations of 923 and 736 mg/kg dry
124 BARIUM AND BARIUM COMPOUNDS
6. POTENTIAL FOR HUMAN EXPOSURE
Table 6-3. Concentrations of Barium in Surface Soils of the United Statesa,b
Concentrationc
Soil Mean Range Sandy and lithosols on sandstone 400 20–1,500 Light loamy soils 555 70–1,000 Loess and soils on silt deposits 675 200–1,500 Clay and clay loamy soils 535 150–1,500 Alluvial soils 660 200–1,500 Soils over granite and gneisses 785 300–1,500 Soils over volcanic rocks 770 500–1,500 Soils over limestones and calcareous rocks 520 150–1,500 Soils on glacial till and drift 765 300–1,500 Light desert soils 835 300–2,000 Silty prairie soils 765 200–1,500 Chernozems and dark prairie soils 595 100–1,000 Organic light soils 265 10–700 Forest soils 505 150–2,000 Various soils 560 70–3,000 Mean concentration in Earth’s crustd 500 — Mean concentration in Earth’s cruste 425 —
aData obtained from Kabata-Pendias and Pendias (1984) unless indicated otherwisebData are for whole soil profiles cConcentrations expressed as ppm dry weightdZenz et al. 1994 eLide 2000
Source: Adapted from EPA 1995a
125 BARIUM AND BARIUM COMPOUNDS
6. POTENTIAL FOR HUMAN EXPOSURE
weight, respectively (Phillips et al. 1998). These values were higher (although not statistically
significant) than the values of 869 and 687 mg/kg dry weight measured in surficial and suspended
sediments, respectively, collected at a distance of 1,000 meters from the platform and are similar to the
predrilling concentrations of barium in these sediments. In other California coastal sediments, for
example the Southern California Bight, barium concentrations range from 145 to 1,259 ppm with an
average of 720 ppm (Chow et al. 1978). Median barium concentration ranges in sediments from the lake
system in Chiapas, Mexico were 54.4–121.2 and 50.3–155.3 μg/g dry weight in three lakes during the dry
(June 2002) and rainy (September 2000) seasons, respectively (Pascual-Barrera et al. 2004). This lake
system is an area of petroleum extraction and processing. Barium concentrations ranging from 180 to
2,800 μg/g dry weight (mean 729 μg/g dry weight) were reported in surface sediments (<63 μm fraction)
collected in April 2002 from eight stations in Izmit Bay, Turkey (Pekey 2006).
Barium has been detected in soil and sediment samples collected at 369 and 260 of the 798 hazardous
waste sites, respectively, where barium has been detected in some environmental medium (HazDat 2006).
The HazDat information includes data from both NPL and other Superfund sites. Maximum
concentrations of barium in soil (topsoil, <3 inches depth) ranged from 1.59 to 13,000 ppm in 84 onsite
samples (HazDat 2006). In comparison, maximum concentrations of barium in soil (topsoil, <3 inches
depth) ranged from 3 to 54,700 ppm in 28 offsite samples (HazDat 2006). Maximum concentrations of
barium in sediment (lakes, streams, ponds, etc.) ranged from 13.1 to 17,600 ppm in 36 onsite samples
(HazDat 2006). In comparison, maximum concentrations of barium in sediment (lakes, streams, ponds,
etc.) ranged from 0.156 to 26,400 ppm in 92 offsite samples (HazDat 2006).
6.4.4 Other Environmental Media
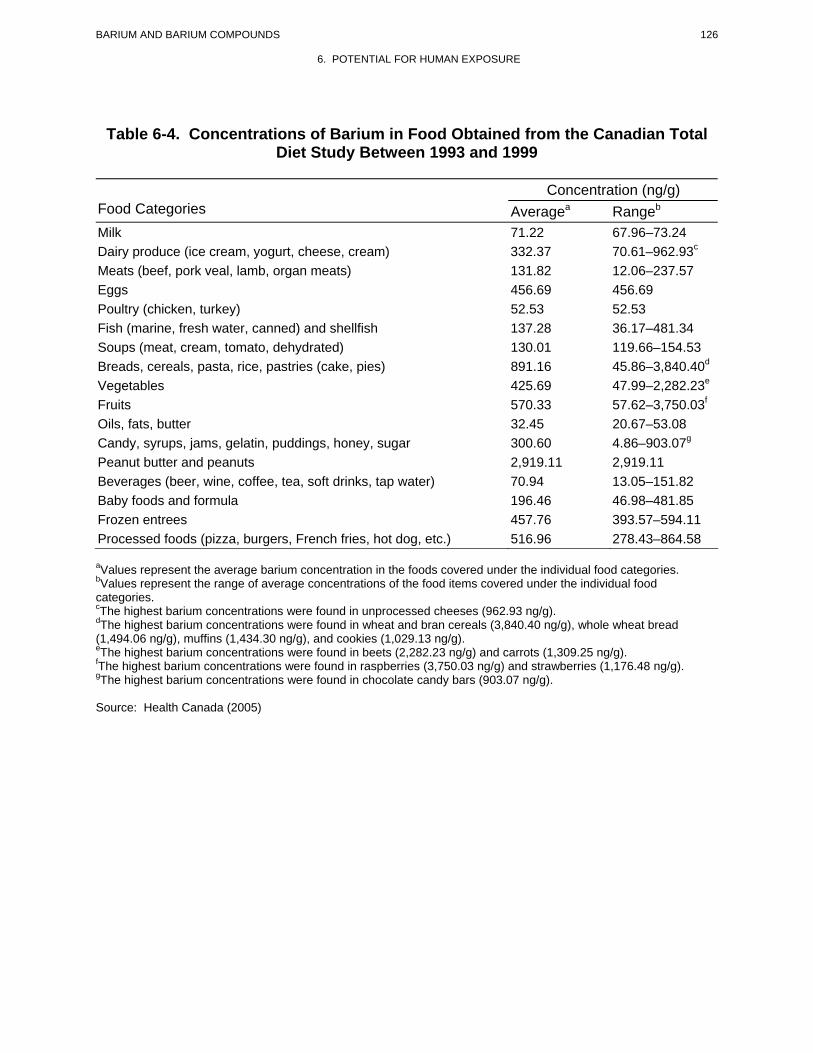
Barium occurs in many foods at generally low levels (Table 6-4). In the Canadian Total Diet Study, the
concentrations of barium were found to be less than 4 ppm (4,000 ng/g) in a variety of foods (Health
Canada 2005). However, Brazil nuts have notably high concentrations of barium (3,000–4,000 ppm)
(Beliles 1979). Some plants bioconcentrate barium from the soil (Beliles 1979; Reeves 1979; Schroeder
1970). The barium content in corn samples from Georgia, Missouri, and Wisconsin collected during a
number of field studies ranged from 5 to 150 ppm with mean concentrations ranging from 15 to 54 ppm
(Connor and Shacklette 1975). The barium content in other cultivated plants (e.g., lima beans, cabbage,
soybeans, and tomatoes) from Georgia, Missouri, and Wisconsin ranged from 7 to 1,500 ppm with mean
concentrations in various plants ranging between 38 and 450 ppm. The highest levels occurred in
126 BARIUM AND BARIUM COMPOUNDS
6. POTENTIAL FOR HUMAN EXPOSURE
Table 6-4. Concentrations of Barium in Food Obtained from the Canadian Total Diet Study Between 1993 and 1999
Concentration (ng/g) Food Categories Averagea Rangeb
Milk 71.22 67.96–73.24 Dairy produce (ice cream, yogurt, cheese, cream) 332.37 70.61–962.93c
Meats (beef, pork veal, lamb, organ meats) 131.82 12.06–237.57 Eggs 456.69 456.69 Poultry (chicken, turkey) 52.53 52.53 Fish (marine, fresh water, canned) and shellfish 137.28 36.17–481.34 Soups (meat, cream, tomato, dehydrated) 130.01 119.66–154.53 Breads, cereals, pasta, rice, pastries (cake, pies) 891.16 45.86–3,840.40d
Vegetables 425.69 47.99–2,282.23e
Fruits 570.33 57.62–3,750.03f
Oils, fats, butter 32.45 20.67–53.08 Candy, syrups, jams, gelatin, puddings, honey, sugar 300.60 4.86–903.07g
Peanut butter and peanuts 2,919.11 2,919.11 Beverages (beer, wine, coffee, tea, soft drinks, tap water) 70.94 13.05–151.82 Baby foods and formula 196.46 46.98–481.85 Frozen entrees 457.76 393.57–594.11 Processed foods (pizza, burgers, French fries, hot dog, etc.) 516.96 278.43–864.58
aValues represent the average barium concentration in the foods covered under the individual food categories. bValues represent the range of average concentrations of the food items covered under the individual foodcategories. cThe highest barium concentrations were found in unprocessed cheeses (962.93 ng/g). dThe highest barium concentrations were found in wheat and bran cereals (3,840.40 ng/g), whole wheat bread (1,494.06 ng/g), muffins (1,434.30 ng/g), and cookies (1,029.13 ng/g). eThe highest barium concentrations were found in beets (2,282.23 ng/g) and carrots (1,309.25 ng/g). fThe highest barium concentrations were found in raspberries (3,750.03 ng/g) and strawberries (1,176.48 ng/g). gThe highest barium concentrations were found in chocolate candy bars (903.07 ng/g).
Source: Health Canada (2005)
127 BARIUM AND BARIUM COMPOUNDS
6. POTENTIAL FOR HUMAN EXPOSURE
cabbage from Georgia and soybeans from Missouri and the lowest levels occurring in Georgia tomatoes
(Connor and Shacklette 1975).
Grippo et al. (2006) measured various metal concentrations in dietary supplements purchased from
random local vendors in the Little Rock, Arkansas area between 2002 and 2003. Barium concentrations
in botanicals were 0.0200 and 15.4 ng/g in samples of milk thistle and kava kava, respectively. Barium
concentrations in ephedra-containing supplements were 0.0400 and 93.3 ng/g in Virgin Earth and
Xenadrine RFA-1, respectively. The authors noted that all metals measured in this study were detected at
concentrations below toxic levels or physiological limits for daily intake, where such limits have been
identified (Grippo et al. 2006).
The Wyoming Game and Fish Department collected game fish during the 2000–2001 season to survey the
state’s fisheries for metal contamination. Ninety-six fish composites (fillets) were collected, representing
11 species, from 28 lakes and reservoirs across Wyoming. In this study, barium concentrations were at or
below the method detection limit of 0.05 mg/kg (Dailey et al. 2005). Mean barium concentrations
ranging from 0.057 to 0.255 mg/kg wet weight were reported in muscle tissue of five species of sturgeons
collected from the Caspian Sea (Pourang et al. 2005).
Barium is also found in anaerobic sewage sludge at concentrations ranging from 100 to 9,000 ppm (mean
concentration of 800 ppm) and in aerobic sewage sludge at concentrations ranging from 100 to 300 ppm
(mean concentration of 200 ppm) (Sommers 1977).
Barium concentrations in leachates from municipal landfills range from 0.11 to 9,220 μg/L (EPA 1990,
1991; Roy 1994).
Barium concentrations in fertilizers and soil amendments range from <0.2 to 669 μg/g mean (Raven and
Loeppert 1997). The highest levels are in tilemsi phosphate rock (669 μg/g), austenite (408 μg/g),
milorganite (165 μg/g), manure (153 μg/g), and compost (131 μg/g). There is some concern that
continued use of fertilizers and soil amendments, which contain high amounts of barium and other metals,
may result in an accumulation of barium in agricultural soils. The accumulation of barium in soils that is
due to the continued use of fertilizers and soil amendments and the potential for increased content of
barium in agricultural products and potential harm to the environment have not yet been assessed (Raven
and Loeppert 1997).
128 BARIUM AND BARIUM COMPOUNDS
6. POTENTIAL FOR HUMAN EXPOSURE
6.5 GENERAL POPULATION AND OCCUPATIONAL EXPOSURE
The primary routes of exposure of humans to barium are consumption of food and water and inhalation of
ambient air (ICRP 1974; Reeves 1979; WHO 2001). Based on compliance monitoring data from the
Federal Reporting Data System (FRDS), of the approximately 214 million people in the United States
who are connected to a public water supply, it is estimated that about 150,000 people are exposed to
barium concentrations greater than EPA's MCL of 2.0 mg/L (2,000 μg/L) (EPA 2002a). However, since
94% of all samples collected from public water supplies of the 100 largest cities in the United States had
barium concentrations <100 μg/L (Durfor and Becker 1964), it is likely that most of the people connected
to a public water supply receive drinking water with barium concentrations below the MCL. In a survey
of drinking water from residences in EPA Region V (Indiana, Illinois, Michigan, Minnesota, Ohio, and
Wisconsin) taken from the National Human Exposure Assessment Survey (NHEXAS) in 1995, an
average barium concentration of 30 μg/L was obtained, with a 90th percentile value of 77 μg/L (Thomas et
al. 1999). Assuming an average adult drinking water consumption rate of 2 L/day and that barium is
present at concentrations of 30 μg/L, the average adult daily intake of barium through the consumption of
drinking water would be 60 μg/day (0.86 μg/kg/day for a 70-kg adult). However, the International
Commission for Radiation Protection (ICRP) estimates that the gastrointestinal absorption of barium is
<5% (ICRP 1973).
The International Commission on Radiological Protection (ICRP 1974) has estimated that intake of
barium through inhalation ranges from 0.09 to 26 μg/day. Based on reported urban air concentrations for
barium (<0.005–1.5 μg/m3) (Tabor and Warren 1958) and assuming an average adult ventilation rate of
20 m3/day (EPA 1989), the calculated daily respiratory intake of barium ranges from <0.1 to 30 μg, which
is comparable to the ICRP estimated intake range above. Based on the 8-hour time-weighted average
threshold limit value (TLV) in workplace air of 500 μg/m3 (ACGIH 2004), and assuming an 8-hour
inhalation of 10 m3 of air, a daily barium workplace intake of 5,000 μg can be calculated. NAS (1977)
estimated that 75% of inhaled barium could be absorbed into the bloodstream if soluble barium salts were
involved.
Since average ground level concentrations of an emission vary with the distance from the emission point,
the population around a source site will be exposed to differing emission levels. Using an average
population density of 27 persons/km2 (based on actual population data from areas surrounding barium
production and processing plants), it has been estimated that approximately 0–886 persons within an area
of up to 32.8 km2 around a source site could be exposed to soluble barium compound concentrations of
129 BARIUM AND BARIUM COMPOUNDS
6. POTENTIAL FOR HUMAN EXPOSURE
>1.67 μg/m3 in ambient air (Reznik and Toy 1978). Assuming that the average adult daily ventilation rate
is 20 m3 (EPA 1989), breathing these ambient air barium concentrations would result in daily respiratory
intakes of >32 μg. No other correlations have been established between barium concentrations in air and
geographical areas or land-use types.
The day-to-day intake of barium is likely to vary with the quantity and types of food ingested since the
barium content in foods varies widely (Schroeder 1970). Based on consumption of food and beverages in
long-term balance studies of four individuals, daily barium intake was estimated to range from 650 to
1,770 μg/day, or from 9.30 to 25.3 μg/kg body weight/day based on an adult weight of 70 kg (Tipton et al.
1966, 1969). Assuming an estimated average barium intake of 60 μg/day from drinking water that is
based on the barium concentrations in drinking water obtained in the NHEXAS EPA Region V study
(Thomas et al. 1999) and a consumption of 2 L of water per day, the barium intake from the consumption
of non-drinking water dietary sources alone would range from 590 to 1,710 μg/day. Thus, food is
typically the primary source of barium exposure for the general population. Gastrointestinal absorption of
barium from food was reported to be approximately 6% (ranging from 1 to 15%) (ICRP 1974). However,
reevaluation of this ICRP data and the data from other studies (Harrison et al. 1956; LeRoy et al. 1966);
Tipton et al. 1969, Schroeder et al. 1972) using the methods of re-estimating barium absorption, which are
based on current information of systemic kinetics of barium (Leggett 1992), suggest that gastrointestinal
absorption of barium may be higher, generally ranging between 7 and 30% and could be as high as 95%
in some individuals.
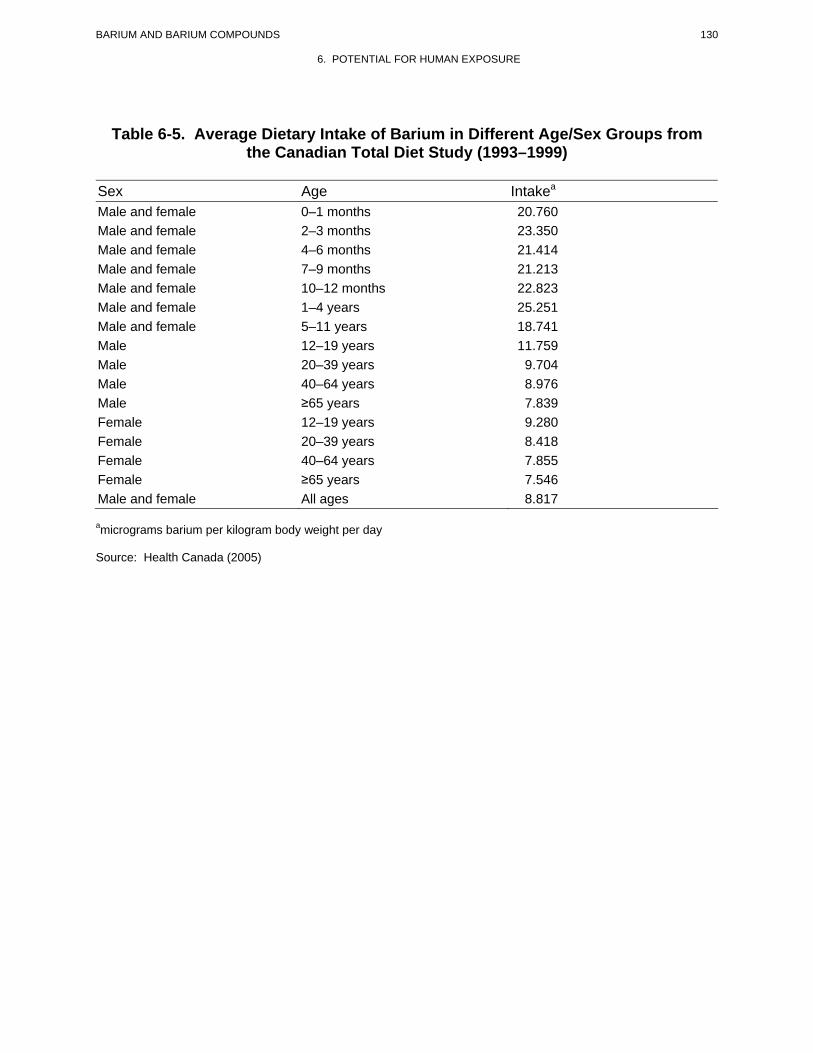
In the Canadian Total Diet Study (TDS) of 1993–1999, the average barium intake in individuals surveyed
was found to be highest in young children (Health Canada 2005). The average barium intake ranged from
20.760 to 25.251 μg/kg body weight/day for children ages 0–4 years old (Table 6-5). For individuals
older than 4 years, the average barium intake decreased for both males and females with increasing age to
values of 9.704 (20–39 years) and 7.839 (>65 years) μg/kg body weight/day in males and 8.418 (20–
39 years) and 7.546 (>65 years) μg/kg body weight) in females. The average daily barium intakes from
the Canadian TDS for males and females of all ages (8.817 μg/kg body weight/day) is in reasonable
agreement with the low end of the daily intake range for barium of 9.30 μg/kg body weight/day
determined by Tipton et al. (1966, 1969).
Mean daily balances (excluding loss via hair and sweat) determined from long-term balance studies of
four adult subjects ranged from a negative balance of 800 μg to a positive balance of 890 μg (Tipton et
al. 1966, 1969). Based on data from these studies, Schroeder (1970) estimated that human daily intake
130 BARIUM AND BARIUM COMPOUNDS
6. POTENTIAL FOR HUMAN EXPOSURE
Table 6-5. Average Dietary Intake of Barium in Different Age/Sex Groups from the Canadian Total Diet Study (1993–1999)
Sex Age Intakea
Male and female 0–1 months 20.760 Male and female 2–3 months 23.350 Male and female 4–6 months 21.414 Male and female 7–9 months 21.213 Male and female 10–12 months 22.823 Male and female 1–4 years 25.251 Male and female 5–11 years 18.741 Male 12–19 years 11.759 Male 20–39 years 9.704 Male 40–64 years 8.976 Male ≥65 years 7.839 Female 12–19 years 9.280 Female 20–39 years 8.418 Female 40–64 years 7.855 Female ≥65 years 7.546 Male and female All ages 8.817
amicrograms barium per kilogram body weight per day
Source: Health Canada (2005)
131 BARIUM AND BARIUM COMPOUNDS
6. POTENTIAL FOR HUMAN EXPOSURE
from food (1,160 μg), water (80 μg), and air (10 μg) would be approximately 1,250 μg, and that loss from
urine (180 μg), feces (1,010 μg) and other sources (e.g., sweat and hair) (85 μg) would be 1,275 μg.
Using these latter estimates of barium intake and loss, a negative barium balance of 25 μg would occur.
According to ICRP, the average daily intake of barium from food and fluids (750 μg) and ambient air
(0.09–26 μg) ranges from 750 to 776 μg. In addition, ICRP (1974) estimated that approximately 825 μg
of barium is lost daily through the urine (50 μg), feces (690 μg), sweat (10 μg), and hair (75 μg). These
intake and loss estimates indicate a negative daily balance of up to 75 μg. However, these negative daily
balance values of 25 and 75 μg are not significant. Also, it is not expected that a negative daily balance
would maintain a total body content of barium for a 70-kg adult of 22,000 μg, a value that was estimated
from a study of barium content in major human organs and tissues (ICRP 1974; Schroeder et al. 1972).
Ninety-three percent of this barium was found in bone and connective tissue. The remaining 7% of
barium exists largely in fat, skin, and lungs.
Barium content in the human population has been determined in urine and major organs and tissues in
more current studies. Barium concentrations in urine for the United States population aged 6 years and
older were measured in the Third National Health and Nutrition Examination Survey (NHANES). The
geometric mean (95% confidence interval) for the creatinine-adjusted levels of barium in urines for all
ages was 1.44 (1.31–1.58) μg per gram of creatinine (CDC 2005). Within age groups, the geometric
means for the barium concentration in urine decreased as a function of age, from 2.20 μg per gram of
creatinine (6–11 years) to 1.45 μg per gram of creatinine (12–19 years) and 1.37 μg per gram of creatinine
(20 years and older). The geometric mean concentration of barium in females (1.59 μg per gram of
creatinine) was slightly higher than in males (1.30 μg per gram of creatinine). As a function of ethnicity,
non-Hispanic whites had the highest geometric mean barium concentrations (1.62 μg per gram of
creatinine) followed by Mexican Americans (1.18 μg per gram of creatinine) and non-Hispanic African
Americans (0.891 μg per gram of creatinine). A median urinary concentration of 1,146 ng/L (range 295–
5,250 ng/L) was reported in urine of 50 healthy individuals, aged 20–68 years, in central Italy (Alimonti
et al. 2005).
Occupational exposure to barium primarily occurs in workers and miners who inhale barium sulfate (or
the ore, barite) and barium carbonate dust during the mining of barite and the manufacturing and
processing (e.g., mixing, grinding, and loading) of barium compounds (Beliles 1979; Reznik and Toy
1978; Schroeder 1970). Inhalation exposure to barium is also known to occur for industrial welders,
especially those using barium-containing stick electrodes and self-shielded flux core wires, and those
132 BARIUM AND BARIUM COMPOUNDS
6. POTENTIAL FOR HUMAN EXPOSURE
working in ceramic factories (Ramakrishna et al. 1996; Roig-Navarro et al. 1997; WHO 2001; Zschiesche
et al. 1992).
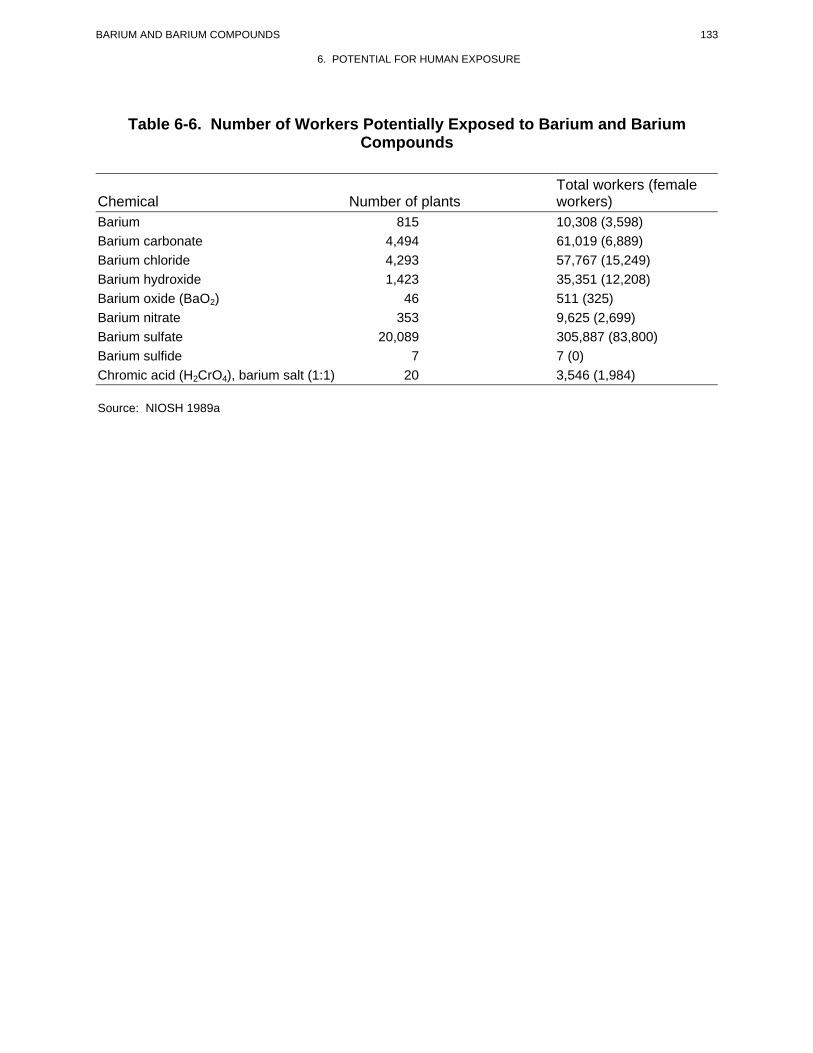
Data from a workplace survey, the National Occupational Exposure Survey (NOES), conducted by
NIOSH from 1980 to 1983, estimated the number of workers potentially exposed to various chemicals in
the workplace in 1980 (NIOSH 1989a), including a separate tally of female workers. The data for barium
and barium compounds included in the survey are summarized in Table 6-6. The NOES database does
not contain information on the frequency, concentration, or duration of exposure of workers to any of the
chemicals listed therein. This is a survey that provides only estimates of the number of workers
potentially exposed to chemicals in the workplace.
6.6 EXPOSURES OF CHILDREN
This section focuses on exposures from conception to maturity at 18 years in humans. Differences from
adults in susceptibility to hazardous substances are discussed in Section 3.7, Children’s Susceptibility.
Children are not small adults. A child’s exposure may differ from an adult’s exposure in many ways.
Children drink more fluids, eat more food, breathe more air per kilogram of body weight, and have a
larger skin surface in proportion to their body volume. A child’s diet often differs from that of adults.
The developing human’s source of nutrition changes with age: from placental nourishment to breast milk
or formula to the diet of older children who eat more of certain types of foods than adults. A child’s
behavior and lifestyle also influence exposure. Children crawl on the floor, put things in their mouths,
sometimes eat inappropriate things (such as dirt or paint chips), and spend more time outdoors. Children
also are closer to the ground, and they do not use the judgment of adults to avoid hazards (NRC 1993).
The main exposures of children to barium are expected to occur mainly from the diet or by dermal contact
with barium-containing dust, with minor exposures through barium in air. Data on the daily intake of
barium in the total diet of children in the United States were not located in the available literature.
However, the average daily intake of barium in children has been determined in a Canadian Total Diet
Study (1993–1999), showing that children ages 0–48 months have the highest barium intake through their
diet in comparison to older children (>4 years) and adults (Health Canada 2005). The average barium
intake in young male and female children increased from 20.760 for infants (0–1 month) to 25.251 μg/kg
body weight/day for children ages 1–4 years (Table 6-5). For older children (>4 years), there is a
continual decrease in the average daily barium intake, with values of 18.741 μg/kg body weight/day for
133 BARIUM AND BARIUM COMPOUNDS
6. POTENTIAL FOR HUMAN EXPOSURE
Table 6-6. Number of Workers Potentially Exposed to Barium and Barium Compounds
Total workers (female Chemical Number of plants workers) Barium 815 10,308 (3,598)
Barium carbonate 4,494 61,019 (6,889) Barium chloride 4,293 57,767 (15,249) Barium hydroxide 1,423 35,351 (12,208) Barium oxide (BaO2) 46 511 (325)
Barium nitrate 353 9,625 (2,699) Barium sulfate 20,089 305,887 (83,800) Barium sulfide 7 7 (0) Chromic acid (H2CrO4), barium salt (1:1) 20 3,546 (1,984)
Source: NIOSH 1989a
134 BARIUM AND BARIUM COMPOUNDS
6. POTENTIAL FOR HUMAN EXPOSURE
individuals aged 5–11 years and then down to 11.759 μg/kg body weight/day for males and 9.280 μg/kg
body weight/day for females aged 12–19 years. It is expected that the data obtained from the Canadian
Total Diet Study will reasonably approximate the daily barium intake for children living in the United
States. It is estimated that for children in the United States, the barium intake through drinking water will
range between 36 and 60 μg/day. This estimate is based on an average concentration of 30 μg barium/L
in drinking water within the United States (Thomas et al. 1999) and the consumption of 1.2–2.0 L
water/day. A factor to be taken into account is that fractional intestinal absorption of metals in young
children, as in young mammals, may be higher than in adults (Foulkes and Bergman 1993). Dermal
contact with barium in household dust is not expected to result in uptake of barium through the skin. Oral
intake of barium through hand-to-mouth exposures to barium-containing dust is likely to occur.
However, it is not known how much barium is taken in through this route of exposure. There is also the
potential of oral intake of barium through the licking or ingestion of crayons or water colors, but it is not
known how much barium is ingested or how much is bioavailable (Rastogi and Pritzl 1996).
Dietary intake of barium in 3-month-old infants has been given by Biego et al. (1998) for exclusive
consumption of various types of milk. The average barium intake from the consumption of breast milk
only was determined to be 4 μg/day. Barium intake increases with exclusive consumption of bottled milk
(39 μg/day), evaporated milk (42 μg/day), formula (44 μg/day), and dried milk (59 μg/day). The highest
average intake of barium occurred with exclusive consumption of soya milk (91 μg/day). These intakes
are based on an average daily intake of milk of 700 mL.
6.7 POPULATIONS WITH POTENTIALLY HIGH EXPOSURES
The general population is commonly exposed to barium primarily through ingestion of drinking water and
consumption of food and beverages. However, certain populations face greater than average exposures to
this element due to environmental sources, such as drinking water (EPA 1987). High levels of barium
have been reported in groundwater from deep rock and drift wells in several communities in northeastern
Illinois (Brenniman et al. 1981; Calabrese 1977) where barium is a naturally occurring geochemical
pollutant found almost exclusively in the Cambrian-Ordovician Aquifer (Gilkeson et al. 1978). Other
populations that might receive increased exposure to barium are consumers of crops grown on soils that
have been used for the land farming of waste oil-well drilling muds (Bates 1988). Individuals who work
at or live near barium mining, manufacturing, or processing plants might inhale higher ambient air
concentrations or increased amounts of fugitive dust containing barium particulates. Populations living in
the vicinity of the NPL sites known to be contaminated with barium may also be exposed to higher than
BARIUM AND BARIUM COMPOUNDS 135
6. POTENTIAL FOR HUMAN EXPOSURE
background levels of the compound through contact with contaminated waste site media or barium in
offsite air or water. Barium has been measured in air, surface water, and groundwater collected offsite of
some NPL sites (HazDat 2006). No information was found regarding the sizes of these populations or
their intake levels of barium.
6.8 ADEQUACY OF THE DATABASE
Section 104(i)(5) of CERCLA, as amended, directs the Administrator of ATSDR (in consultation with the
Administrator of EPA and agencies and programs of the Public Health Service) to assess whether
adequate information on the health effects of barium is available. Where adequate information is not
available, ATSDR, in conjunction with NTP, is required to assure the initiation of a program of research
designed to determine the health effects (and techniques for developing methods to determine such health
effects) of barium.
The following categories of possible data needs have been identified by a joint team of scientists from
ATSDR, NTP, and EPA. They are defined as substance-specific informational needs that if met would
reduce the uncertainties of human health assessment. This definition should not be interpreted to mean
that all data needs discussed in this section must be filled. In the future, the identified data needs will be
evaluated and prioritized, and a substance-specific research agenda will be proposed.
6.8.1 Identification of Data Needs
Physical and Chemical Properties. The physical and chemical properties of metallic barium and
its inorganic compounds have been well characterized (Boffito 2002; CHRIS Manual 2005; Dibello et al.
2003; DOT 2004; Genter 2001; HSDB 2007; Kresse et al. 2007; Lewis 1997; Lide 2005; NIOSH/OSHA
1978; NIOSH 1999; Budavari et al. 2001; OHM/TADS 1989; Parmeggiani 1983; Perry and Chilton 1973;
RTECS 2007; Lewis 2000; Stokinger 1981; Weast 1989). Physical and chemical properties of organic
compounds of barium have not been comprehensively examined probably due to the limited extent of
formation of these compounds. However, further study of the properties of these compounds would help
in understanding their role in the environmental fate and transport of barium, particularly at hazardous
waste sites where high levels of organic contaminants might be present.
Production, Import/Export, Use, Release, and Disposal. According to the Emergency
Planning and Community Right-to-Know Act of 1986, 42 U.S.C. Section 11023, industries are required
to submit substance release and off-site transfer information to the EPA. The TRI, which contains this
BARIUM AND BARIUM COMPOUNDS 136
6. POTENTIAL FOR HUMAN EXPOSURE
information for 2004, became available in May of 2006. This database is updated yearly and should
provide a list of industrial production facilities and emissions.
Because barium compounds occur naturally and are widely used in oil well drilling muds, in steel, rubber
and plastic products, glass and ceramics, chemical, and pyrotechnics industries, in insecticides, and as a
smoke suppressant in diesel fuels (Bodek et al. 1988; Dibello et al. 2003; ILO 1983; Kirkpatrick 1985;
Meister 2004; Stokinger 1981; Venugopal and Luckey 1978; WHO 2001; Worthing 1987), the potential
for human exposure to these compounds, such as through ingestion of food and water or inhalation of
ambient air, is substantial. Recent data on production volumes and import and export of barite and some
barium compounds (e.g., barium chloride, barium carbonate, barium hydroxide, and barium oxide) are
available (USGS 2006). In addition, only limited information on disposal of barium compounds was
available (HSDB 2007; IPCS 1991; NIOSH/OSHA 1978). Additional information on production, import,
export, and disposal would be useful in assessing the potential for the release of, and exposure to, barium
compounds.
Environmental Fate. The partitioning of barium in environmental media is influenced by the specific
form of the compound and such site-specific conditions as pH and cation exchange capacity (Bates 1988;
Bodek et al. 1988; Bowen 1966; Giusti et al. 1993; Kabata-Pendias and Pendias 1984; Lagas et al. 1984;
Tanizaki et al. 1992). Upon release to the environment, barium is most likely to partition to soils and
sediments (Chow et al. 1978; DOE 1984; Rai et al. 1984; WHO 2001). Barium is transported in the
atmosphere, surface waters, soil runoff, and groundwater. In surface waters and soils, barium may ionize
and form various salts depending on the pH and the availability of anions (Bates 1988; Bodek et al. 1988;
Bowen 1966; Kabata-Pendias and Pendias 1984; Lagas et al. 1984; WHO 2001). Additional information
on the transport and transformation of barium in the atmosphere would be useful in developing a more
complete understanding of the environmental fate of barium compounds.
Bioavailability from Environmental Media. Barium is absorbed following ingestion (Chou and
Chin 1943; Cuddihy and Griffith 1972; McCauley and Washington 1983; Taylor et al. 1962) and
inhalation (Cuddihy and Ozog 1973b). The bioavailability of barium from air, water, and food has been
examined rather extensively in animals (Chou and Chin 1943; Cuddihy and Griffith 1972; McCauley and
Washington 1983; Taylor et al. 1962) and humans (Tipton et al. 1969). However, bioavailability from
soil has not been studied. Since soil is an important repository for barium, information on barium
absorption from ingested soil would be useful in developing an understanding of the potential for
exposure following ingestion of contaminated soils, particularly at hazardous waste sites.
BARIUM AND BARIUM COMPOUNDS 137
6. POTENTIAL FOR HUMAN EXPOSURE
Food Chain Bioaccumulation. There is information that barium bioconcentrates in certain plants
and aquatic organisms (Aruguete et al. 1998; Bowen 1966; Hope et al. 1996; IPCS 1991; Schroeder 1970;
WHO 2001). However, the extent to which plants bioconcentrate barium from soil or to which uptake
occurs in terrestrial animals is not well characterized. Further studies on the bioconcentration of barium
by plants and terrestrial animals and on the biomagnification of barium in terrestrial and aquatic food
chains would be useful to better characterize the environmental fate of barium and define the importance
of food chain accumulation as a source of human exposure.
Exposure Levels in Environmental Media. Reliable monitoring data for the levels of barium in
contaminated media at hazardous waste sites are needed so that the information obtained on levels of
barium in the environment can be used in combination with the known body burden of barium to assess
the potential risk of adverse health effects in populations living in the vicinity of hazardous waste sites.
The need for additional information on the relationship between barium exposure and levels of barium
achieved in vivo is essential if such concentrations are to be used as biomonitors of exposure.
Barium has been detected in the atmosphere (Bowen 1979; EPA 1984; Hildemann et al. 1991; IPCS
1991; Schauer et al. 1999; Shahin et al. 2000; WHO 2001; Winkler 2002), surface water (Barnett et al.
1969; Bowen 1979; DOI 1970; Durfor and Becker 1964; Durum and Haffty 1961; Elinder and Zenz
1994; EPA 2005c; Kopp 1969; Longerich et al. 1991; McCabe et al. 1970; Neal et al. 1996; Saleh and
Wilson 1999; Tuovinen et al. 1980), groundwater (Bruce and McMahon 1996; Calabrese 1977; Hudak
and Wachal 2001; Kojola et al. 1978), soils (Bowen 1979; Bradley et al. 1994; EPA 1995a; Kabata-
Pendias and Pendias 1984; Lide 2005; Schroeder 1970; Shacklette and Boerngen 1984; Zenz et al. 1994),
and foodstuffs (Beliles 1979; Connor and Shacklette 1975; Health Canada 2005; Schroeder 1970). There
are reliable data to characterize the potential for human exposure via intake of drinking water (Durfor and
Becker 1964; Hadjimarkos 1967; Thomas et al. 1999), and foods (Health Canada 2005; Tipton et al.
1966, 1969). Recent data on barium levels in plants and ambient air, soils, and groundwater, particularly
from hazardous waste sites, would be useful in helping to develop a more complete understanding of the
potential for human exposure.
Exposure Levels in Humans. Barium can be detected in blood, urine, feces, and biological tissues
(CDC 2001, 2003; Mauras and Allain 1979; Schramel 1988; Shiraishi et al. 1987). However, there are no
data correlating barium levels in tissues and fluids with exposure levels. Recent biomonitoring data exist
for the U.S. general population (CDC 2005), although there are limited monitoring data for occupational
138 BARIUM AND BARIUM COMPOUNDS
6. POTENTIAL FOR HUMAN EXPOSURE
exposure and for populations living near hazardous waste sites. This information is necessary for
assessing the need to conduct health studies on these populations.
Exposures of Children. Child health data needs relating to susceptibility are discussed in
Section 3.12.2, Identification of Data Needs: Children’s Susceptibility.
Data on the exposure of children in the United States to barium are very limited. It is expected that the
largest exposure to barium will be through the diet. Therefore, market basket surveys or total diet studies
similar to those conducted by the U.S. Food and Drug Administration would be useful for providing data
on typical levels of exposure via dietary intake for children in the United States. Data are available for
barium intake in Canadian children obtained from a 1993–1999 total diet study (Health Canada 2005) and
in a separate study (Biego et al. 1998) in infants (3 months old) from the exclusive consumption of breast
milk and other types of milk.
Exposure Registries. No exposure registries for barium were located. This substance is not
currently one of the compounds for which a sub-registry has been established in the National Exposure
Registry. The substance will be considered in the future when chemical selection is made for sub-
registries to be established. The information that is amassed in the National Exposure Registry facilitates
the epidemiological research needed to assess adverse health outcomes that may be related to exposure to
this substance.
6.8.2 Ongoing Studies
Three ongoing studies concerning the fate/transport of barium and measurement of barium in
environmental media were identified in the Federal Research in Progress database (FEDRIP 2005).
These studies are summarized in Table 6-7. No other pertinent ongoing studies were identified.
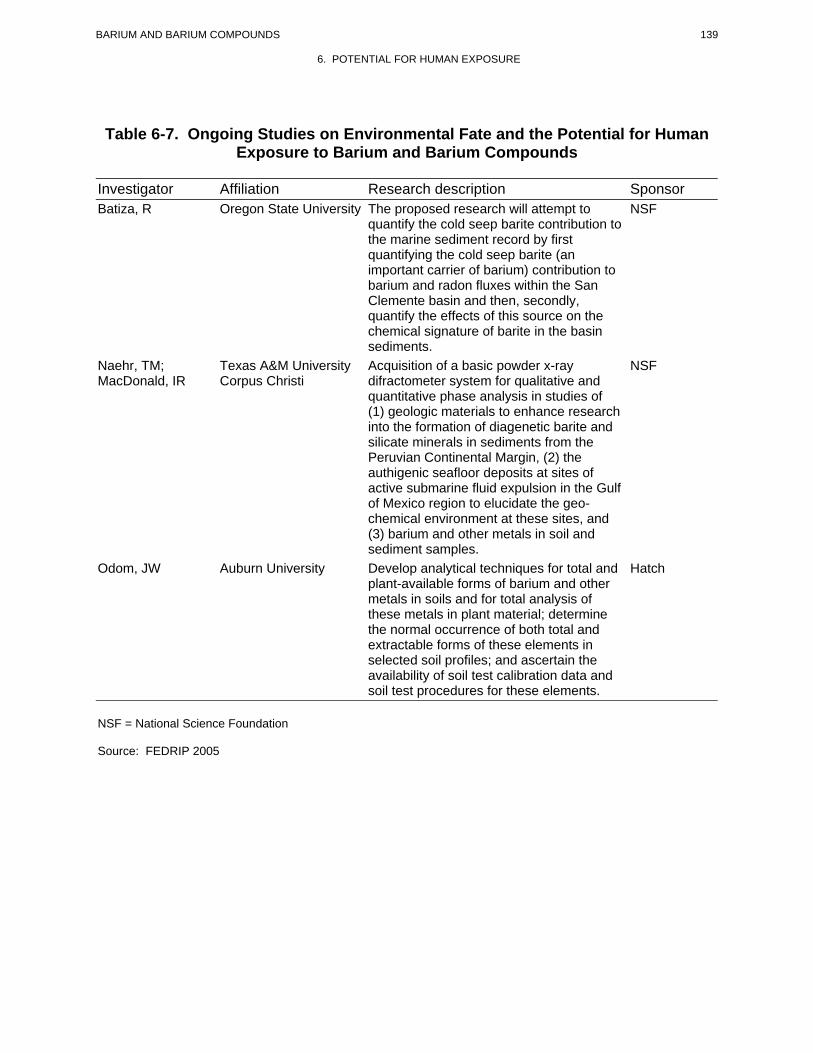
139 BARIUM AND BARIUM COMPOUNDS
6. POTENTIAL FOR HUMAN EXPOSURE
Table 6-7. Ongoing Studies on Environmental Fate and the Potential for Human Exposure to Barium and Barium Compounds
Investigator Affiliation Research description Sponsor Batiza, R Oregon State University The proposed research will attempt to NSF
quantify the cold seep barite contribution to the marine sediment record by first quantifying the cold seep barite (an important carrier of barium) contribution to barium and radon fluxes within the San Clemente basin and then, secondly, quantify the effects of this source on the chemical signature of barite in the basin sediments.
Naehr, TM; Texas A&M University Acquisition of a basic powder x-ray NSF MacDonald, IR Corpus Christi difractometer system for qualitative and
quantitative phase analysis in studies of (1) geologic materials to enhance research into the formation of diagenetic barite and silicate minerals in sediments from the Peruvian Continental Margin, (2) the authigenic seafloor deposits at sites of active submarine fluid expulsion in the Gulf of Mexico region to elucidate the geochemical environment at these sites, and (3) barium and other metals in soil and sediment samples.
Odom, JW Auburn University Develop analytical techniques for total and Hatch plant-available forms of barium and other metals in soils and for total analysis of these metals in plant material; determine the normal occurrence of both total and extractable forms of these elements in selected soil profiles; and ascertain the availability of soil test calibration data and soil test procedures for these elements.
NSF = National Science Foundation
Source: FEDRIP 2005