
TOX-78: Triethylamine (CASRN 121-44-8) Administered by ... · n,n -diethylethanamine;...
118
National Toxicology Program Toxicity Report Series Number 78 NTP Technical Report on the Toxicity Studies of Triethylamine (CAS NO. 121-44-8) Administered by Inhalation to F344/N Rats and B6C3F1/N Mice March 2018 National Institutes of Health Public Health Service U.S. Department of Health and Human Services
-
Upload
nguyendung -
Category
Documents
-
view
215 -
download
0
Transcript of TOX-78: Triethylamine (CASRN 121-44-8) Administered by ... · n,n -diethylethanamine;...

National Toxicology Program Toxicity Report Series Number 78
NTP Technical Report on the Toxicity Studies of
Triethylamine
(CAS NO. 121-44-8)
Administered by Inhalation
to F344/N Rats and B6C3F1/N Mice
March 2018
National Institutes of Health Public Health Service
U.S. Department of Health and Human Services

FOREWORD The National Toxicology Program (NTP) is an interagency program within the Public Health Service (PHS) of the Department of Health and Human Services (HHS) and is headquartered at the National Institute of Environmental Health Sciences of the National Institutes of Health (NIEHS/NIH). Three agencies contribute resources to the program: NIEHS/NIH, the National Institute for Occupational Safety and Health of the Centers for Disease Control and Prevention (NIOSH/CDC), and the National Center for Toxicological Research of the Food and Drug Administration (NCTR/FDA). Established in 1978, the NTP is charged with coordinating toxicological testing activities, strengthening the science base in toxicology, developing and validating improved testing methods, and providing information about potentially toxic substances to health regulatory and research agencies, scientific and medical communities, and the public. The Toxicity Study Report series began in 1991. The studies described in the Toxicity Study Report series are designed and conducted to characterize and evaluate the toxicologic potential of selected substances in laboratory animals (usually two species, rats and mice). Substances selected for NTP toxicity studies are chosen primarily on the basis of human exposure, level of production, and chemical structure. The interpretive conclusions presented in the Toxicity Study Reports are based only on the results of these NTP studies. Extrapolation of these results to other species, including characterization of hazards and risks to humans, requires analyses beyond the intent of these reports. Selection per se is not an indicator of a substance’s toxic potential. The NTP conducts its studies in compliance with its laboratory health and safety guidelines and FDA Good Laboratory Practice Regulations and must meet or exceed all applicable federal, state, and local health and safety regulations. Animal care and use are in accordance with the Public Health Service Policy on Humane Care and Use of Animals. Studies are subjected to retrospective quality assurance audits before being presented for public review. NTP Toxicity Study Reports are indexed in the NIH/NLM PubMed database and are available free of charge electronically on the NTP website (http://ntp.niehs.nih.gov). Additional information regarding this study may be requested through Central Data Management (CDM) at [email protected]. Toxicity data are available through NTP’s Chemical Effects in Biological Systems (CEBS) database: https://www.niehs.nih.gov/research/resources/database/cebs/index.cfm.

National Toxicology Program Toxicity Report Series
Number 78
NTP Technical Report on the Toxicity Studies of
Triethylamine
(CAS No. 121-44-8)
Administered by Inhalation to F344/N Rats and B6C3F1/N Mice
D.L. Morgan, Ph.D., Study Scientist G.P. Flake, M.D., Study Pathologist
National Toxicology Program
Post Office Box 12233 Research Triangle Park, NC 27709
March 2018
National Institutes of Health Public Health Service
U.S. Department of Health and Human Services
2
NOT FOR ATTRIBUTION Peer Review Draft
CONTRIBUTORS
National Toxicology Program Evaluated and interpreted results and reported findings D.L. Morgan, Ph.D., Study Scientist G.P. Flake, M.D., Study Pathologist J.B. Bishop, Ph.D. C.R. Blystone, M.S., Ph.D. P.M. Foster, Ph.D. M.J. Hooth, Ph.D. A.P. King-Herbert, D.V.M. G.E. Kissling, Ph.D. D.E. Malarkey, D.V.M., Ph.D. B.S. McIntyre, Ph.D. M.D. Stout, Ph.D. G.S. Travlos, D.V.M. M.K. Vallant, B.S., M.T. S. Waidyanatha, Ph.D. N.J. Walker, Ph.D. K.L. Witt, M.S. Battelle Toxicology Northwest Conducted studies and evaluated pathology findings J.A. Dill, Ph.D., Principal Investigator S.L. Grumbein, D.V.M., Ph.D. S.J. Harbo, D.V.M. B.K. Hayden R.A. Renne, D.V.M. Experimental Pathology Laboratories, Inc. Provided pathology review M.H. Hamlin, II, D.V.M., Principal Investigator M.M. Gruebbel, D.V.M., Ph.D. J.C. Peckham, D.V.M., M.S., Ph.D. TherImmune Research Corporation Provided SMVCE analysis G.W. Wolfe, Ph.D., Principal Investigator B. Atkinson, M.S. H. Seung, M.S.
Dynamac Corporation Prepared quality assessment audits S. Brecher, Ph.D., Principal Investigator S. Iyer, B.S. V.S. Tharakan, D.V.M. NTP Pathology Peer Review Evaluated slides and contributed to pathology report (3-month studies) (June 3, 2004) M.P. Jokinen, D.V.M., Coordinator
Pathology Associates, A Division of Charles River Laboratories, Inc. J.C. Peckham, D.V.M., M.S., Ph.D.
Experimental Pathology Laboratories, Inc.
Evaluated slides and contributed to pathology report, reevaluation of nose and eye (2-week and 3-month studies) (February 28, 2014) G.P. Flake, M.D., Coordinator
National Toxicology Program A.E. Brix, D.V.M., Ph.D.
Experimental Pathology Laboratories, Inc. M.F. Cesta, D.V.M., Ph.D.
National Toxicology Program D.E. Malarkey, D.V.M., Ph.D.
National Toxicology Program T. Osborne, D.V.M., Ph.D.
National Toxicology Program E. Quist, D.V.M.
National Toxicology Program Evaluated slides and contributed to pathology report, reevaluation of eye (2-week studies; August 7, 2015) (3-month rat study; November 17, 2015) G.P. Flake, M.D., Coordinator
National Toxicology Program M.M. Gruebbel, D.V.M., Ph.D.
Experimental Pathology Laboratories, Inc. R.A. Herbert, D.V.M., Ph.D.
National Toxicology Program D.E. Malarkey, D.V.M., Ph.D.
National Toxicology Program A.R. Pandiri, B.V.Sc & A.H., Ph.D.
National Toxicology Program C.J. Willson, D.V.M., Ph.D.
ILS, Inc.

3
Peer Review Draft NOT FOR ATTRIBUTION
SRA International, Inc. Provided statistical analyses P.W. Crockett, Ph.D., Principal Investigator L.J. Betz, M.S. K.P. McGowan, M.B.A.
Biotechnical Services, Inc. Prepared Toxicity Study Report S.R. Gunnels, M.A., Principal Investigator L.M. Harper, B.S. P. Nader, B.S.E. D.C. Serbus, Ph.D.

4
NOT FOR ATTRIBUTION Peer Review Draft
PEER REVIEW
The draft report on the toxicity studies of triethylamine was evaluated by the reviewers listed below. These reviewers serve as independent scientists, not as representatives of any institution, company, or governmental agency. In this capacity, reviewers determine if the design and conditions of these NTP studies are appropriate and ensure that this Toxicity Study Report presents the experimental results and conclusions fully and clearly. William J. Brock, Ph.D. Brock Scientific Consulting, LLC Montgomery Village, MD Kymberly M. Gowdy, M.S., Ph.D. Department of Pharmacology and Toxicology Brody School of Medicine East Carolina University Greenville, NC
Travis L. Knuckles, Ph.D. School of Public Health West Virginia University Morgantown, WV
5
Peer Review Draft NOT FOR ATTRIBUTION
CONTENTS
ABSTRACT ................................................................................................................................................................. 7 INTRODUCTION ..................................................................................................................................................... 11 Chemical and Physical Properties ........................................................................................................................ 11 Production, Use, and Human Exposure ................................................................................................................ 11 Regulatory Status ................................................................................................................................................. 12 Absorption, Distribution, Metabolism, Excretion, and Toxicokinetics ................................................................ 12 Toxicity ................................................................................................................................................................ 13 Carcinogenicity .................................................................................................................................................... 15 Genetic Toxicity ................................................................................................................................................... 15 Study Rationale .................................................................................................................................................... 15 MATERIALS AND METHODS .............................................................................................................................. 17 Procurement and Characterization of Triethylamine ............................................................................................ 17 Vapor Generation and Exposure System .............................................................................................................. 17 Vapor Concentration Monitoring ......................................................................................................................... 18 Chamber Atmosphere Characterization ................................................................................................................ 18 Animal Welfare .................................................................................................................................................... 19 2-Week Studies ..................................................................................................................................................... 20 3-Month Studies ................................................................................................................................................... 20 Statistical Methods ............................................................................................................................................... 26 Quality Assurance Methods.................................................................................................................................. 26 Genetic Toxicology .............................................................................................................................................. 26 RESULTS ................................................................................................................................................................... 29 Rats ....................................................................................................................................................................... 29 Mice ...................................................................................................................................................................... 40 Genetic Toxicology .............................................................................................................................................. 48 DISCUSSION ............................................................................................................................................................. 49 REFERENCES .......................................................................................................................................................... 53 APPENDIXES Appendix A Summary of Nonneoplastic Lesions in Rats and Mice .......................................................... A-1 Appendix B Genetic Toxicology ................................................................................................................ B-1 Appendix C Clinical Pathology Results ..................................................................................................... C-1 Appendix D Organ Weights and Organ-Weight-to-Body-Weight Ratios ................................................. D-1 Appendix E Reproductive Tissue Evaluations and Estrous Cycle Characterization ................................. E-1 Appendix F Chemical Characterization and Generation of Chamber Concentrations ............................... F-1

6
NOT FOR ATTRIBUTION Peer Review Draft
Appendix G Ingredients, Nutrient Composition, and Contaminant Levels in NTP-2000 Rat and Mouse Ration ...................................................................................... G-1 Appendix H Sentinel Animal Program ....................................................................................................... H-1
7
Peer Review Draft NOT FOR ATTRIBUTION
ABSTRACT
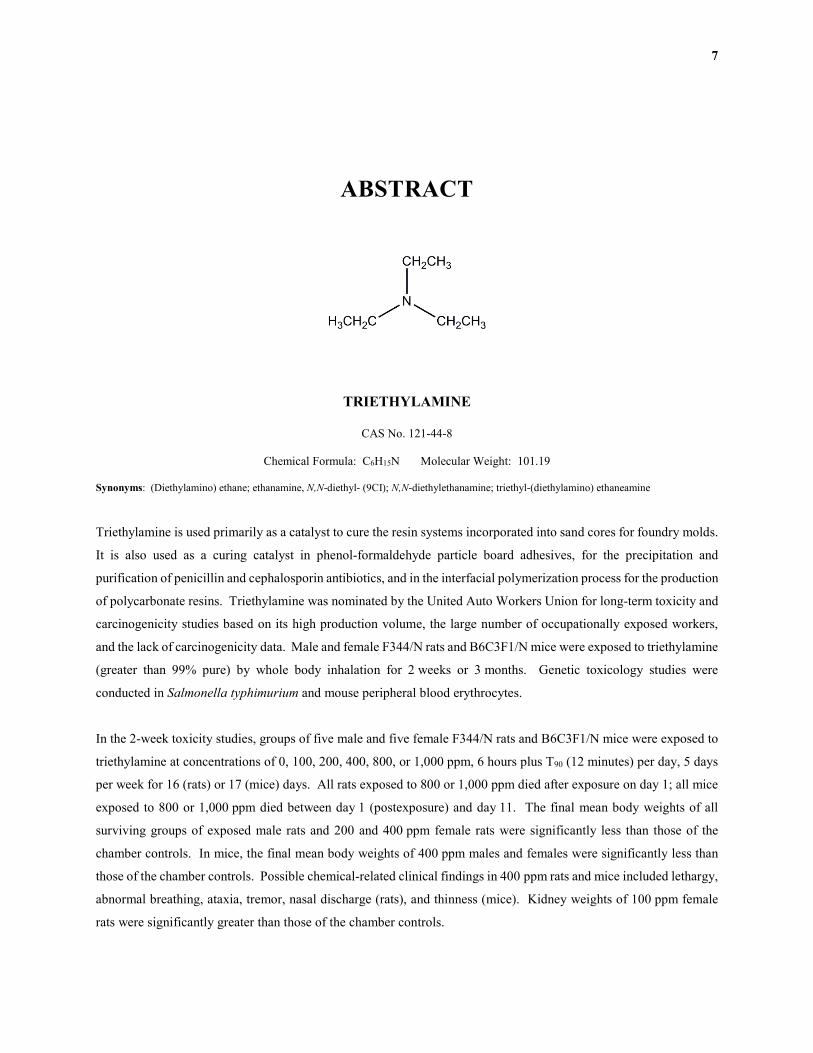
TRIETHYLAMINE
CAS No. 121-44-8
Chemical Formula: C6H15N Molecular Weight: 101.19
Synonyms: (Diethylamino) ethane; ethanamine, N,N-diethyl- (9CI); N,N-diethylethanamine; triethyl-(diethylamino) ethaneamine
Triethylamine is used primarily as a catalyst to cure the resin systems incorporated into sand cores for foundry molds.
It is also used as a curing catalyst in phenol-formaldehyde particle board adhesives, for the precipitation and
purification of penicillin and cephalosporin antibiotics, and in the interfacial polymerization process for the production
of polycarbonate resins. Triethylamine was nominated by the United Auto Workers Union for long-term toxicity and
carcinogenicity studies based on its high production volume, the large number of occupationally exposed workers,
and the lack of carcinogenicity data. Male and female F344/N rats and B6C3F1/N mice were exposed to triethylamine
(greater than 99% pure) by whole body inhalation for 2 weeks or 3 months. Genetic toxicology studies were
conducted in Salmonella typhimurium and mouse peripheral blood erythrocytes.
In the 2-week toxicity studies, groups of five male and five female F344/N rats and B6C3F1/N mice were exposed to
triethylamine at concentrations of 0, 100, 200, 400, 800, or 1,000 ppm, 6 hours plus T90 (12 minutes) per day, 5 days
per week for 16 (rats) or 17 (mice) days. All rats exposed to 800 or 1,000 ppm died after exposure on day 1; all mice
exposed to 800 or 1,000 ppm died between day 1 (postexposure) and day 11. The final mean body weights of all
surviving groups of exposed male rats and 200 and 400 ppm female rats were significantly less than those of the
chamber controls. In mice, the final mean body weights of 400 ppm males and females were significantly less than
those of the chamber controls. Possible chemical-related clinical findings in 400 ppm rats and mice included lethargy,
abnormal breathing, ataxia, tremor, nasal discharge (rats), and thinness (mice). Kidney weights of 100 ppm female
rats were significantly greater than those of the chamber controls.
8 Triethylamine, NTP TOX 78
NOT FOR ATTRIBUTION Peer Review Draft
In the nose of male rats, there were significantly increased incidences of respiratory epithelium hyperplasia in all
surviving exposed groups; significantly increased incidences of suppurative inflammation in the 200 and 400 ppm
groups; significantly increased incidences of turbinate necrosis, squamous metaplasia of the respiratory epithelium,
and respiratory epithelium ulcer in the 400 ppm group; and a significantly increased incidence of olfactory epithelium
atrophy in the 200 ppm group. In the nose of female rats, there were significantly increased incidences of suppurative
inflammation, squamous metaplasia of the respiratory epithelium, and respiratory epithelium ulcer in the 400 ppm
group; significantly increased incidences of respiratory epithelium hyperplasia in the 100 and 200 ppm groups; and a
significantly increased incidence of olfactory epithelium atrophy in the 200 ppm group.
All rats that died early had necrosis of the respiratory epithelium of the nose and necrosis of the bronchus. In the lung
of surviving groups of male and female rats, there were significantly increased incidences of bronchus degeneration
in the 200 and 400 ppm groups and significantly increased incidences of suppurative inflammation and regeneration
of the bronchus in the 400 ppm groups. Rats dying early often showed corneal degeneration or necrosis, and a few
rats in the 100 and 200 ppm groups exhibited subepithelial vesicles of the cornea.
Turbinate necrosis occurred in the nose of all exposed mice except the 100 ppm groups. There were significantly
increased incidences of olfactory epithelium atrophy in the nose of all surviving groups of exposed mice, and
significantly increased incidences of acute inflammation and squamous metaplasia of the respiratory epithelium in
200 and 400 ppm mice.
Lung lesions observed only in the groups with early mortality included necrosis of the bronchus in male and female
mice and cytoplasmic vacuolization of the bronchus in females. In 400 ppm mice, incidences of chronic active
inflammation of the bronchus were increased. Groups of mice with early mortality also had corneal necrosis and
cataracts.
In the 3-month toxicity studies, groups of 10 male and 10 female F344/N rats and B6C3F1/N mice were exposed to
triethylamine at concentrations of 0, 12.5, 25, 50, 100, or 200 ppm, 6 hours plus T90 (12 minutes) per day, 5 days per
week for 14 weeks. All exposed rats and mice survived to the end of the studies. Body weights of 200 ppm rats and
mice were significantly less than those of the chamber controls. In male rats, differences in reproductive parameters
included decreased spermatozoa motility at 50 ppm or greater and increased spermatid heads per mg testis in the 100
and 200 ppm groups.
In the olfactory epithelium of the nose of rats, there were significantly increased incidences of atrophy in males
exposed to 50 ppm or greater and in females exposed to 25 ppm or greater. In the respiratory epithelium of the nose
of rats, there were significantly increased incidences of hyperplasia in males and females exposed to 25 ppm or greater.
In the lung of female rats, there were significantly increased incidences of histiocyte cellular infiltration of the alveolus
Triethylamine, NTP TOX 78 9
Peer Review Draft NOT FOR ATTRIBUTION
in the 100 and 200 ppm groups. Corneal lesions of the eye were noted in four males and six females exposed to
200 ppm.
In the olfactory epithelium of the nose of mice, there were significantly increased incidences of atrophy in males and
females exposed to 50 ppm or greater and significantly increased incidences of cytoplasmic vacuolization in 50 ppm
males and females. In the respiratory epithelium of the nose of mice, there were significantly increased incidences of
squamous metaplasia in 200 ppm males and females. There were significantly increased incidences of turbinate
hyperostosis in all exposed groups of male and female mice and significantly increased incidences of turbinate necrosis
in 200 ppm males and females.
Triethylamine was not mutagenic in any of four strains of S. typhimurium, with or without exogenous metabolic
activation. An equivocal increase, based on a trend test analysis, in the frequency of micronucleated erythrocytes was
observed in peripheral blood of male mice sampled at the end of the 3-month study; no increase in micronucleated
erythrocytes was seen in female mice.
Under the conditions of the 3-month inhalation studies, there were treatment-related lesions in male and female rats
and mice. The major targets of triethylamine exposure in rats and mice included the nose and eyes. In rats, the most
sensitive measure of triethylamine exposure was respiratory epithelium hyperplasia of the nasal cavity with a lowest-
observed-effect level (LOEL) of 12.5 ppm in males and females. In mice, the most sensitive measure of triethylamine
exposure was turbinate hyperostosis of the nasal cavity with a LOEL of 12.5 ppm in males and females.

10 Triethylamine, NTP TOX 78
NOT FOR ATTRIBUTION Peer Review Draft
Summary of Findings Considered to be Toxicologically Relevant in Rats and Mice Exposed to Triethylamine for 3 Months by Inhalation
Male F344/N Rats
Female F344/N Rats
Male B6C3F1/N Mice
Female B6C3F1/N Mice
Exposure concentrations 0, 12.5, 25, 50, 100,
200 ppm 0, 12.5, 25, 50, 100, 200 ppm
0, 12.5, 25, 50, 100, 200 ppm
0, 12.5, 25, 50, 100, 200 ppm
Survival rates 10/10, 10/10, 10/10,
10/10, 10/10, 10/10 10/10, 10/10, 10/10, 10/10, 10/10, 10/10
10/10, 10/10, 10/10, 10/10, 10/10, 10/10
10/10, 10/10, 10/10, 10/10, 10/10, 10/10
Body weights 200 ppm group 13% less
than the chamber control group
200 ppm group 13% less than the chamber control group
200 ppm group 15% less than the chamber control group
200 ppm group 11% less than the chamber control group
Clinical observations No effect observed No effect observed No effect observed No effect observed Organ weights No effect observed No effect observed No effect observed No effect observed Clinical Pathology No effect observed No effect observed No effect observed
(hematology only) No effect observed (hematology only)
Reproductive effects Sperm motility decreased No effect observed No effect observed No effect observed Nonneoplastic effects Nose: respiratory
epithelium, hyperplasia (0/10, 3/10, 9/10, 9/10, 10/10, 10/10); olfactory epithelium, atrophy (0/10, 0/10, 0/10, 10/10, 10/10, 10/10) Eye: cornea, mineralization (0/9, 0/10, 0/10, 0/10, 1/10, 3/10); cornea, epithelium, vacuolation (0/9, 0/10, 0/10, 0/10, 0/10, 2/10); cornea, necrosis (0/9, 0/10, 0/10, 0/10, 0/10, 1/10)
Nose: respiratory epithelium, hyperplasia (0/10, 3/10, 9/10, 10/10, 10/10, 10/10); olfactory epithelium, atrophy (0/10, 0/10, 4/10, 10/10, 10/10, 10/10) Eye: cornea, mineralization (0/10, 0/10, 0/10, 0/10, 0/10, 2/10); cornea, vesicle, subepithelial (0/10, 0/10, 0/10, 0/10, 0/10, 3/10); cornea, necrosis (0/10, 0/10, 0/10, 0/10, 0/10, 1/10)
Nose: turbinate, hyperostosis (0/10, 10/10, 9/10, 10/10, 10/10, 10/10); olfactory epithelium, atrophy (0/10, 0/10, 0/10, 9/10, 10/10, 10/10)
Nose: turbinate, hyperostosis (0/10, 8/10, 10/10, 10/10, 9/10, 10/10); olfactory epithelium, atrophy (0/10, 0/10, 0/10, 10/10, 10/10, 10/10)
Genetic toxicology Bacterial gene mutations (in vitro): Negative in Salmonella typhimurium strains TA98, TA100, TA1535, and TA1537 with and without exogenous metabolic activation Micronucleated reticulocytes (in vivo): Mouse Equivocal in males and negative in females

11
Peer Review Draft NOT FOR ATTRIBUTION
INTRODUCTION
CHEMICAL AND PHYSICAL PROPERTIES Triethylamine is a colorless liquid with a strong ammonia-like odor (odor threshold 0.48 ppm) and is miscible in
water, ethanol, and ethyl ether. Triethylamine has a relatively high vapor pressure (54 mm Hg at 20° C) (ACGIH,
1986), and the vapor is explosive when exposed to heat or flame. Triethylamine is a dangerous fire hazard when
exposed to heat, flame, or oxidizers and when heated to decomposition, it emits toxic nitrogen oxide fumes (Lewis,
1992).
PRODUCTION, USE, AND HUMAN EXPOSURE Triethylamine is produced by reacting ammonia with ethanol, N,N-diethylacetamide with lithium aluminum hydride,
or ethyl chloride with ammonia under heat and pressure (Nelson and Bull, 1990). Large-scale production of
triethylamine is generally by high temperature, high pressure reactions of ammonia and an alcohol over a dehydration
catalyst or a dehydrogenation catalyst (Schweizer et al., 1978). Yields of mixed amines from the reaction of ammonia
and alcohol are high (≥80%). Pure amines are obtained by continuous extractions and distillations.
Triethylamine is listed as a high production volume chemical, indicating that greater than 1 million pounds were
produced in or imported into the United States in 1990 and/or 1994 (USEPA, 2007). Nonconfidential production
volume information indicates that production ranged from 10 to 50 million pounds in 1994, 1998, and 2002 (USEPA,
2007).
The largest use of triethylamine is as a catalyst to cure the resin systems incorporated into sand cores for foundry
molds (SRI, 1997). In this procedure, triethylamine is usually stored in a liquid form at room temperature and during
its use, it is vaporized and introduced into the system as a gas (MacBain and Strange, 1983; Warren and Selchan,
1988). Workers must wear appropriate eye and respiratory protection (Conrard, 1977), and proper ventilation of the
work area is necessary (Kay, 1974).
Annually in the United States, approximately 5 million pounds of triethylamine are used as a curing catalyst in phenol-
formaldehyde particle board adhesives, 2 to 3 million pounds of triethylamine are used for the precipitation and
purification of penicillin and cephalosporin antibiotics, and 1 to 2 million pounds of triethylamine are used in the
interfacial polymerization process for the production of polycarbonate resins. Triethylamine is also used as an
ingredient in sealing paint (0.5% w/w) (Hansen et al., 1987); in the manufacture of some paper and board adhesives;
12 Triethylamine, NTP TOX 78
NOT FOR ATTRIBUTION Peer Review Draft
as a stabilizer for the chlorinated solvents perchlorethylene and trichloroethylene (SRI, 1997); as an antilivering agent
for urea- and melamine-based enamels; in the recovery of gelled paint vehicles; as an accelerator activator for rubber;
as a corrosion inhibitor; as a propellant; as a wetting, penetrating, and waterproofing agent of quaternary ammonia
compounds; as an emulsifying agent for dyes; for the production of textile treatment agents; as an ingredient of
photographic development accelerator; for drying printing inks; in carpet cleaners; in the production of herbicides and
pesticides and in the preparation of emulsifiers for pesticides; in nonnutritive sweeteners, ketenes, and salts; and for
the desalination of water (Sax, 1994).
The National Institute for Occupational Safety and Health (NIOSH) (1990) estimated that 68,091 workers were
potentially exposed to triethylamine in the workplace annually. Occupational exposure to triethylamine can occur
through inhalation and dermal contact in industries where this chemical is used or produced. Because triethylamine
is vaporized when used in mold production in iron foundries, inhalation of the vapors is a major route of occupational
exposure. The general population may be exposed to triethylamine by inhalation of ambient air, ingestion of food,
and dermal contact with this chemical or products containing triethylamine.
REGULATORY STATUS The Occupational Safety and Health Administration airborne permissible exposure limit for triethylamine is 25 ppm
(100 mg/m3) averaged over an 8-hour workshift (29 CFR, § 1910.1000). The American Conference of Governmental
Industrial Hygienists (2012) recommended airborne exposure limit is 1 ppm triethylamine averaged over an 8-hour
workshift and 3 ppm as a 15-minute short-term exposure limit (STEL). NIOSH (2014) recommended an exposure
limit of 10 ppm (time-weighted average; TWA), a STEL of 15 ppm, and an immediately dangerous to life value of
200 ppm. These exposure limits were based on the adverse effects of triethylamine on the eyes and skin.
ABSORPTION, DISTRIBUTION, METABOLISM, EXCRETION, AND TOXICOKINETICS No information was found on the absorption, distribution, metabolism, or excretion of triethylamine in rodents.
Åkesson et al. (1988; 1989a) investigated the absorption, distribution, metabolism, excretion, and toxicokinetics of
triethylamine in five healthy men. The subjects were exposed to triethylamine concentrations of 10, 25, 35, or
50 mg/m3 (2.4, 6.0, 8.4, or 12.0 ppm) for 4 or 8 hours. The concentrations of triethylamine in exhaled air were about
20% of those in inhaled air indicating significant absorption. Analysis of urine showed that most of the triethylamine
was excreted unchanged. An average of 24% of the triethylamine was oxidatively metabolized into
triethylamine-N-oxide, but with a wide interindividual variation of 15% to 36%. A similar observation was reported
following exposure of 20 workers employed at a polyurethane foam manufacturing plant to approximately 500 µmol
(calculated as TWA × pulmonary ventilation) triethylamine per day (Åkesson et al., 1989b). Less than 0.3% of the
inhaled triethylamine was excreted as diethylamine. Exogenous aliphatic amines are generally metabolized by
monoamine oxidase and diamine oxidase. Monoamine oxidase catalyses the deamination of primary, secondary, and
tertiary amines to form ammonia, which is ultimately converted to urea (Snyder, 1990). The plasma and urinary

Triethylamine, NTP TOX 78 13
Peer Review Draft NOT FOR ATTRIBUTION
concentrations of triethylamine and triethylamine-N-oxide decreased rapidly after the end of the exposure. The mean
urinary excretion half-life for triethylamine and the oxide were approximately 3 and 4 hours, respectively.
Åkesson et al. (1989a) also investigated the disposition of triethylamine in four healthy men after a single oral dose
of 25 mg or an intravenous dose of 15 mg. Triethylamine was efficiently absorbed from the gastrointestinal tract after
oral administration. Total doses recovered in urine as triethylamine and triethylamine-N-oxide after oral and
intravenous administration were 90% and 97%, respectively. Triethylamine was excreted into the gastric juice where
levels were approximately 30 times the levels in plasma. Excretion of triethylamine by exhalation was minimal. The
average plasma and urine half-lives following oral administration were 2.9 and 2.8 hours, respectively.
TOXICITY Experimental Animals In early studies of triethylamine toxicity, Carpenter et al. (1948) reported that acute inhalation exposure of guinea pigs
to 2,000 ppm for 2 hours resulted in the death of four of six animals. Exposure to 1,000 ppm for 4 hours resulted in
the death of two of six animals and no deaths were observed after 4 hours of exposures to 250 or 500 ppm
triethylamine. In other acute studies, Brieger and Hodes (1951) exposed rabbits (strain not reported) to 50 or 100 ppm
(210 or 414 mg/m3) triethylamine vapor 7 hours/day, 5 days per week for 6 weeks. Exposure to 100 ppm resulted in
pulmonary edema, hemorrhage, moderate peribronchitis, and vascular thickening. Extrapulmonary effects were noted
in the kidney and liver and were characterized as parenchymal degeneration with cell necrosis. Similar but less severe
lesions were observed in the lung, kidney, and liver of animals exposed to 50 ppm. Severe ocular irritation was
observed in rabbits exposed to 50 or 100 ppm triethylamine for 30 days. A researcher accidentally exposed to 50 ppm
triethylamine (duration unknown) during this animal study experienced severe corneal erosion and edema.
In a subchronic inhalation study, albino rats exposed to 3.14 ppm (13.01 mg/m3) triethylamine for 3 months exhibited
changes in the lungs, brain, and liver (Tkachev, 1971). In the lungs, there was infiltration of the perivascular
connective tissue by white blood cells, thickening of the interalveolar walls and shedding of the alveolar epithelium.
In the brain, there was swelling, disruption of nuclei, necrosis, disappearance of neurons, reduced cytochrome C
oxidase activity, accumulation of lipids in the cerebral cortex, and reduced staining intensity of sulfhydryl groups. In
the liver, there was a reduction in glycogen content. These effects were not observed after exposure to 0.04 or 0.4 ppm
(0.16 or 1.71 mg/m3) triethylamine.
Rats exposed to concentrations of 7.2 to 19 ppm (30 to 80 mg/m3) triethylamine, 3 hours/day for 6 months exhibited
decreased body weights, changes in nervous system function (details not provided), hypohemoglobinemia, increased
blood reticulocytes, and chronic inflammation of the lungs (Nelson and Bull, 1990).
Lynch et al. (1990) exposed male and female F344 rats to 0, 25, or 247 ppm triethylamine vapors, 6 hours/day, 5 days
a week for up to 28 weeks. No significant treatment-related effects were observed on body weights, hematology,

14 Triethylamine, NTP TOX 78
NOT FOR ATTRIBUTION Peer Review Draft
clinical chemistry, or electrocardiographic indices after exposure to either concentration. No histopathologic lesions
were detected in any of the organs examined, including the nasal passages.
Dermal exposure to triethylamine has been demonstrated to cause severe skin damage in several species of laboratory
animals. Skin injury is attributed to the potent alkalinity of triethylamine. A 70% solution of triethylamine placed on
the skin of guinea pigs for 2 hours caused severe skin injury (Proctor and Hughes, 1978). Severe skin damage was
also observed in New Zealand white rabbits that had 0.5 mL triethylamine applied to intact or abraded occluded skin
for 3 minutes (Union Carbide, 1986; Hoeschst Celanese, 1989) or 24 hours (Penwalt, 1986). Dermal application of
2,000 or 5,000 mg/kg triethylamine to rabbits (strain not provided) resulted in 75% and 100% mortality, respectively
(Virginia Chemicals, 1987). Severe toxicity leading to death was observed in New Zealand white rabbits that had 1
or 2 mL/kg triethylamine applied to the skin for 24 hours (Union Carbide, 1949, 1979). Necropsies of dead rabbits
revealed dark lungs and kidneys, pale spleen, and pale, mottled liver.
Humans Occupational exposure to triethylamine is reported to cause irritation of the respiratory tract, the eyes, and mucous
membranes; however, published studies evaluating the pulmonary effects of triethylamine on humans could not be
found in the literature. Reports on human exposures were primarily concerned with reported eye irritation and vision
symptoms of blurriness, halo vision and glaucopsia (blue, hazy vision) (Brieger and Hodes, 1951; Mellerio and Weale,
1966; Åkesson et al., 1985, 1986; Albrecht and Stephenson, 1988; Ståhlbom et al., 1991). These symptoms are
typically short-lived, lasting about an hour after the end of exposure and are attributed to light scattering associated
with corneal irritation and edema (Reilly et al., 1995). Corneal irritation and edema result from direct action of
triethylamine on the corneal epithelium.
Åkesson et al. (1985) exposed human volunteers to 2.5 to 12 ppm (10 to 48 mg/m3) triethylamine for 4 to 8 hours.
Severe visual disturbances were reported in two volunteers exposed to 12 ppm triethylamine vapor for 4 hours.
Symptoms included hazing of visual fields, bluish halos around lights, and slight ocular irritation. Ocular examination
revealed a slight decrease in visual acuity and pronounced corneal edema. Symptoms disappeared after 4 to 4.5 hours.
Similar but less severe effects occurred after 2 hours of exposure to 8.5 ppm (34 mg/m3); slight visual disturbance was
reported after 4 to 6 hours of exposure to 4.5 ppm (18 mg/m3), and no adverse effects were noted after exposure to
2.5 ppm (10 mg/m3) triethylamine for 8 hours. In a subsequent study, Åkesson et al. (1986) reported that five of
19 workers exposed to triethylamine at a polyurethane foam production plant reported visual disturbances described
as foggy vision, blue haze, and sometimes halo phenomena. At the sites within the plant where workers reported
symptoms, the triethylamine concentrations ranged from 1 to 6 ppm (4 to 24 mg/m3). No effects were observed when
the triethylamine concentrations were decreased to 1.5 ppm (6 mg/m3). Visual disturbances in workers have been
correlated with occupational exposures to triethylamine vapor in other studies (Ashland Chemical, 1986; Warren and
Selchan, 1988; Reilly et al., 1995).

Triethylamine, NTP TOX 78 15
Peer Review Draft NOT FOR ATTRIBUTION
CARCINOGENICITY Information on the carcinogenicity of triethylamine in humans or animals is sparse. In a Danish foundry, molders
exposed to a variety of chemicals, including triethylamine, had a significantly increased mortality due to bladder
cancer when compared to other skilled workers (Hansen, 1991). Workers were followed for up to 10 years.
Coadministration of 0.5% (5,000 mg/kg feed) triethylamine hydrochloride (37 mMol/kg feed) and 0.5% nitrite in
feed to SIV50 rats for 1 year did not result in detectable tumors (Schweinsberg and Sander, 1972). Triethylamine was
not administered as a single compound to rats in this study.
GENETIC TOXICITY Triethylamine was not mutagenic in Salmonella typhimurium strains TA98, TA100, TA1535, or TA1537, when tested
up to a maximum of 10,000 µg/plate with or without induced rat or hamster liver S9 activation enzymes (Zeiger et al.,
1987; Appendix B).
STUDY RATIONALE Triethylamine was nominated by the International Union, United Automobile, Aerospace and Agricultural Implement
Workers of America based on its widespread use and resulting occupational exposures, concern regarding respiratory
and ocular effects, and the lack of chronic toxicity and carcinogenicity data. Chronic studies of triethylamine were
not conducted because its subchronic toxicity was similar to that of diethylamine, and there was greater interest in a
chronic study of diethylamine because of its potential to form nitrosamines.

16 Triethylamine, NTP TOX 78
NOT FOR ATTRIBUTION Peer Review Draft

17
Peer Review Draft NOT FOR ATTRIBUTION
MATERIALS AND METHODS
PROCUREMENT AND CHARACTERIZATION OF TRIETHYLAMINE Triethylamine was obtained from Alkyl Amines Chemicals, Limited (Maharashtra, India) in one lot (CE/04/01) that
was used in the 2-week and 3-month studies. Identity and purity analyses were conducted by the analytical chemistry
laboratories at Chemir/Polytech Laboratories, Inc. (Maryland Heights, MO), Galbraith Laboratories, Inc., (Knoxville,
TN), and Research Triangle Institute (RTI) (Research Triangle Park, NC), and by the study laboratory at Battelle
Toxicology Northwest (Richland, WA) (Appendix F). Reports on analyses performed in support of the triethylamine
studies are on file at the National Institute of Environmental Health Sciences.
The chemical, a highly alkaline colorless liquid with a strong ammonia odor, was identified as triethylamine using
fourier transform infrared and proton nuclear magnetic resonance spectroscopy and gas chromatography (GC) coupled
with mass spectrometry.
Karl Fischer titration indicated 221 ppm water. Elemental analyses for carbon, hydrogen, and nitrogen were in
agreement with the theoretical values for triethylamine. GC with flame ionization detection (FID) indicated one major
peak and no impurities with areas greater than 0.1% relative to the total peak area. The overall purity of lot CE/04/01
was determined to be greater than 99%.
An additional analysis was performed to determine if triethylamine oxide (TEAO), a degradation product that can be
found in the test chemical from reaction with oxygen, was present. The presence of TEAO was determined by
controlled thermal degradation of TEAO to diethylamine (Lindegård et al., 1990) with subsequent analysis using GC
coupled with mass spectrometry. Results indicated that, if present, the concentration of TEAO was less than 0.1%.
To ensure stability, the test chemical was stored at controlled room temperature in the original shipping containers
(55-gallon metal drums). Periodic reanalyses of the bulk chemical were performed during the 2-week and 3-month
studies using GC/FID, and no degradation of the bulk chemical was detected.
VAPOR GENERATION AND EXPOSURE SYSTEM Triethylamine was pumped through a preheater (2-week studies) into a heated glass column filled with glass beads to
increase the surface area for evaporation. Heated nitrogen entering the column from below vaporized the chemical as
it was conveyed out of the generator and into a short vapor distribution manifold. Concentration in the manifold was
18 Triethylamine, NTP TOX 78
NOT FOR ATTRIBUTION Peer Review Draft
determined by the chemical pump and nitrogen flow rates. The pressure in the distribution manifold was kept fixed
to ensure consistent flow through the manifold and into the chambers as the flow of vapor to each chamber was
adjusted. Precision metering valves controlled flow to each chamber. Three-way exposure valves, mounted
downstream from all metering valves directed all chemical to exhaust until the generation system was stable and
exposures were ready to proceed. When the exposure started, the three-way valve was rotated to allow the flow of
triethylamine vapor through the Teflon® delivery line into the chamber inlet duct where it was further mixed and
diluted with conditioned chamber air to achieve the desired exposure concentration.
The study laboratory designed the inhalation exposure chamber (Harford Systems Division of Lab Products, Inc.,
Aberdeen, MD) so that uniform vapor concentrations could be maintained throughout the chamber with the catch pans
in place. The total active mixing volume of each chamber was 1.7 m3. A condensation particle counter was used with
and without animals in the exposure chambers to ensure that triethylamine vapor, and not aerosol, was produced. No
particle counts above the minimum resolvable level (approximately 200 particles/cm3) were detected.
VAPOR CONCENTRATION MONITORING Summaries of the chamber vapor concentrations are given in Tables F2 and F3. Concentrations in the exposure
chambers were monitored by an on-line gas chromatograph. Samples were drawn from each exposure chamber
approximately every 20 minutes during each 6-hour exposure using a stream-select valve. This valve directed a
continuous stream of sampled atmosphere to a sampling valve with a sample loop. Both valves were mounted in a
dedicated oven. A vacuum regulator maintained a constant pressure in the sample loop to compensate for variations
in sample line pressure. An in-line flow meter between the vacuum regulator and gas chromatograph allowed digital
measurement of sample flow.
The on-line gas chromatograph was checked throughout the day for instrument drift against an on-line standard of
triethylamine vapor supplied by a standard generator. The on-line gas chromatograph was calibrated by a comparison
of chamber concentration data to data from grab samples that were collected with acrylic ester sampling tubes and
extracted with methylene chloride containing cyclopentylamine as an internal standard and analyzed by an off-line
gas chromatograph. Known values of chamber atmosphere were sampled at a constant flow rate ensured by a
calibrated critical orifice. The off-line gas chromatograph was calibrated with gravimetrically prepared standards of
triethylamine and the internal standard (triethylamine) in methylene chloride.
CHAMBER ATMOSPHERE CHARACTERIZATION Buildup and decay rates for chamber vapor concentrations were determined with and without animals present in the
chambers. At a chamber airflow rate of 15 air changes per hour, the theoretical value for the time to achieve 90% of
the target concentration after the beginning of vapor generation (T90) and the time for the chamber concentration to
decay to 10% of the target concentration after vapor generation was terminated (T10) was approximately 9.4 minutes.
A T90 value of 12 minutes was selected for all studies.

Triethylamine, NTP TOX 78 19
Peer Review Draft NOT FOR ATTRIBUTION
The uniformity of vapor concentration in the inhalation exposure chambers without animals present was evaluated
before the 3-month studies began; in addition, concentration uniformity with animals in the chambers was measured
once during the 2-week and 3-month studies. The vapor concentration was measured using the on-line gas
chromatograph with the stream-selection valve fixed in one position to allow continuous monitoring from a single
input line. Chamber concentration uniformity was maintained throughout the studies.
The persistence of triethylamine in the chambers after vapor delivery ended was determined by monitoring the vapor
concentration in the 1,000 ppm chambers with animals present in the 2-week studies and in the 200 ppm chambers
with and without animals present in the 3-month studies. In the 2-week studies, the concentration decreased to 1% of
the target concentration within 21 minutes. In the 3-month studies, the concentration decreased to 1% of the target
concentration within 56 minutes with animals present and within 22 minutes without animals present.
Test article stability in the distribution lines and low and high exposure concentration chambers was characterized
during the 2-week and 3-month studies; characterization of the chamber test atmosphere during the first and last
2 hours of one generation day was conducted with animals present in the exposure chambers. Similar stability studies
were conducted prior to the start of the 3-month studies; in these studies, exposure chamber measurements were taken
from unoccupied chambers. Additional samples were collected from the generator reservoir during the 2-week studies
and prior to the 3-month studies. Samples of the bulk chemical taken from the generator reservoir were diluted with
methylene chloride containing diethylamine as an internal standard and analyzed by GC. Samples of the test
atmosphere from the distribution lines and exposure chambers were collected with sorbent tubes, extracted with
methylene chloride, and analyzed using GC. To assess whether impurities or degradation products co-eluted with the
test chemical or the solvent, a second analysis of the test atmosphere samples was performed with GC using a polar
column that permitted resolution of compounds with similar boiling points but small differences in polarity. Some of
the samples of the test atmosphere from the distribution lines and exposure chambers in these studies contained one
impurity with an area greater than 0.1% of the total peak area; the identity of this impurity was confirmed as
diethylamine using GC with mass spectrometric detection. The highest concentrations of diethylamine noted in the
test atmosphere samples during the 2-week studies and prior to and during the 3-month studies were 0.16%, 0.24%,
and 0.34% of the total peak areas, respectively; the presence of this impurity was attributed to artifacts of sample
collection or formation in the injector port. Diethylamine was shown to be present at less than 0.1% in all samples
from the generator reservoir. No evidence of degradation of the test chemical was detected, and no other impurities
were detected in any of the reservoir, distribution line, or exposure chamber samples.
ANIMAL WELFARE Animal care and use are in accordance with the Public Health Service policy on Humane Care and Use of Animals.
All animal studies were conducted in an animal facility accredited by the Association of Laboratory Animal Care
International. Studies were approved by the Battelle Toxicology Northwest Animal Care and Use Committee and

20 Triethylamine, NTP TOX 78
NOT FOR ATTRIBUTION Peer Review Draft
conducted in accordance with all relevant NIH and NTP animal care and use policies and applicable federal, state, and
local regulations and guidelines.
2-WEEK STUDIES Male and female F344/N rats and B6C3F1/N mice were obtained from Taconic Farms, Inc. (Germantown, NY). On
receipt, the rats and mice were 4 weeks old. Animals were quarantined for 13 days and were 6 weeks old on the first
day of the studies. Groups of five male and five female rats and mice were exposed to triethylamine via whole body
inhalation at concentrations of 0, 100, 200, 400, 800, or 1,000 ppm. These exposure concentrations were based upon
results reported for diethylamine inhalation studies conducted in mice (Gorgacz, 1987) and rats (Schueler, 1984).
Animals were exposed for 6 hours plus T90 (12 minutes) per day, 5 days per week for 16 (rats) or 17 (mice) days. Rats
were exposed for a total of 12 days and mice for 13 days. Feed was available ad libitum except during exposure
periods; water was available ad libitum. Rats and mice were housed individually. Clinical findings were recorded
twice daily for rats and mice. The animals were weighed initially, on days 6 and 13, and at the end of the studies.
Before the studies began, five male and five female rats and mice were randomly selected for parasite evaluation and
gross observation for evidence of disease. At the end of the studies, serologic analyses were performed on five male
and five female chamber control rats and mice using the protocols of the NTP Sentinel Animal Program; all results
were negative (Appendix H). Details of the study design and animal maintenance are summarized in Table 1.
Necropsies were performed on all rats and mice on the day following the last exposure. The heart, right kidney, liver,
lung, right testis, and thymus were weighed. Histopathologic examinations were performed on all chamber control
and 800 and 1,000 ppm rats and mice, and tissues were examined to a no-effect level in the remaining exposure groups.
Table 1 lists the tissues and organs examined.
3-MONTH STUDIES Male and female F344/N rats and B6C3F1/N mice were obtained from Taconic Farms, Inc. (Germantown, NY). On
receipt, the rats and mice were 3 to 4 weeks old. Animals were quarantined for 12 (male rats and male and female
mice) or 13 days (female rats) and were 5 to 6 weeks old on the first day of the studies. Before the studies began, five
male and five female rats and mice were randomly selected for parasite evaluation and gross observation for evidence
of disease. Serologic analyses were performed on five male and five female sentinel rats and mice at 2 weeks and on
five male and five female chamber control rats and mice at the end of the studies using the protocols of the NTP
Sentinel Animal Program; all results were negative (Appendix H).
Groups of 10 male and 10 female rats and mice were exposed to triethylamine via whole body inhalation at
concentrations of 0, 12.5, 25, 50, 100, or 200 ppm, 6 hours plus T90 (12 minutes) per day, 5 days per week for
14 weeks. Groups of 10 male and 10 female clinical pathology rats were exposed to the same concentrations for
23 days. Feed was available ad libitum except during exposure periods; water was available ad libitum. Rats and
mice were housed individually. Clinical findings were recorded twice daily for core study rats and mice. Core study
Triethylamine, NTP TOX 78 21
Peer Review Draft NOT FOR ATTRIBUTION
animals were weighed initially, on day 10 (female rats), day 11 (male rats and male and female mice), weekly
thereafter, and at the end of the studies. Details of the study design and animal maintenance are summarized in
Table 1.
Animals were anesthetized with carbon dioxide, and blood was collected from the retroorbital sinus of clinical
pathology rats on days 3 and 23 and from core study rats and mice at the end of the studies for hematology and clinical
chemistry (rats only) analyses. Blood samples for hematology analyses were placed in tubes containing potassium
EDTA. Packed cell volume; hemoglobin concentration; erythrocyte, platelet, and leukocyte counts; mean cell volume;
mean cell hemoglobin; and mean cell hemoglobin concentration were determined using an Abbott Cell-Dyn 3700
Analyzer (Abbott Diagnostics Systems, Abbott Park, IL). Manual hematocrit values were determined using a
microcentrifuge (Heraeus Haemofuge; Hanau, Germany) and a Damon/IEC capillary reader (International Equipment
Co., Needham Heights, MA) for comparison to Cell-Dyn values for packed cell volume. Blood smears were stained
with Romanowsky-type aqueous stain in a Wescor 1700 aerospray slide stainer (Wescor, Inc., Logan, UT). Leukocyte
differential counts were based on classifying a minimum of 100 white cells. Reticulocytes were stained with new
methylene blue and enumerated as a reticulocyte:erythrocyte ratio using the Miller disc method (Brecher and
Schneiderman, 1950). Blood samples for clinical chemistry analyses were placed in tubes without anticoagulant and
containing a separator gel, allowed to clot, and centrifuged. Parameters were determined using a Roche Hitachi 912
System (Roche Diagnostic Corporation, Indianapolis, IN). Table 1 lists the parameters measured.
At the end of the 3-month studies, samples were collected for sperm motility and vaginal cytology evaluations on rats
and mice exposed to 0, 50, 100, and 200 ppm. The parameters evaluated are listed in Table 1. For 12 consecutive
days prior to scheduled terminal kill, the vaginal vaults of the females were moistened with saline, if necessary, and
samples of vaginal fluid and cells were stained. Relative numbers of leukocytes, nucleated epithelial cells, and large
squamous epithelial cells were determined and used to ascertain estrous cycle stage (i.e., diestrus, proestrus, estrus,
and metestrus). Male animals were evaluated for sperm count and motility. The left testis and left epididymis were
isolated and weighed. The tail of the epididymis (cauda epididymis) was then removed from the epididymal body
(corpus epididymis) and weighed. Test yolk (rats) or modified Tyrode’s buffer (mice) was applied to slides and a
small incision was made at the distal border of the cauda epididymis. The sperm effluxing from the incision were
dispersed in the buffer on the slides, and the numbers of motile and nonmotile spermatozoa were counted for five
fields per slide by two observers. Following completion of sperm motility estimates, each left cauda epididymis was
placed in buffered saline solution. Caudae were finely minced, and the tissue was incubated in the saline solution and
then heat fixed at 65° C. Sperm density was then determined microscopically with the aid of a hemacytometer. To
quantify spermatogenesis, the testicular spermatid head count was determined by removing the tunica albuginea and
homogenizing the left testis in phosphate-buffered saline containing 10% dimethyl sulfoxide. Homogenization-
resistant spermatid nuclei were counted with a hemacytometer.

22 Triethylamine, NTP TOX 78
NOT FOR ATTRIBUTION Peer Review Draft
Necropsies were performed on all animals. The heart, right kidney, liver, lung, right testis, and thymus were weighed.
Tissues for microscopic examination were fixed and preserved in 10% neutral buffered formalin, processed and
trimmed, embedded in paraffin, sectioned to a thickness of 4 to 6 µm, and stained with hematoxylin and eosin.
Complete histopathologic examinations were performed by the study laboratory pathologist on all chamber control
and 200 ppm animals. In addition, the eyes, larynx, lung, nose, and trachea in the remaining groups of rats and mice,
and the large intestine (cecum, colon, rectum), small intestine (duodenum, jejunum, ileum), kidney, liver, and stomach
(forestomach and glandular) in the remaining groups of rats were examined. Table 1 lists the tissues and organs
routinely examined.
After a review of the laboratory reports and selected histopathology slides by a quality assessment (QA) pathologist,
the findings and reviewed slides were submitted to a NTP Pathology Peer Review (PPR) coordinator for a second
independent review. Any inconsistencies in the diagnoses made by the study laboratory and QA pathologists were
resolved by the NTP PPR process. Final diagnoses for reviewed lesions represent a consensus of the PPR or a
consensus between the study laboratory pathologist, NTP pathologist, QA pathologist(s), and the PPR coordinator.
Details of these review procedures have been described, in part, by Maronpot and Boorman (1982) and Boorman et al.
(1985). Because of the demise of the original NTP pathologist prior to completion of the Toxicity Study Report and
the development of the Nonneoplastic Lesion Atlas (NNLA), a second NTP pathologist was assigned to this study to
equate the terminology used in the current Toxicity Study Report to that recommended in the NNLA. As a result,
three additional PPRs were performed to assess the nasoturbinates of the 3-month mice, the eyes of the 2-week rats
and mice, and the eyes of 3-month rats. The recommendations of those PPRs were then incorporated into the final
diagnoses used in this Toxicity Study Report.

Triethylamine, NTP TOX 78 23
Peer Review Draft NOT FOR ATTRIBUTION
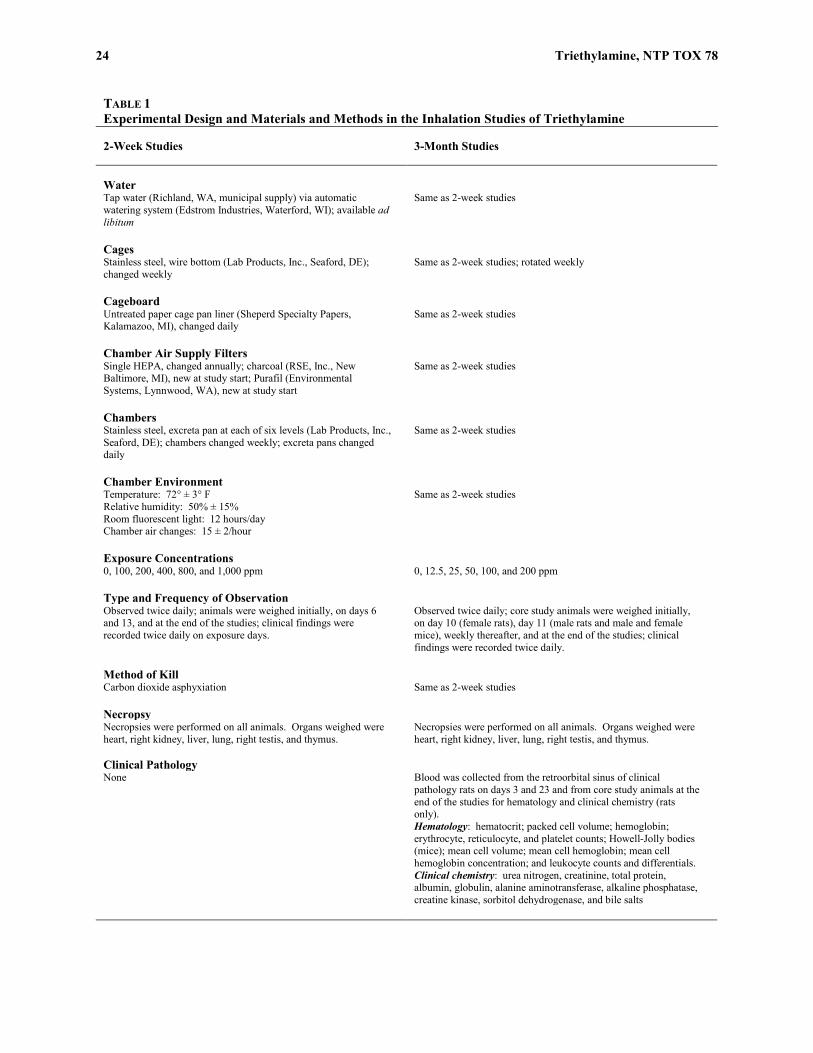
TABLE 1 Experimental Design and Materials and Methods in the Inhalation Studies of Triethylamine 2-Week Studies 3-Month Studies Study Laboratory Battelle Toxicology Northwest (Richland, WA) Battelle Toxicology Northwest (Richland, WA) Strain and Species F344/N rats F344/N rats B6C3F1/N mice B6C3F1/N mice Animal Source Taconic Farms, Inc. (Germantown, NY) Taconic Farms, Inc. (Germantown, NY) Time Held Before Studies 13 days Rats: 12 days (males) or 13 days (females) Mice: 12 days Average Age When Studies Began 6 weeks 5 to 6 weeks Date of First Exposure September 23, 2002 Rats: January 20 (males) or 21 (females), 2003 Mice: January 20, 2003 Duration of Exposure 6 hours plus T90 (12 minutes) per day, 5 days per week, for 16 (rats) or 17 (mice) days
6 hours plus T90 (12 minutes) per day, 5 days per week, for 14 weeks
Date of Last Exposure Rats: October 8, 2002 Rats: April 21 (males) or 22 (females), 2003 Mice: October 9, 2002 Mice: April 23 (males) or 24 (females), 2003 Necropsy Dates Rats: October 9, 2002 Rats: April 22 (males) or 23 (females), 2003 Mice: October 10, 2002 Mice: April 24 (males) or 25 (females), 2003 Average Age at Necropsy 8 weeks 18 to 19 weeks Size of Study Groups 5 males and 5 females 10 males and 10 females Method of Distribution Animals were distributed randomly into groups of approximately equal initial mean body weights.
Same as 2-week studies
Animals per Cage 1 1 Method of Animal Identification Tail tattoo Same as 2-week studies Diet NTP-2000 irradiated wafers (Zeigler Brothers, Inc., Gardners, PA), available ad libitum (except during exposure periods); changed weekly
Same as 2-week studies
24 Triethylamine, NTP TOX 78
NOT FOR ATTRIBUTION Peer Review Draft
TABLE 1 Experimental Design and Materials and Methods in the Inhalation Studies of Triethylamine 2-Week Studies 3-Month Studies Water Tap water (Richland, WA, municipal supply) via automatic watering system (Edstrom Industries, Waterford, WI); available ad libitum
Same as 2-week studies
Cages Stainless steel, wire bottom (Lab Products, Inc., Seaford, DE); changed weekly
Same as 2-week studies; rotated weekly
Cageboard Untreated paper cage pan liner (Sheperd Specialty Papers, Kalamazoo, MI), changed daily
Same as 2-week studies
Chamber Air Supply Filters Single HEPA, changed annually; charcoal (RSE, Inc., New Baltimore, MI), new at study start; Purafil (Environmental Systems, Lynnwood, WA), new at study start
Same as 2-week studies
Chambers Stainless steel, excreta pan at each of six levels (Lab Products, Inc., Seaford, DE); chambers changed weekly; excreta pans changed daily
Same as 2-week studies
Chamber Environment Temperature: 72° ± 3° F Same as 2-week studies Relative humidity: 50% ± 15% Room fluorescent light: 12 hours/day Chamber air changes: 15 ± 2/hour Exposure Concentrations 0, 100, 200, 400, 800, and 1,000 ppm 0, 12.5, 25, 50, 100, and 200 ppm Type and Frequency of Observation Observed twice daily; animals were weighed initially, on days 6 and 13, and at the end of the studies; clinical findings were recorded twice daily on exposure days.
Observed twice daily; core study animals were weighed initially, on day 10 (female rats), day 11 (male rats and male and female mice), weekly thereafter, and at the end of the studies; clinical findings were recorded twice daily.
Method of Kill Carbon dioxide asphyxiation Same as 2-week studies Necropsy Necropsies were performed on all animals. Organs weighed were heart, right kidney, liver, lung, right testis, and thymus.
Necropsies were performed on all animals. Organs weighed were heart, right kidney, liver, lung, right testis, and thymus.
Clinical Pathology None Blood was collected from the retroorbital sinus of clinical
pathology rats on days 3 and 23 and from core study animals at the end of the studies for hematology and clinical chemistry (rats only). Hematology: hematocrit; packed cell volume; hemoglobin; erythrocyte, reticulocyte, and platelet counts; Howell-Jolly bodies (mice); mean cell volume; mean cell hemoglobin; mean cell hemoglobin concentration; and leukocyte counts and differentials. Clinical chemistry: urea nitrogen, creatinine, total protein, albumin, globulin, alanine aminotransferase, alkaline phosphatase, creatine kinase, sorbitol dehydrogenase, and bile salts
Triethylamine, NTP TOX 78 25
Peer Review Draft NOT FOR ATTRIBUTION
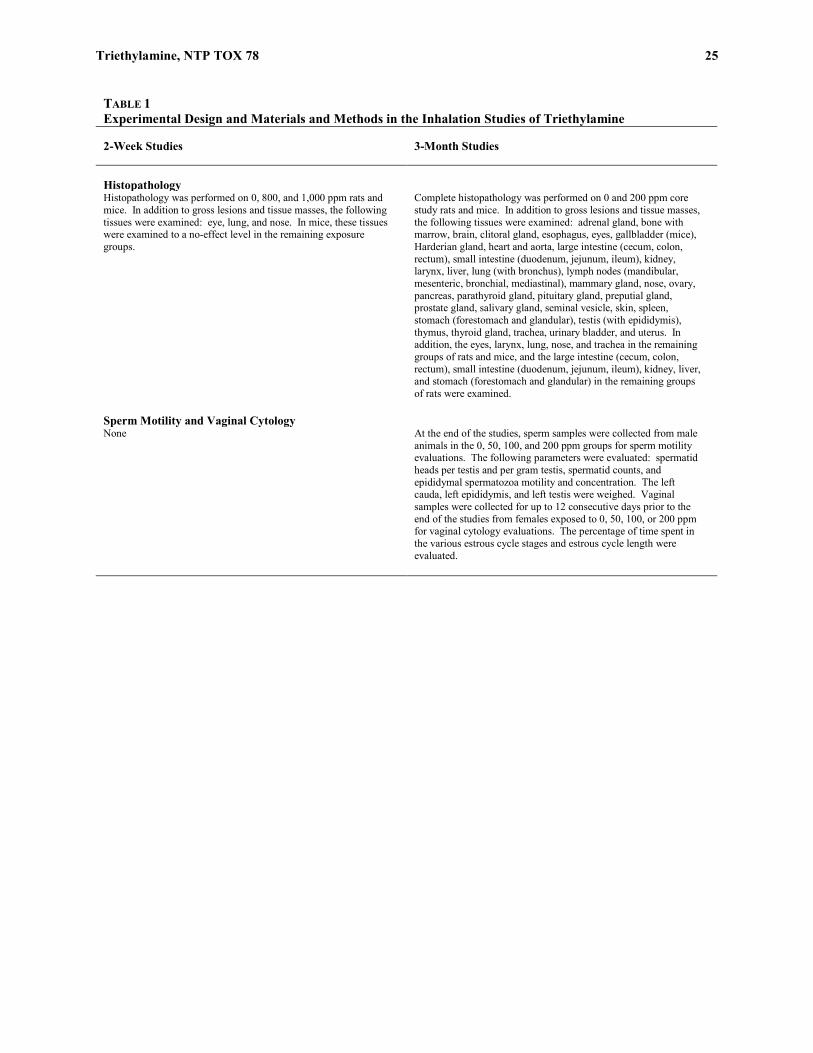
TABLE 1 Experimental Design and Materials and Methods in the Inhalation Studies of Triethylamine 2-Week Studies 3-Month Studies Histopathology Histopathology was performed on 0, 800, and 1,000 ppm rats and mice. In addition to gross lesions and tissue masses, the following tissues were examined: eye, lung, and nose. In mice, these tissues were examined to a no-effect level in the remaining exposure groups.
Complete histopathology was performed on 0 and 200 ppm core study rats and mice. In addition to gross lesions and tissue masses, the following tissues were examined: adrenal gland, bone with marrow, brain, clitoral gland, esophagus, eyes, gallbladder (mice), Harderian gland, heart and aorta, large intestine (cecum, colon, rectum), small intestine (duodenum, jejunum, ileum), kidney, larynx, liver, lung (with bronchus), lymph nodes (mandibular, mesenteric, bronchial, mediastinal), mammary gland, nose, ovary, pancreas, parathyroid gland, pituitary gland, preputial gland, prostate gland, salivary gland, seminal vesicle, skin, spleen, stomach (forestomach and glandular), testis (with epididymis), thymus, thyroid gland, trachea, urinary bladder, and uterus. In addition, the eyes, larynx, lung, nose, and trachea in the remaining groups of rats and mice, and the large intestine (cecum, colon, rectum), small intestine (duodenum, jejunum, ileum), kidney, liver, and stomach (forestomach and glandular) in the remaining groups of rats were examined.
Sperm Motility and Vaginal Cytology None At the end of the studies, sperm samples were collected from male
animals in the 0, 50, 100, and 200 ppm groups for sperm motility evaluations. The following parameters were evaluated: spermatid heads per testis and per gram testis, spermatid counts, and epididymal spermatozoa motility and concentration. The left cauda, left epididymis, and left testis were weighed. Vaginal samples were collected for up to 12 consecutive days prior to the end of the studies from females exposed to 0, 50, 100, or 200 ppm for vaginal cytology evaluations. The percentage of time spent in the various estrous cycle stages and estrous cycle length were evaluated.

26 Triethylamine, NTP TOX 78
NOT FOR ATTRIBUTION Peer Review Draft
STATISTICAL METHODS Calculation and Analysis of Lesion Incidences The incidences of lesions are presented in Appendix A as the numbers of animals bearing such lesions at a specific
anatomic site and the numbers of animals with that site examined microscopically. The Fisher exact test (Gart et al.,
1979), a procedure based on the overall proportion of affected animals, was used to determine significance.
Analysis of Continuous Variables Two approaches were employed to assess the significance of pairwise comparisons between exposed and control
groups in the analysis of continuous variables. Organ and body weight data, which historically have approximately
normal distributions, were analyzed with the parametric multiple comparison procedures of Dunnett (1955) and
Williams (1971, 1972). Hematology, clinical chemistry, spermatid, and epididymal spermatozoal data, which have
typically skewed distributions, were analyzed using the nonparametric multiple comparison methods of Shirley (1977)
(as modified by Williams, 1986) and Dunn (1964). Jonckheere’s test (Jonckheere, 1954) was used to assess the
significance of the dose-related trends and to determine whether a trend-sensitive test (Williams’ or Shirley’s test)
was more appropriate for pairwise comparisons than a test that does not assume a monotonic dose-related trend
(Dunnett’s or Dunn’s test). Prior to statistical analysis, extreme values identified by the outlier test of Dixon and
Massey (1957) were examined by NTP personnel, and implausible values were eliminated from the analysis.
Proportions of regular cycling females in each exposed group were compared to the control group using the Dunn’s
test (Dunn, 1964). Tests for extended periods of estrus, diestrus, metestrus, and proestrus, as well as skipped estrus
and skipped diestrus were constructed based on a Markov chain model proposed by Girard and Sager (1987). For
each exposure group, a transition probability matrix was estimated for transitions among the proestrus, estrus,
metestrus, and diestrus stages, with provision for extended stays within each stage as well as for skipping estrus or
diestrus within a cycle. Equality of transition matrices among exposure groups and between the control group and
each exposed group was tested using chi-square statistics.
QUALITY ASSURANCE METHODS The 2-week and 3-month studies were conducted in compliance with Food and Drug Administration Good Laboratory
Practice Regulations (21 CFR, Part 58).
GENETIC TOXICOLOGY Bacterial Mutagenicity Test Protocol Testing was performed as reported by Zeiger et al. (1987). Triethylamine was sent to the laboratory as a coded aliquot
from Radian Corporation (Austin, TX). It was incubated with the Salmonella typhimurium tester strains TA98,
TA100, TA1535, and TA1537 either in buffer or S9 mix (metabolic activation enzymes and cofactors from Aroclor
1254-induced male Sprague-Dawley rat or Syrian hamster liver) for 20 minutes at 37° C. Top agar supplemented
with L-histidine and d-biotin was added, and the contents of the tubes were mixed and poured onto the surfaces of

Triethylamine, NTP TOX 78 27
Peer Review Draft NOT FOR ATTRIBUTION
minimal glucose agar plates. Histidine-independent mutant colonies arising on these plates were counted following
incubation for 2 days at 37° C.
Each trial consisted of triplicate plates of concurrent positive and negative controls and five doses of triethylamine.
The high dose was 10,000 µg/plate, which induced toxicity in some trials. All trials were repeated.
In this assay, a positive response is defined as a reproducible, dose-related increase in histidine-independent (revertant)
colonies in any one strain/activation combination. An equivocal response is defined as an increase in revertants that
is not dose related, is not reproducible, or is not of sufficient magnitude to support a determination of mutagenicity.
A negative response is obtained when no increase in revertant colonies is observed following chemical treatment.
There is no minimum percentage or fold increase required for a chemical to be judged positive or weakly positive,
although positive calls are typically reserved for increases in mutant colonies that are at least twofold over background.
Mouse Peripheral Blood Micronucleus Test Protocol A detailed discussion of this assay is presented by MacGregor et al. (1990). At the end of the 3-month toxicity study,
peripheral blood samples were obtained from male and female mice. Smears were immediately prepared and fixed in
absolute methanol. The methanol-fixed slides were stained with acridine orange and coded. Slides were scanned to
determine the frequency of micronuclei in 1,000 normochromatic erythrocytes (NCEs) in each of 10 animals per
exposure group. In addition, the percentage of polychromatic erythrocytes (PCEs) among a population of
1,000 erythrocytes was scored for each exposure group as a measure of bone marrow toxicity.
The results were tabulated as the mean of the pooled results from all animals within a treatment group plus or minus
the standard error of the mean. The frequency of micronucleated cells among NCEs was analyzed by a statistical
software package that tested for increasing trend over exposure groups with a one-tail Cochran-Armitage trend test,
followed by pairwise comparisons between each exposed group and the control group. In the presence of excess
binomial variation, as detected by a binomial dispersion test, the binomial variance of the Cochran-Armitage test was
adjusted upward in proportion to the excess variation. In the micronucleus test, an individual trial is considered
positive if the trend test P value is less than or equal to 0.025 or if the P value for any single exposed group is less than
or equal to 0.025 divided by the number of exposed groups. A final call of positive for micronucleus induction is
preferably based on reproducibly positive trials (as noted above). Ultimately, the final call is determined by the
scientific staff after considering the results of statistical analyses, the reproducibility of any effects observed, and the
magnitudes of those effects.
Evaluation Protocol These are the basic guidelines for arriving at an overall assay result for assays performed by the National Toxicology
Program. Statistical as well as biological factors are considered. For an individual assay, the statistical procedures
for data analysis have been described in the preceding protocols. There have been instances, however, in which
multiple samples of a chemical were tested in the same assay, and different results were obtained among these samples

28 Triethylamine, NTP TOX 78
NOT FOR ATTRIBUTION Peer Review Draft
and/or among laboratories. Results from more than one aliquot or from more than one laboratory are not simply
combined into an overall result. Rather, all the data are critically evaluated, particularly with regard to pertinent
protocol variations, in determining the weight of evidence for an overall conclusion of chemical activity in an assay.
In addition to multiple aliquots, the in vitro assays have another variable that must be considered in arriving at an
overall test result. In vitro assays are conducted with and without exogenous metabolic activation. Results obtained
in the absence of activation are not combined with results obtained in the presence of activation; each testing condition
is evaluated separately. The results presented in the Abstract of this Toxicity Study Report represent a scientific
judgment of the overall evidence for activity of the chemical in an assay.

29
Peer Review Draft NOT FOR ATTRIBUTION
RESULTS
RATS
2-WEEK STUDY Rats exposed to 800 or 1,000 ppm triethylamine died after the first exposure on day 1 (Table 2). Final mean body
weights of all surviving exposed male rats and the 200 and 400 ppm female rats were significantly less than those of
the chamber controls; mean body weight gains were significantly less in all surviving groups. In addition to ataxia
and tremors that were observed initially on day 1, lethargy, abnormal breathing, and nasal discharge were observed
throughout the study in the 400 ppm rats. Abnormal breathing was observed in all 400 ppm males and females at the
end of the study. Nasal discharge (one male and one female) and lethargy (all male and female rats) were observed
only on the first 2 days of exposure to 200 ppm.
TABLE 2 Survival and Body Weights of Rats in the 2-Week Inhalation Study of Triethylaminea
Concentration (ppm)
Survivalb
Initial Body Weight (g)
Final Body Weight (g)
Change in Body Weight (g)
Final Weight
Relative to Controls
(%)
Male
0 5/5 102 ± 2 170 ± 4 68 ± 3 100 5/5 100 ± 3 159 ± 4* 59 ± 2* 94 200 5/5 102 ± 2 152 ± 3** 49 ± 2** 89 400 5/5 101 ± 2 120 ± 3** 19 ± 2** 70 800 0/5c 102 ± 2 — — —
1,000 0/5c 101 ± 3 — — — Female
0 5/5 89 ± 2 128 ± 2 39 ± 1 100 5/5 91 ± 1 125 ± 2 35 ± 1* 98 200 5/5 89 ± 2 117 ± 3** 28 ± 2** 91 400 5/5 89 ± 2 103 ± 3** 14 ± 2** 80 800 0/5c 89 ± 1 — — —
1,000 0/5c 87 ± 2 — — —
* Significantly different (P≤0.05) from the chamber control group by Williams’ test ** P≤0.01 a Weights and weight changes are given as mean ± standard error. Subsequent calculations are based on animals surviving to the end of the study. b Number of animals surviving at 16 days/number initially in group c Day of deaths: 1
30 Triethylamine, NTP TOX 78
NOT FOR ATTRIBUTION Peer Review Draft
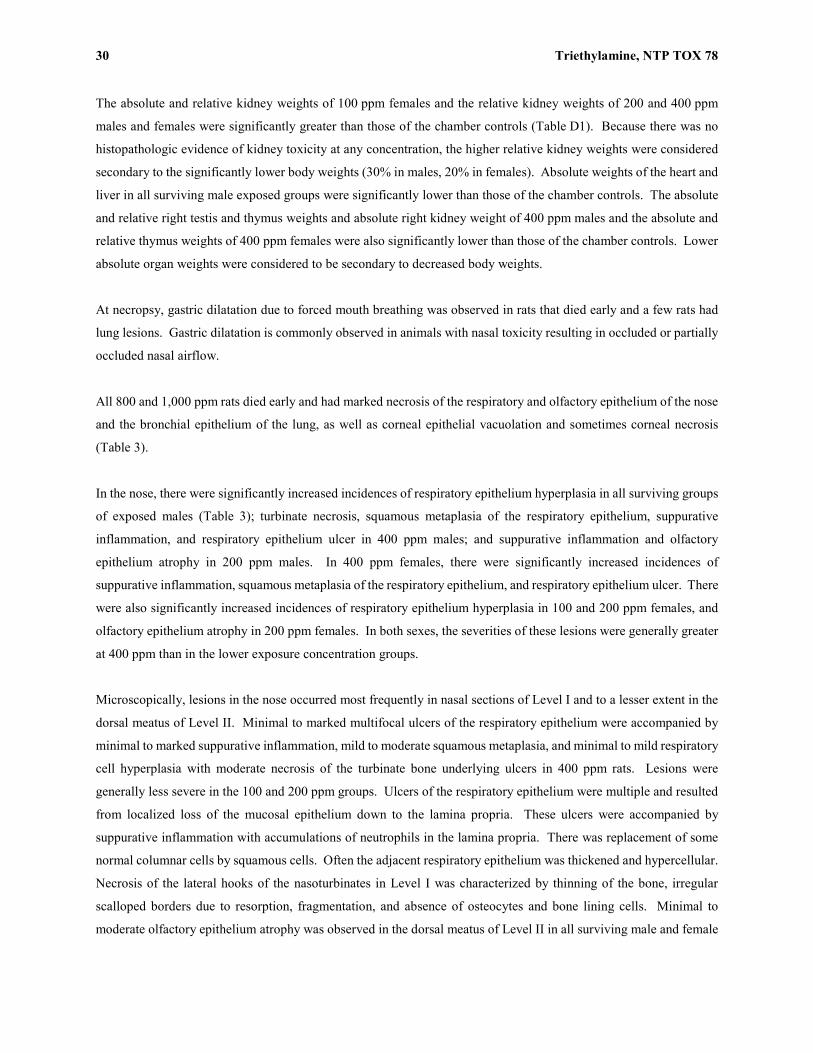
The absolute and relative kidney weights of 100 ppm females and the relative kidney weights of 200 and 400 ppm
males and females were significantly greater than those of the chamber controls (Table D1). Because there was no
histopathologic evidence of kidney toxicity at any concentration, the higher relative kidney weights were considered
secondary to the significantly lower body weights (30% in males, 20% in females). Absolute weights of the heart and
liver in all surviving male exposed groups were significantly lower than those of the chamber controls. The absolute
and relative right testis and thymus weights and absolute right kidney weight of 400 ppm males and the absolute and
relative thymus weights of 400 ppm females were also significantly lower than those of the chamber controls. Lower
absolute organ weights were considered to be secondary to decreased body weights.
At necropsy, gastric dilatation due to forced mouth breathing was observed in rats that died early and a few rats had
lung lesions. Gastric dilatation is commonly observed in animals with nasal toxicity resulting in occluded or partially
occluded nasal airflow.
All 800 and 1,000 ppm rats died early and had marked necrosis of the respiratory and olfactory epithelium of the nose
and the bronchial epithelium of the lung, as well as corneal epithelial vacuolation and sometimes corneal necrosis
(Table 3).
In the nose, there were significantly increased incidences of respiratory epithelium hyperplasia in all surviving groups
of exposed males (Table 3); turbinate necrosis, squamous metaplasia of the respiratory epithelium, suppurative
inflammation, and respiratory epithelium ulcer in 400 ppm males; and suppurative inflammation and olfactory
epithelium atrophy in 200 ppm males. In 400 ppm females, there were significantly increased incidences of
suppurative inflammation, squamous metaplasia of the respiratory epithelium, and respiratory epithelium ulcer. There
were also significantly increased incidences of respiratory epithelium hyperplasia in 100 and 200 ppm females, and
olfactory epithelium atrophy in 200 ppm females. In both sexes, the severities of these lesions were generally greater
at 400 ppm than in the lower exposure concentration groups.
Microscopically, lesions in the nose occurred most frequently in nasal sections of Level I and to a lesser extent in the
dorsal meatus of Level II. Minimal to marked multifocal ulcers of the respiratory epithelium were accompanied by
minimal to marked suppurative inflammation, mild to moderate squamous metaplasia, and minimal to mild respiratory
cell hyperplasia with moderate necrosis of the turbinate bone underlying ulcers in 400 ppm rats. Lesions were
generally less severe in the 100 and 200 ppm groups. Ulcers of the respiratory epithelium were multiple and resulted
from localized loss of the mucosal epithelium down to the lamina propria. These ulcers were accompanied by
suppurative inflammation with accumulations of neutrophils in the lamina propria. There was replacement of some
normal columnar cells by squamous cells. Often the adjacent respiratory epithelium was thickened and hypercellular.
Necrosis of the lateral hooks of the nasoturbinates in Level I was characterized by thinning of the bone, irregular
scalloped borders due to resorption, fragmentation, and absence of osteocytes and bone lining cells. Minimal to
moderate olfactory epithelium atrophy was observed in the dorsal meatus of Level II in all surviving male and female
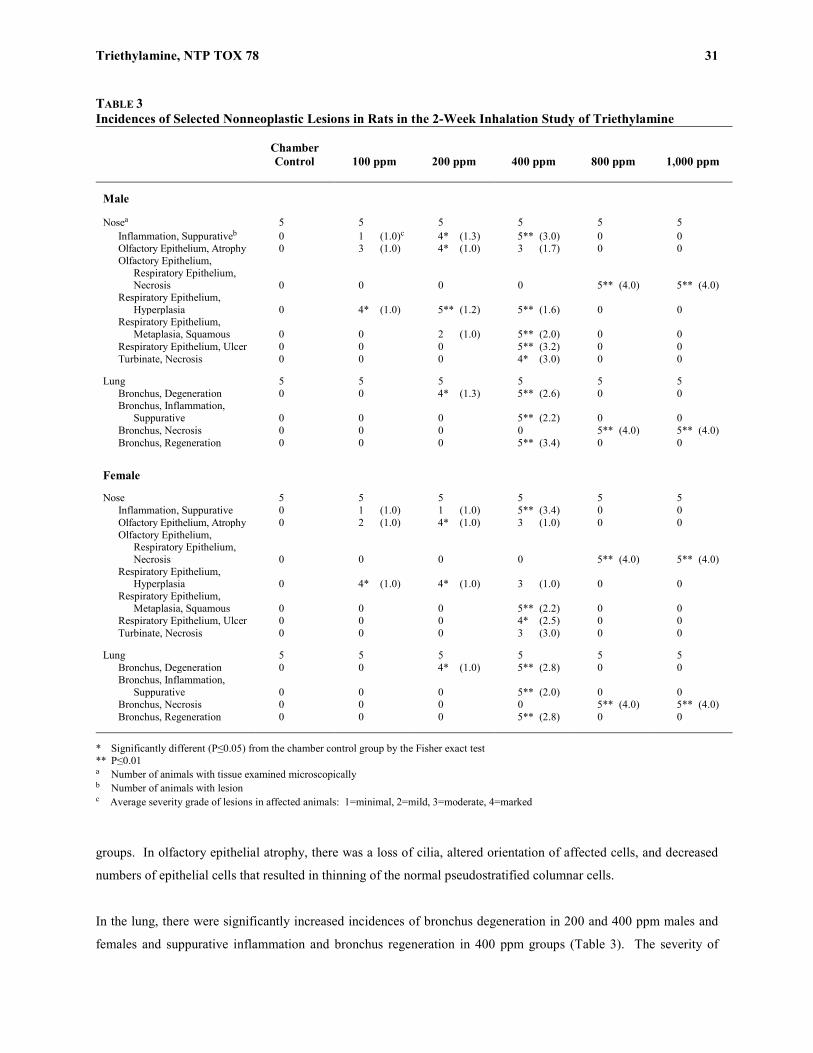
Triethylamine, NTP TOX 78 31
Peer Review Draft NOT FOR ATTRIBUTION
TABLE 3 Incidences of Selected Nonneoplastic Lesions in Rats in the 2-Week Inhalation Study of Triethylamine
Chamber Control
100 ppm
200 ppm
400 ppm
800 ppm
1,000 ppm
Male Nosea 5 5 5 5 5 5
Inflammation, Suppurativeb 0 1 (1.0)c 4* (1.3) 5** (3.0) 0 0 Olfactory Epithelium, Atrophy 0 3 (1.0) 4* (1.0) 3 (1.7) 0 0 Olfactory Epithelium,
Respiratory Epithelium, Necrosis 0 0 0 0 5** (4.0) 5** (4.0)
Respiratory Epithelium, Hyperplasia 0 4* (1.0) 5** (1.2) 5** (1.6) 0 0
Respiratory Epithelium, Metaplasia, Squamous 0 0 2 (1.0) 5** (2.0) 0 0
Respiratory Epithelium, Ulcer 0 0 0 5** (3.2) 0 0 Turbinate, Necrosis 0 0 0 4* (3.0) 0 0
Lung 5 5 5 5 5 5 Bronchus, Degeneration 0 0 4* (1.3) 5** (2.6) 0 0 Bronchus, Inflammation,
Suppurative 0 0 0 5** (2.2) 0 0 Bronchus, Necrosis 0 0 0 0 5** (4.0) 5** (4.0) Bronchus, Regeneration 0 0 0 5** (3.4) 0 0
Female Nose 5 5 5 5 5 5
Inflammation, Suppurative 0 1 (1.0) 1 (1.0) 5** (3.4) 0 0 Olfactory Epithelium, Atrophy 0 2 (1.0) 4* (1.0) 3 (1.0) 0 0 Olfactory Epithelium,
Respiratory Epithelium, Necrosis 0 0 0 0 5** (4.0) 5** (4.0)
Respiratory Epithelium, Hyperplasia 0 4* (1.0) 4* (1.0) 3 (1.0) 0 0
Respiratory Epithelium, Metaplasia, Squamous 0 0 0 5** (2.2) 0 0
Respiratory Epithelium, Ulcer 0 0 0 4* (2.5) 0 0 Turbinate, Necrosis 0 0 0 3 (3.0) 0 0
Lung 5 5 5 5 5 5
Bronchus, Degeneration 0 0 4* (1.0) 5** (2.8) 0 0 Bronchus, Inflammation,
Suppurative 0 0 0 5** (2.0) 0 0 Bronchus, Necrosis 0 0 0 0 5** (4.0) 5** (4.0) Bronchus, Regeneration 0 0 0 5** (2.8) 0 0
* Significantly different (P≤0.05) from the chamber control group by the Fisher exact test ** P≤0.01 a Number of animals with tissue examined microscopically b Number of animals with lesion c Average severity grade of lesions in affected animals: 1=minimal, 2=mild, 3=moderate, 4=marked groups. In olfactory epithelial atrophy, there was a loss of cilia, altered orientation of affected cells, and decreased
numbers of epithelial cells that resulted in thinning of the normal pseudostratified columnar cells.
In the lung, there were significantly increased incidences of bronchus degeneration in 200 and 400 ppm males and
females and suppurative inflammation and bronchus regeneration in 400 ppm groups (Table 3). The severity of

32 Triethylamine, NTP TOX 78
NOT FOR ATTRIBUTION Peer Review Draft
bronchus degeneration was greatest in the 400 ppm groups. Microscopically, minimal to moderate bronchus
degeneration consisted of a loss of cilia and flattening of the bronchial epithelium. Mild to marked bronchus
regeneration consisted of piling up and rounding of the bronchial epithelial cells.
In the eye, vacuolation (microvacuolar degeneration) of the corneal epithelium was noted in the 800 and 1,000 ppm
males and females (Table 4 and Plate 1). In addition, in four males and one female, the central corneal epithelium
was absent, which appeared to be secondary to marked vacuolar degeneration of the basal layer cells resulting in
detachment from the underlying stroma. Although the possibility that autolysis could have contributed to these
changes cannot be completely excluded, the severity of the associated vacuolar degenerative changes and the foci of
residual necrosis were considered by the Pathology Peer Review (PPR) panel to be more consistent with epithelial
loss (ulcer) due to the chemical effect than to the autolysis. In addition, necrosis of the medial portion of the iris and
degeneration of peripheral fibers of the lens (cataracts) were noted in some of the 800 and 1,000 ppm rats. In the rats
exposed to 400 ppm or less, all changes in the eyes were much milder, and included subepithelial vesicles of the
cornea in a few animals in the 100, 200, and 400 ppm groups, sometimes accompanied by scattered apoptotic or
necrotic cells.
TABLE 4 Incidences of Nonneoplastic Lesions of the Eye in Rats in the 2-Week Inhalation Study of Triethylamine
Chamber Control
100 ppm
200 ppm
400 ppm
800 ppm
1,000 ppm
Male Number Examined Microscopically 5 5 5 4 5 5
Cornea, Epithelium, Ulcera 0 0 0 0 3 (2.3)b 4* (2.5) Cornea, Epithelium,
Vacuolation 0 0 0 0 5** (3.6) 5** (2.8) Cornea, Necrosis 0 0 1 (1.0) 0 5** (1.6) 4* (1.3) Cornea, Vesicle, Subepithelial 0 1 2 0 1 0 Iris, Necrosis 0 0 0 0 2 (2.0) 3 (1.7) Lens, Cataract 0 0 0 0 1 (1.0) 2 (1.0)
Female Number Examined Microscopically 5 5 5 5 5 5
Cornea, Epithelium, Ulcer 0 0 0 0 0 1 (3.0) Cornea, Epithelium,
Vacuolation 0 0 0 0 4* (3.3) 4* (2.8) Cornea, Necrosis 0 1 (1.0) 1 (1.0) 0 1 (3.0) 1 (1.0) Cornea, Vesicle, Subepithelial 0 2 2 2 0 0 Iris, Necrosis 0 0 0 0 1 (2.0) 0 Lens, Cataract 0 0 0 0 1 (2.0) 1 (2.0)
* Significantly different (P≤0.05) from the chamber control group by the Fisher exact test ** P≤0.01 a Number of animals with lesion b Average severity grade of lesions in affected animals: 1=minimal, 2=mild, 3=moderate, 4=marked

Triethylamine, NTP TOX 78 33
Peer Review Draft NOT FOR ATTRIBUTION
Exposure concentration selection rationale: Exposure to concentrations of 800 and 1,000 ppm resulted in decreased
survival. Exposure to 400 ppm resulted in decreased body weights (20% to 30%), decreased organ weights, and
moderate histopathologic changes in the nose of male and female rats. The effects on body weight and the nasal cavity
were less severe in groups exposed to 200 ppm or less. Therefore, exposure concentrations of 0, 12.5, 25, 50, 100,
and 200 ppm triethylamine were selected for the 3-month study.

34 Triethylamine, NTP TOX 78
NOT FOR ATTRIBUTION Peer Review Draft
3-MONTH STUDY All rats survived to the end of the study (Table 5). The final mean body weights and body weight gains of males and
females exposed to 200 ppm were significantly less than those of the chamber controls (Table 5; Figure 1). Abnormal
breathing and thinness were noted in one 100 ppm female; no other chemical-related clinical findings were observed.
TABLE 5 Survival and Body Weights of Rats in the 3-Month Inhalation Study of Triethylaminea
Concentration (ppm)
Survivalb
Initial Body Weight (g)
Final Body Weight (g)
Change in Body Weight (g)
Final Weight
Relative to Controls
(%)
Male
0 10/10 107 ± 4 347 ± 7 240 ± 6 12.5 10/10 107 ± 3 360 ± 8 253 ± 7 104 25 10/10 108 ± 3 343 ± 9 235 ± 7 99 50 10/10 109 ± 5 352 ± 8 243 ± 7 101
100 10/10 108 ± 4 338 ± 4 230 ± 5 97 200 10/10 107 ± 4 300 ± 5** 193 ± 5** 87
Female
0 10/10 91 ± 3 209 ± 4 117 ± 4 12.5 10/10 90 ± 3 211 ± 4 120 ± 4 101 25 10/10 91 ± 2 204 ± 3 113 ± 2 98 50 10/10 92 ± 3 207 ± 5 115 ± 4 99
100 10/10 91 ± 3 198 ± 5 107 ± 5 95 200 10/10 92 ± 2 181 ± 3** 89 ± 3** 87
** Significantly different (P≤0.01) from the chamber control group by Williams’ test a Weights and weight changes are given as mean ± standard error. b Number of animals surviving at 14 weeks/number initially in group

Triethylamine, NTP TOX 78 35
Peer Review Draft NOT FOR ATTRIBUTION
FIGURE 1 Growth Curves for Rats Exposed to Triethylamine by Inhalation for 3 Months
36 Triethylamine, NTP TOX 78
NOT FOR ATTRIBUTION Peer Review Draft
There were no changes in the hematology endpoints that would be considered toxicologically relevant to triethylamine
exposure (Table C1). At day 3 in male and female rats exposed to 25 ppm or greater, there appeared to be a transient
decrease in white blood cell numbers involving lymphocytes and eosinophils, which generally disappeared by day 23.
The relevance of this transient leukocyte response to the potential toxicity of triethylamine is questionable. There
were small (<15%) decreases in albumin, globulin, and total protein concentrations in males and females exposed to
100 or 200 ppm. This decrease in protein occurred only at week 14 and may have been related to the lower mean
body weights.
The absolute heart, liver, lung, and thymus weights of 200 ppm males and the absolute heart, liver, and thymus weights
of 200 ppm females were significantly less than those of the chamber control groups (Table D2). The changes were
considered to be related to decreased body weights.
Slight decreases in epididymal sperm motility were observed in 50, 100, and 200 ppm males (3%, 4%, and 6%,
respectively, compared to chamber controls) and slight increases (10%) in the number of spermatid heads per mg testis
were observed in 100 and 200 ppm males (Table E1). Although exposed female rats exhibited a slight tendency
towards increased amounts of time spent in metestrus, the increases were not significant and the number of cycling
females, number of females with irregular cycles, and the lengths and numbers of the estrous cycles were similar to
those of the chamber controls (Tables E2 and E3; Figure 1).
In the olfactory epithelium of the nose, there were significantly increased incidences of atrophy in males exposed to
50 ppm or greater and in females exposed to 25 ppm or greater (Tables 6, A1, and A2). In the respiratory epithelium
of the nose, there were significantly increased incidences of hyperplasia in males and females exposed to 25 ppm or
greater. The severities of these nasal lesions generally increased with increasing exposure concentration.
Microscopically, olfactory epithelium atrophy was a minimal to moderate change affecting the dorsal meatus in nasal
section Level II of the nose and in more severe cases the dorsal meatus and septum in Level III. This atrophy was
characterized by varying degrees of loss of olfactory sensory neurons from the epithelium, and decreases in nerve
bundles and Bowman’s glands in the lamina propria. The affected epithelium was hypocellular and reduced in height.
Small, ovoid cavities surrounded by a single layer of cuboidal epithelial cells that appeared to be the ducts of
Bowman’s glands were sometimes seen within the atrophic epithelium.
Respiratory epithelium hyperplasia was a minimal to moderate change affecting the tall columnar epithelium of the
septum in Levels I and II and sometimes the turbinates in Level II as well as the cuboidal to low columnar epithelium
on the lateral wall and turbinates in Level I. Hyperplasia was characterized by increased numbers of closely packed
epithelial cells with crowded nuclei, which caused thickening of the epithelium and often appeared to form two or
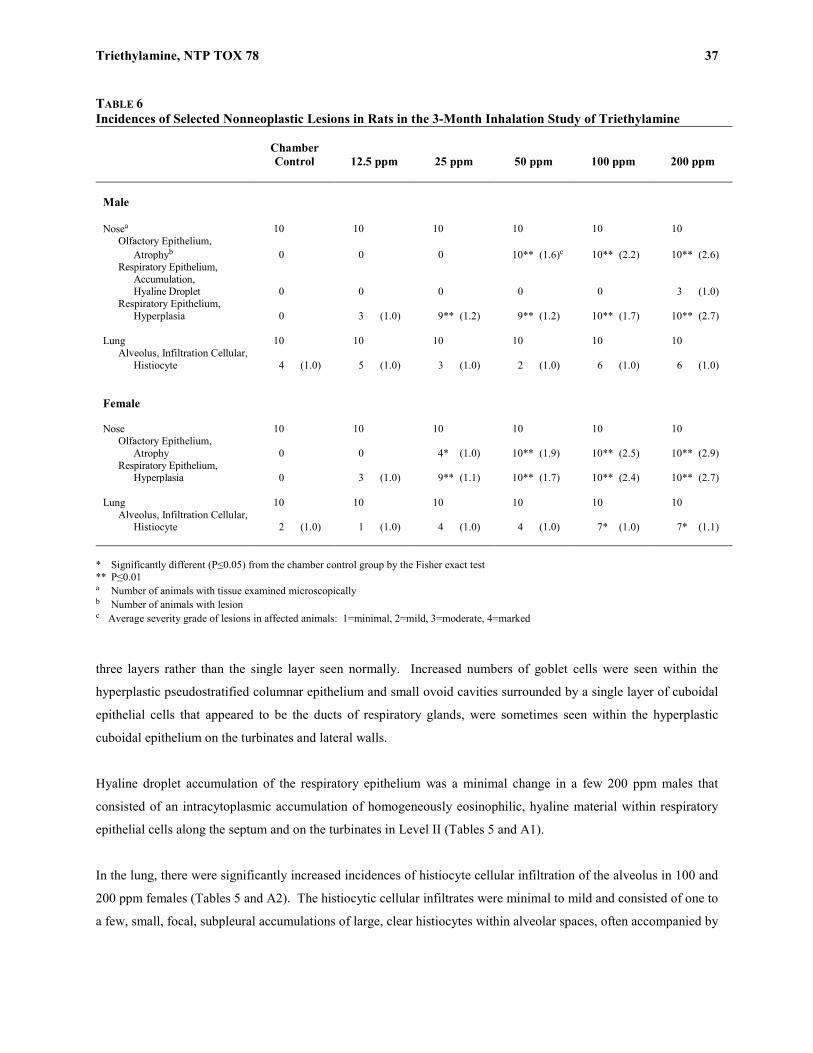
Triethylamine, NTP TOX 78 37
Peer Review Draft NOT FOR ATTRIBUTION
TABLE 6 Incidences of Selected Nonneoplastic Lesions in Rats in the 3-Month Inhalation Study of Triethylamine
Chamber Control
12.5 ppm
25 ppm
50 ppm
100 ppm
200 ppm
Male Nosea 10 10 10 10 10 10
Olfactory Epithelium, Atrophyb 0 0 0 10** (1.6)c 10** (2.2) 10** (2.6)
Respiratory Epithelium, Accumulation, Hyaline Droplet 0 0 0 0 0 3 (1.0)
Respiratory Epithelium, Hyperplasia 0 3 (1.0) 9** (1.2) 9** (1.2) 10** (1.7) 10** (2.7)
Lung 10 10 10 10 10 10
Alveolus, Infiltration Cellular, Histiocyte 4 (1.0) 5 (1.0) 3 (1.0) 2 (1.0) 6 (1.0) 6 (1.0)
Female Nose 10 10 10 10 10 10
Olfactory Epithelium, Atrophy 0 0 4* (1.0) 10** (1.9) 10** (2.5) 10** (2.9)
Respiratory Epithelium, Hyperplasia 0 3 (1.0) 9** (1.1) 10** (1.7) 10** (2.4) 10** (2.7)
Lung 10 10 10 10 10 10
Alveolus, Infiltration Cellular, Histiocyte 2 (1.0) 1 (1.0) 4 (1.0) 4 (1.0) 7* (1.0) 7* (1.1)
* Significantly different (P≤0.05) from the chamber control group by the Fisher exact test ** P≤0.01 a Number of animals with tissue examined microscopically b Number of animals with lesion c Average severity grade of lesions in affected animals: 1=minimal, 2=mild, 3=moderate, 4=marked three layers rather than the single layer seen normally. Increased numbers of goblet cells were seen within the
hyperplastic pseudostratified columnar epithelium and small ovoid cavities surrounded by a single layer of cuboidal
epithelial cells that appeared to be the ducts of respiratory glands, were sometimes seen within the hyperplastic
cuboidal epithelium on the turbinates and lateral walls.
Hyaline droplet accumulation of the respiratory epithelium was a minimal change in a few 200 ppm males that
consisted of an intracytoplasmic accumulation of homogeneously eosinophilic, hyaline material within respiratory
epithelial cells along the septum and on the turbinates in Level II (Tables 5 and A1).
In the lung, there were significantly increased incidences of histiocyte cellular infiltration of the alveolus in 100 and
200 ppm females (Tables 5 and A2). The histiocytic cellular infiltrates were minimal to mild and consisted of one to
a few, small, focal, subpleural accumulations of large, clear histiocytes within alveolar spaces, often accompanied by
38 Triethylamine, NTP TOX 78
NOT FOR ATTRIBUTION Peer Review Draft
thickening of the alveolar walls due to increased numbers of Type II alveolar epithelial cells and slight fibrous
thickening of the adjacent pleura.
One 200 ppm female was observed clinically to have an eye abnormality and four males and six females exposed to
200 ppm exhibited corneal lesions histologically (Tables 7, A1, and A2). Mineralization of the subepithelial corneal
stroma was noted in three males and two females, and epithelial vacuolation of the microvacuolar type similar to that
observed in the 2-week animals was seen in two of the 200 ppm males. Three of the 200 ppm females exhibited
subepithelial vesicles, and one female showed focal corneal epithelial ulceration. One male and one female exhibited
one or more apoptotic cells within the corneal epithelium (minimal corneal necrosis), and mild chronic inflammation
was present within the corneal stroma of this female. One of the 100 ppm males showed minimal mineralization of
the corneal stroma. These corneal lesions were interpreted as related either to direct chemical effect or to healing
changes (such as the mineralization) secondary to chemical injury. Retinal degeneration was also noted in one 50 ppm
male, one 25 ppm female, two 100 ppm females, and one 200 ppm female. The etiology of the retinal changes was
not certain because retinal degeneration may occur spontaneously in rats, although none was identified in the chamber
controls. In addition, the retinal degeneration in the two 100 ppm females was unusual in that the inner portion of the
retina (the ganglion cell layer, the inner nuclear layer, and the plexiform layers) was atrophic in contrast to the usual
atrophy seen in the outer nuclear and photoreceptor layers; both of these cases were unilateral and patchy. It is possible
that retinal damage was caused by triethylamine or a metabolite delivered either directly through the cornea or possibly
through the retinal blood supply, although there was limited evidence of systemic toxicity in other organs.

Triethylamine, NTP TOX 78 39
Peer Review Draft NOT FOR ATTRIBUTION
TABLE 7 Incidences of Nonneoplastic Lesions of the Eye in Rats in the 3-Month Inhalation Study of Triethylamine
Chamber Control
12.5 ppm
25 ppm
50 ppm
100 ppm
200 ppm
Male Number Examined Microscopically 9 10 10 10 10 10
Cornea, Mineralizationa 0 0 0 0 1 (1.0)b 3 (1.3) Cornea, Necrosis 0 0 0 0 0 1 (1.0) Cornea, Epithelium,
Vacuolation 0 0 0 0 0 2 (1.0) Retina, Degeneration 0 0 0 1 (2.0) 0 0
Female Number Examined Microscopically 10 10 10 10 10 10
Anterior Chamber, Infiltration Cellular, Macrophage 0 0 0 0 0 1 (1.0)
Cornea, Edema 0 0 0 0 0 1 (2.0) Cornea, Inflammation,
Chronic 0 0 0 0 0 1 (2.0) Cornea, Mineralization 0 2 0 0 0 2 (1.0) Cornea, Necrosis 0 0 0 0 0 1 (1.0) Cornea, Vesicle, Subepithelial 0 0 0 0 0 3 Cornea, Epithelium, Ulcer 0 0 0 0 0 1 (1.0) Lens, Cataract 0 0 0 0 0 1 (1.0) Retina, Degeneration 0 0 1 (1.0) 0 2 (2.0) 1 (2.0) Retina, Dysplasia 0 0 0 0 0 1 (2.0)
a Number of animals with lesion b Average severity grade of lesions in affected animals: 1=minimal, 2=mild, 3=moderate, 4=marked
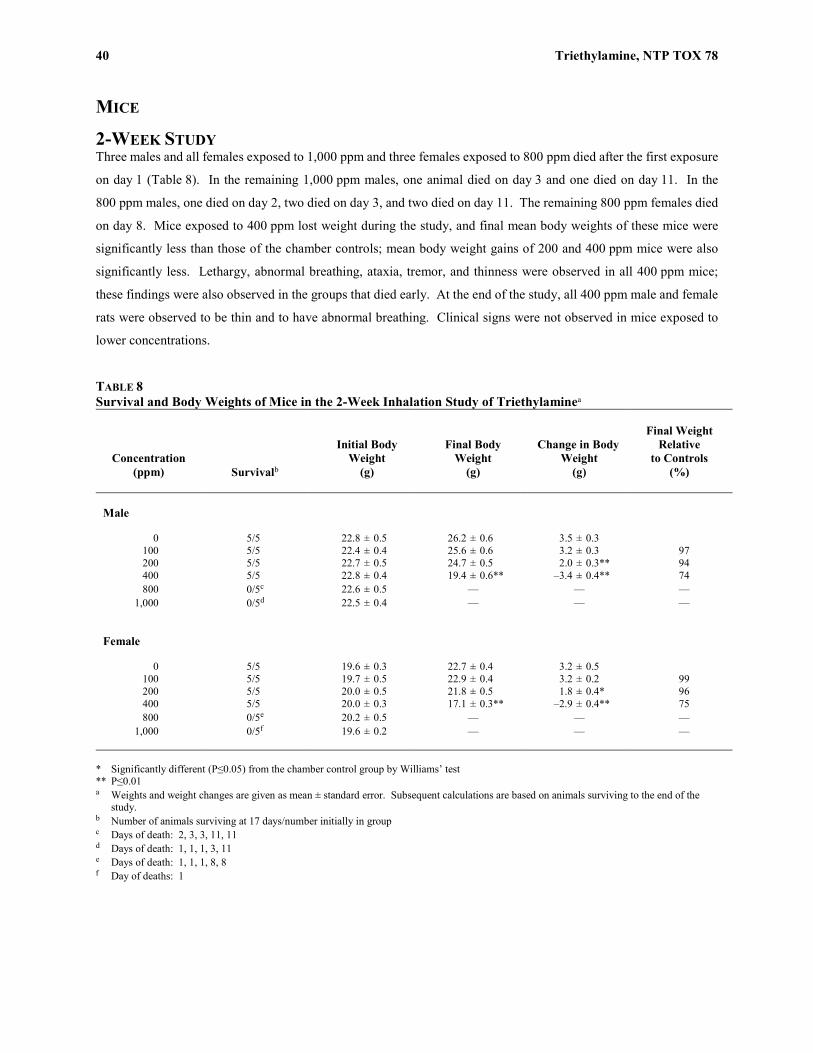
40 Triethylamine, NTP TOX 78
NOT FOR ATTRIBUTION Peer Review Draft
MICE
2-WEEK STUDY Three males and all females exposed to 1,000 ppm and three females exposed to 800 ppm died after the first exposure
on day 1 (Table 8). In the remaining 1,000 ppm males, one animal died on day 3 and one died on day 11. In the
800 ppm males, one died on day 2, two died on day 3, and two died on day 11. The remaining 800 ppm females died
on day 8. Mice exposed to 400 ppm lost weight during the study, and final mean body weights of these mice were
significantly less than those of the chamber controls; mean body weight gains of 200 and 400 ppm mice were also
significantly less. Lethargy, abnormal breathing, ataxia, tremor, and thinness were observed in all 400 ppm mice;
these findings were also observed in the groups that died early. At the end of the study, all 400 ppm male and female
rats were observed to be thin and to have abnormal breathing. Clinical signs were not observed in mice exposed to
lower concentrations.
TABLE 8 Survival and Body Weights of Mice in the 2-Week Inhalation Study of Triethylaminea
Concentration (ppm)
Survivalb
Initial Body Weight (g)
Final Body Weight (g)
Change in Body Weight (g)
Final Weight
Relative to Controls
(%)
Male
0 5/5 22.8 ± 0.5 26.2 ± 0.6 3.5 ± 0.3 100 5/5 22.4 ± 0.4 25.6 ± 0.6 3.2 ± 0.3 97 200 5/5 22.7 ± 0.5 24.7 ± 0.5 2.0 ± 0.3** 94 400 5/5 22.8 ± 0.4 19.4 ± 0.6** –3.4 ± 0.4** 74 800 0/5c 22.6 ± 0.5 — — —
1,000 0/5d 22.5 ± 0.4 — — — Female
0 5/5 19.6 ± 0.3 22.7 ± 0.4 3.2 ± 0.5 100 5/5 19.7 ± 0.5 22.9 ± 0.4 3.2 ± 0.2 99 200 5/5 20.0 ± 0.5 21.8 ± 0.5 1.8 ± 0.4* 96 400 5/5 20.0 ± 0.3 17.1 ± 0.3** –2.9 ± 0.4** 75 800 0/5e 20.2 ± 0.5 — — —
1,000 0/5f 19.6 ± 0.2 — — —
* Significantly different (P≤0.05) from the chamber control group by Williams’ test ** P≤0.01 a Weights and weight changes are given as mean ± standard error. Subsequent calculations are based on animals surviving to the end of the
study. b Number of animals surviving at 17 days/number initially in group c Days of death: 2, 3, 3, 11, 11 d Days of death: 1, 1, 1, 3, 11 e Days of death: 1, 1, 1, 8, 8 f Day of deaths: 1

Triethylamine, NTP TOX 78 41
Peer Review Draft NOT FOR ATTRIBUTION
The absolute liver weights and the absolute and relative thymus weights of 200 and 400 ppm males were significantly
less than those of the chamber controls (Table D3). The absolute and relative liver and thymus weights and the
absolute right kidney weight in 400 ppm females were significantly lower than those of the chamber controls.
Absolute heart weights in 400 ppm males and females were significantly lower than those of the chamber controls.
Absolute organ weight changes were considered to be secondary to body weight changes. Relative organ weight
changes in the 400 ppm males and females may also have been associated with the 25% decrease in mean body
weights.
In the nose, turbinate necrosis occurred in all exposed groups of mice except for the 100 ppm groups and the severity
increased with increased exposure concentration (Table 9). There were significantly increased incidences of olfactory
epithelium atrophy in all surviving groups of exposed mice. There were also significantly increased incidences of
acute inflammation and squamous metaplasia of the respiratory epithelium in 200 and 400 ppm males and females,
and a few incidences of septum cartilaginous regeneration adjacent to areas of septal necrosis in 400 ppm groups.
Microscopically, minimal to marked turbinate necrosis was characterized by partial to complete destruction of
nasoturbinate hooks and maxilloturbinate dorsal tips, often associated with necrosis of the respiratory epithelium and
lamina propria adjacent to the necrotic turbinate bone. The nasal septum cartilage was necrotic in Level I of some
mice, often in association with zones of hyperplastic chondrocytes (cartilaginous regeneration) adjacent to the central
necrotic cartilage. Minimal to marked acute inflammation was usually associated with areas of turbinate necrosis and
was seen as collections of neutrophils in or on the nasal mucosa. Some mice had exudates (proteinaceous fluid and
neutrophils) in the nasal airways. This inflammation was more prominent in mice that survived beyond day 3.
Minimal to moderate squamous metaplasia of the respiratory epithelium was seen on the septum, turbinates, and/or
lateral walls in Levels I and II of the nose in many mice, as the epithelium regenerated and replaced the more
vulnerable respiratory epithelium with one or more layers of low cuboidal or squamous cells. In some mice, soft
tissue and bone underlying the squamous metaplasia was still necrotic, especially on turbinate tips. Squamous
metaplasia was found in most mice exposed to 200 and 400 ppm as well as 800 ppm mice that lived to at least day 11.
Olfactory atrophy was mild or moderate in all mice exposed to 100, 200, or 400 ppm. Atrophy affected the olfactory
epithelium lining the dorsal meatus in Level II, as well as the dorsal septum and adjacent turbinates in Level III. This
atrophy was characterized by varying degrees of loss of olfactory sensory neurons from the epithelium, and decreased
nerve bundles and Bowman’s glands in the lamina propria. The affected epithelium was hypocellular, reduced in
height, and often resembled respiratory epithelium, consistent with “respiratory metaplasia.”
In the lung, there were incidences of focal necrosis of the mainstem bronchial epithelium in 800 and 1,000 ppm males
and females and cytoplasmic vacuolization of the bronchial epithelium in many of the 800 and 1,000 ppm females
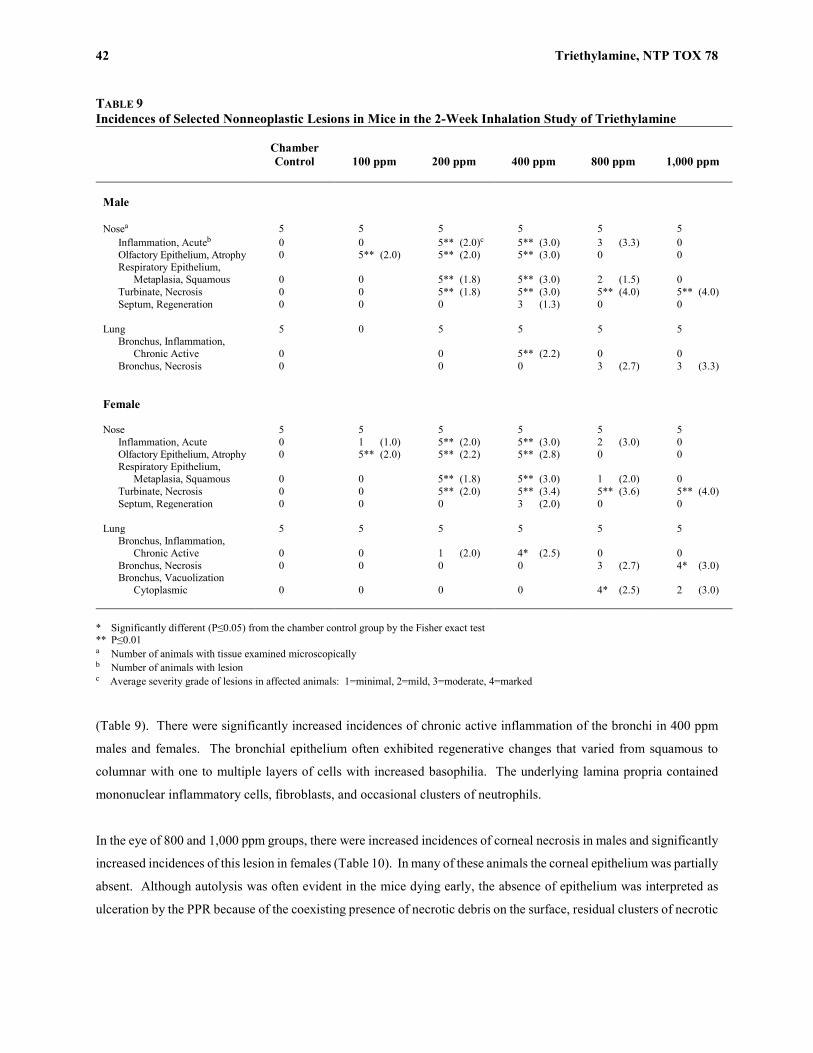
42 Triethylamine, NTP TOX 78
NOT FOR ATTRIBUTION Peer Review Draft
TABLE 9 Incidences of Selected Nonneoplastic Lesions in Mice in the 2-Week Inhalation Study of Triethylamine
Chamber Control
100 ppm
200 ppm
400 ppm
800 ppm
1,000 ppm
Male Nosea 5 5 5 5 5 5
Inflammation, Acuteb 0 0 5** (2.0)c 5** (3.0) 3 (3.3) 0 Olfactory Epithelium, Atrophy 0 5** (2.0) 5** (2.0) 5** (3.0) 0 0 Respiratory Epithelium,
Metaplasia, Squamous 0 0 5** (1.8) 5** (3.0) 2 (1.5) 0 Turbinate, Necrosis 0 0 5** (1.8) 5** (3.0) 5** (4.0) 5** (4.0) Septum, Regeneration 0 0 0 3 (1.3) 0 0
Lung 5 0 5 5 5 5 Bronchus, Inflammation,
Chronic Active 0 0 5** (2.2) 0 0 Bronchus, Necrosis 0 0 0 3 (2.7) 3 (3.3)
Female Nose 5 5 5 5 5 5
Inflammation, Acute 0 1 (1.0) 5** (2.0) 5** (3.0) 2 (3.0) 0 Olfactory Epithelium, Atrophy 0 5** (2.0) 5** (2.2) 5** (2.8) 0 0 Respiratory Epithelium,
Metaplasia, Squamous 0 0 5** (1.8) 5** (3.0) 1 (2.0) 0 Turbinate, Necrosis 0 0 5** (2.0) 5** (3.4) 5** (3.6) 5** (4.0) Septum, Regeneration 0 0 0 3 (2.0) 0 0
Lung 5 5 5 5 5 5 Bronchus, Inflammation,
Chronic Active 0 0 1 (2.0) 4* (2.5) 0 0 Bronchus, Necrosis 0 0 0 0 3 (2.7) 4* (3.0) Bronchus, Vacuolization
Cytoplasmic 0 0 0 0 4* (2.5) 2 (3.0)
* Significantly different (P≤0.05) from the chamber control group by the Fisher exact test ** P≤0.01 a Number of animals with tissue examined microscopically b Number of animals with lesion c Average severity grade of lesions in affected animals: 1=minimal, 2=mild, 3=moderate, 4=marked
(Table 9). There were significantly increased incidences of chronic active inflammation of the bronchi in 400 ppm
males and females. The bronchial epithelium often exhibited regenerative changes that varied from squamous to
columnar with one to multiple layers of cells with increased basophilia. The underlying lamina propria contained
mononuclear inflammatory cells, fibroblasts, and occasional clusters of neutrophils.
In the eye of 800 and 1,000 ppm groups, there were increased incidences of corneal necrosis in males and significantly
increased incidences of this lesion in females (Table 10). In many of these animals the corneal epithelium was partially
absent. Although autolysis was often evident in the mice dying early, the absence of epithelium was interpreted as
ulceration by the PPR because of the coexisting presence of necrotic debris on the surface, residual clusters of necrotic
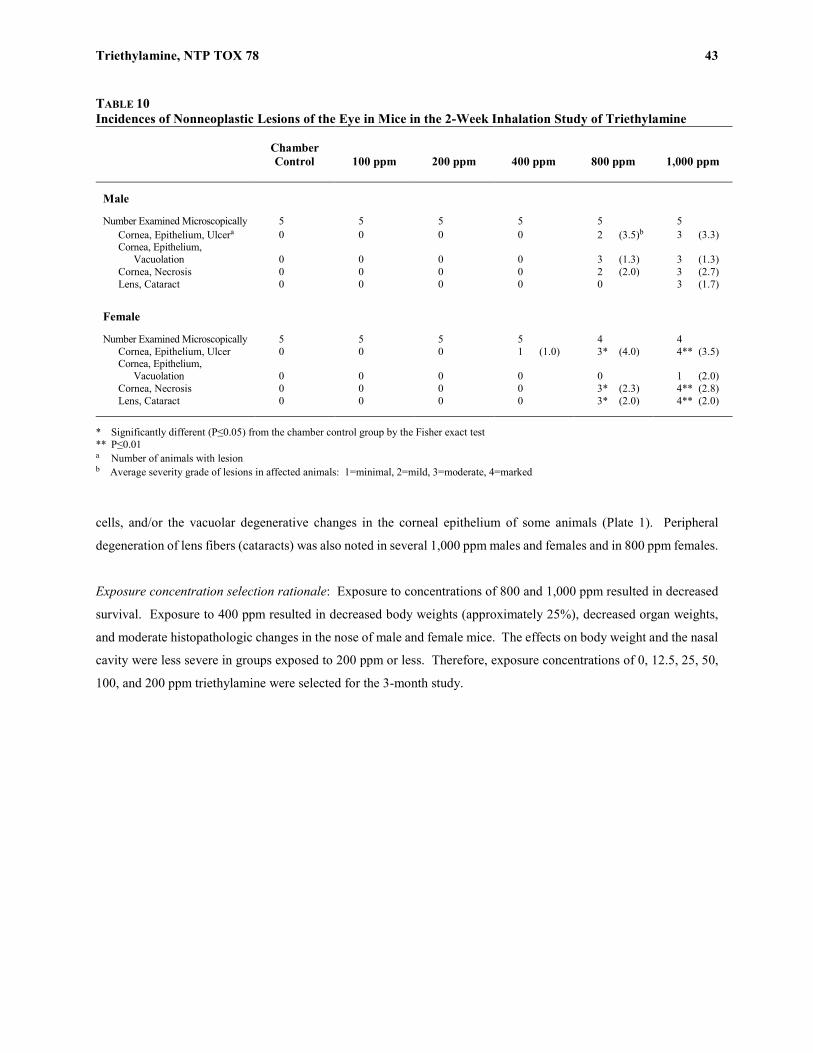
Triethylamine, NTP TOX 78 43
Peer Review Draft NOT FOR ATTRIBUTION
TABLE 10 Incidences of Nonneoplastic Lesions of the Eye in Mice in the 2-Week Inhalation Study of Triethylamine
Chamber Control
100 ppm
200 ppm
400 ppm
800 ppm
1,000 ppm
Male Number Examined Microscopically 5 5 5 5 5 5
Cornea, Epithelium, Ulcera 0 0 0 0 2 (3.5)b 3 (3.3) Cornea, Epithelium,
Vacuolation 0 0 0 0 3 (1.3) 3 (1.3) Cornea, Necrosis 0 0 0 0 2 (2.0) 3 (2.7) Lens, Cataract 0 0 0 0 0 3 (1.7)
Female Number Examined Microscopically 5 5 5 5 4 4
Cornea, Epithelium, Ulcer 0 0 0 1 (1.0) 3* (4.0) 4** (3.5) Cornea, Epithelium,
Vacuolation 0 0 0 0 0 1 (2.0) Cornea, Necrosis 0 0 0 0 3* (2.3) 4** (2.8) Lens, Cataract 0 0 0 0 3* (2.0) 4** (2.0)
* Significantly different (P≤0.05) from the chamber control group by the Fisher exact test ** P≤0.01 a Number of animals with lesion b Average severity grade of lesions in affected animals: 1=minimal, 2=mild, 3=moderate, 4=marked cells, and/or the vacuolar degenerative changes in the corneal epithelium of some animals (Plate 1). Peripheral
degeneration of lens fibers (cataracts) was also noted in several 1,000 ppm males and females and in 800 ppm females.
Exposure concentration selection rationale: Exposure to concentrations of 800 and 1,000 ppm resulted in decreased
survival. Exposure to 400 ppm resulted in decreased body weights (approximately 25%), decreased organ weights,
and moderate histopathologic changes in the nose of male and female mice. The effects on body weight and the nasal
cavity were less severe in groups exposed to 200 ppm or less. Therefore, exposure concentrations of 0, 12.5, 25, 50,
100, and 200 ppm triethylamine were selected for the 3-month study.

44 Triethylamine, NTP TOX 78
NOT FOR ATTRIBUTION Peer Review Draft
3-MONTH STUDY All mice survived to the end of the study (Table 11). The final mean body weights and body weight gains of males
and females exposed to 200 ppm were significantly less than those of the chamber controls (Table 11; Figure 2). No
clinical findings related to triethylamine exposure were observed.
TABLE 11 Survival and Body Weights of Mice in the 3-Month Inhalation Study of Triethylaminea
Concentration (ppm)
Survivalb
Initial Body Weight (g)
Final Body Weight (g)
Change in Body Weight (g)
Final Weight
Relative to Controls
(%)
Male
0 10/10 22.9 ± 0.2 37.6 ± 0.8 14.7 ± 0.6 12.5 10/10 22.8 ± 0.3 38.3 ± 0.9 15.6 ± 0.7 102 25 10/10 22.3 ± 0.2 37.6 ± 0.7 15.2 ± 0.6 100 50 10/10 22.9 ± 0.3 38.6 ± 0.5 15.7 ± 0.5 103
100 10/10 23.0 ± 0.3 38.3 ± 0.6 15.3 ± 0.4 102 200 10/10 22.9 ± 0.3 31.9 ± 0.6** 9.1 ± 0.6** 85
Female
0 10/10 19.7 ± 0.3 32.8 ± 0.8 13.1 ± 0.8 12.5 10/10 19.8 ± 0.3 32.8 ± 0.9 13.1 ± 0.7 100 25 10/10 19.1 ± 0.3 31.4 ± 0.8 12.3 ± 0.8 96 50 10/10 20.1 ± 0.3 33.7 ± 0.5 13.7 ± 0.5 103
100 10/10 19.4 ± 0.3 33.0 ± 0.4 13.6 ± 0.4 101 200 10/10 19.4 ± 0.3 29.3 ± 0.5** 9.9 ± 0.5** 89
** Significantly different (P≤0.01) from the chamber control group by Dunnett’s test a Weights and weight changes are given as mean ± standard error. b Number of animals surviving at 14 weeks/number initially in group
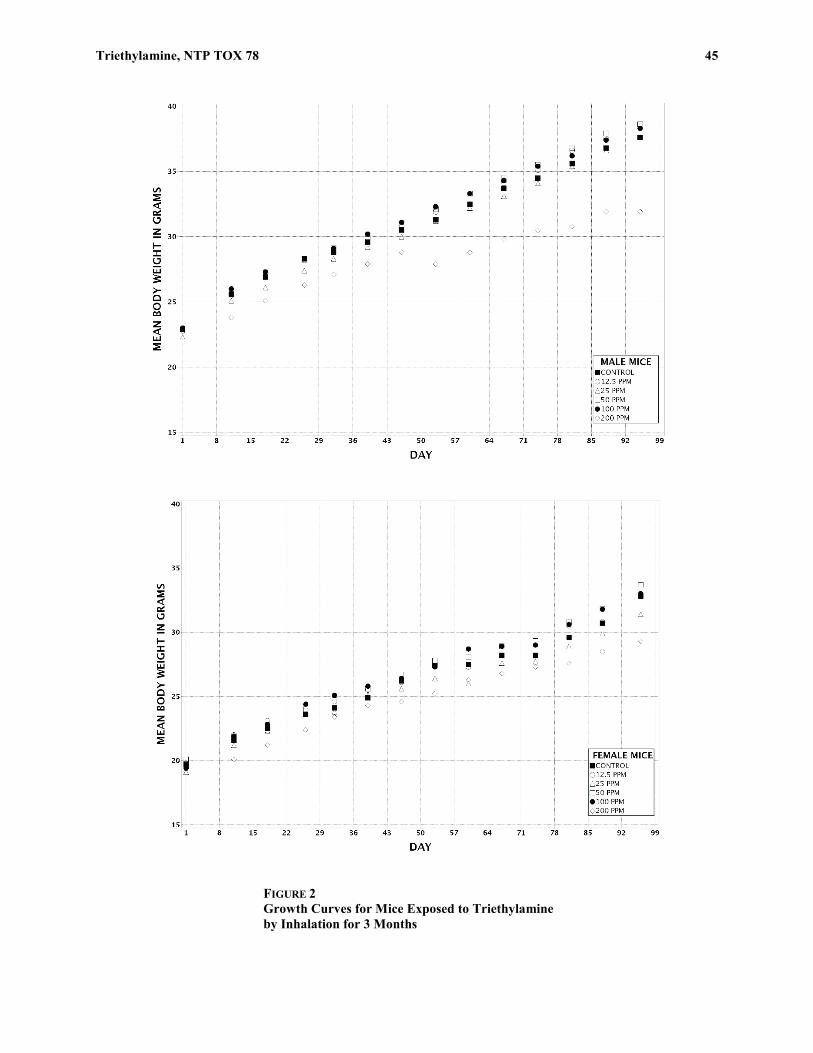
Triethylamine, NTP TOX 78 45
Peer Review Draft NOT FOR ATTRIBUTION
FIGURE 2 Growth Curves for Mice Exposed to Triethylamine by Inhalation for 3 Months
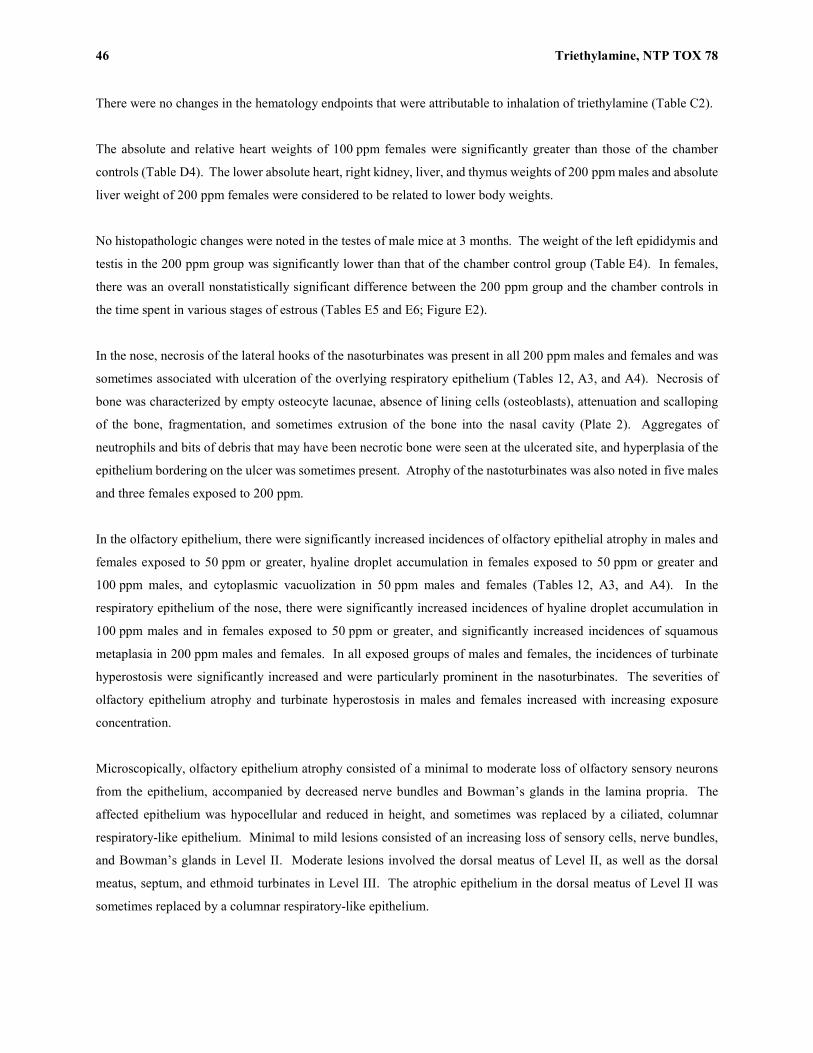
46 Triethylamine, NTP TOX 78
NOT FOR ATTRIBUTION Peer Review Draft
There were no changes in the hematology endpoints that were attributable to inhalation of triethylamine (Table C2).
The absolute and relative heart weights of 100 ppm females were significantly greater than those of the chamber
controls (Table D4). The lower absolute heart, right kidney, liver, and thymus weights of 200 ppm males and absolute
liver weight of 200 ppm females were considered to be related to lower body weights.
No histopathologic changes were noted in the testes of male mice at 3 months. The weight of the left epididymis and
testis in the 200 ppm group was significantly lower than that of the chamber control group (Table E4). In females,
there was an overall nonstatistically significant difference between the 200 ppm group and the chamber controls in
the time spent in various stages of estrous (Tables E5 and E6; Figure E2).
In the nose, necrosis of the lateral hooks of the nasoturbinates was present in all 200 ppm males and females and was
sometimes associated with ulceration of the overlying respiratory epithelium (Tables 12, A3, and A4). Necrosis of
bone was characterized by empty osteocyte lacunae, absence of lining cells (osteoblasts), attenuation and scalloping
of the bone, fragmentation, and sometimes extrusion of the bone into the nasal cavity (Plate 2). Aggregates of
neutrophils and bits of debris that may have been necrotic bone were seen at the ulcerated site, and hyperplasia of the
epithelium bordering on the ulcer was sometimes present. Atrophy of the nastoturbinates was also noted in five males
and three females exposed to 200 ppm.
In the olfactory epithelium, there were significantly increased incidences of olfactory epithelial atrophy in males and
females exposed to 50 ppm or greater, hyaline droplet accumulation in females exposed to 50 ppm or greater and
100 ppm males, and cytoplasmic vacuolization in 50 ppm males and females (Tables 12, A3, and A4). In the
respiratory epithelium of the nose, there were significantly increased incidences of hyaline droplet accumulation in
100 ppm males and in females exposed to 50 ppm or greater, and significantly increased incidences of squamous
metaplasia in 200 ppm males and females. In all exposed groups of males and females, the incidences of turbinate
hyperostosis were significantly increased and were particularly prominent in the nasoturbinates. The severities of
olfactory epithelium atrophy and turbinate hyperostosis in males and females increased with increasing exposure
concentration.
Microscopically, olfactory epithelium atrophy consisted of a minimal to moderate loss of olfactory sensory neurons
from the epithelium, accompanied by decreased nerve bundles and Bowman’s glands in the lamina propria. The
affected epithelium was hypocellular and reduced in height, and sometimes was replaced by a ciliated, columnar
respiratory-like epithelium. Minimal to mild lesions consisted of an increasing loss of sensory cells, nerve bundles,
and Bowman’s glands in Level II. Moderate lesions involved the dorsal meatus of Level II, as well as the dorsal
meatus, septum, and ethmoid turbinates in Level III. The atrophic epithelium in the dorsal meatus of Level II was
sometimes replaced by a columnar respiratory-like epithelium.

Triethylamine, NTP TOX 78 47
Peer Review Draft NOT FOR ATTRIBUTION
TABLE 12 Incidences of Nonneoplastic Lesions of the Nose in Mice in the 3-Month Inhalation Study of Triethylamine
Chamber Control
12.5 ppm
25 ppm
50 ppm
100 ppm
200 ppm
Male Number Examined Microscopically 10 10 10 10 10 10
Olfactory Epithelium, Atrophya 0 0 0 9** (1.4)b 10** (3.0) 10** (3.0)
Olfactory Epithelium, Accumulation, Hyaline Droplet 0 0 0 1 (1.0) 6** (1.2) 0
Olfactory Epithelium, Vacuolization Cytoplasmic 0 0 0 6** (1.8) 0 0
Respiratory Epithelium, Accumulation, Hyaline Droplet 0 0 0 0 9** (1.7) 0
Respiratory Epithelium, Metaplasia, Squamous 0 0 0 0 0 10** (1.1)
Turbinate, Hyperostosis 0 10** (1.0) 9** (2.1) 10** (2.6) 10** (3.5) 10** (3.8) Turbinate, Necrosis 0 0 0 0 0 10** (2.6) Turbinate, Atrophy 0 0 0 0 0 5* (2.0)
Female Number Examined Microscopically 10 10 10 10 10 10
Olfactory Epithelium, Atrophy 0 0 0 10** (1.7) 10** (2.8) 10** (3.0)
Olfactory Epithelium, Accumulation, Hyaline Droplet 0 0 0 7** (1.3) 10** (2.7) 8** (1.9)
Olfactory Epithelium, Vacuolization Cytoplasmic 0 0 0 5* (2.0) 0 0
Respiratory Epithelium, Accumulation, Hyaline Droplet 0 0 0 7** (1.9) 10** (3.2) 8** (2.4)
Respiratory Epithelium, Metaplasia, Squamous 0 0 0 0 0 9** (1.4)
Turbinate, Hyperostosis 0 8** (1.0) 10** (1.6) 10** (2.7) 9** (3.2) 10** (4.0) Turbinate, Necrosis 0 0 0 0 0 10** (2.8) Turbinate, Atrophy 0 0 0 0 0 3 (3.0)
* Significantly different (P≤0.05) from the chamber control group by the Fisher exact test ** P≤0.01 a Number of animals with lesion b Average severity grade of lesions in affected animals: 1=minimal, 2=mild, 3=moderate, 4=marked Hyaline droplet accumulation in the olfactory epithelium consisted of an intracytoplasmic accumulation of
homogeneously eosinophilic, hyaline material. It was minimal to mild in males and minimal to
moderate in females. Similar changes affected the respiratory epithelium of both males and females. They were
minimal to moderate in males and minimal to marked in females.

48 Triethylamine, NTP TOX 78
NOT FOR ATTRIBUTION Peer Review Draft
Cytoplasmic vacuolization of the olfactory epithelium was minimal to mild in males and minimal to moderate in
females and consisted of multiple small to moderately large, round to ovoid, clear spaces scattered diffusely within
the atrophic olfactory epithelium of the dorsal meatus in Level II.
Minimal to mild squamous metaplasia of the respiratory epithelium affected the cuboidal epithelium of the turbinates
and lateral wall in Level I and was characterized by replacement of the normal cuboidal epithelium with one to three
layers of flattened, squamous epithelial cells. The adjacent cuboidal epithelium in some of these animals was slightly
thickened and hypercellular.
Hyperostosis of the nasal turbinates (Plate 2) was characterized by varying degrees of thickening of the nasal bones,
particularly the naso- and maxilloturbinate bones, the nasal septum, and the skull overlying the nasal cavity. Normally
the turbinate bones and skull consist of poorly cellular, layered, well-organized lamella bone. The affected bones
were thickened by the deposition of cellular, disorganized woven bone, indicative of active bone formation or by bone
with mixed woven and lamellar features. The thickened turbinates were characterized by numerous cement lines,
which were often irregular and indicative of reversal cement lines, and the presence of numerous empty osteocyte
lacunae. Lining cells (osteoblasts) were usually seen on the outer surface of the turbinates, but osteoclasts were seldom
seen except occasionally in association with resorption of necrotic naso- or maxilloturbinate hooks. The severity of
this change ranged from minimal to marked, with the average severity increasing with increasing dose. Minimal
lesions consisted of slight thickening of the nasoturbinates and sometimes of the skull in Level I. Mild lesions
consisted of fairly prominent thickening of the nasoturbinates usually with slight thickening of the tips of the
maxilloturbinates and the skull in Level I. Moderate lesions consisted of prominent thickening of the naso- and
maxilloturbinates and the skull in Level I. Marked lesions consisted of pronounced thickening of the naso- and
maxilloturbinates and the skull in Level I, usually with obvious involvement of the bones in Level II as well.
GENETIC TOXICOLOGY Triethylamine (100 to 10,000 µg/plate) was not mutagenic in Salmonella typhimurium strains TA98, TA100, TA1535,
or TA1537 with or without hamster liver S9 activation enzymes (Table B1; Zeiger et al., 1987).
A small, concentration-related increase in the frequency of micronucleated erythrocytes (biomarkers of chromosomal
damage) was observed in peripheral blood of male mice in the 3-month study; the response, which was judged to be
equivocal, was observed over the exposure concentration range of 12.5 to 200 ppm (Table B2). No single exposed
group was significantly elevated over the concurrent chamber control, but the trend test yielded a significant P value
(0.006). No increase in micronucleated erythrocytes was seen in female mice. No significant changes in the
percentage of polychromatic erythrocytes (immature erythrocytes) were noted in either male or female mice exposed
to triethylamine, indicating an absence of bone marrow toxicity.
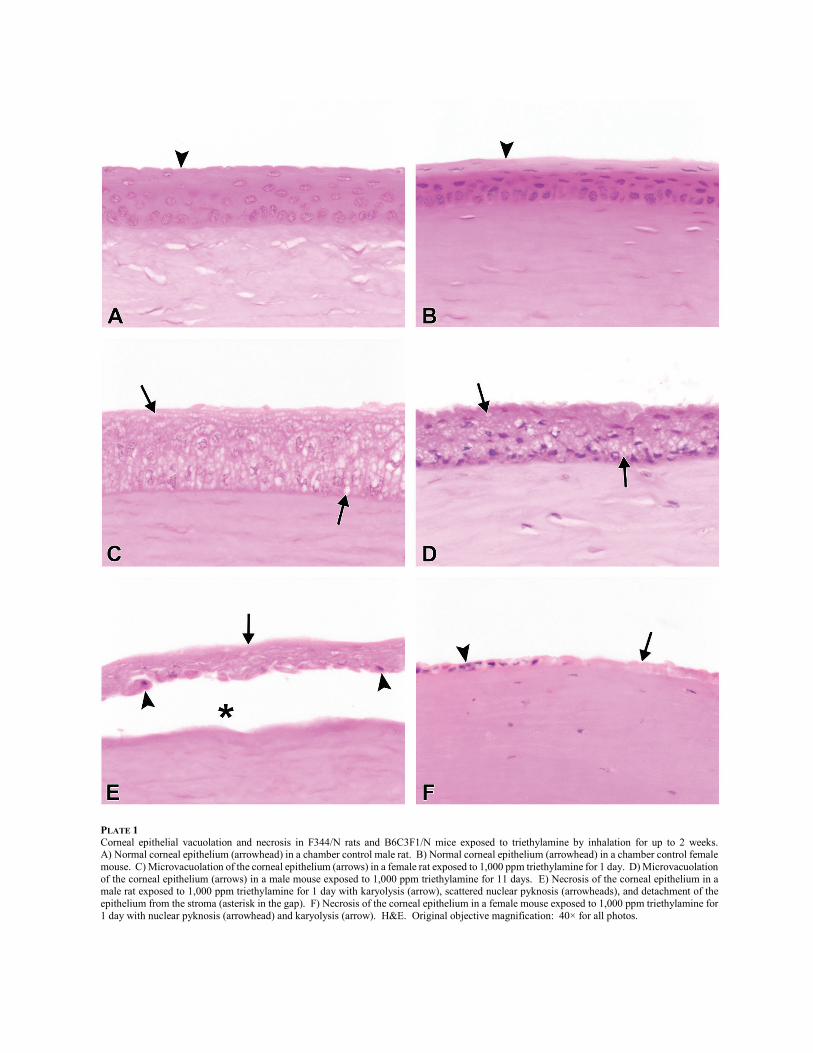
PLATE 1 Corneal epithelial vacuolation and necrosis in F344/N rats and B6C3F1/N mice exposed to triethylamine by inhalation for up to 2 weeks. A) Normal corneal epithelium (arrowhead) in a chamber control male rat. B) Normal corneal epithelium (arrowhead) in a chamber control female mouse. C) Microvacuolation of the corneal epithelium (arrows) in a female rat exposed to 1,000 ppm triethylamine for 1 day. D) Microvacuolation of the corneal epithelium (arrows) in a male mouse exposed to 1,000 ppm triethylamine for 11 days. E) Necrosis of the corneal epithelium in a male rat exposed to 1,000 ppm triethylamine for 1 day with karyolysis (arrow), scattered nuclear pyknosis (arrowheads), and detachment of the epithelium from the stroma (asterisk in the gap). F) Necrosis of the corneal epithelium in a female mouse exposed to 1,000 ppm triethylamine for 1 day with nuclear pyknosis (arrowhead) and karyolysis (arrow). H&E. Original objective magnification: 40× for all photos.

PLATE 2 Nasal turbinate hyperostosis and necrosis in B6C3F1/N mice exposed to triethylamine by inhalation for 3 months. A) Normal slender nasoturbinate bones (arrows) in a chamber control female mouse. B) Thickened (hyperostotic) nasoturbinates (arrows) in a female mouse exposed to 200 ppm triethylamine. Note that the nasal crest is also thickened (arrowhead) in this image taken at the same magnification as image A. C) Hyperostosis of the nasoturbinate in a female mouse exposed to 200 ppm triethylamine. Although there are many empty osteocyte lacunae (arrows) indicative of osteocyte necrosis, the osteoblasts rimming the bone (arrowhead) are viable and activated, and the bone is markedly thickened. D) Necrosis of the lateral hook of the nasoturbinate (arrow) in a female mouse exposed to 200 ppm triethylamine. The necrosis is characterized by the absence of both osteocytes and osteoblasts, attenuation of the bone, and extrusion of the distal end of the hook (arrowhead) into the nasal cavity accompanied by neutrophilic exudate. H&E. Original objective magnification: A=4×, B=4×, C=20×, D=20×.

49
Peer Review Draft NOT FOR ATTRIBUTION
DISCUSSION
Triethylamine is a highly alkaline and corrosive aliphatic amine with widespread occupational use. Because it has a
relatively high vapor pressure, inhalation exposure to triethylamine vapors is an occupational hazard in industries
where it is used. Triethylamine is a direct-acting contact irritant, and exposure to its vapors can cause irritation to the
eyes and the mucous membranes lining the respiratory tract. Exposure of workers to triethylamine vapors results
primarily in irritation of the eyes at concentrations greater than 5 ppm and irritation of the nose and throat at higher
concentrations (greater than 15 ppm) resulting in coughing and wheezing (Warren and Selchan, 1988). Although
respiratory distress can occur in situations of extreme exposure (Ashland Chemical, 1986), acute occupational
exposures to triethylamine are usually self-limiting because the severe irritation to the eyes, nose, and throat results in
workers being removed from exposure.
The target sites for triethylamine vapors are similar in humans and rodents; however, because rodents are obligate
nose breathers the nasal cavity is often more severely affected than in humans. The nasal cavity is the primary target
site for rodents exposed to many direct-acting, reactive, gaseous chemicals such as chlorine (Jiang et al., 1983),
formaldehyde, ammonia (Broderson et al., 1976), acetaldehyde (Kruysse et al., 1975), and acrolein (Feron et al.,
1978). In addition to the nasal irritation, aliphatic amines also have been reported to cause tracheitis, bronchitis,
pneumonitis and pulmonary edema (Beard and Noe, 1981; Steinhagen et al., 1982; Buckley et al., 1985; Gross et al.,
1987).
In the current studies, triethylamine toxicity was primarily restricted to the nose and eye. Species and gender
differences in susceptibility to triethylamine were minor. In 2-week studies, triethylamine was lethal for rats and mice
exposed to concentrations of 800 or 1,000 ppm. Marked necrosis of the olfactory epithelium of the nose in rats and
bronchial necrosis and corneal degeneration (vacuolation) and necrosis in both rats and mice were present in animals
that died early. These lesions in the nose and bronchi were not observed in surviving rats exposed to 400 ppm or less,
although corneal lesions of lesser severity were noted in a few 400 ppm females and a few 200 and 100 ppm male and
female rats. Nasal lesions were exposure concentration-related in surviving animals and were most severe in rats and
mice exposed to 400 ppm. The observed decreases in body weights may have been related to a reduced feed intake
associated with triethylamine effects on olfaction.
Exposure to 400 ppm triethylamine for 2 weeks caused necrosis of turbinate bone, squamous metaplasia of respiratory
epithelium, and atrophy of olfactory epithelium. At 400 ppm, lesions also extended to the lower airways with
bronchial degeneration and suppurative inflammation in rats and chronic active inflammation of the bronchi in mice.

50 Triethylamine, NTP TOX 78
NOT FOR ATTRIBUTION Peer Review Draft
Exposure to 200 ppm produced less severe bronchial and nasal lesions than produced by 400 ppm, and at 100 ppm
there were no lung lesions and nasal lesions were minimal except for mild olfactory epithelial atrophy in mice. Similar
types of nasal lesions (turbinate necrosis, squamous metaplasia, and olfactory atrophy) in rats and mice were observed
after exposure for 2 weeks to the structurally related aliphatic amine, diethylamine (NTP, 2012).
In the 3-month studies, nasal lesions in rats consisted primarily of respiratory epithelial hyperplasia and olfactory
epithelial atrophy, and the severity of nasal lesions increased with increasing exposure concentration. On the other
hand, nasoturbinate necrosis was present in all male and female mice exposed to 200 ppm triethylamine and turbinate
atrophy was present in several of these 200 ppm mice. In addition, hyperostosis (osteopetrosis) of the turbinates was
present in almost all mice exposed for 3 months, and the severity increased with increasing triethylamine
concentration. Hyperostosis of the nasal turbinates is an uncommon nonneoplastic thickening of the naso- and
maxilloturbinate bones. Mechanisms of hyperostosis may be divided into proliferative and nonproliferative
categories, based upon evidence of either increased bone cell proliferation or decreased bone resorption, respectively
(Long et al., 1993). This lesion has been reported in 15 (including the current study) of over 500 NTP studies. Most
of these 15 studies were 2-year studies, and the incidences of hyperostosis were low and not dose related. In only four
of these 15 studies did there appear to be a significant association with treatment; three of these were inhalation studies
(triethylamine, diethylamine, and 1,2-epoxybutane), and one was a chronic feed study (C.I. Pigment Red 3) (NTP,
1988, 1992, 2012). The triethylamine (3-month) and diethylamine (2-year) studies were unique in that all of the mice
exposed to the highest concentrations exhibited the lesion, whereas only low incidences were reported in the other
studies. In addition, hyperostosis of the turbinates was observed in only a few rats in the 2-year diethylamine study
and none in the 3-month triethylamine study, suggesting a species difference in susceptibility.
Corneal irritation and edema have been documented in workers exposed to triethylamine concentrations as low as 4
to 6 ppm (Åkesson et al., 1986). In the current 2-week rat study, the no-observed-effect level (NOEL) for ocular
lesions was less than 100 ppm. These lesions consisted of corneal degeneration (vacuolation), corneal necrosis, and
cataracts in both rats and mice exposed to the higher exposure concentrations. With the reduced exposure
concentrations used in the 3-month studies, ocular lesions were less severe in the rats and absent in the mice. Because
triethylamine reacts directly with the corneal epithelium, it is unlikely that rodents are more resistant than humans to
these ocular effects, but rather the animals were able to limit ocular exposure by closing their eyes during the 6-hour
exposures. These exposures also took place during daytime when rodents are not normally awake and active. The
visual disturbances reported by workers are the earliest and most sensitive markers of triethylamine exposure. Visual
disturbances included irritation, blurred vision, glaucopsia (blue-gray vision), and halo vision. Although these changes
may also occur in rodents, detection of these markers is not clinically possible.
The mechanism(s) by which triethylamine and other amines cause visual disturbances is unknown. It has been
suggested that edema and increased corneal thickness may cause light scattering resulting in the reported visual effects
(Mellerio and Weale, 1966; Union Carbide, 1984). Mellerio and Weale (1966) also proposed that glaucopsia may be
Triethylamine, NTP TOX 78 51
Peer Review Draft NOT FOR ATTRIBUTION
related to the Tyndall effect caused by denaturation of proteins in the corneal epithelium. Corneal edema and
mydriasis with cycloplegia have also been proposed as major reasons for the visual disturbances caused by amines
(Albrecht and Stephenson, 1988). Halo vision reported by exposed workers may result from diffraction of light into
spectral colors by droplets of fluid in the corneal epithelia (Union Carbide, 1984). Examination of corneas of workers
exposed to aliphatic amines under slit-lamp microscopy revealed a diffuse edema with numerous small vesicular
collections of fluid within the corneal stroma (Dernehl, 1966). As noted in the Results section of the current Toxicity
Study Report, microvacuolation of the corneal epithelium was seen in many of the rats and mice in the high exposure
concentration groups in the 2-week studies. The subepithelial vesicles of the cornea that were present in some of the
exposed male and female rats in the current study are probably similar to the subepithelial microcysts reported by
Järvinen et al. (1999) and the subepithelial vesicles described by Potts et al. (1986) and Dernehl (1966) in humans
exposed to triethylamine.
Inhaled triethylamine is readily absorbed from the lungs and can be detected in urine and plasma in humans (Åkesson
et al., 1989a,b) suggesting that pulmonary absorption and systemic exposure to triethylamine can also occur in
exposed rats and mice. While systemic exposure may have occurred in the current study, there was little evidence of
systemic toxicity. Some organ weights of rats and mice were significantly different from those of the chamber
controls, suggesting potential systemic toxicity. The lower absolute organ weights and higher relative organ weights
were attributed to significantly lower body weights.
The high urinary excretion of triethylamine in exposed humans (Åkesson et al., 1988) and the significantly higher
relative kidney weights of male and female rats in the 2-week and 3-month studies suggested potential systemic
exposure-related nephrotoxicity. Similarly, relative kidney weights in male and female rats exposed for 3 months to
the structurally related aliphatic amine, diethylamine, were greater than those of the chamber controls (NTP, 2012).
However, in both the current study and the diethylamine study, higher relative kidney weights were not associated
with histopathologic lesions or chemical-related effects on clinical pathology indices. Although mild kidney toxicity
due to systemic exposure cannot be ruled out, the lack of histopathologic evidence and lower absolute kidney weights
suggest that these effects were related to the significantly lower body weights. Importantly, exposure of rats and mice
to diethylamine for 2 years did not result in kidney toxicity (NTP, 2012).
Retinal degeneration was observed in a few exposed rats in the 3-month study of triethylamine. Unlike the cornea,
the retina is not directly exposed to triethylamine vapor, suggesting potential exposure via the blood. However, it is
more likely that retinal effects were caused by triethylamine absorbed from the ocular surface. Alkaline chemicals
such as triethylamine are known to readily penetrate into the eye. The absorbed alkali can damage the cornea as well
as other anterior segment structures (Wagoner, 1997) and cause a rapid rise in intraocular pressure and in the anterior
chamber pH (Paterson and Pfister, 1974; Paterson et al., 1975), all of which could contribute to the retinal
degeneration. It is also possible that the low incidences of retinal degeneration were not exposure related. Although
retinal changes were not present in chamber control rats, the incidences in exposed groups were not concentration

52 Triethylamine, NTP TOX 78
NOT FOR ATTRIBUTION Peer Review Draft
related or statistically significant. Chronic exposure of rats and mice to the related compound, diethylamine, did not
result in exposure-related retinal changes.
Also suggestive of a potential systemic effect was the decreased sperm motility in rats exposed to 50, 100, or 200 ppm
triethylamine for 3 months. Although these changes were small in magnitude (3% to 6% lower than chamber control
values), they were exposure concentration related and statistically significant. These rats also displayed lower total
number of sperm/cauda (4% to 9%) and concomitant significant increases in the number of spermatid/mg testis at the
100 and 200 ppm exposure concentrations. Taken together, these data are suggestive of a potential effect on sperm
transit from the testis to the epididymis; however, this apparent effect was small in magnitude. Male mice exposed to
200 ppm triethylamine for 3 months exhibited lower epididymis and testis weights (10% and 5%, respectively)
compared to the chamber controls. A concentration-related decrease in sperm motility was also reported for male rats
and mice exposed for 3 months to the related chemical, diethylamine (NTP, 2012). There was no histopathologic
evidence of testicular toxicity in rats or mice exposed to either triethylamine or diethylamine for 3 months, or in rats
or mice exposed to diethylamine for 2 years. However, the effects noted above on the sperm parameters and the
reproductive organ weights suggest that triethylamine exhibits the potential to be a reproductive toxicant in male
F344/N rats and B6C3F1/N mice.
Chronic studies of triethylamine were not conducted because subchronic toxicity was similar to that of diethylamine,
a closely related aliphatic amine that was previously selected for evaluation of carcinogenicity.
Under the conditions of the 3-month inhalation studies, there were treatment-related lesions in male and female rats
and mice. The major targets of triethylamine exposure in rats and mice included the nose and eyes. In rats, the most
sensitive measure of triethylamine exposure was respiratory epithelium hyperplasia of the nasal cavity with a lowest-
observed-effect level (LOEL) of 12.5 ppm in males and females. In mice, the most sensitive measure of triethylamine
exposure was turbinate hyperostosis of the nasal cavity with a LOEL of 12.5 ppm in males and females.

53
Peer Review Draft NOT FOR ATTRIBUTION
REFERENCES
Åkesson, B., Florén, I., and Skerfving, S. (1985). Visual disturbances after experimental human exposure to
triethylamine. Br. J. Ind. Med. 42, 848-850.
Åkesson, B., Bengtsson, M., and Florén, I. (1986). Visual disturbances after industrial triethylamine exposure. Int.
Arch. Occup. Environ. Health 57, 297-302.
Åkesson, B., Skerfving, S., and Mattiasson, L. (1988). Experimental study on the metabolism of triethylamine in man.
Br. J. Ind. Med. 45, 262-268.
Åkesson, B., Vinge, E., and Skerfving, S. (1989a). Pharmacokinetics of triethylamine and triethylamine-N-oxide in
man. Toxicol. Appl. Pharmacol. 100, 529-538.
Åkesson, B., Skerfving, S., Ståhlbom, B., and Lundh, T. (1989b). Metabolism of triethylamine in polyurethane foam
manufacturing workers. Am. J. Ind. Med. 16, 255-265.
Albrecht, W.N., and Stephenson, R.L. (1988). Health hazards of tertiary amine catalysts. Scand. J. Work Environ.
Health 14, 209-219.
The Aldrich Library of FT-IR Spectra (1997). 2nd ed., Vol. 1, p. 469 (B). Aldrich Chemical Company, Inc.,
Milwaukee, WI.
The Aldrich Library of Infrared Spectra (1981). 3rd ed. (C.J. Pouchert, Ed.), Vol. 1, spectrum 175G. Aldrich
Chemical Company, Inc., Milwaukee, WI.
American Conference of Governmental Industrial Hygienists (ACGIH) (1986). Documentation of the Threshold Limit
Values and Biological Exposure Indices, 5th ed. Cincinnati, OH.
American Conference of Governmental Industrial Hygienists (ACGIH) (2012). 2012 TLVs® and BEIs®. Threshold
Limit Values for Chemical Substances and Physical Agents and Biological Exposure Indices. Cincinnati, OH.

54 Triethylamine, NTP TOX 78
NOT FOR ATTRIBUTION Peer Review Draft
Ashland Chemical Company (1986). Monitoring surveys: N,N-diethylethanamine, isopropanol, butanol, methanol,
acetone, hexane and toluene. U.S. Environmental Protection Agency/OTS Public Files, Document No. 86-870001686,
Fiche No., 0515762.
Beard, R.R., and Noe, J.T. (1981). Aromatic nitro and amino compounds. In Patty’s Industrial Hygiene and
Toxicology, 3rd ed. (G.D. Clayton and R.E. Clayton, Eds.), Vol. 2A, pp. 213-2489. John Wiley and Sons, New York,
NY.
Boorman, G.A., Montgomery, C.A., Jr., Eustis, S.L., Wolfe, M.J., McConnell, E.E., and Hardisty, J.F. (1985). Quality
assurance in pathology for rodent carcinogenicity studies. In Handbook of Carcinogen Testing (H.A. Milman and
E.K. Weisburger, Eds.), pp. 345-357. Noyes Publications, Park Ridge, NJ.
Brecher, G., and Schneiderman, M. (1950). Time saving device for the counting of reticulocytes. Am. J. Clin. Pathol.
20, 2079-2084.
Brieger, H., and Hodes, W.A. (1951). Toxic effects of exposure to vapors of aliphatic amines. AMA Arch. Ind. Hyg.
Occup. Med. 3, 287-291.
Broderson, J.R., Lindsey, J.R., and Crawford, J.E. (1976). The role of environmental ammonia in respiratory
mycoplasmosis of rats. Am. J. Pathol. 85, 115-130.
Buckley, L.A., Morgan, K.T., Swenberg, J.A., James, R.A., Hamm, T.E., Jr., and Barrow, C.S. (1985). The toxicity
of dimethylamine in F-344 rats and B6C3F1 mice following a 1-year inhalation exposure. Fundam. Appl. Toxicol. 5,
341-352.
Carpenter, C.P., Smyth, H.F., Jr., and Shaffer, C.B. (1948). The acute toxicity of ethylene imine to small animals.
J. Ind. Hyg. Toxicol. 30, 2-6.
Code of Federal Regulations (CFR) 21, Part 58.
Code of Federal Regulations (CFR) 29, §1910.1000.
Conrard, R. (1977). Cold-box coremaking: Ashland process. Cah. Notes Doc. Secur. Hyg. Trav. 87, 195-203.
Dernehl, C.U. (1966). Health hazards associated with polyurethane foams. J. Occup. Med. 8, 59-62.
Triethylamine, NTP TOX 78 55
Peer Review Draft NOT FOR ATTRIBUTION
Dixon, W.J., and Massey, F.J., Jr. (1957). Introduction to Statistical Analysis, 2nd ed., pp. 276-278. McGraw-Hill
Book Company, Inc., New York.
Dunn, O.J. (1964). Multiple comparisons using rank sums. Technometrics 6, 241-252.
Dunnett, C.W. (1955). A multiple comparison procedure for comparing several treatments with a control. J. Am.
Stat. Assoc. 50, 1096-1121.
Feron, V.J., Kruysse, A., Til, H.P., and Immel, H.R. (1978). Repeated exposure to acrolein vapour: Subacute studies
in hamsters, rats and rabbits. Toxicology 9, 47-57.
Gart, J.J., Chu, K.C., and Tarone, R.E. (1979). Statistical issues in interpretation of chronic bioassay tests for
carcinogenicity. JNCI 62, 957-974.
Girard, D.M., and Sager, D.B. (1987). The use of Markov chains to detect subtle variation in reproductive cycling.
Biometrics 43, 225-234.
Gorgacz, E.J. (1987). Occupational cardiac toxicity – acute diethylamine exposures. Prepared by Experimental
Pathology Laboratories, Inc., for the National Institute for Occupational Safety and Health, Cincinnati, OH. NIOSH
Study No. CAN 339.
Gross, E.A., Patterson, D.L., and Morgan, K.T. (1987). Effects of acute and chronic dimethylamine exposure on the
nasal mucociliary apparatus of F-344 rats. Toxicol. Appl. Pharmacol. 90, 359-376.
Hansen, E.S. (1991). Cancer mortality among Danish molders. Am. J. Ind. Med. 20, 401-409.
Hansen, M.K., Larsen, M., and Cohr, K.H. (1987). Waterborne paints. A review of their chemistry and toxicology
and the results of determinations made during their use. Scand. J. Work Environ. Health 13, 473-485.
Hoechst Celanese Corporation (1989). Dermal corrosivity study in rabbits with C-01043 triethylamine (IMO) with
attachments and cover letter dated 021390. U.S. Environmental Protection Agency/OTS Public Files, Doc.
No. 86-000000098, Fiche No. 0522354.
Järvinen, P., Engström, K., Riihimäki, V., Ruusuvaara, P., and Setälä, K. (1999). Effects of experimental exposure to
triethylamine on vision and the eye. Occup. Environ. Med. 56, 1-5.
56 Triethylamine, NTP TOX 78
NOT FOR ATTRIBUTION Peer Review Draft
Jiang, X.Z., Buckley, L.A., and Morgan, K.T. (1983). Pathology of toxic responses to the RD50 concentration of
chlorine gas in the nasal passages of rats and mice. Toxicol. Appl. Pharmacol. 71, 225-236.
Jonckheere, A.R. (1954). A distribution-free k-sample test against ordered alternatives. Biometrika 41, 133-145.
Kay, R.W. (1974). Survey into the fumes evolved from foundry sand binders based on synthetic resins.
Br. Foundryman 67, 1-4.
Kruysse, A., Feron, V.J., and Til, H.P. (1975). Repeated exposure to acetaldehyde vapor. Studies in Syrian golden
hamsters. Arch. Environ. Health 30, 449-452.
Lewis, R.J., Sr. (1992). Sax’s Dangerous Properties of Industrial Materials, 8th ed. Van Nostrand Reinhold, New
York.
Lindegård, B., Mathiasson, L., Jönsson, J.A., and Åkesson, B. (1990). Controlled thermal degradation for the
identification and quantification of amine N-oxides in urine. J. Chromatogr. 514, 293-304.
Long, P.H., Leininger, J.R., Nold, J.B., and Lieuallen, W.G. (1993). Proliferative lesions of bone, cartilage, tooth,
and synovium in rats. In Guides for Toxicologic Pathology. STP/ARP/AFIP, Washington, DC.
Lynch, D.W., Moorman, W.J., Lewis, T.R., Stober, P., Hamlin, R.D., and Schueler, R.L. (1990). Subchronic
inhalation of triethylamine vapor in Fischer-344 rats: Organ system toxicity. Toxicol. Ind. Health 6, 403-414.
MacBain, G., and Strange, R.C. (1983). Foundries. In Encyclopedia of Occupational Health and Safety, 3rd ed.,
pp. 916-923. International Labour Office, Geneva, Switzerland.
MacGregor, J.T., Wehr, C.M., Henika, P.R., and Shelby, M.D. (1990). The in vivo erythrocyte micronucleus test:
Measurement at steady state increases assay efficiency and permits integration with toxicity studies. Fundam. Appl.
Toxicol. 14, 513-522.
Maronpot, R.R., and Boorman, G.A. (1982). Interpretation of rodent hepatocellular proliferative alterations and
hepatocellular tumors in chemical safety assessment. Toxicol. Pathol. 10, 71-80.
Mellerio, J., and Weale, R.A. (1966). Hazy vision in amine plant operatives. Brit. J. Industr. Med. 23, 153-154.
National Institute for Occupational Safety and Health (NIOSH) (1990). National Occupational Exposure Survey
(1981-1983), unpublished provisional data as of July 1, 1990. NIOSH, Cincinnati, OH.
Triethylamine, NTP TOX 78 57
Peer Review Draft NOT FOR ATTRIBUTION
National Institute for Occupational Safety and Health (NIOSH) (2014). Triethylamine. International Chemical Safety
Card No. 0203. National Institute for Occupational Safety and Health, Centers for Disease Control and Prevention,
Atlanta, GA. <https://www.cdc.gov/niosh/ipcsneng/neng0203.html> (Accessed March 1, 2018)
National Toxicology Program (NTP) (1988). Toxicology and Carcinogenesis Studies of 1,2-Epoxybutane (CAS
No. 106-88-7) in F344/N Rats and B6C3F1 Mice (Inhalation Studies). Technical Report Series No. 329. NIH
Publication No. 88-2585. U.S. Department of Health and Human Services, Public Health Service, National Institutes
of Health, Research Triangle Park, NC.
National Toxicology Program (NTP) (1992). Toxicology and Carcinogenesis Studies of C.I. Pigment Red 3 (CAS
No. 2425-85-6) in F344/N Rats and B6C3F1 Mice (Feed Studies). Technical Report Series No. 407. NIH Publication
No. 92-3138. U.S. Department of Health and Human Services, Public Health Service, National Institutes of Health,
Research Triangle Park, NC.
National Toxicology Program (NTP) (2012). Toxicology and Carcinogenesis Studies of Diethylamine (CAS
No. 109-89-7) in F344/N Rats and B6C3F1 Mice (Inhalation Studies). Technical Report Series No. 566. NIH
Publication No. 12-5908. National Institutes of Health, Public Health Service, U.S. Department of Health and Human
Services, Research Triangle Park, NC.
Nelson, M.A., and Bull, R.J. (1990). Triethylamine. In Ethel Browning’s Toxicity and Metabolism of Industrial
Solvents, 2nd ed. Vol. 2, Nitrogen and Phosphorus Solvents (D.R. Buhler and D.J. Reed, Eds.). Elsevier Science,
Netherlands.
Paterson, C.A., and Pfister, R.R. (1974). Intraocular pressure changes after alkali burns. Arch. Ophthalmol. 91,
211-218.
Paterson, C.A., Pfister, R.R., and Levinson, R.A. (1975). Aqueous humor pH changes after experimental alkali burns.
Am. J. Ophthalmol. 79, 414-419.
Pennwalt Corporation (1986). Eye irritancy in rabbits using triethylamine (final report). U.S. Environmental
Protection Agency/OTS Public Files, Doc. No. 86-870000535, Fiche No. 0513613.
Potts, A.M., Rouse, E.F., Eiferman, R.A., and Au, P.C. (1986). An unusual type of keratopathy observed in
polyurethane workers and its reproduction in experimental animals. Am. J. Ind. Med. 9, 203-213.
Proctor, N.H., and Hughes, J.P. (1978). Chemical Hazards of the Workplace, p. 497. J.B. Lippincott, Co.,
Philadelphia, PA.
58 Triethylamine, NTP TOX 78
NOT FOR ATTRIBUTION Peer Review Draft
Reilly, M.J., Rosenman, K.D., Abrams, J.H., Zhu, Z., Tseng, C., Hertzberg, V., and Rice, C. (1995). Ocular effects
of exposure to triethylamine in the sand core cold box of a foundry. Occup. Environ. Med. 52, 337-343.
Sax, N.I. (1994). Chemical review of triethylamine. In Sax’s Dangerous Properties of Industrial Materials. 10th ed.,
14, 2-27. Van Nostrand Reinhold.
Schueler, R.L. (1984). Report of pathologic findings in Fischer 344 rats exposed by inhalation to allylamine,
ethylamine, diethylamine, and triethylamine. Unpublished report prepared by Research Pathology Associates, Inc.,
for Dr. David Groth, NIOSH. NIOSH Contract No. 211-83-0020.
Schweinsberg, F., and Sander, J. (1972). Cancerogenic nitrosamines consisting of simple aliphatic tertiary amines
and nitrite. Hoppe Seylers Z. Physiol. Chem. 353, 1671-1676.
Schweizer, A.E., Fowlkes, R.L., McMakin, J.H., and Whyte, T.E., Jr. (1978). Aliphatic amines. In Kirk-Othmer
Encyclopedia of Chemical Technology, 2nd ed., pp. 272-283. John Wiley & Sons, New York.
Shirley, E. (1977). A non-parametric equivalent of Williams’ test for contrasting increasing dose levels of a treatment.
Biometrics 33, 386-389.
Snyder, R. (1990). Ethyl Browning’s Toxicity and Metabolism of Industrial Solvents. 2nd ed., Vol. II: Nitrogen and
Phosphorus Solvents. Elsevier, Amsterdam-New York-Oxford.
SRI International (SRI) (1997). Alkylamines. United States, Consumption, Ethylamines, Triethylamine. Chemical
Economics Handbook, online version, DIALOG File 359. SRI International, Menlo Park, CA.
Ståhlbom, B., Lundh, T., Florén, I., and Åkesson, B. (1991). Visual disturbances in man as a result of experimental
and occupational exposure to dimethylethylamine. Brit. J. Industr. Med. 48, 26-29.
Steinhagen, W.H., Swenberg, J.A., and Barrow, C.S. (1982). Acute inhalation toxicity and sensory irritation of
dimethylamine. Am. Ind. Hyg. Assoc. J. 43, 411-417.
Tkachev, P.G. (1971). Hygienic assessment of the effect of inhalation of small concentrations of aliphatic ethylamines
[in Russian]. Gig. Sanit. 36, 8-11.
Union Carbide Corporation (1949). Range finding tests on triethylamine. U.S. Environmental Protection
Agency/OTS Public Files, Document No. 86-870001409, Fiche No. 0515571.
Triethylamine, NTP TOX 78 59
Peer Review Draft NOT FOR ATTRIBUTION
Union Carbide Corporation (1979). Range finding toxicity studies of triethylamine. U.S. Environmental Protection
Agency/OTS Public Files, Document No. 86-870001448, Fiche No. 0515610.
Union Carbide Corporation (1984). Amine-induced blue-gray vision: Brief review. D. Liebeskind, Danbury, CT,
September 1984, pp. 1-2.
Union Carbide Corporation (1986). Initial submission: Primary dermal irritation study of ethylamine, triethylamine,
and diethylamine in albino rabbits with cover letter dated 072892. U.S. Environmental Protection Agency/OTS Public
Files, Document No. 88-920004593, Fiche No. 0537574.
United States Environmental Protection Agency (USEPA) (2007). High Production Volume (HPV) Challenge
Program. <http://www.epa.gov/hpv>
Virginia Chemicals (1987). Acute dermal toxicity of triethylamine in rabbits. U.S. Environmental Protection
Agency/OTS Public Files, Document No. 86-870000815, Fiche No. OTS0515253.
Wagoner, M.D. (1997). Chemical injuries of the eye: Current concepts in pathophysiology and therapy. Surv.
Ophthalmol. 41, 275-313.
Warren, D.W., Jr., and Selchan, D.F. (1988). An industrial hygiene appraisal of triethylamine and dimethylethylamine
exposure limits in the foundry industry. Am. Ind. Hyg. Assoc. J. 49, 630-634.
Williams, D.A. (1971). A test for differences between treatment means when several dose levels are compared with
a zero dose control. Biometrics 27, 103-117.
Williams, D.A. (1972). The comparison of several dose levels with a zero dose control. Biometrics 28, 519-531.
Williams, D.A. (1986). A note on Shirley’s nonparametric test for comparing several dose levels with a zero-dose
control. Biometrics 42, 183-186.
Zeiger, E., Anderson, B., Haworth, S., Lawlor, T., Mortelmans, K., and Speck, W. (1987). Salmonella mutagenicity
tests: III. Results from the testing of 255 chemicals. Environ. Mutagen. 9 (Suppl. 9), 1-110.

60 Triethylamine, NTP TOX 78
NOT FOR ATTRIBUTION Peer Review Draft
A-1
Peer Review Draft NOT FOR ATTRIBUTION
APPENDIX A SUMMARY OF NONNEOPLASTIC LESIONS
IN RATS AND MICE
TABLE A1 Summary of the Incidence of Nonneoplastic Lesions in Male Rats in the 3-Month Inhalation Study of Triethylamine ......................................................................... A-2 TABLE A2 Summary of the Incidence of Nonneoplastic Lesions in Female Rats in the 3-Month Inhalation Study of Triethylamine ......................................................................... A-4 TABLE A3 Summary of the Incidence of Nonneoplastic Lesions in Male Mice in the 3-Month Inhalation Study of Triethylamine ......................................................................... A-6 TABLE A4 Summary of the Incidence of Nonneoplastic Lesions in Female Mice in the 3-Month Inhalation Study of Triethylamine ......................................................................... A-8

A-2 Triethylamine, NTP TOX 78
NOT FOR ATTRIBUTION Peer Review Draft
TABLE A1 Summary of the Incidence of Nonneoplastic Lesions in Male Rats in the 3-Month Inhalation Study of Triethylaminea
Chamber Control
12.5 ppm
25 ppm
50 ppm
100 ppm
200 ppm
Disposition Summary Animals initially in study 10 10 10 10 10 10 Survivors
Terminal kill 10 10 10 10 10 10 Animals examined microscopically 10 10 10 10 10 10 Alimentary System Liver (10) (10) (10) (10) (10) (10)
Clear cell focus 1 (10%) Hepatodiaphragmatic nodule 3 (30%) 4 (40%) 1 (10%) Inflammation 2 (20%) Bile duct, hyperplasia, focal 1 (10%)
Cardiovascular System None Endocrine System None General Body System None Genital System Prostate (10) (10)
Inflammation, suppurative 1 (10%) Hematopoietic System Lymph node, mediastinal (7) (2)
Ectasia 1 (14%)
Integumentary System None Musculoskeletal System None Nervous System None
a Number of animals examined microscopically at the site and the number of animals with lesion
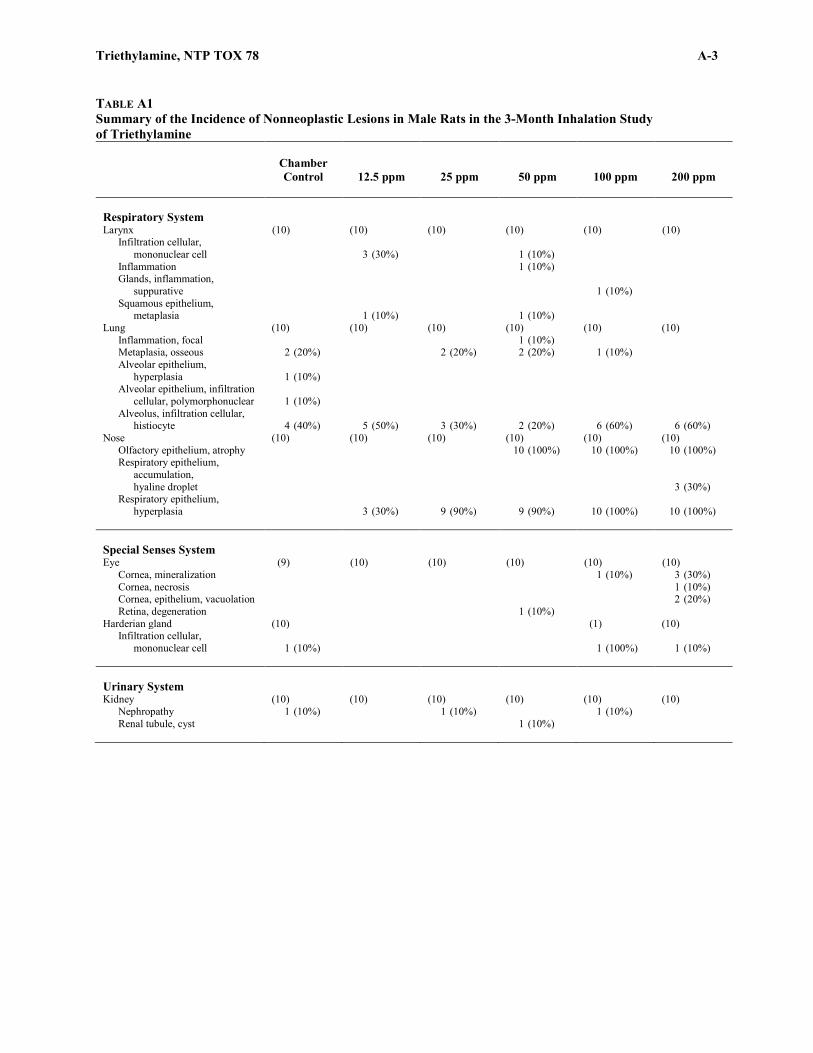
Triethylamine, NTP TOX 78 A-3
Peer Review Draft NOT FOR ATTRIBUTION
TABLE A1 Summary of the Incidence of Nonneoplastic Lesions in Male Rats in the 3-Month Inhalation Study of Triethylamine
Chamber Control
12.5 ppm
25 ppm
50 ppm
100 ppm
200 ppm
Respiratory System Larynx (10) (10) (10) (10) (10) (10)
Infiltration cellular, mononuclear cell 3 (30%) 1 (10%)
Inflammation 1 (10%) Glands, inflammation,
suppurative 1 (10%) Squamous epithelium,
metaplasia 1 (10%) 1 (10%) Lung (10) (10) (10) (10) (10) (10)
Inflammation, focal 1 (10%) Metaplasia, osseous 2 (20%) 2 (20%) 2 (20%) 1 (10%) Alveolar epithelium,
hyperplasia 1 (10%) Alveolar epithelium, infiltration
cellular, polymorphonuclear 1 (10%) Alveolus, infiltration cellular,
histiocyte 4 (40%) 5 (50%) 3 (30%) 2 (20%) 6 (60%) 6 (60%) Nose (10) (10) (10) (10) (10) (10)
Olfactory epithelium, atrophy 10 (100%) 10 (100%) 10 (100%) Respiratory epithelium,
accumulation, hyaline droplet 3 (30%)
Respiratory epithelium, hyperplasia 3 (30%) 9 (90%) 9 (90%) 10 (100%) 10 (100%)
Special Senses System Eye (9) (10) (10) (10) (10) (10)
Cornea, mineralization 1 (10%) 3 (30%) Cornea, necrosis 1 (10%) Cornea, epithelium, vacuolation 2 (20%) Retina, degeneration 1 (10%)
Harderian gland (10) (1) (10) Infiltration cellular,
mononuclear cell 1 (10%) 1 (100%) 1 (10%) Urinary System Kidney (10) (10) (10) (10) (10) (10)
Nephropathy 1 (10%) 1 (10%) 1 (10%) Renal tubule, cyst 1 (10%)

A-4 Triethylamine, NTP TOX 78
NOT FOR ATTRIBUTION Peer Review Draft
TABLE A2 Summary of the Incidence of Nonneoplastic Lesions in Female Rats in the 3-Month Inhalation Study of Triethylaminea
Chamber Control
12.5 ppm
25 ppm
50 ppm
100 ppm
200 ppm
Disposition Summary Animals initially in study 10 10 10 10 10 10 Survivors
Terminal euthanasia 10 10 10 10 10 10 Animals examined microscopically 10 10 10 10 10 10 Alimentary System Intestine small, jejunum (10) (10) (10) (10) (10) (10)
Serosa, inflammation, chronic 1 (10%) Liver (10) (10) (10) (10) (10) (10)
Hepatodiaphragmatic nodule 1 (10%) 1 (10%) 1 (10%) 2 (20%) Inflammation 1 (10%) 2 (20%) 2 (20%) 1 (10%) 1 (10%) Inflammation, chronic 1 (10%) Serosa, fibrosis 1 (10%)
Mesentery (2) (1) Fat, necrosis, chronic 2 (100%) 1 (100%)
Pancreas (10) (10) Atrophy 1 (10%)
Stomach, glandular (10) (10) (10) (10) (10) (10) Cyst 1 (10%)
Cardiovascular System Heart (10) (1) (10)
Pericardium, fibrosis 1 (100%) Pericardium, infiltration
cellular, mononuclear cell 1 (100%) Endocrine System None General Body System None Genital System Ovary (10) (1) (1) (1) (10)
Metaplasia, lipocyte 1 (10%) Periovarian tissue, cyst 1 (100%) 1 (100%) 1 (100%) 1 (10%)
Hematopoietic System Lymph node (1) (1) (1)
Pancreatic, hyperplasia, histiocytic 1 (100%) 1 (100%) 1 (100%)
Integumentary System None
a Number of animals examined microscopically at the site and the number of animals with lesion

Triethylamine, NTP TOX 78 A-5
Peer Review Draft NOT FOR ATTRIBUTION
TABLE A2 Summary of the Incidence of Nonneoplastic Lesions in Female Rats in the 3-Month Inhalation Study of Triethylamine
Chamber Control
12.5 ppm
25 ppm
50 ppm
100 ppm
200 ppm
Musculoskeletal System None Nervous System None Respiratory System Larynx (9) (10) (10) (10) (10) (10)
Granuloma 1 (10%) Infiltration, cellular,
mononuclear cell 1 (10%) 1 (10%) Inflammation 1 (10%)
Lung (10) (10) (10) (10) (10) (10) Inflammation, focal 1 (10%) Metaplasia, osseous 1 (10%) Mineralization 1 (10%) Alveolar epithelium,
hyperplasia 1 (10%) Alveolus, infiltration cellular,
histiocyte 2 (20%) 1 (10%) 4 (40%) 4 (40%) 7 (70%) 7 (70%) Nose (10) (10) (10) (10) (10) (10)
Foreign body 1 (10%) Inflammation, chronic 1 (10%) 2 (20%) Olfactory epithelium, atrophy 4 (40%) 10 (100%) 10 (100%) 10 (100%) Respiratory epithelium,
accumulation, hyaline droplet 1 (10%)
Respiratory epithelium, hyperplasia 3 (30%) 9 (90%) 10 (100%) 10 (100%) 10 (100%)
Pleura (1) Hyperplasia 1 (100%) Inflammation, chronic 1 (100%)
Special Senses System Eye (10) (10) (10) (10) (10) (10)
Anterior chamber, infiltration cellular, macrophage 1 (10%)
Cornea, edema 1 (10%) Cornea, inflammation, chronic 1 (10%) Cornea, mineralization 2 (20%) Cornea, necrosis 1 (10%) Cornea, vesicle, subepithelial 3 (30%) Cornea, epithelium, ulcer 1 (10%) Lens, cataract 1 (10%) Retina, degeneration 1 (10%) 2 (20%) 1 (10%) Retina, dysplasia 1 (10%)
Harderian gland (10) (10) Infiltration cellular,
mononuclear cell 1 (10%) 3 (30%) Urinary System None
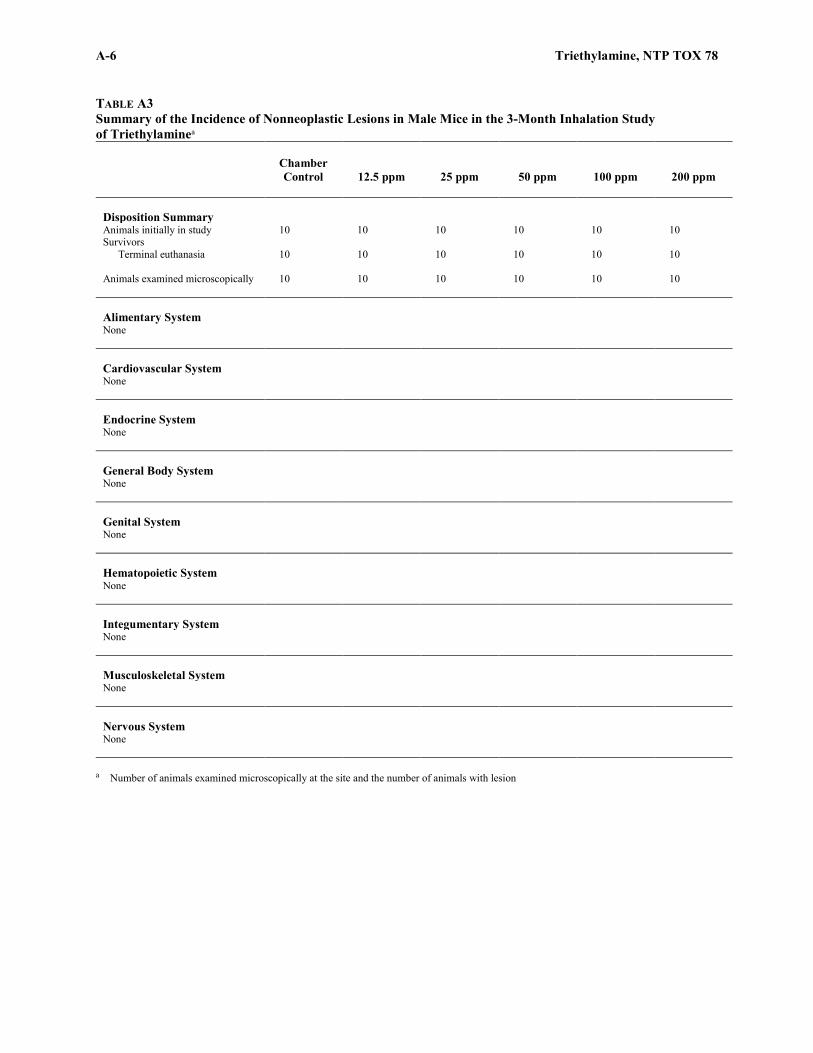
A-6 Triethylamine, NTP TOX 78
NOT FOR ATTRIBUTION Peer Review Draft
TABLE A3 Summary of the Incidence of Nonneoplastic Lesions in Male Mice in the 3-Month Inhalation Study of Triethylaminea
Chamber Control
12.5 ppm
25 ppm
50 ppm
100 ppm
200 ppm
Disposition Summary Animals initially in study 10 10 10 10 10 10 Survivors
Terminal euthanasia 10 10 10 10 10 10 Animals examined microscopically 10 10 10 10 10 10 Alimentary System None Cardiovascular System None Endocrine System None General Body System None Genital System None Hematopoietic System None
Integumentary System None Musculoskeletal System None Nervous System None
a Number of animals examined microscopically at the site and the number of animals with lesion

Triethylamine, NTP TOX 78 A-7
Peer Review Draft NOT FOR ATTRIBUTION
TABLE A3 Summary of the Incidence of Nonneoplastic Lesions in Male Mice in the 3-Month Inhalation Study of Triethylamine
Chamber Control
12.5 ppm
25 ppm
50 ppm
100 ppm
200 ppm
Respiratory System Lung (10) (10) (10) (10) (10) (10)
Infiltration cellular, histiocyte 1 (10%) Inflammation, chronic active 1 (10%)
Nose (10) (10) (10) (10) (10) (10) Inflammation, suppurative 1 (10%) Olfactory epithelium,
accumulation, hyaline droplet 1 (10%) 6 (60%)
Olfactory epithelium, atrophy 9 (90%) 10 (100%) 10 (100%) Olfactory epithelium,
vacuolization cytoplasmic 6 (60%) Respiratory epithelium,
accumulation, hyaline droplet 9 (90%)
Respiratory epithelium, metaplasia, squamous 10 (100%)
Turbinate, atrophy 5 (50%) Turbinate, hyperostosis 10 (100%) 9 (90%) 10 (100%) 10 (100%) 10 (100%) Turbinate, necrosis 10 (100%)
Special Senses System None Urinary System None

A-8 Triethylamine, NTP TOX 78
NOT FOR ATTRIBUTION Peer Review Draft
TABLE A4 Summary of the Incidence of Nonneoplastic Lesions in Female Mice in the 3-Month Inhalation Study of Triethylaminea
Chamber Control
12.5 ppm
25 ppm
50 ppm
100 ppm
200 ppm
Disposition Summary Animals initially in study 10 10 10 10 10 10 Survivors
Terminal kill 10 10 10 10 10 10 Animals examined microscopically 10 10 10 10 10 10 Alimentary System None Cardiovascular System None Endocrine System None General Body System None Genital System Uterus (10) (1) (10)
Decidual reaction 1 (100%) Hematopoietic System None
Integumentary System None Musculoskeletal System None Nervous System None
a Number of animals examined microscopically at the site and the number of animals with lesion

Triethylamine, NTP TOX 78 A-9
Peer Review Draft NOT FOR ATTRIBUTION
TABLE A4 Summary of the Incidence of Nonneoplastic Lesions in Female Mice in the 3-Month Inhalation Study of Triethylamine
Chamber Control
12.5 ppm
25 ppm
50 ppm
100 ppm
200 ppm
Respiratory System Nose (10) (10) (10) (10) (10) (10)
Inflammation, suppurative 1 (10%) Olfactory epithelium,
accumulation, hyaline droplet 7 (70%) 10 (100%) 8 (80%)
Olfactory epithelium, atrophy 10 (100%) 10 (100%) 10 (100%) Olfactory epithelium,
vacuolization cytoplasmic 5 (50%) Respiratory epithelium,
accumulation, hyaline droplet 7 (70%) 10 (100%) 8 (80%)
Respiratory epithelium, metaplasia, squamous 9 (90%)
Turbinate, atrophy 3 (30%) Turbinate, hyperostosis 8 (80%) 10 (100%) 10 (100%) 9 (90%) 10 (100%) Turbinate, necrosis 10 (100%)
Special Senses System None Urinary System None

A-10 Triethylamine, NTP TOX 78
NOT FOR ATTRIBUTION Peer Review Draft

B-1
Peer Review Draft NOT FOR ATTRIBUTION
APPENDIX B GENETIC TOXICOLOGY
TABLE B1 Mutagenicity of Triethylamine in Bacterial Tester Strains ............................................................ B-2 TABLE B2 Frequency of Micronuclei in Peripheral Blood Erythrocytes of Mice Following Treatment with Triethylamine by Inhalation for 3 Months ......................................... B-3
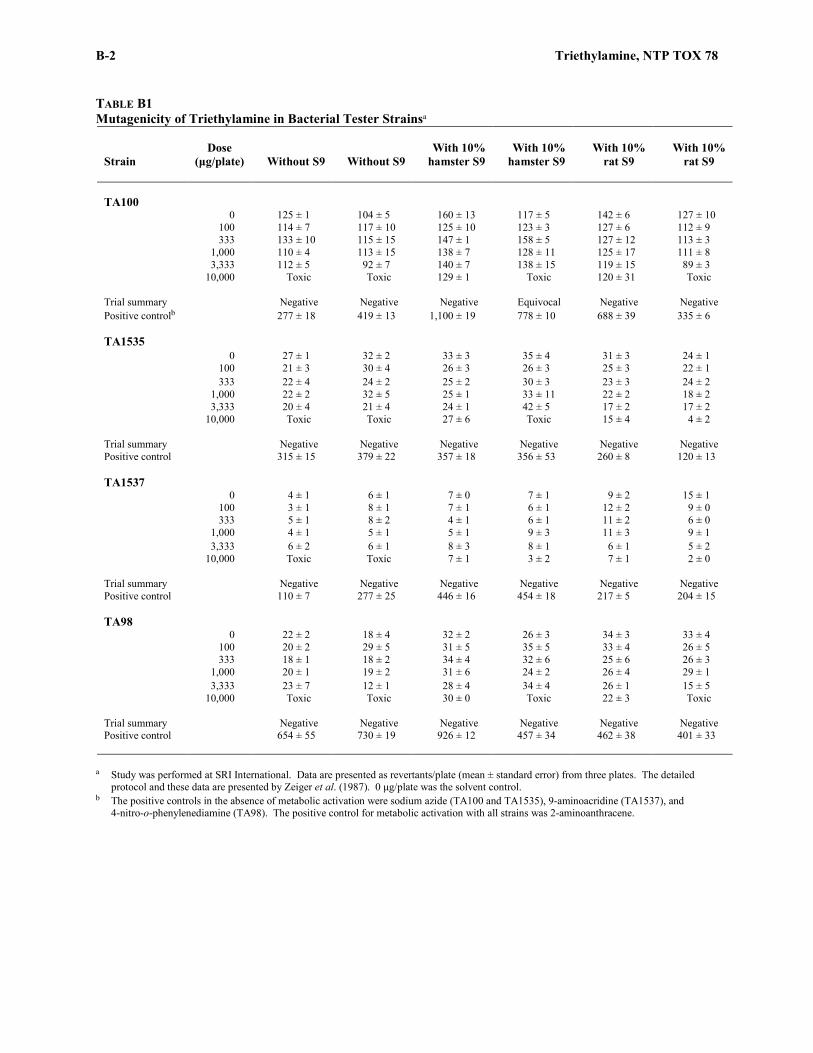
B-2 Triethylamine, NTP TOX 78
NOT FOR ATTRIBUTION Peer Review Draft
TABLE B1 Mutagenicity of Triethylamine in Bacterial Tester Strainsa
Strain
Dose
(μg/plate)
Without S9
Without S9
With 10% hamster S9
With 10% hamster S9
With 10% rat S9
With 10% rat S9
TA100 0 125 ± 1 104 ± 5 160 ± 13 117 ± 5 142 ± 6 127 ± 10 100 114 ± 7 117 ± 10 125 ± 10 123 ± 3 127 ± 6 112 ± 9 333 133 ± 10 115 ± 15 147 ± 1 158 ± 5 127 ± 12 113 ± 3 1,000 110 ± 4 113 ± 15 138 ± 7 128 ± 11 125 ± 17 111 ± 8 3,333 112 ± 5 92 ± 7 140 ± 7 138 ± 15 119 ± 15 89 ± 3 10,000 Toxic Toxic 129 ± 1 Toxic 120 ± 31 Toxic Trial summary Negative Negative Negative Equivocal Negative Negative Positive controlb 277 ± 18 419 ± 13 1,100 ± 19 778 ± 10 688 ± 39 335 ± 6 TA1535 0 27 ± 1 32 ± 2 33 ± 3 35 ± 4 31 ± 3 24 ± 1 100 21 ± 3 30 ± 4 26 ± 3 26 ± 3 25 ± 3 22 ± 1 333 22 ± 4 24 ± 2 25 ± 2 30 ± 3 23 ± 3 24 ± 2 1,000 22 ± 2 32 ± 5 25 ± 1 33 ± 11 22 ± 2 18 ± 2 3,333 20 ± 4 21 ± 4 24 ± 1 42 ± 5 17 ± 2 17 ± 2 10,000 Toxic Toxic 27 ± 6 Toxic 15 ± 4 4 ± 2 Trial summary Negative Negative Negative Negative Negative Negative Positive control 315 ± 15 379 ± 22 357 ± 18 356 ± 53 260 ± 8 120 ± 13 TA1537 0 4 ± 1 6 ± 1 7 ± 0 7 ± 1 9 ± 2 15 ± 1 100 3 ± 1 8 ± 1 7 ± 1 6 ± 1 12 ± 2 9 ± 0 333 5 ± 1 8 ± 2 4 ± 1 6 ± 1 11 ± 2 6 ± 0 1,000 4 ± 1 5 ± 1 5 ± 1 9 ± 3 11 ± 3 9 ± 1 3,333 6 ± 2 6 ± 1 8 ± 3 8 ± 1 6 ± 1 5 ± 2 10,000 Toxic Toxic 7 ± 1 3 ± 2 7 ± 1 2 ± 0 Trial summary Negative Negative Negative Negative Negative Negative Positive control 110 ± 7 277 ± 25 446 ± 16 454 ± 18 217 ± 5 204 ± 15 TA98 0 22 ± 2 18 ± 4 32 ± 2 26 ± 3 34 ± 3 33 ± 4 100 20 ± 2 29 ± 5 31 ± 5 35 ± 5 33 ± 4 26 ± 5 333 18 ± 1 18 ± 2 34 ± 4 32 ± 6 25 ± 6 26 ± 3 1,000 20 ± 1 19 ± 2 31 ± 6 24 ± 2 26 ± 4 29 ± 1 3,333 23 ± 7 12 ± 1 28 ± 4 34 ± 4 26 ± 1 15 ± 5 10,000 Toxic Toxic 30 ± 0 Toxic 22 ± 3 Toxic Trial summary Negative Negative Negative Negative Negative Negative Positive control 654 ± 55 730 ± 19 926 ± 12 457 ± 34 462 ± 38 401 ± 33
a Study was performed at SRI International. Data are presented as revertants/plate (mean ± standard error) from three plates. The detailed protocol and these data are presented by Zeiger et al. (1987). 0 μg/plate was the solvent control.
b The positive controls in the absence of metabolic activation were sodium azide (TA100 and TA1535), 9-aminoacridine (TA1537), and 4-nitro-o-phenylenediamine (TA98). The positive control for metabolic activation with all strains was 2-aminoanthracene.
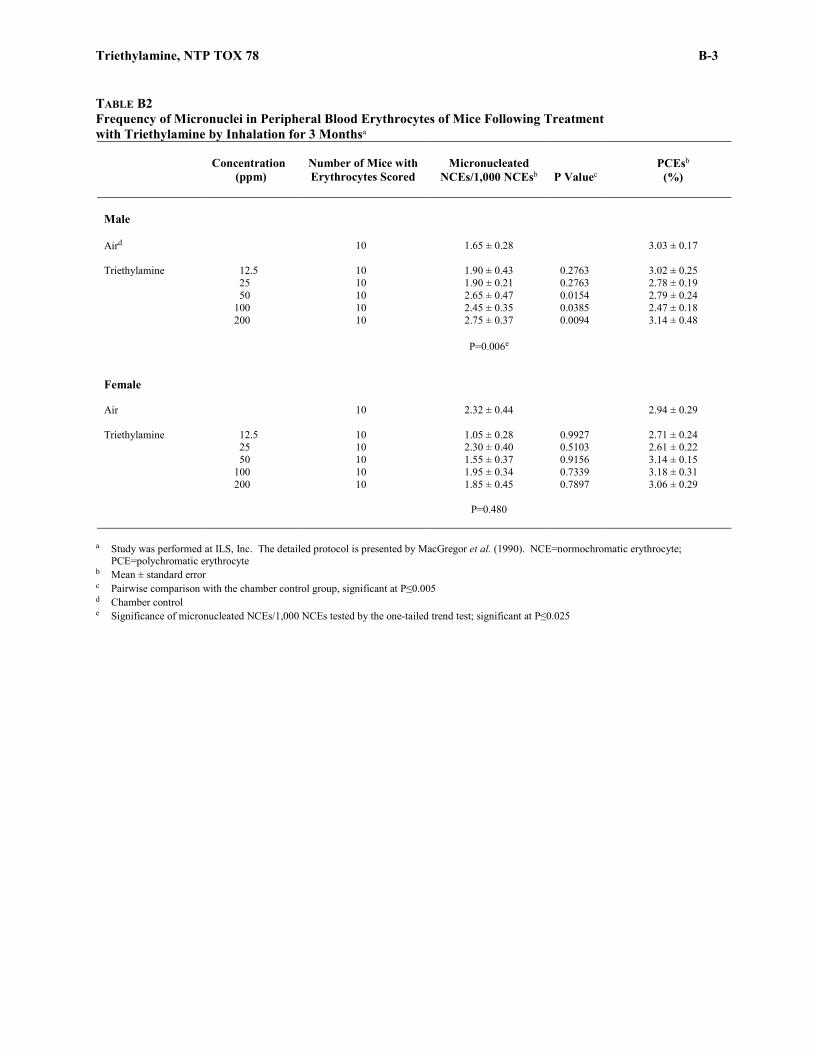
Triethylamine, NTP TOX 78 B-3
Peer Review Draft NOT FOR ATTRIBUTION
TABLE B2 Frequency of Micronuclei in Peripheral Blood Erythrocytes of Mice Following Treatment with Triethylamine by Inhalation for 3 Monthsa
Concentration (ppm)
Number of Mice with Erythrocytes Scored
Micronucleated NCEs/1,000 NCEsb
P Valuec
PCEsb (%)
Male Aird 10 1.65 ± 0.28 3.03 ± 0.17 Triethylamine 12.5 10 1.90 ± 0.43 0.2763 3.02 ± 0.25 25 10 1.90 ± 0.21 0.2763 2.78 ± 0.19 50 10 2.65 ± 0.47 0.0154 2.79 ± 0.24 100 10 2.45 ± 0.35 0.0385 2.47 ± 0.18 200 10 2.75 ± 0.37 0.0094 3.14 ± 0.48 P=0.006e Female Air 10 2.32 ± 0.44 2.94 ± 0.29 Triethylamine 12.5 10 1.05 ± 0.28 0.9927 2.71 ± 0.24 25 10 2.30 ± 0.40 0.5103 2.61 ± 0.22 50 10 1.55 ± 0.37 0.9156 3.14 ± 0.15 100 10 1.95 ± 0.34 0.7339 3.18 ± 0.31 200 10 1.85 ± 0.45 0.7897 3.06 ± 0.29 P=0.480
a Study was performed at ILS, Inc. The detailed protocol is presented by MacGregor et al. (1990). NCE=normochromatic erythrocyte; PCE=polychromatic erythrocyte
b Mean ± standard error c Pairwise comparison with the chamber control group, significant at P≤0.005 d Chamber control e Significance of micronucleated NCEs/1,000 NCEs tested by the one-tailed trend test; significant at P≤0.025

B-4 Triethylamine, NTP TOX 78
NOT FOR ATTRIBUTION Peer Review Draft

C-1
Peer Review Draft NOT FOR ATTRIBUTION
APPENDIX C CLINICAL PATHOLOGY RESULTS
TABLE C1 Clinical Pathology Data for Rats in the 3-Month Inhalation Study of Triethylamine ................................................................................................................................. C-2 TABLE C2 Hematology Data for Mice in the 3-Month Inhalation Study of Triethylamine ................................................................................................................................. C-8
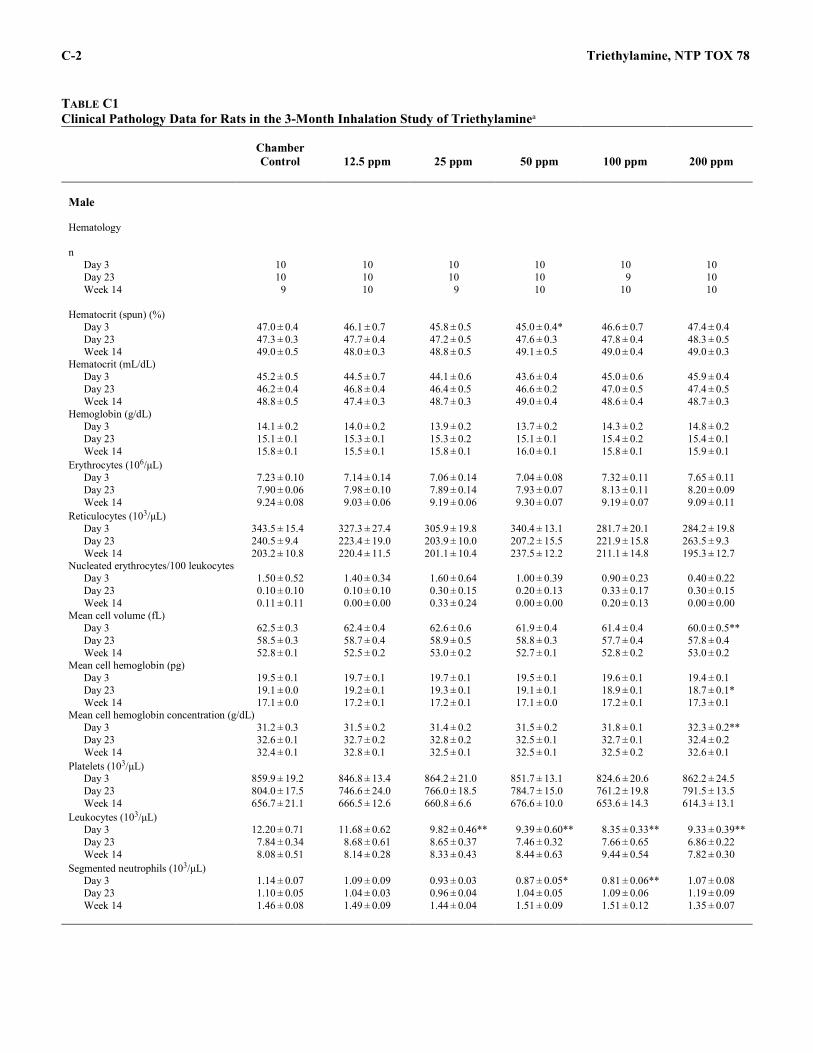
C-2 Triethylamine, NTP TOX 78
NOT FOR ATTRIBUTION Peer Review Draft
TABLE C1 Clinical Pathology Data for Rats in the 3-Month Inhalation Study of Triethylaminea
Chamber Control
12.5 ppm
25 ppm
50 ppm
100 ppm
200 ppm
Male Hematology n
Day 3 10 10 10 10 10 10 Day 23 10 10 10 10 9 10 Week 14 9 10 9 10 10 10
Hematocrit (spun) (%)
Day 3 47.0 ± 0.4 46.1 ± 0.7 45.8 ± 0.5 45.0 ± 0.4* 46.6 ± 0.7 47.4 ± 0.4 Day 23 47.3 ± 0.3 47.7 ± 0.4 47.2 ± 0.5 47.6 ± 0.3 47.8 ± 0.4 48.3 ± 0.5 Week 14 49.0 ± 0.5 48.0 ± 0.3 48.8 ± 0.5 49.1 ± 0.5 49.0 ± 0.4 49.0 ± 0.3
Hematocrit (mL/dL) Day 3 45.2 ± 0.5 44.5 ± 0.7 44.1 ± 0.6 43.6 ± 0.4 45.0 ± 0.6 45.9 ± 0.4 Day 23 46.2 ± 0.4 46.8 ± 0.4 46.4 ± 0.5 46.6 ± 0.2 47.0 ± 0.5 47.4 ± 0.5 Week 14 48.8 ± 0.5 47.4 ± 0.3 48.7 ± 0.3 49.0 ± 0.4 48.6 ± 0.4 48.7 ± 0.3
Hemoglobin (g/dL) Day 3 14.1 ± 0.2 14.0 ± 0.2 13.9 ± 0.2 13.7 ± 0.2 14.3 ± 0.2 14.8 ± 0.2 Day 23 15.1 ± 0.1 15.3 ± 0.1 15.3 ± 0.2 15.1 ± 0.1 15.4 ± 0.2 15.4 ± 0.1 Week 14 15.8 ± 0.1 15.5 ± 0.1 15.8 ± 0.1 16.0 ± 0.1 15.8 ± 0.1 15.9 ± 0.1
Erythrocytes (106/μL) Day 3 7.23 ± 0.10 7.14 ± 0.14 7.06 ± 0.14 7.04 ± 0.08 7.32 ± 0.11 7.65 ± 0.11 Day 23 7.90 ± 0.06 7.98 ± 0.10 7.89 ± 0.14 7.93 ± 0.07 8.13 ± 0.11 8.20 ± 0.09 Week 14 9.24 ± 0.08 9.03 ± 0.06 9.19 ± 0.06 9.30 ± 0.07 9.19 ± 0.07 9.09 ± 0.11
Reticulocytes (103/μL) Day 3 343.5 ± 15.4 327.3 ± 27.4 305.9 ± 19.8 340.4 ± 13.1 281.7 ± 20.1 284.2 ± 19.8 Day 23 240.5 ± 9.4 223.4 ± 19.0 203.9 ± 10.0 207.2 ± 15.5 221.9 ± 15.8 263.5 ± 9.3 Week 14 203.2 ± 10.8 220.4 ± 11.5 201.1 ± 10.4 237.5 ± 12.2 211.1 ± 14.8 195.3 ± 12.7
Nucleated erythrocytes/100 leukocytes Day 3 1.50 ± 0.52 1.40 ± 0.34 1.60 ± 0.64 1.00 ± 0.39 0.90 ± 0.23 0.40 ± 0.22 Day 23 0.10 ± 0.10 0.10 ± 0.10 0.30 ± 0.15 0.20 ± 0.13 0.33 ± 0.17 0.30 ± 0.15 Week 14 0.11 ± 0.11 0.00 ± 0.00 0.33 ± 0.24 0.00 ± 0.00 0.20 ± 0.13 0.00 ± 0.00
Mean cell volume (fL) Day 3 62.5 ± 0.3 62.4 ± 0.4 62.6 ± 0.6 61.9 ± 0.4 61.4 ± 0.4 60.0 ± 0.5** Day 23 58.5 ± 0.3 58.7 ± 0.4 58.9 ± 0.5 58.8 ± 0.3 57.7 ± 0.4 57.8 ± 0.4 Week 14 52.8 ± 0.1 52.5 ± 0.2 53.0 ± 0.2 52.7 ± 0.1 52.8 ± 0.2 53.0 ± 0.2
Mean cell hemoglobin (pg) Day 3 19.5 ± 0.1 19.7 ± 0.1 19.7 ± 0.1 19.5 ± 0.1 19.6 ± 0.1 19.4 ± 0.1 Day 23 19.1 ± 0.0 19.2 ± 0.1 19.3 ± 0.1 19.1 ± 0.1 18.9 ± 0.1 18.7 ± 0.1* Week 14 17.1 ± 0.0 17.2 ± 0.1 17.2 ± 0.1 17.1 ± 0.0 17.2 ± 0.1 17.3 ± 0.1
Mean cell hemoglobin concentration (g/dL) Day 3 31.2 ± 0.3 31.5 ± 0.2 31.4 ± 0.2 31.5 ± 0.2 31.8 ± 0.1 32.3 ± 0.2** Day 23 32.6 ± 0.1 32.7 ± 0.2 32.8 ± 0.2 32.5 ± 0.1 32.7 ± 0.1 32.4 ± 0.2 Week 14 32.4 ± 0.1 32.8 ± 0.1 32.5 ± 0.1 32.5 ± 0.1 32.5 ± 0.2 32.6 ± 0.1
Platelets (103/μL) Day 3 859.9 ± 19.2 846.8 ± 13.4 864.2 ± 21.0 851.7 ± 13.1 824.6 ± 20.6 862.2 ± 24.5 Day 23 804.0 ± 17.5 746.6 ± 24.0 766.0 ± 18.5 784.7 ± 15.0 761.2 ± 19.8 791.5 ± 13.5 Week 14 656.7 ± 21.1 666.5 ± 12.6 660.8 ± 6.6 676.6 ± 10.0 653.6 ± 14.3 614.3 ± 13.1
Leukocytes (103/μL) Day 3 12.20 ± 0.71 11.68 ± 0.62 9.82 ± 0.46** 9.39 ± 0.60** 8.35 ± 0.33** 9.33 ± 0.39** Day 23 7.84 ± 0.34 8.68 ± 0.61 8.65 ± 0.37 7.46 ± 0.32 7.66 ± 0.65 6.86 ± 0.22 Week 14 8.08 ± 0.51 8.14 ± 0.28 8.33 ± 0.43 8.44 ± 0.63 9.44 ± 0.54 7.82 ± 0.30
Segmented neutrophils (103/μL) Day 3 1.14 ± 0.07 1.09 ± 0.09 0.93 ± 0.03 0.87 ± 0.05* 0.81 ± 0.06** 1.07 ± 0.08 Day 23 1.10 ± 0.05 1.04 ± 0.03 0.96 ± 0.04 1.04 ± 0.05 1.09 ± 0.06 1.19 ± 0.09 Week 14 1.46 ± 0.08 1.49 ± 0.09 1.44 ± 0.04 1.51 ± 0.09 1.51 ± 0.12 1.35 ± 0.07

Triethylamine, NTP TOX 78 C-3
Peer Review Draft NOT FOR ATTRIBUTION
TABLE C1 Clinical Pathology Data for Rats in the 3-Month Inhalation Study of Triethylamine
Chamber Control
12.5 ppm
25 ppm
50 ppm
100 ppm
200 ppm
Male (continued) Hematology (continued) n
Day 3 10 10 10 10 10 10 Day 23 10 10 10 10 9 10 Week 14 9 10 9 10 10 10
Lymphocytes (103/μL)
Day 3 10.73 ± 0.65 10.36 ± 0.56 8.60 ± 0.45** 8.19 ± 0.56** 7.32 ± 0.32** 8.08 ± 0.35** Day 23 6.59 ± 0.31 7.44 ± 0.61 7.48 ± 0.37 6.27 ± 0.31 6.38 ± 0.67 5.43 ± 0.21* Week 14 6.47 ± 0.50 6.45 ± 0.26 6.75 ± 0.45 6.74 ± 0.59 7.78 ± 0.49 6.31 ± 0.29
Monocytes (103/μL) Day 3 0.20 ± 0.06 0.11 ± 0.02 0.21 ± 0.04 0.21 ± 0.05 0.11 ± 0.03 0.11 ± 0.03 Day 23 0.07 ± 0.02 0.11 ± 0.04 0.12 ± 0.03 0.07 ± 0.02 0.09 ± 0.03 0.18 ± 0.05 Week 14 0.07 ± 0.02 0.11 ± 0.02 0.04 ± 0.02 0.10 ± 0.02 0.09 ± 0.02 0.09 ± 0.02
Basophils (103/μL) Day 3 0.012 ± 0.002 0.006 ± 0.002 0.006 ± 0.002 0.006 ± 0.002 0.004 ± 0.002 0.015 ± 0.004 Day 23 0.006 ± 0.002 0.005 ± 0.002 0.010 ± 0.003 0.002 ± 0.001 0.008 ± 0.003 0.005 ± 0.002 Week 14 0.000 ± 0.000 0.003 ± 0.002 0.000 ± 0.000 0.001 ± 0.001 0.000 ± 0.000 0.001 ± 0.001
Eosinophils (103/μL) Day 3 0.12 ± 0.01 0.12 ± 0.01 0.08 ± 0.02 0.11 ± 0.02 0.10 ± 0.03* 0.06 ± 0.01** Day 23 0.08 ± 0.01 0.08 ± 0.01 0.08 ± 0.01 0.08 ± 0.01 0.09 ± 0.01 0.06 ± 0.00 Week 14 0.07 ± 0.02 0.10 ± 0.02 0.10 ± 0.02 0.10 ± 0.02 0.07 ± 0.02 0.07 ± 0.02
Immature neutrophils (103/μL) Day 3 0.000 ± 0.000 0.000 ± 0.000 0.000 ± 0.000 0.000 ± 0.000 0.000 ± 0.000 0.000 ± 0.000 Day 23 0.000 ± 0.000 0.000 ± 0.000 0.000 ± 0.000 0.000 ± 0.000 0.000 ± 0.000 0.000 ± 0.000 Week 14 0.000 ± 0.000 0.000 ± 0.000 0.000 ± 0.000 0.000 ± 0.000 0.000 ± 0.000 0.000 ± 0.000
Clinical Chemistry n
Day 3 10 10 10 10 10 10 Day 23 10 10 10 10 9 10 Week 14 10 10 10 10 10 10
Urea nitrogen (mg/dL)
Day 3 10.1 ± 0.3 7.7 ± 0.4** 8.5 ± 0.5 7.1 ± 0.3** 8.6 ± 0.3 11.3 ± 0.6 Day 23 10.5 ± 0.5 10.5 ± 0.4 10.1 ± 0.5 9.5 ± 0.3 9.9 ± 0.5 9.5 ± 0.5 Week 14 14.9 ± 0.5 14.2 ± 0.4 14.0 ± 0.4 14.8 ± 0.4 13.7 ± 0.3 13.9 ± 0.5
Creatinine (mg/dL) Day 3 0.50 ± 0.00b 0.49 ± 0.01 0.49 ± 0.02 0.48 ± 0.01 0.53 ± 0.02 0.48 ± 0.01 Day 23 0.57 ± 0.02 0.57 ± 0.02 0.60 ± 0.00 0.60 ± 0.02 0.60 ± 0.02 0.61 ± 0.01 Week 14 0.61 ± 0.02 0.58 ± 0.03 0.57 ± 0.03 0.58 ± 0.01 0.59 ± 0.01 0.58 ± 0.01
Total protein (g/dL) Day 3 6.1 ± 0.1b 6.0 ± 0.1 6.0 ± 0.1 5.9 ± 0.1 5.8 ± 0.1 6.1 ± 0.1 Day 23 6.3 ± 0.1 6.4 ± 0.1 6.2 ± 0.0 6.4 ± 0.1 6.3 ± 0.1 6.2 ± 0.0 Week 14 7.2 ± 0.0 7.1 ± 0.1 7.2 ± 0.1 7.2 ± 0.0 7.0 ± 0.1* 6.7 ± 0.1**
Albumin (g/dL) Day 3 4.5 ± 0.0 4.4 ± 0.1 4.4 ± 0.1 4.4 ± 0.0 4.4 ± 0.0 4.5 ± 0.0 Day 23 4.5 ± 0.0 4.5 ± 0.0 4.4 ± 0.0 4.4 ± 0.0 4.4 ± 0.0 4.4 ± 0.0 Week 14 4.7 ± 0.0 4.7 ± 0.0 4.7 ± 0.0 4.7 ± 0.0 4.6 ± 0.0** 4.5 ± 0.0**

C-4 Triethylamine, NTP TOX 78
NOT FOR ATTRIBUTION Peer Review Draft
TABLE C1 Clinical Pathology Data for Rats in the 3-Month Inhalation Study of Triethylamine
Chamber Control
12.5 ppm
25 ppm
50 ppm
100 ppm
200 ppm
Male (continued) Clinical Chemistry (continued) n
Day 3 10 10 10 10 10 10 Day 23 10 10 10 10 9 10 Week 14 10 10 10 10 10 10
Globulin (g/dL)
Day 3 1.6 ± 0.0b 1.6 ± 0.1 1.6 ± 0.0 1.5 ± 0.0 1.5 ± 0.1 1.7 ± 0.0 Day 23 1.9 ± 0.0 1.9 ± 0.0 1.8 ± 0.0 1.9 ± 0.0 1.8 ± 0.0 1.8 ± 0.0 Week 14 2.5 ± 0.0 2.5 ± 0.0 2.5 ± 0.0 2.6 ± 0.0 2.5 ± 0.0 2.2 ± 0.0**
A/G ratio Day 3 2.8 ± 0.1b 2.8 ± 0.1 2.8 ± 0.1 3.0 ± 0.1 3.4 ± 0.6 2.7 ± 0.1 Day 23 2.4 ± 0.0 2.4 ± 0.0 2.5 ± 0.0 2.3 ± 0.1 2.4 ± 0.0 2.5 ± 0.0 Week 14 1.9 ± 0.0 1.9 ± 0.0 1.9 ± 0.0 1.8 ± 0.0 1.9 ± 0.0 2.0 ± 0.0*
Alanine aminotransferase (IU/L) Day 3 55 ± 2 54 ± 2 55 ± 3 50 ± 2 49 ± 1* 41 ± 1** Day 23 41 ± 1 41 ± 1 38 ± 1 40 ± 1 41 ± 1 39 ± 1 Week 14 81 ± 5 81 ± 5 77 ± 3 75 ± 4 69 ± 2* 57 ± 3**
Alkaline phosphatase (IU/L) Day 3 678 ± 11 695 ± 15 650 ± 14 638 ± 11 608 ± 10** 565 ± 7** Day 23 474 ± 15 446 ± 13 424 ± 17 450 ± 12 449 ± 18 475 ± 9 Week 14 254 ± 4 237 ± 5 243 ± 8 227 ± 5** 224 ± 6** 228 ± 6**
Creatine kinase (IU/L) Day 3 701 ± 163b 579 ± 81 486 ± 33b 401 ± 35 733 ± 159 446 ± 59 Day 23 333 ± 22 396 ± 50 369 ± 35 327 ± 21 427 ± 43 367 ± 38 Week 14 237 ± 25 267 ± 22 236 ± 27 269 ± 34 324 ± 89 219 ± 33
Sorbitol dehydrogenase (IU/L) Day 3 14 ± 1 15 ± 1 14 ± 1 15 ± 1 14 ± 1 14 ± 1 Day 23 14 ± 0 13 ± 1 13 ± 1 13 ± 0 12 ± 1 12 ± 1 Week 14 21 ± 1 20 ± 1 21 ± 1 19 ± 1 18 ± 1 16 ± 1**
Bile salts (µmol/L) Day 3 6.2 ± 0.6 6.7 ± 1.2 10.1 ± 2.2 5.8 ± 0.6 6.8 ± 1.0 6.3 ± 0.9 Day 23 4.5 ± 0.3 4.3 ± 0.3 4.0 ± 0.1 4.2 ± 0.5 3.6 ± 0.3 4.5 ± 0.5 Week 14 3.9 ± 0.3 3.7 ± 0.3 4.1 ± 0.8 3.1 ± 0.1** 3.7 ± 0.7** 4.2 ± 1.1*
Female n 10 10 10 10 10 10 Hematology Hematocrit (spun) (%)
Day 3 48.0 ± 0.4 47.7 ± 0.5 47.5 ± 0.6 48.2 ± 0.3 48.3 ± 0.5 49.4 ± 0.6 Day 23 47.9 ± 0.3 48.6 ± 0.2 48.3 ± 0.3 48.3 ± 0.3 47.8 ± 0.4 49.8 ± 0.5** Week 14 47.3 ± 0.5 48.2 ± 0.4 48.0 ± 0.5 47.7 ± 0.3 48.9 ± 0.6 47.9 ± 0.5
Hematocrit (mL/dL) Day 3 47.1 ± 0.4 46.9 ± 0.5 46.5 ± 0.6 46.9 ± 0.3 47.4 ± 0.5 48.6 ± 0.6 Day 23 47.9 ± 0.3 48.4 ± 0.2 48.5 ± 0.4 48.2 ± 0.3 47.5 ± 0.3 49.4 ± 0.4* Week 14 47.2 ± 0.4 48.0 ± 0.4 48.1 ± 0.5 47.6 ± 0.3 49.0 ± 0.5* 48.0 ± 0.5
Hemoglobin (g/dL) Day 3 14.8 ± 0.2 14.8 ± 0.2 14.7 ± 0.2 14.8 ± 0.1 14.9 ± 0.1 15.3 ± 0.2 Day 23 15.7 ± 0.1 16.1 ± 0.1 15.9 ± 0.1 15.7 ± 0.1 15.6 ± 0.1 16.2 ± 0.2* Week 14 15.6 ± 0.1 15.7 ± 0.1 15.8 ± 0.2 15.6 ± 0.1 16.0 ± 0.2 15.7 ± 0.2

Triethylamine, NTP TOX 78 C-5
Peer Review Draft NOT FOR ATTRIBUTION
TABLE C1 Clinical Pathology Data for Rats in the 3-Month Inhalation Study of Triethylamine
Chamber Control
12.5 ppm
25 ppm
50 ppm
100 ppm
200 ppm
Female (continued) n 10 10 10 10 10 10 Hematology (continued) Erythrocytes (106/μL)
Day 3 7.64 ± 0.11 7.69 ± 0.09 7.64 ± 0.11 7.71 ± 0.07 7.74 ± 0.09 8.02 ± 0.13 Day 23 8.04 ± 0.10 8.33 ± 0.07 8.17 ± 0.06 8.23 ± 0.06 8.07 ± 0.09 8.56 ± 0.09** Week 14 8.45 ± 0.06 8.56 ± 0.08 8.56 ± 0.08 8.50 ± 0.07 8.71 ± 0.07 8.56 ± 0.08
Reticulocytes (103/μL) Day 3 300.6 ± 21.2 287.2 ± 25.2 251.1 ± 18.1 261.3 ± 21.5 254.8 ± 21.2 271.9 ± 19.3 Day 23 155.5 ± 5.9 134.2 ± 9.1 156.0 ± 12.2 151.8 ± 12.6 158.6 ± 15.1 132.5 ± 12.0 Week 14 139.7 ± 12.2 165.6 ± 11.3 178.6 ± 16.0 159.8 ± 8.7 132.6 ± 8.7 129.4 ± 6.8
Nucleated erythrocytes/100 leukocytes Day 3 0.60 ± 0.27 0.30 ± 0.21 0.40 ± 0.16 0.50 ± 0.27 0.80 ± 0.33 0.90 ± 0.38 Day 23 0.00 ± 0.00 0.10 ± 0.10 0.00 ± 0.00 0.10 ± 0.10 0.20 ± 0.13 0.10 ± 0.10 Week 14 0.80 ± 0.25 0.90 ± 0.31 0.80 ± 0.25 0.40 ± 0.16 0.50 ± 0.17 0.50 ± 0.22
Mean cell volume (fL) Day 3 61.7 ± 0.4 61.1 ± 0.3 60.9 ± 0.5 60.9 ± 0.4 61.2 ± 0.3 60.6 ± 0.5 Day 23 59.6 ± 0.5 58.1 ± 0.3 59.4 ± 0.4 58.6 ± 0.3 58.9 ± 0.4 57.8 ± 0.4* Week 14 55.9 ± 0.2 56.1 ± 0.3 56.2 ± 0.2 56.1 ± 0.2 56.3 ± 0.2 56.1 ± 0.3
Mean cell hemoglobin (pg) Day 3 19.4 ± 0.1 19.2 ± 0.1 19.3 ± 0.1 19.3 ± 0.1 19.3 ± 0.1 19.1 ± 0.1 Day 23 19.5 ± 0.1 19.3 ± 0.1 19.4 ± 0.1 19.1 ± 0.1 19.4 ± 0.1 19.0 ± 0.1** Week 14 18.4 ± 0.0 18.4 ± 0.1 18.4 ± 0.1 18.4 ± 0.1 18.4 ± 0.1 18.4 ± 0.1
Mean cell hemoglobin concentration (g/dL) Day 3 31.5 ± 0.2 31.5 ± 0.2 31.6 ± 0.2 31.6 ± 0.2 31.6 ± 0.1 31.6 ± 0.3 Day 23 32.7 ± 0.1 33.2 ± 0.1 32.7 ± 0.2 32.6 ± 0.2 32.9 ± 0.1 32.8 ± 0.3 Week 14 32.9 ± 0.1 32.8 ± 0.1 32.8 ± 0.2 32.8 ± 0.2 32.6 ± 0.1 32.8 ± 0.2
Platelets (103/μL) Day 3 825.2 ± 21.6 807.4 ± 38.4 829.1 ± 23.7 845.2 ± 17.5 882.2 ± 31.2 884.6 ± 40.1 Day 23 810.1 ± 28.1 709.3 ± 34.9 810.9 ± 30.9 770.9 ± 23.6 806.2 ± 14.2 778.4 ± 18.5 Week 14 682.1 ± 17.2 653.8 ± 13.9 655.2 ± 16.7 675.0 ± 16.8 663.6 ± 10.9 660.2 ± 13.5
Leukocytes (103/μL) Day 3 12.66 ± 0.55 11.83 ± 0.65 12.15 ± 0.30 10.68 ± 0.53* 7.83 ± 0.29** 6.38 ± 0.45** Day 23 8.57 ± 0.38 7.73 ± 0.45 7.86 ± 0.48 7.84 ± 0.80 7.58 ± 0.58 6.33 ± 0.33** Week 14 6.32 ± 0.46 6.34 ± 0.23 7.58 ± 0.40 6.33 ± 0.30 7.04 ± 0.42 7.34 ± 0.32
Segmented neutrophils (103/μL) Day 3 1.06 ± 0.05 0.82 ± 0.04* 0.90 ± 0.06* 0.75 ± 0.03** 0.66 ± 0.05** 0.65 ± 0.03** Day 23 1.01 ± 0.10 0.94 ± 0.10 0.81 ± 0.07 0.89 ± 0.11 0.99 ± 0.10 0.93 ± 0.13 Week 14 1.08 ± 0.08 1.20 ± 0.09 1.47 ± 0.15 1.26 ± 0.10 1.35 ± 0.08 1.31 ± 0.05
Lymphocytes (103/μL) Day 3 11.22 ± 0.50 10.65 ± 0.60 10.88 ± 0.28 9.60 ± 0.54* 6.83 ± 0.26** 5.55 ± 0.43** Day 23 7.33 ± 0.34 6.54 ± 0.41 6.80 ± 0.42 6.76 ± 0.67 6.39 ± 0.50 5.19 ± 0.34** Week 14 5.06 ± 0.45 4.96 ± 0.16 5.85 ± 0.34 4.86 ± 0.24 5.51 ± 0.42 5.84 ± 0.29
Monocytes (103/μL) Day 3 0.24 ± 0.06 0.23 ± 0.07 0.22 ± 0.05 0.19 ± 0.05 0.26 ± 0.04 0.11 ± 0.02 Day 23 0.12 ± 0.03 0.15 ± 0.03 0.14 ± 0.04 0.10 ± 0.04 0.09 ± 0.04 0.14 ± 0.04 Week 14 0.09 ± 0.01 0.08 ± 0.02 0.16 ± 0.05 0.12 ± 0.03 0.09 ± 0.02 0.07 ± 0.02
Basophils (103/μL) Day 3 0.012 ± 0.003 0.015 ± 0.004 0.012 ± 0.002 0.008 ± 0.002 0.008 ± 0.002 0.004 ± 0.002* Day 23 0.007 ± 0.002 0.008 ± 0.002 0.003 ± 0.002 0.005 ± 0.002 0.002 ± 0.001* 0.000 ± 0.000** Week 14 0.002 ± 0.001 0.008 ± 0.007 0.010 ± 0.006 0.000 ± 0.000 0.013 ± 0.009 0.002 ± 0.001
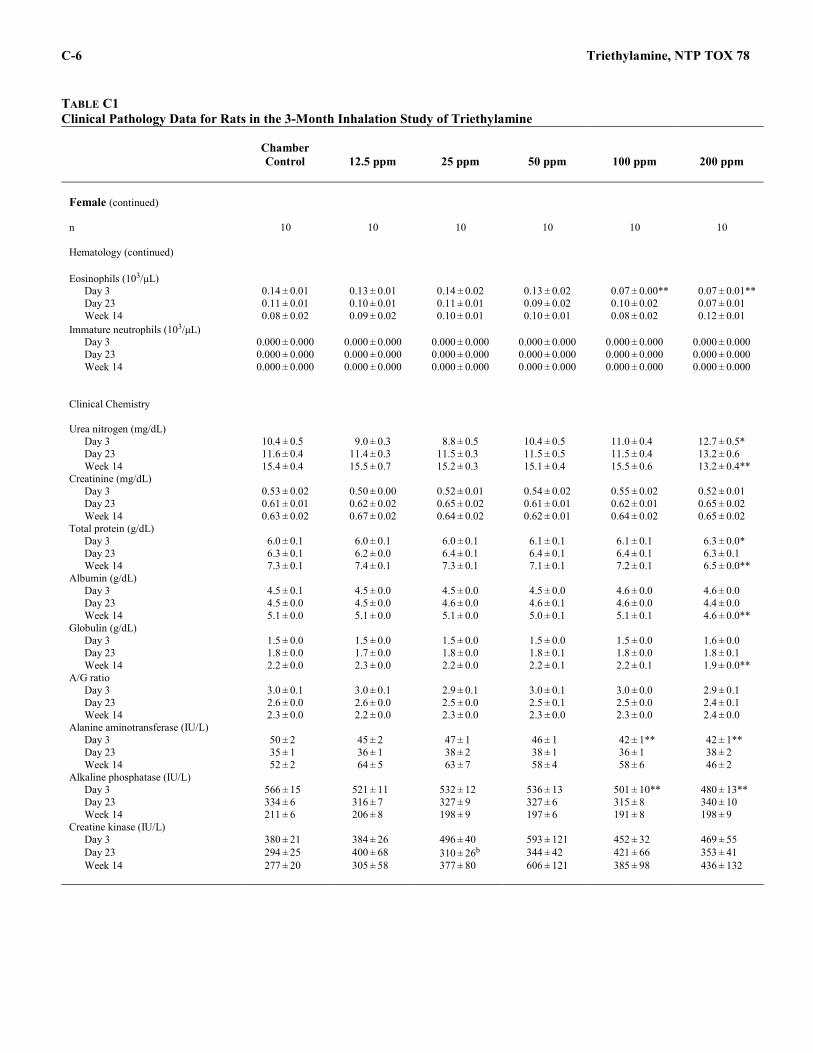
C-6 Triethylamine, NTP TOX 78
NOT FOR ATTRIBUTION Peer Review Draft
TABLE C1 Clinical Pathology Data for Rats in the 3-Month Inhalation Study of Triethylamine
Chamber Control
12.5 ppm
25 ppm
50 ppm
100 ppm
200 ppm
Female (continued) n 10 10 10 10 10 10 Hematology (continued) Eosinophils (103/μL)
Day 3 0.14 ± 0.01 0.13 ± 0.01 0.14 ± 0.02 0.13 ± 0.02 0.07 ± 0.00** 0.07 ± 0.01** Day 23 0.11 ± 0.01 0.10 ± 0.01 0.11 ± 0.01 0.09 ± 0.02 0.10 ± 0.02 0.07 ± 0.01 Week 14 0.08 ± 0.02 0.09 ± 0.02 0.10 ± 0.01 0.10 ± 0.01 0.08 ± 0.02 0.12 ± 0.01
Immature neutrophils (103/μL) Day 3 0.000 ± 0.000 0.000 ± 0.000 0.000 ± 0.000 0.000 ± 0.000 0.000 ± 0.000 0.000 ± 0.000 Day 23 0.000 ± 0.000 0.000 ± 0.000 0.000 ± 0.000 0.000 ± 0.000 0.000 ± 0.000 0.000 ± 0.000 Week 14 0.000 ± 0.000 0.000 ± 0.000 0.000 ± 0.000 0.000 ± 0.000 0.000 ± 0.000 0.000 ± 0.000
Clinical Chemistry Urea nitrogen (mg/dL)
Day 3 10.4 ± 0.5 9.0 ± 0.3 8.8 ± 0.5 10.4 ± 0.5 11.0 ± 0.4 12.7 ± 0.5* Day 23 11.6 ± 0.4 11.4 ± 0.3 11.5 ± 0.3 11.5 ± 0.5 11.5 ± 0.4 13.2 ± 0.6 Week 14 15.4 ± 0.4 15.5 ± 0.7 15.2 ± 0.3 15.1 ± 0.4 15.5 ± 0.6 13.2 ± 0.4**
Creatinine (mg/dL) Day 3 0.53 ± 0.02 0.50 ± 0.00 0.52 ± 0.01 0.54 ± 0.02 0.55 ± 0.02 0.52 ± 0.01 Day 23 0.61 ± 0.01 0.62 ± 0.02 0.65 ± 0.02 0.61 ± 0.01 0.62 ± 0.01 0.65 ± 0.02 Week 14 0.63 ± 0.02 0.67 ± 0.02 0.64 ± 0.02 0.62 ± 0.01 0.64 ± 0.02 0.65 ± 0.02
Total protein (g/dL) Day 3 6.0 ± 0.1 6.0 ± 0.1 6.0 ± 0.1 6.1 ± 0.1 6.1 ± 0.1 6.3 ± 0.0* Day 23 6.3 ± 0.1 6.2 ± 0.0 6.4 ± 0.1 6.4 ± 0.1 6.4 ± 0.1 6.3 ± 0.1 Week 14 7.3 ± 0.1 7.4 ± 0.1 7.3 ± 0.1 7.1 ± 0.1 7.2 ± 0.1 6.5 ± 0.0**
Albumin (g/dL) Day 3 4.5 ± 0.1 4.5 ± 0.0 4.5 ± 0.0 4.5 ± 0.0 4.6 ± 0.0 4.6 ± 0.0 Day 23 4.5 ± 0.0 4.5 ± 0.0 4.6 ± 0.0 4.6 ± 0.1 4.6 ± 0.0 4.4 ± 0.0 Week 14 5.1 ± 0.0 5.1 ± 0.0 5.1 ± 0.0 5.0 ± 0.1 5.1 ± 0.1 4.6 ± 0.0**
Globulin (g/dL) Day 3 1.5 ± 0.0 1.5 ± 0.0 1.5 ± 0.0 1.5 ± 0.0 1.5 ± 0.0 1.6 ± 0.0 Day 23 1.8 ± 0.0 1.7 ± 0.0 1.8 ± 0.0 1.8 ± 0.1 1.8 ± 0.0 1.8 ± 0.1 Week 14 2.2 ± 0.0 2.3 ± 0.0 2.2 ± 0.0 2.2 ± 0.1 2.2 ± 0.1 1.9 ± 0.0**
A/G ratio Day 3 3.0 ± 0.1 3.0 ± 0.1 2.9 ± 0.1 3.0 ± 0.1 3.0 ± 0.0 2.9 ± 0.1 Day 23 2.6 ± 0.0 2.6 ± 0.0 2.5 ± 0.0 2.5 ± 0.1 2.5 ± 0.0 2.4 ± 0.1 Week 14 2.3 ± 0.0 2.2 ± 0.0 2.3 ± 0.0 2.3 ± 0.0 2.3 ± 0.0 2.4 ± 0.0
Alanine aminotransferase (IU/L) Day 3 50 ± 2 45 ± 2 47 ± 1 46 ± 1 42 ± 1** 42 ± 1** Day 23 35 ± 1 36 ± 1 38 ± 2 38 ± 1 36 ± 1 38 ± 2 Week 14 52 ± 2 64 ± 5 63 ± 7 58 ± 4 58 ± 6 46 ± 2
Alkaline phosphatase (IU/L) Day 3 566 ± 15 521 ± 11 532 ± 12 536 ± 13 501 ± 10** 480 ± 13** Day 23 334 ± 6 316 ± 7 327 ± 9 327 ± 6 315 ± 8 340 ± 10 Week 14 211 ± 6 206 ± 8 198 ± 9 197 ± 6 191 ± 8 198 ± 9
Creatine kinase (IU/L) Day 3 380 ± 21 384 ± 26 496 ± 40 593 ± 121 452 ± 32 469 ± 55 Day 23 294 ± 25 400 ± 68 310 ± 26b 344 ± 42 421 ± 66 353 ± 41 Week 14 277 ± 20 305 ± 58 377 ± 80 606 ± 121 385 ± 98 436 ± 132
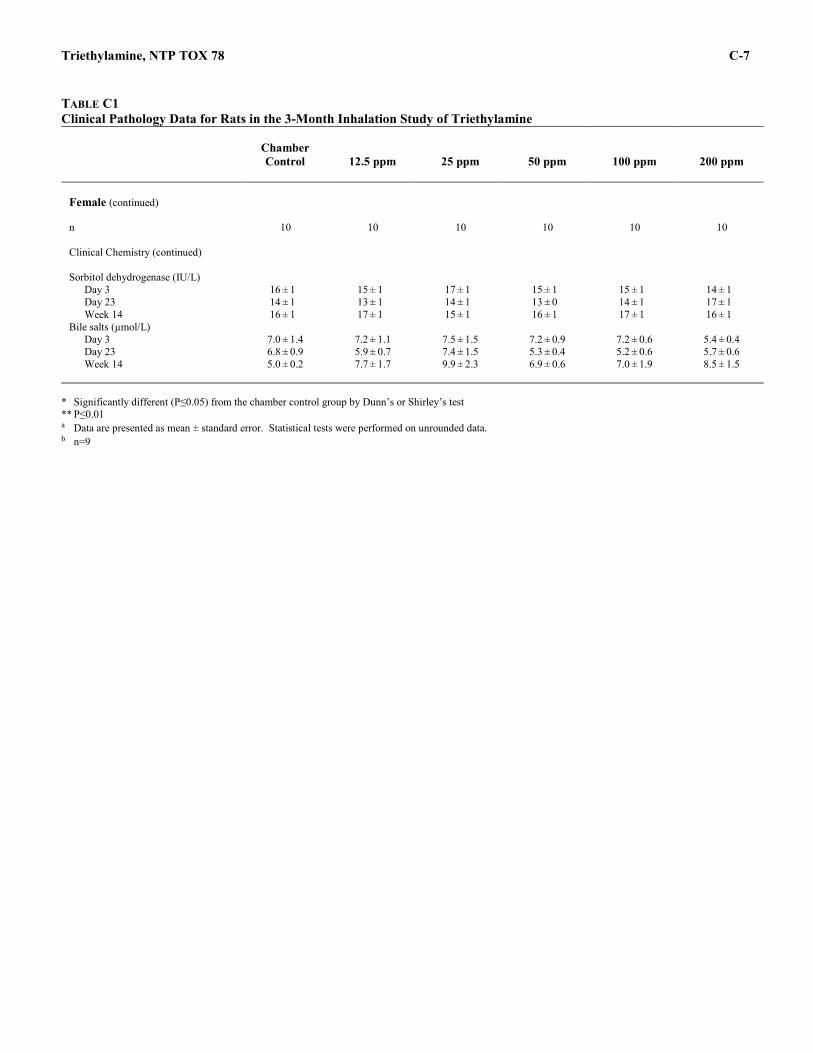
Triethylamine, NTP TOX 78 C-7
Peer Review Draft NOT FOR ATTRIBUTION
TABLE C1 Clinical Pathology Data for Rats in the 3-Month Inhalation Study of Triethylamine
Chamber Control
12.5 ppm
25 ppm
50 ppm
100 ppm
200 ppm
Female (continued) n 10 10 10 10 10 10 Clinical Chemistry (continued)
Sorbitol dehydrogenase (IU/L)
Day 3 16 ± 1 15 ± 1 17 ± 1 15 ± 1 15 ± 1 14 ± 1 Day 23 14 ± 1 13 ± 1 14 ± 1 13 ± 0 14 ± 1 17 ± 1 Week 14 16 ± 1 17 ± 1 15 ± 1 16 ± 1 17 ± 1 16 ± 1
Bile salts (µmol/L) Day 3 7.0 ± 1.4 7.2 ± 1.1 7.5 ± 1.5 7.2 ± 0.9 7.2 ± 0.6 5.4 ± 0.4 Day 23 6.8 ± 0.9 5.9 ± 0.7 7.4 ± 1.5 5.3 ± 0.4 5.2 ± 0.6 5.7 ± 0.6 Week 14 5.0 ± 0.2 7.7 ± 1.7 9.9 ± 2.3 6.9 ± 0.6 7.0 ± 1.9 8.5 ± 1.5
* Significantly different (P≤0.05) from the chamber control group by Dunn’s or Shirley’s test ** P≤0.01 a Data are presented as mean ± standard error. Statistical tests were performed on unrounded data. b n=9
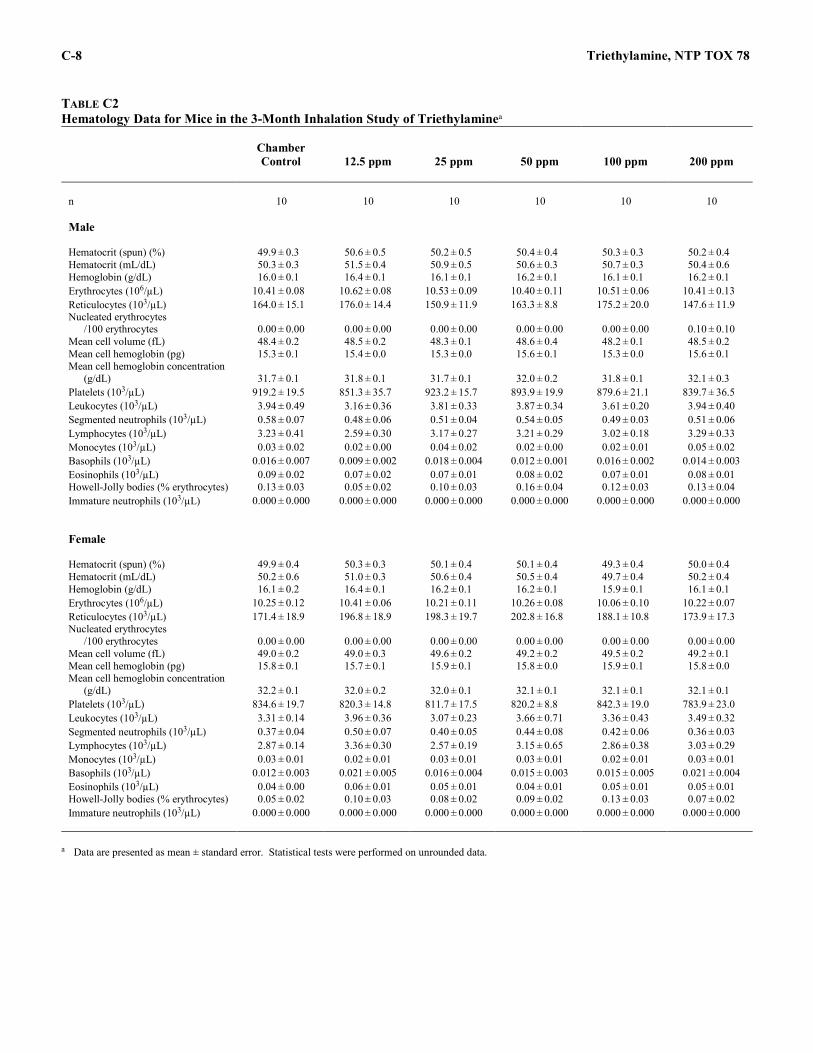
C-8 Triethylamine, NTP TOX 78
NOT FOR ATTRIBUTION Peer Review Draft
TABLE C2 Hematology Data for Mice in the 3-Month Inhalation Study of Triethylaminea
Chamber Control
12.5 ppm
25 ppm
50 ppm
100 ppm
200 ppm
n 10 10 10 10 10 10 Male Hematocrit (spun) (%) 49.9 ± 0.3 50.6 ± 0.5 50.2 ± 0.5 50.4 ± 0.4 50.3 ± 0.3 50.2 ± 0.4 Hematocrit (mL/dL) 50.3 ± 0.3 51.5 ± 0.4 50.9 ± 0.5 50.6 ± 0.3 50.7 ± 0.3 50.4 ± 0.6 Hemoglobin (g/dL) 16.0 ± 0.1 16.4 ± 0.1 16.1 ± 0.1 16.2 ± 0.1 16.1 ± 0.1 16.2 ± 0.1 Erythrocytes (106/µL) 10.41 ± 0.08 10.62 ± 0.08 10.53 ± 0.09 10.40 ± 0.11 10.51 ± 0.06 10.41 ± 0.13 Reticulocytes (103/µL) 164.0 ± 15.1 176.0 ± 14.4 150.9 ± 11.9 163.3 ± 8.8 175.2 ± 20.0 147.6 ± 11.9 Nucleated erythrocytes
/100 erythrocytes 0.00 ± 0.00 0.00 ± 0.00 0.00 ± 0.00 0.00 ± 0.00 0.00 ± 0.00 0.10 ± 0.10 Mean cell volume (fL) 48.4 ± 0.2 48.5 ± 0.2 48.3 ± 0.1 48.6 ± 0.4 48.2 ± 0.1 48.5 ± 0.2 Mean cell hemoglobin (pg) 15.3 ± 0.1 15.4 ± 0.0 15.3 ± 0.0 15.6 ± 0.1 15.3 ± 0.0 15.6 ± 0.1 Mean cell hemoglobin concentration
(g/dL) 31.7 ± 0.1 31.8 ± 0.1 31.7 ± 0.1 32.0 ± 0.2 31.8 ± 0.1 32.1 ± 0.3 Platelets (103/µL) 919.2 ± 19.5 851.3 ± 35.7 923.2 ± 15.7 893.9 ± 19.9 879.6 ± 21.1 839.7 ± 36.5 Leukocytes (103/µL) 3.94 ± 0.49 3.16 ± 0.36 3.81 ± 0.33 3.87 ± 0.34 3.61 ± 0.20 3.94 ± 0.40 Segmented neutrophils (103/µL) 0.58 ± 0.07 0.48 ± 0.06 0.51 ± 0.04 0.54 ± 0.05 0.49 ± 0.03 0.51 ± 0.06 Lymphocytes (103/µL) 3.23 ± 0.41 2.59 ± 0.30 3.17 ± 0.27 3.21 ± 0.29 3.02 ± 0.18 3.29 ± 0.33 Monocytes (103/µL) 0.03 ± 0.02 0.02 ± 0.00 0.04 ± 0.02 0.02 ± 0.00 0.02 ± 0.01 0.05 ± 0.02 Basophils (103/µL) 0.016 ± 0.007 0.009 ± 0.002 0.018 ± 0.004 0.012 ± 0.001 0.016 ± 0.002 0.014 ± 0.003 Eosinophils (103/µL) 0.09 ± 0.02 0.07 ± 0.02 0.07 ± 0.01 0.08 ± 0.02 0.07 ± 0.01 0.08 ± 0.01 Howell-Jolly bodies (% erythrocytes) 0.13 ± 0.03 0.05 ± 0.02 0.10 ± 0.03 0.16 ± 0.04 0.12 ± 0.03 0.13 ± 0.04 Immature neutrophils (103/µL) 0.000 ± 0.000 0.000 ± 0.000 0.000 ± 0.000 0.000 ± 0.000 0.000 ± 0.000 0.000 ± 0.000 Female Hematocrit (spun) (%) 49.9 ± 0.4 50.3 ± 0.3 50.1 ± 0.4 50.1 ± 0.4 49.3 ± 0.4 50.0 ± 0.4 Hematocrit (mL/dL) 50.2 ± 0.6 51.0 ± 0.3 50.6 ± 0.4 50.5 ± 0.4 49.7 ± 0.4 50.2 ± 0.4 Hemoglobin (g/dL) 16.1 ± 0.2 16.4 ± 0.1 16.2 ± 0.1 16.2 ± 0.1 15.9 ± 0.1 16.1 ± 0.1 Erythrocytes (106/µL) 10.25 ± 0.12 10.41 ± 0.06 10.21 ± 0.11 10.26 ± 0.08 10.06 ± 0.10 10.22 ± 0.07 Reticulocytes (103/µL) 171.4 ± 18.9 196.8 ± 18.9 198.3 ± 19.7 202.8 ± 16.8 188.1 ± 10.8 173.9 ± 17.3 Nucleated erythrocytes
/100 erythrocytes 0.00 ± 0.00 0.00 ± 0.00 0.00 ± 0.00 0.00 ± 0.00 0.00 ± 0.00 0.00 ± 0.00 Mean cell volume (fL) 49.0 ± 0.2 49.0 ± 0.3 49.6 ± 0.2 49.2 ± 0.2 49.5 ± 0.2 49.2 ± 0.1 Mean cell hemoglobin (pg) 15.8 ± 0.1 15.7 ± 0.1 15.9 ± 0.1 15.8 ± 0.0 15.9 ± 0.1 15.8 ± 0.0 Mean cell hemoglobin concentration
(g/dL) 32.2 ± 0.1 32.0 ± 0.2 32.0 ± 0.1 32.1 ± 0.1 32.1 ± 0.1 32.1 ± 0.1 Platelets (103/µL) 834.6 ± 19.7 820.3 ± 14.8 811.7 ± 17.5 820.2 ± 8.8 842.3 ± 19.0 783.9 ± 23.0 Leukocytes (103/µL) 3.31 ± 0.14 3.96 ± 0.36 3.07 ± 0.23 3.66 ± 0.71 3.36 ± 0.43 3.49 ± 0.32 Segmented neutrophils (103/µL) 0.37 ± 0.04 0.50 ± 0.07 0.40 ± 0.05 0.44 ± 0.08 0.42 ± 0.06 0.36 ± 0.03 Lymphocytes (103/µL) 2.87 ± 0.14 3.36 ± 0.30 2.57 ± 0.19 3.15 ± 0.65 2.86 ± 0.38 3.03 ± 0.29 Monocytes (103/µL) 0.03 ± 0.01 0.02 ± 0.01 0.03 ± 0.01 0.03 ± 0.01 0.02 ± 0.01 0.03 ± 0.01 Basophils (103/µL) 0.012 ± 0.003 0.021 ± 0.005 0.016 ± 0.004 0.015 ± 0.003 0.015 ± 0.005 0.021 ± 0.004 Eosinophils (103/µL) 0.04 ± 0.00 0.06 ± 0.01 0.05 ± 0.01 0.04 ± 0.01 0.05 ± 0.01 0.05 ± 0.01 Howell-Jolly bodies (% erythrocytes) 0.05 ± 0.02 0.10 ± 0.03 0.08 ± 0.02 0.09 ± 0.02 0.13 ± 0.03 0.07 ± 0.02 Immature neutrophils (103/µL) 0.000 ± 0.000 0.000 ± 0.000 0.000 ± 0.000 0.000 ± 0.000 0.000 ± 0.000 0.000 ± 0.000
a Data are presented as mean ± standard error. Statistical tests were performed on unrounded data.
D-1
Peer Review Draft NOT FOR ATTRIBUTION
APPENDIX D ORGAN WEIGHTS
AND ORGAN-WEIGHT-TO-BODY-WEIGHT RATIOS
TABLE D1 Organ Weights and Organ-Weight-to-Body-Weight Ratios for Rats in the 2-Week Inhalation Study of Triethylamine ........................................................................... D-2 TABLE D2 Organ Weights and Organ-Weight-to-Body-Weight Ratios for Rats in the 3-Month Inhalation Study of Triethylamine ........................................................................ D-3 TABLE D3 Organ Weights and Organ-Weight-to-Body-Weight Ratios for Mice in the 2-Week Inhalation Study of Triethylamine ........................................................................... D-4 TABLE D4 Organ Weights and Organ-Weight-to-Body-Weight Ratios for Mice in the 3-Month Inhalation Study of Triethylamine ........................................................................ D-5
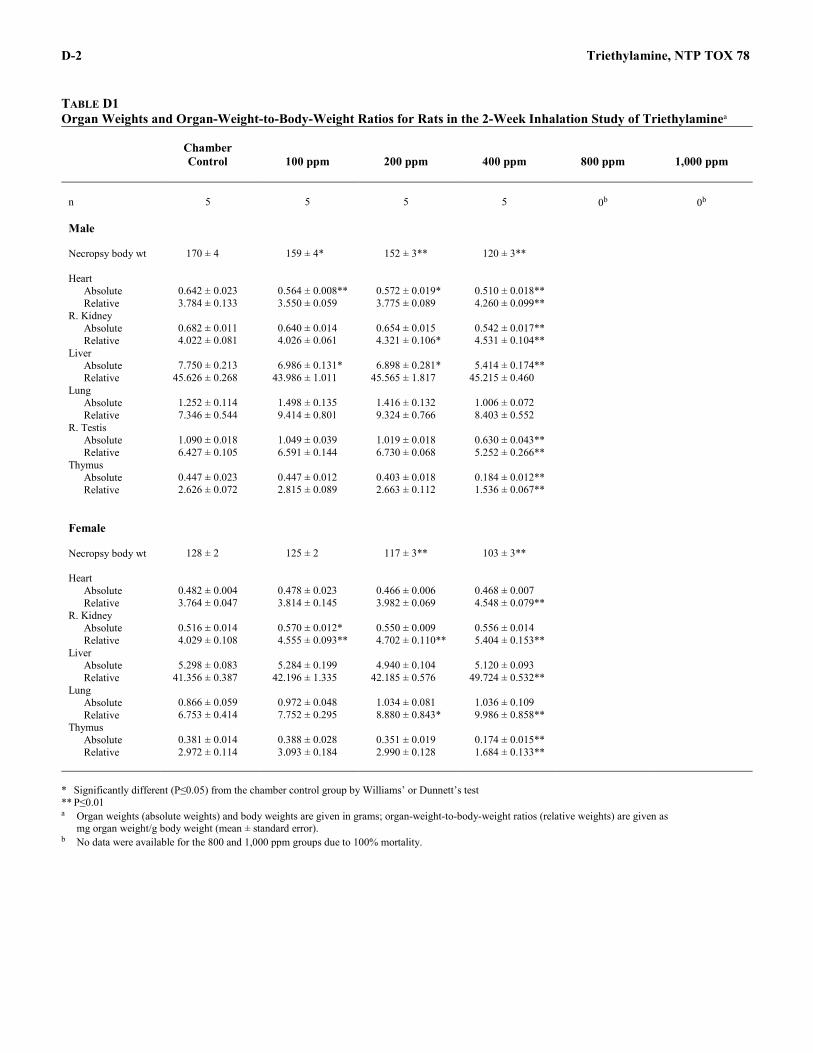
D-2 Triethylamine, NTP TOX 78
NOT FOR ATTRIBUTION Peer Review Draft
TABLE D1 Organ Weights and Organ-Weight-to-Body-Weight Ratios for Rats in the 2-Week Inhalation Study of Triethylaminea
Chamber Control
100 ppm
200 ppm
400 ppm
800 ppm
1,000 ppm
n 5 5 5 5 0b 0b Male Necropsy body wt 170 ± 4 159 ± 4* 152 ± 3** 120 ± 3** Heart
Absolute 0.642 ± 0.023 0.564 ± 0.008** 0.572 ± 0.019* 0.510 ± 0.018** Relative 3.784 ± 0.133 3.550 ± 0.059 3.775 ± 0.089 4.260 ± 0.099**
R. Kidney Absolute 0.682 ± 0.011 0.640 ± 0.014 0.654 ± 0.015 0.542 ± 0.017** Relative 4.022 ± 0.081 4.026 ± 0.061 4.321 ± 0.106* 4.531 ± 0.104**
Liver Absolute 7.750 ± 0.213 6.986 ± 0.131* 6.898 ± 0.281* 5.414 ± 0.174** Relative 45.626 ± 0.268 43.986 ± 1.011 45.565 ± 1.817 45.215 ± 0.460
Lung Absolute 1.252 ± 0.114 1.498 ± 0.135 1.416 ± 0.132 1.006 ± 0.072 Relative 7.346 ± 0.544 9.414 ± 0.801 9.324 ± 0.766 8.403 ± 0.552
R. Testis Absolute 1.090 ± 0.018 1.049 ± 0.039 1.019 ± 0.018 0.630 ± 0.043** Relative 6.427 ± 0.105 6.591 ± 0.144 6.730 ± 0.068 5.252 ± 0.266**
Thymus Absolute 0.447 ± 0.023 0.447 ± 0.012 0.403 ± 0.018 0.184 ± 0.012** Relative 2.626 ± 0.072 2.815 ± 0.089 2.663 ± 0.112 1.536 ± 0.067**
Female Necropsy body wt 128 ± 2 125 ± 2 117 ± 3** 103 ± 3** Heart
Absolute 0.482 ± 0.004 0.478 ± 0.023 0.466 ± 0.006 0.468 ± 0.007 Relative 3.764 ± 0.047 3.814 ± 0.145 3.982 ± 0.069 4.548 ± 0.079**
R. Kidney Absolute 0.516 ± 0.014 0.570 ± 0.012* 0.550 ± 0.009 0.556 ± 0.014 Relative 4.029 ± 0.108 4.555 ± 0.093** 4.702 ± 0.110** 5.404 ± 0.153**
Liver Absolute 5.298 ± 0.083 5.284 ± 0.199 4.940 ± 0.104 5.120 ± 0.093 Relative 41.356 ± 0.387 42.196 ± 1.335 42.185 ± 0.576 49.724 ± 0.532**
Lung Absolute 0.866 ± 0.059 0.972 ± 0.048 1.034 ± 0.081 1.036 ± 0.109 Relative 6.753 ± 0.414 7.752 ± 0.295 8.880 ± 0.843* 9.986 ± 0.858**
Thymus Absolute 0.381 ± 0.014 0.388 ± 0.028 0.351 ± 0.019 0.174 ± 0.015** Relative 2.972 ± 0.114 3.093 ± 0.184 2.990 ± 0.128 1.684 ± 0.133**
* Significantly different (P≤0.05) from the chamber control group by Williams’ or Dunnett’s test ** P≤0.01 a Organ weights (absolute weights) and body weights are given in grams; organ-weight-to-body-weight ratios (relative weights) are given as
mg organ weight/g body weight (mean ± standard error). b No data were available for the 800 and 1,000 ppm groups due to 100% mortality.
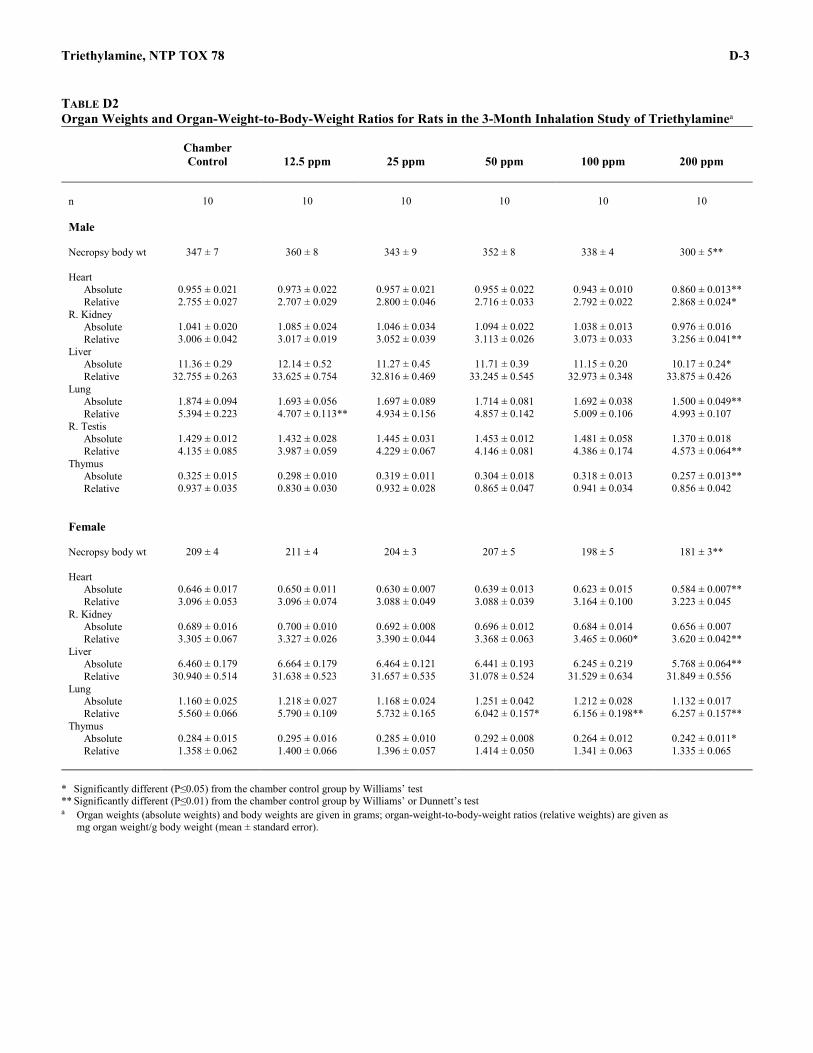
Triethylamine, NTP TOX 78 D-3
Peer Review Draft NOT FOR ATTRIBUTION
TABLE D2 Organ Weights and Organ-Weight-to-Body-Weight Ratios for Rats in the 3-Month Inhalation Study of Triethylaminea
Chamber Control
12.5 ppm
25 ppm
50 ppm
100 ppm
200 ppm
n 10 10 10 10 10 10 Male Necropsy body wt 347 ± 7 360 ± 8 343 ± 9 352 ± 8 338 ± 4 300 ± 5** Heart
Absolute 0.955 ± 0.021 0.973 ± 0.022 0.957 ± 0.021 0.955 ± 0.022 0.943 ± 0.010 0.860 ± 0.013** Relative 2.755 ± 0.027 2.707 ± 0.029 2.800 ± 0.046 2.716 ± 0.033 2.792 ± 0.022 2.868 ± 0.024*
R. Kidney Absolute 1.041 ± 0.020 1.085 ± 0.024 1.046 ± 0.034 1.094 ± 0.022 1.038 ± 0.013 0.976 ± 0.016 Relative 3.006 ± 0.042 3.017 ± 0.019 3.052 ± 0.039 3.113 ± 0.026 3.073 ± 0.033 3.256 ± 0.041**
Liver Absolute 11.36 ± 0.29 12.14 ± 0.52 11.27 ± 0.45 11.71 ± 0.39 11.15 ± 0.20 10.17 ± 0.24* Relative 32.755 ± 0.263 33.625 ± 0.754 32.816 ± 0.469 33.245 ± 0.545 32.973 ± 0.348 33.875 ± 0.426
Lung Absolute 1.874 ± 0.094 1.693 ± 0.056 1.697 ± 0.089 1.714 ± 0.081 1.692 ± 0.038 1.500 ± 0.049** Relative 5.394 ± 0.223 4.707 ± 0.113** 4.934 ± 0.156 4.857 ± 0.142 5.009 ± 0.106 4.993 ± 0.107
R. Testis Absolute 1.429 ± 0.012 1.432 ± 0.028 1.445 ± 0.031 1.453 ± 0.012 1.481 ± 0.058 1.370 ± 0.018 Relative 4.135 ± 0.085 3.987 ± 0.059 4.229 ± 0.067 4.146 ± 0.081 4.386 ± 0.174 4.573 ± 0.064**
Thymus Absolute 0.325 ± 0.015 0.298 ± 0.010 0.319 ± 0.011 0.304 ± 0.018 0.318 ± 0.013 0.257 ± 0.013** Relative 0.937 ± 0.035 0.830 ± 0.030 0.932 ± 0.028 0.865 ± 0.047 0.941 ± 0.034 0.856 ± 0.042
Female Necropsy body wt 209 ± 4 211 ± 4 204 ± 3 207 ± 5 198 ± 5 181 ± 3** Heart
Absolute 0.646 ± 0.017 0.650 ± 0.011 0.630 ± 0.007 0.639 ± 0.013 0.623 ± 0.015 0.584 ± 0.007** Relative 3.096 ± 0.053 3.096 ± 0.074 3.088 ± 0.049 3.088 ± 0.039 3.164 ± 0.100 3.223 ± 0.045
R. Kidney Absolute 0.689 ± 0.016 0.700 ± 0.010 0.692 ± 0.008 0.696 ± 0.012 0.684 ± 0.014 0.656 ± 0.007 Relative 3.305 ± 0.067 3.327 ± 0.026 3.390 ± 0.044 3.368 ± 0.063 3.465 ± 0.060* 3.620 ± 0.042**
Liver Absolute 6.460 ± 0.179 6.664 ± 0.179 6.464 ± 0.121 6.441 ± 0.193 6.245 ± 0.219 5.768 ± 0.064** Relative 30.940 ± 0.514 31.638 ± 0.523 31.657 ± 0.535 31.078 ± 0.524 31.529 ± 0.634 31.849 ± 0.556
Lung Absolute 1.160 ± 0.025 1.218 ± 0.027 1.168 ± 0.024 1.251 ± 0.042 1.212 ± 0.028 1.132 ± 0.017 Relative 5.560 ± 0.066 5.790 ± 0.109 5.732 ± 0.165 6.042 ± 0.157* 6.156 ± 0.198** 6.257 ± 0.157**
Thymus Absolute 0.284 ± 0.015 0.295 ± 0.016 0.285 ± 0.010 0.292 ± 0.008 0.264 ± 0.012 0.242 ± 0.011* Relative 1.358 ± 0.062 1.400 ± 0.066 1.396 ± 0.057 1.414 ± 0.050 1.341 ± 0.063 1.335 ± 0.065
* Significantly different (P≤0.05) from the chamber control group by Williams’ test ** Significantly different (P≤0.01) from the chamber control group by Williams’ or Dunnett’s test a Organ weights (absolute weights) and body weights are given in grams; organ-weight-to-body-weight ratios (relative weights) are given as
mg organ weight/g body weight (mean ± standard error).

D-4 Triethylamine, NTP TOX 78
NOT FOR ATTRIBUTION Peer Review Draft
TABLE D3 Organ Weights and Organ-Weight-to-Body-Weight Ratios for Mice in the 2-Week Inhalation Study of Triethylaminea
Chamber Control
100 ppm
200 ppm
400 ppm
800 ppm
1,000 ppm
n 5 5 5 5 0b 0b Male Necropsy body wt 26.2 ± 0.6 25.6 ± 0.6 24.7 ± 0.5 19.4 ± 0.6** Heart
Absolute 0.124 ± 0.005 0.116 ± 0.004 0.116 ± 0.002 0.098 ± 0.002** Relative 4.724 ± 0.147 4.534 ± 0.107 4.696 ± 0.093 5.068 ± 0.063
R. Kidney Absolute 0.214 ± 0.002 0.230 ± 0.010 0.228 ± 0.007 0.170 ± 0.008** Relative 8.166 ± 0.129 8.980 ± 0.292 9.235 ± 0.322* 8.766 ± 0.193
Liver Absolute 1.348 ± 0.044 1.276 ± 0.055 1.182 ± 0.040* 0.930 ± 0.046** Relative 51.364 ± 1.117 49.800 ± 1.052 47.764 ± 0.748 47.916 ± 1.131
Lung Absolute 0.180 ± 0.007 0.180 ± 0.010 0.182 ± 0.006 0.174 ± 0.010 Relative 6.863 ± 0.236 7.026 ± 0.280 7.367 ± 0.217 8.961 ± 0.277**
R. Testis Absolute 0.102 ± 0.003 0.104 ± 0.002 0.103 ± 0.003 0.096 ± 0.002 Relative 3.873 ± 0.067 4.072 ± 0.099 4.189 ± 0.125* 4.954 ± 0.065**
Thymus Absolute 0.058 ± 0.005 0.056 ± 0.001 0.043 ± 0.002** 0.015 ± 0.003** Relative 2.219 ± 0.152 2.175 ± 0.022 1.740 ± 0.080** 0.785 ± 0.115**
Female Necropsy body wt 22.7 ± 0.4 22.9 ± 0.4 21.8 ± 0.5 17.1 ± 0.3** Heart
Absolute 0.116 ± 0.002 0.128 ± 0.013 0.110 ± 0.005 0.086 ± 0.004* Relative 5.102 ± 0.067 5.582 ± 0.553 5.031 ± 0.153 5.021 ± 0.149
R. Kidney Absolute 0.172 ± 0.007 0.174 ± 0.007 0.166 ± 0.007 0.146 ± 0.002** Relative 7.555 ± 0.191 7.603 ± 0.342 7.599 ± 0.190 8.544 ± 0.136*
Liver Absolute 1.218 ± 0.041 1.170 ± 0.020 1.148 ± 0.044 0.836 ± 0.015** Relative 53.509 ± 0.951 51.071 ± 0.773 52.546 ± 1.013 48.903 ± 0.465**
Lung Absolute 0.186 ± 0.010 0.210 ± 0.024 0.190 ± 0.009 0.190 ± 0.013 Relative 8.186 ± 0.448 9.138 ± 0.965 8.690 ± 0.231 11.130 ± 0.815**
Thymus Absolute 0.081 ± 0.008 0.075 ± 0.002 0.065 ± 0.010 0.017 ± 0.002** Relative 3.563 ± 0.311 3.256 ± 0.092 2.954 ± 0.420 0.966 ± 0.101**
* Significantly different (P≤0.05) from the chamber control group by Williams’ or Dunnett’s test ** P≤0.01 a Organ weights (absolute weights) and body weights are given in grams; organ-weight-to-body-weight ratios (relative weights) are given as
mg organ weight/g body weight (mean ± standard error). b No data were available for the 800 and 1,000 ppm groups due to 100% mortality.

Triethylamine, NTP TOX 78 D-5
Peer Review Draft NOT FOR ATTRIBUTION
TABLE D4 Organ Weights and Organ-Weight-to-Body-Weight Ratios for Mice in the 3-Month Inhalation Study of Triethylaminea
Chamber Control
12.5 ppm
25 ppm
50 ppm
100 ppm
200 ppm
n 10 10 10 10 10 10 Male Necropsy body wt 37.6 ± 0.8 38.3 ± 0.9 37.6 ± 0.7 38.6 ± 0.5 38.3 ± 0.6 31.9 ± 0.6** Heart
Absolute 0.162 ± 0.003 0.169 ± 0.003 0.161 ± 0.002 0.169 ± 0.004 0.162 ± 0.003 0.145 ± 0.003** Relative 4.314 ± 0.092 4.421 ± 0.087 4.299 ± 0.091 4.386 ± 0.105 4.238 ± 0.084 4.550 ± 0.102
R. Kidney Absolute 0.309 ± 0.008 0.310 ± 0.006 0.315 ± 0.005 0.327 ± 0.010 0.315 ± 0.007 0.278 ± 0.006* Relative 8.232 ± 0.226 8.111 ± 0.171 8.400 ± 0.118 8.474 ± 0.213 8.234 ± 0.165 8.718 ± 0.177
Liver Absolute 1.644 ± 0.046 1.648 ± 0.041 1.582 ± 0.032 1.615 ± 0.030 1.599 ± 0.020 1.322 ± 0.038** Relative 43.681 ± 0.759 43.040 ± 0.671 42.199 ± 0.848 41.865 ± 0.443 41.832 ± 0.648 41.463 ± 1.135
Lung Absolute 0.227 ± 0.005 0.240 ± 0.007 0.230 ± 0.003 0.231 ± 0.003 0.233 ± 0.004 0.216 ± 0.006 Relative 6.039 ± 0.105 6.277 ± 0.193 6.145 ± 0.145 5.997 ± 0.096 6.096 ± 0.125 6.768 ± 0.130**
R. Testis Absolute 0.123 ± 0.002 0.117 ± 0.003 0.120 ± 0.002 0.131 ± 0.005 0.119 ± 0.003 0.120 ± 0.002 Relative 3.272 ± 0.095 3.068 ± 0.102 3.211 ± 0.083 3.397 ± 0.138 3.114 ± 0.065 3.783 ± 0.117**
Thymus Absolute 0.052 ± 0.003 0.048 ± 0.002 0.049 ± 0.002 0.052 ± 0.003 0.049 ± 0.002 0.038 ± 0.002** Relative 1.395 ± 0.097 1.256 ± 0.069 1.317 ± 0.063 1.349 ± 0.066 1.267 ± 0.055 1.182 ± 0.050
Female Necropsy body wt 32.8 ± 0.8 32.8 ± 0.9 31.4 ± 0.8 33.7 ± 0.5 33.0 ± 0.4 29.3 ± 0.5** Heart
Absolute 0.140 ± 0.003 0.152 ± 0.003* 0.148 ± 0.003 0.148 ± 0.002 0.156 ± 0.004** 0.140 ± 0.003 Relative 4.279 ± 0.099 4.644 ± 0.074 4.731 ± 0.139* 4.397 ± 0.091 4.733 ± 0.135* 4.782 ± 0.077**
R. Kidney Absolute 0.210 ± 0.006 0.217 ± 0.003 0.213 ± 0.005 0.214 ± 0.004 0.216 ± 0.006 0.200 ± 0.005 Relative 6.409 ± 0.165 6.661 ± 0.220 6.794 ± 0.130 6.357 ± 0.141 6.537 ± 0.125 6.826 ± 0.087
Liver Absolute 1.531 ± 0.039 1.512 ± 0.056 1.489 ± 0.043 1.499 ± 0.042 1.533 ± 0.022 1.312 ± 0.031** Relative 46.716 ± 0.855 46.059 ± 0.914 47.406 ± 0.683 44.465 ± 1.056 46.451 ± 0.618 44.794 ± 0.557
Lung Absolute 0.229 ± 0.004 0.245 ± 0.012 0.225 ± 0.006 0.234 ± 0.007 0.248 ± 0.010 0.229 ± 0.007 Relative 7.011 ± 0.204 7.504 ± 0.384 7.204 ± 0.268 6.956 ± 0.221 7.519 ± 0.327 7.832 ± 0.250
Thymus Absolute 0.055 ± 0.003 0.059 ± 0.003 0.064 ± 0.012 0.057 ± 0.002 0.054 ± 0.003 0.048 ± 0.002 Relative 1.667 ± 0.099 1.809 ± 0.117 2.021 ± 0.360 1.686 ± 0.074 1.646 ± 0.087 1.654 ± 0.048
* Significantly different (P≤0.05) from the chamber control group by Dunnett’s test ** Significantly different (P≤0.01) from the chamber control group by Williams’ or Dunnett’s test a Organ weights (absolute weights) and body weights are given in grams; organ-weight-to-body-weight ratios (relative weights) are given as
mg organ weight/g body weight (mean ± standard error).

D-6 Triethylamine, NTP TOX 78
NOT FOR ATTRIBUTION Peer Review Draft
E-1
Peer Review Draft NOT FOR ATTRIBUTION
APPENDIX E REPRODUCTIVE TISSUE EVALUATIONS
AND ESTROUS CYCLE CHARACTERIZATION
TABLE E1 Summary of Reproductive Tissue Evaluations for Male Rats in the 3-Month Inhalation Study of Triethylamine ......................................................................... E-2 TABLE E2 Estrous Cycle Characterization for Female Rats in the 3-Month Inhalation Study of Triethylamine ........................................................................ E-2 FIGURE E1 Vaginal Cytology Plots for Female Rats in the 3-Month Inhalation Study of Triethylamine ........................................................................ E-3 TABLE E3 Results of Vaginal Cytology Study Using the Transition Matrix Approach in Female Rats Administered Triethylamine by Inhalation for 3 Months .................................... E-4 TABLE E4 Summary of Reproductive Tissue Evaluations for Male Mice in the 3-Month Inhalation Study of Triethylamine ........................................................................ E-5 TABLE E5 Estrous Cycle Characterization for Female Mice in the 3-Month Inhalation Study of Triethylamine ........................................................................ E-5 FIGURE E2 Vaginal Cytology Plots for Female Mice in the 3-Month Inhalation Study of Triethylamine ........................................................................ E-6 TABLE E6 Results of Vaginal Cytology Study Using the Transition Matrix Approach in Female Mice Administered Triethylamine by Inhalation for 3 Months ................................... E-7
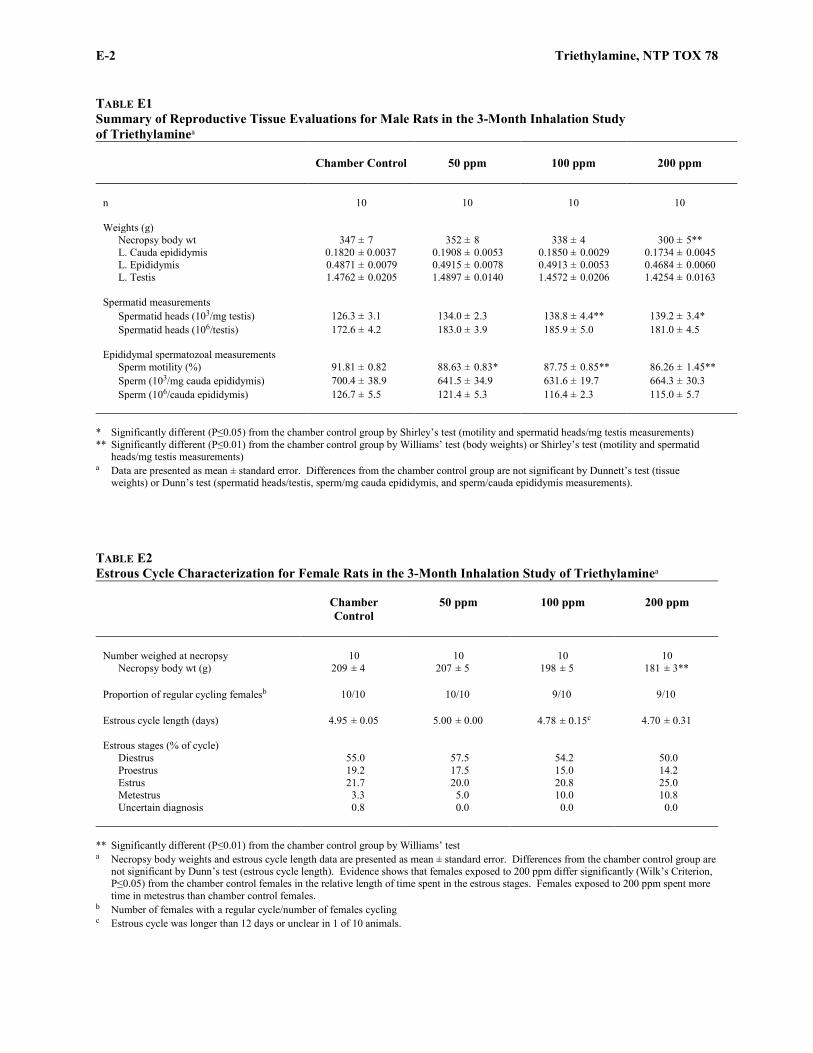
E-2 Triethylamine, NTP TOX 78
NOT FOR ATTRIBUTION Peer Review Draft
TABLE E1 Summary of Reproductive Tissue Evaluations for Male Rats in the 3-Month Inhalation Study of Triethylaminea
Chamber Control
50 ppm
100 ppm
200 ppm
n 10 10 10 10 Weights (g)
Necropsy body wt 347 ± 7 352 ± 8 338 ± 4 300 ± 5** L. Cauda epididymis 0.1820 ± 0.0037 0.1908 ± 0.0053 0.1850 ± 0.0029 0.1734 ± 0.0045 L. Epididymis 0.4871 ± 0.0079 0.4915 ± 0.0078 0.4913 ± 0.0053 0.4684 ± 0.0060 L. Testis 1.4762 ± 0.0205 1.4897 ± 0.0140 1.4572 ± 0.0206 1.4254 ± 0.0163
Spermatid measurements
Spermatid heads (103/mg testis) 126.3 ± 3.1 134.0 ± 2.3 138.8 ± 4.4** 139.2 ± 3.4* Spermatid heads (106/testis) 172.6 ± 4.2 183.0 ± 3.9 185.9 ± 5.0 181.0 ± 4.5
Epididymal spermatozoal measurements
Sperm motility (%) 91.81 ± 0.82 88.63 ± 0.83* 87.75 ± 0.85** 86.26 ± 1.45** Sperm (103/mg cauda epididymis) 700.4 ± 38.9 641.5 ± 34.9 631.6 ± 19.7 664.3 ± 30.3 Sperm (106/cauda epididymis) 126.7 ± 5.5 121.4 ± 5.3 116.4 ± 2.3 115.0 ± 5.7
* Significantly different (P≤0.05) from the chamber control group by Shirley’s test (motility and spermatid heads/mg testis measurements) ** Significantly different (P≤0.01) from the chamber control group by Williams’ test (body weights) or Shirley’s test (motility and spermatid
heads/mg testis measurements) a Data are presented as mean ± standard error. Differences from the chamber control group are not significant by Dunnett’s test (tissue
weights) or Dunn’s test (spermatid heads/testis, sperm/mg cauda epididymis, and sperm/cauda epididymis measurements).
TABLE E2 Estrous Cycle Characterization for Female Rats in the 3-Month Inhalation Study of Triethylaminea
Chamber Control
50 ppm
100 ppm
200 ppm
Number weighed at necropsy 10 10 10 10
Necropsy body wt (g) 209 ± 4 207 ± 5 198 ± 5 181 ± 3**
Proportion of regular cycling femalesb 10/10 10/10 9/10 9/10 Estrous cycle length (days) 4.95 ± 0.05 5.00 ± 0.00 4.78 ± 0.15c 4.70 ± 0.31 Estrous stages (% of cycle)
Diestrus 55.0 57.5 54.2 50.0 Proestrus 19.2 17.5 15.0 14.2 Estrus 21.7 20.0 20.8 25.0 Metestrus 3.3 5.0 10.0 10.8 Uncertain diagnosis 0.8 0.0 0.0 0.0
** Significantly different (P≤0.01) from the chamber control group by Williams’ test a Necropsy body weights and estrous cycle length data are presented as mean ± standard error. Differences from the chamber control group are
not significant by Dunn’s test (estrous cycle length). Evidence shows that females exposed to 200 ppm differ significantly (Wilk’s Criterion, P≤0.05) from the chamber control females in the relative length of time spent in the estrous stages. Females exposed to 200 ppm spent more time in metestrus than chamber control females.
b Number of females with a regular cycle/number of females cycling c Estrous cycle was longer than 12 days or unclear in 1 of 10 animals.

Triethylamine, NTP TOX 78 E-3
Peer Review Draft NOT FOR ATTRIBUTION
Concentration (ppm) Animal
0 101 D D P E D D D P E D D D 0 102 P E D D D P E D D D P E 0 103 P E D D D P E D D D P E 0 104 D P E D D D P E D D D P 0 105 E D D D P E D D D P E D 0 106 D D P E D D D P E D D D 0 107 D D P E D D D P E D D D 0 108 E D D D P E D D I P E D 0 109 E M D D E M D D P E M D 0 110 P E M D D P E D D D P E
50 701 D D P E M D D P E M D D 50 702 E E D D D P E D D D E E 50 703 D D D P E D D D P E D D 50 704 D D P E D D D P E D D D 50 705 D P E D D D P E D D D P 50 706 D P E M D D P E D D D D 50 707 D D D P E D D D E E D D 50 708 D P E M D D P E D D D P 50 709 D P E D D D P E D D D P 50 710 D D D P E M D D P E M D
100 901 D D D P E M D D E M D D 100 902 E M D D P E D D D P E M 100 903 E D D D P E D D D P E D 100 904 D P E M D D P E M D D P 100 905 E M D D P E D D D P E D 100 906 D D D E E D D D E M D D 100 907 D D D P E D D D P E D D 100 908 M D D P E M D D P E M D 100 909 P E D D D P E D D D P E 100 910 E M D D D D D D D D P E
200 1101 D E M D D P E D D D P E 200 1102 D E M D D P E D D D P E 200 1103 E M D D P E D D D E E D 200 1104 D D D P E M D D E M D D 200 1105 D D D P E M D P E M D D 200 1106 E E M D D P E D D D P E 200 1107 D P E M D D D P E M D D 200 1108 D E M D D P E D D D P E 200 1109 D D P E D E D P E D D D 200 1110 E M D D D E E M D D P E
FIGURE E1 Vaginal Cytology Plots for Female Rats in the 3-Month Inhalation Study of Triethylamine I = insufficient number of cells to determine state, D = diestrus, P = proestrus, E = estrus, M = metestrus
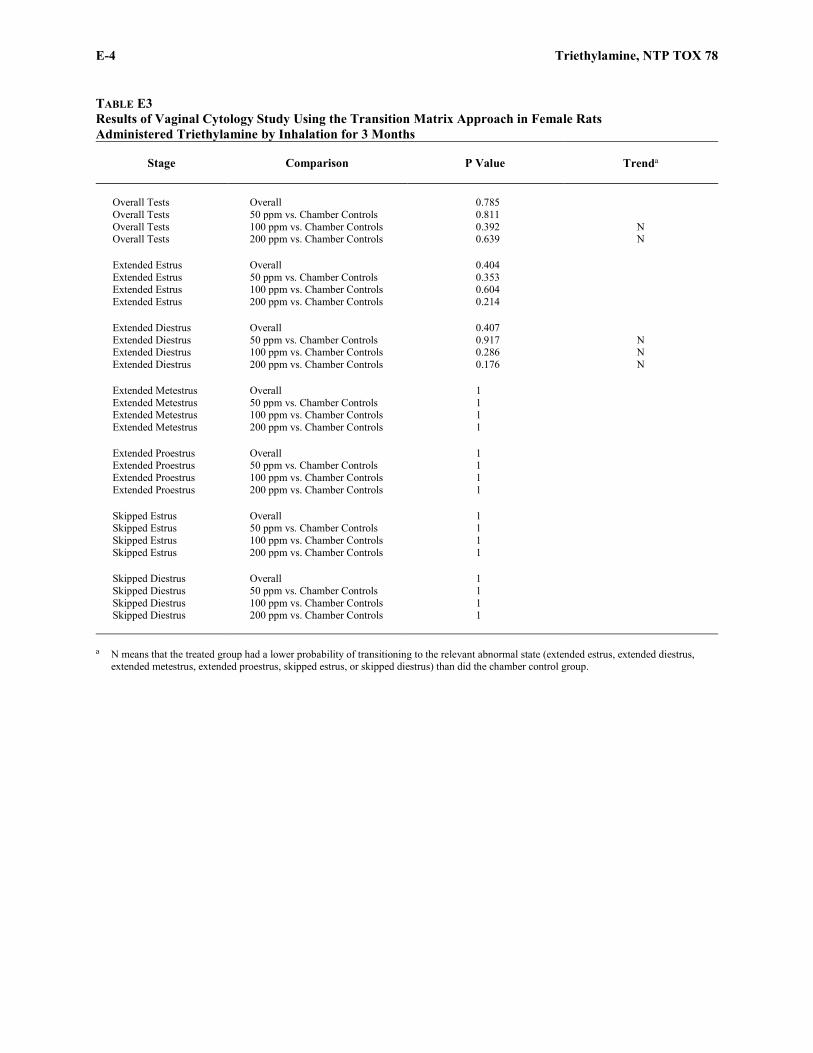
E-4 Triethylamine, NTP TOX 78
NOT FOR ATTRIBUTION Peer Review Draft
TABLE E3 Results of Vaginal Cytology Study Using the Transition Matrix Approach in Female Rats Administered Triethylamine by Inhalation for 3 Months
Stage
Comparison
P Value
Trenda
Overall Tests Overall 0.785 Overall Tests 50 ppm vs. Chamber Controls 0.811 Overall Tests 100 ppm vs. Chamber Controls 0.392 N Overall Tests 200 ppm vs. Chamber Controls 0.639 N Extended Estrus Overall 0.404 Extended Estrus 50 ppm vs. Chamber Controls 0.353 Extended Estrus 100 ppm vs. Chamber Controls 0.604 Extended Estrus 200 ppm vs. Chamber Controls 0.214 Extended Diestrus Overall 0.407 Extended Diestrus 50 ppm vs. Chamber Controls 0.917 N Extended Diestrus 100 ppm vs. Chamber Controls 0.286 N Extended Diestrus 200 ppm vs. Chamber Controls 0.176 N Extended Metestrus Overall 1 Extended Metestrus 50 ppm vs. Chamber Controls 1 Extended Metestrus 100 ppm vs. Chamber Controls 1 Extended Metestrus 200 ppm vs. Chamber Controls 1 Extended Proestrus Overall 1 Extended Proestrus 50 ppm vs. Chamber Controls 1 Extended Proestrus 100 ppm vs. Chamber Controls 1 Extended Proestrus 200 ppm vs. Chamber Controls 1 Skipped Estrus Overall 1 Skipped Estrus 50 ppm vs. Chamber Controls 1 Skipped Estrus 100 ppm vs. Chamber Controls 1 Skipped Estrus 200 ppm vs. Chamber Controls 1 Skipped Diestrus Overall 1 Skipped Diestrus 50 ppm vs. Chamber Controls 1 Skipped Diestrus 100 ppm vs. Chamber Controls 1 Skipped Diestrus 200 ppm vs. Chamber Controls 1
a N means that the treated group had a lower probability of transitioning to the relevant abnormal state (extended estrus, extended diestrus, extended metestrus, extended proestrus, skipped estrus, or skipped diestrus) than did the chamber control group.
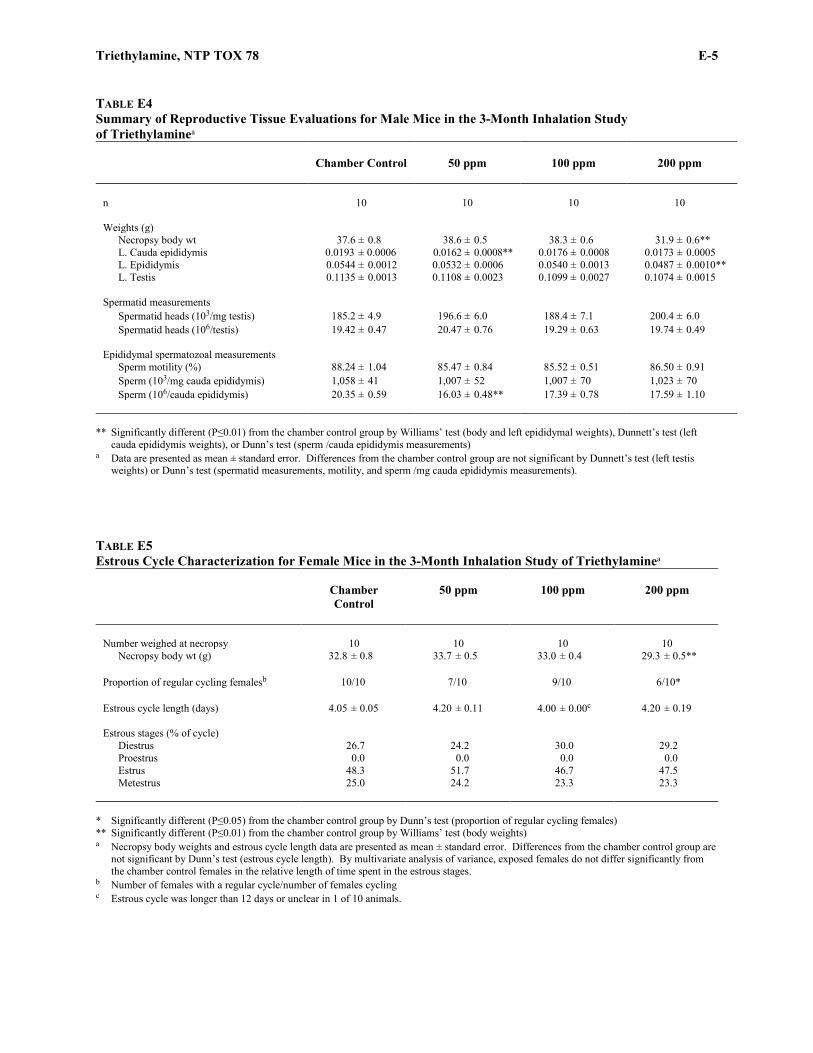
Triethylamine, NTP TOX 78 E-5
Peer Review Draft NOT FOR ATTRIBUTION
TABLE E4 Summary of Reproductive Tissue Evaluations for Male Mice in the 3-Month Inhalation Study of Triethylaminea
Chamber Control
50 ppm
100 ppm
200 ppm
n 10 10 10 10 Weights (g)
Necropsy body wt 37.6 ± 0.8 38.6 ± 0.5 38.3 ± 0.6 31.9 ± 0.6** L. Cauda epididymis 0.0193 ± 0.0006 0.0162 ± 0.0008** 0.0176 ± 0.0008 0.0173 ± 0.0005 L. Epididymis 0.0544 ± 0.0012 0.0532 ± 0.0006 0.0540 ± 0.0013 0.0487 ± 0.0010** L. Testis 0.1135 ± 0.0013 0.1108 ± 0.0023 0.1099 ± 0.0027 0.1074 ± 0.0015
Spermatid measurements
Spermatid heads (103/mg testis) 185.2 ± 4.9 196.6 ± 6.0 188.4 ± 7.1 200.4 ± 6.0 Spermatid heads (106/testis) 19.42 ± 0.47 20.47 ± 0.76 19.29 ± 0.63 19.74 ± 0.49
Epididymal spermatozoal measurements
Sperm motility (%) 88.24 ± 1.04 85.47 ± 0.84 85.52 ± 0.51 86.50 ± 0.91 Sperm (103/mg cauda epididymis) 1,058 ± 41 1,007 ± 52 1,007 ± 70 1,023 ± 70 Sperm (106/cauda epididymis) 20.35 ± 0.59 16.03 ± 0.48** 17.39 ± 0.78 17.59 ± 1.10
** Significantly different (P≤0.01) from the chamber control group by Williams’ test (body and left epididymal weights), Dunnett’s test (left cauda epididymis weights), or Dunn’s test (sperm /cauda epididymis measurements)
a Data are presented as mean ± standard error. Differences from the chamber control group are not significant by Dunnett’s test (left testis weights) or Dunn’s test (spermatid measurements, motility, and sperm /mg cauda epididymis measurements).
TABLE E5 Estrous Cycle Characterization for Female Mice in the 3-Month Inhalation Study of Triethylaminea
Chamber Control
50 ppm
100 ppm
200 ppm
Number weighed at necropsy 10 10 10 10
Necropsy body wt (g) 32.8 ± 0.8 33.7 ± 0.5 33.0 ± 0.4 29.3 ± 0.5**
Proportion of regular cycling femalesb 10/10 7/10 9/10 6/10* Estrous cycle length (days) 4.05 ± 0.05 4.20 ± 0.11 4.00 ± 0.00c 4.20 ± 0.19 Estrous stages (% of cycle)
Diestrus 26.7 24.2 30.0 29.2 Proestrus 0.0 0.0 0.0 0.0 Estrus 48.3 51.7 46.7 47.5 Metestrus 25.0 24.2 23.3 23.3
* Significantly different (P≤0.05) from the chamber control group by Dunn’s test (proportion of regular cycling females) ** Significantly different (P≤0.01) from the chamber control group by Williams’ test (body weights) a Necropsy body weights and estrous cycle length data are presented as mean ± standard error. Differences from the chamber control group are
not significant by Dunn’s test (estrous cycle length). By multivariate analysis of variance, exposed females do not differ significantly from the chamber control females in the relative length of time spent in the estrous stages.
b Number of females with a regular cycle/number of females cycling c Estrous cycle was longer than 12 days or unclear in 1 of 10 animals.

E-6 Triethylamine, NTP TOX 78
NOT FOR ATTRIBUTION Peer Review Draft
Concentration (ppm) Animal
0 101 D E E M D E E M D E E M 0 102 E M D E E M D E E M D E 0 103 M D E E M D E E M D E E 0 104 E E M D E E M D E E M D 0 105 E E M D E E M D E E M D 0 106 M D E E M D D E E M D D 0 107 D E E M D E E M D E E M 0 108 E E M D E E M D E E M D 0 109 E M D E E M D E E M D E 0 110 E E M D E E M D E E M D
50 701 D E E M D E E M D E E E 50 702 E E M D E E M D E E E M 50 703 D E E M D E E M D E E M 50 704 E E M D E E M D E E M D 50 705 M D E E M D E E M D E E 50 706 D E E M D E E M D E E M 50 707 M D E E E M D E E E M D 50 708 D E E M D E E M D E E M 50 709 E E M D E E M D E E M D 50 710 E M D E E M D E E M D E
100 901 E E M D E E M D E E M D 100 902 E M D E E M D E E M D E 100 903 E E M D E E M D E E M D 100 904 E M D E E M D E E M D E 100 905 M D E E M D E E M D E E 100 906 D E E M D E E M D E E M 100 907 E E M D E E M D E E M D 100 908 E M D E E M D E E M D E 100 909 E M D D D D D D D D D E 100 910 E M D E E M D E E M D E
200 1101 E E M D E E M D E E M D 200 1102 D D D D D D E E E M D E 200 1103 D E E M D E E M D E E M 200 1104 E M D E E M D E E M D E 200 1105 M D E E E M D E E E M D 200 1106 E M D D E E M D E E M D 200 1107 E M D E E E M D D E E M 200 1108 E M D E E E M D E E M D 200 1109 M D E E M D E E M D E E 200 1110 E M D E E M D E E M D E
FIGURE E2 Vaginal Cytology Plots for Female Mice in the 3-Month Inhalation Study of Triethylamine D = diestrus, E = estrus, M = metestrus

Triethylamine, NTP TOX 78 E-7
Peer Review Draft NOT FOR ATTRIBUTION
TABLE E6 Results of Vaginal Cytology Study Using the Transition Matrix Approach in Female Mice Administered Triethylamine by Inhalation for 3 Months
Stage
Comparison
P Value
Trenda
Overall Tests Overall 0.232 Overall Tests 50 ppm vs. Chamber Controls 0.207 Overall Tests 100 ppm vs. Chamber Controls 0.167 Overall Tests 200 ppm vs. Chamber Controls 0.508 Extended Estrus Overall 0.211 Extended Estrus 50 ppm vs. Chamber Controls 0.207 Extended Estrus 100 ppm vs. Chamber Controls 1 Extended Estrus 200 ppm vs. Chamber Controls 0.073 Extended Diestrus Overall 0.597 Extended Diestrus 50 ppm vs. Chamber Controls 1 Extended Diestrus 100 ppm vs. Chamber Controls 0.167 Extended Diestrus 200 ppm vs. Chamber Controls 0.604 Extended Metestrus Overall 1 Extended Metestrus 50 ppm vs. Chamber Controls 1 Extended Metestrus 100 ppm vs. Chamber Controls 1 Extended Metestrus 200 ppm vs. Chamber Controls 1 Extended Proestrus Overall 1 Extended Proestrus 50 ppm vs. Chamber Controls 1 Extended Proestrus 100 ppm vs. Chamber Controls 1 Extended Proestrus 200 ppm vs. Chamber Controls 1 Skipped Estrus Overall 1 Skipped Estrus 50 ppm vs. Chamber Controls 1 Skipped Estrus 100 ppm vs. Chamber Controls 1 Skipped Estrus 200 ppm vs. Chamber Controls 1 Skipped Diestrus Overall 1 Skipped Diestrus 50 ppm vs. Chamber Controls 1 Skipped Diestrus 100 ppm vs. Chamber Controls 1 Skipped Diestrus 200 ppm vs. Chamber Controls 1
a N means that the treated group had a lower probability of transitioning to the relevant abnormal state (extended estrus, extended diestrus, extended metestrus, extended proestrus, skipped estrus, or skipped diestrus) than did the chamber control group.

E-8 Triethylamine, NTP TOX 78
NOT FOR ATTRIBUTION Peer Review Draft
F-1
Peer Review Draft NOT FOR ATTRIBUTION
APPENDIX F CHEMICAL CHARACTERIZATION AND
GENERATION OF CHAMBER CONCENTRATIONS
PROCUREMENT AND CHARACTERIZATION OF TRIETHYLAMINE ............................................................................ F-2 VAPOR GENERATION AND EXPOSURE SYSTEM ....................................................................................................... F-2 VAPOR CONCENTRATION MONITORING .................................................................................................................. F-3 CHAMBER ATMOSPHERE CHARACTERIZATION ...................................................................................................... F-3 FIGURE F1 Infrared Absorption Spectrum of Triethylamine ............................................................................ F-5 FIGURE F2 Proton Nuclear Magnetic Resonance Spectrum of Triethylamine ............................................... F-6 FIGURE F3 Low Resolution Mass Spectrum of Triethylamine ......................................................................... F-7 TABLE F1 Gas Chromatography Systems Used in the Inhalation Studies of Triethylamine ........................ F-8 FIGURE F4 Schematic of the Vapor Generation and Delivery System in the Inhalation Studies of Triethylamine ...................................................................................... F-9 TABLE F2 Summary of Chamber Concentrations in the 2-Week Inhalation Studies of Triethylamine ............................................................................................................................... F-10 TABLE F3 Summary of Chamber Concentrations in the 3-Month Inhalation Studies of Triethylamine ............................................................................................................................... F-10

F-2 Triethylamine, NTP TOX 78
NOT FOR ATTRIBUTION Peer Review Draft
CHEMICAL CHARACTERIZATION AND GENERATION OF CHAMBER CONCENTRATIONS
PROCUREMENT AND CHARACTERIZATION OF TRIETHYLAMINE Triethylamine was obtained from Alkyl Amines Chemicals, Limited (Maharashtra, India) in one lot (CE/04/01) that was used in the 2-week and 3-month studies. Identity and purity analyses were conducted by the analytical chemistry laboratories at Chemir/Polytech Laboratories, Inc. (Maryland Heights, MO), Galbraith Laboratories, Inc., (Knoxville, TN), and Research Triangle Institute (RTI) (Research Triangle Park, NC), and by the study laboratory at Battelle Toxicology Northwest (Richland, WA). Reports on analyses performed in support of the triethylamine studies are on file at the National Institute of Environmental Health Sciences. Lot CE/04/01 of the chemical, a highly alkaline colorless liquid with a strong ammonia odor, was identified as triethylamine by Chemir/Polytech, Inc., and RTI using fourier transform infrared (IR) and proton nuclear magnetic resonance (NMR) spectroscopy. RTI also used gas chromatography (GC) with mass spectrometry (MS) to confirm the identification. All spectra were consistent with the literature spectra (Aldrich, 1981, 1997) and the structure of triethylamine. Representative IR, proton NMR, and mass spectra are presented in Figures F1, F2, and F3, respectively. Chemir/Polytech Laboratories, Inc. determined the moisture content of lot CE/04/01 using Karl Fischer titration. Galbraith Laboratories, Inc., measured the purity of the bulk chemical by elemental analyses. The purity of lot CE/04/01 was also determined by RTI and the study laboratory using GC with flame ionization detection (FID) by systems A and B, respectively (Table F1). For lot CE/04/01, Karl Fischer titration indicated 221 ppm water. Elemental analyses for carbon, hydrogen, and nitrogen were in agreement with the theoretical values for triethylamine. GC/FID by system A indicated one major peak and five minor impurity peaks, each with less than 0.1% of the total peak area. GC/FID by system B indicated one major peak and no impurities with areas greater than 0.1% relative to the total peak area. The overall purity of lot CE/04/01 was determined to be greater than 99%. An additional analysis was performed by the study laboratory to determine if triethylamine oxide (TEAO), a degradation product that can be found in the test chemical from reaction with oxygen, was present. The presence of TEAO was determined by controlled thermal degradation of TEAO to diethylamine (Lindegård et al., 1990) with subsequent analysis using GC/MS by system C. Results indicated that, if present, the concentration of TEAO was less than 0.1%. To ensure stability, the test chemical was stored at controlled room temperature in the original shipping containers (55-gallon metal drums). Periodic reanalyses of the bulk chemical were performed by the study laboratory during the 2-week and 3-month studies using GC/FID by system B and no degradation of the test chemical was detected.
VAPOR GENERATION AND EXPOSURE SYSTEM A diagram of the vapor generation and delivery system used in the studies is shown in Figure F4. A bulk supply of triethylamine was held in an 8-gallon stainless steel chemical reservoir and pumped through a preheater (2-week studies only) into the top of a heated glass column filled with glass beads to increase the surface area for evaporation. Heated nitrogen entering the column from below vaporized the chemical as it was conveyed out of the generator. The vapor leaving the generator entered a short vapor distribution manifold. Concentration in the manifold was determined by the chemical pump and nitrogen flow rates. The pressure in the distribution manifold was kept fixed to ensure consistent flow through the manifold and into the chambers as the flow of vapor to each chamber was adjusted. Precision metering valves controlled flow to each chamber. In addition, three-way exposure valves, mounted downstream from all metering valves directed all chemical to exhaust until the generation system was stable and exposures were ready to proceed. When the exposure started, the three-way valve was rotated to
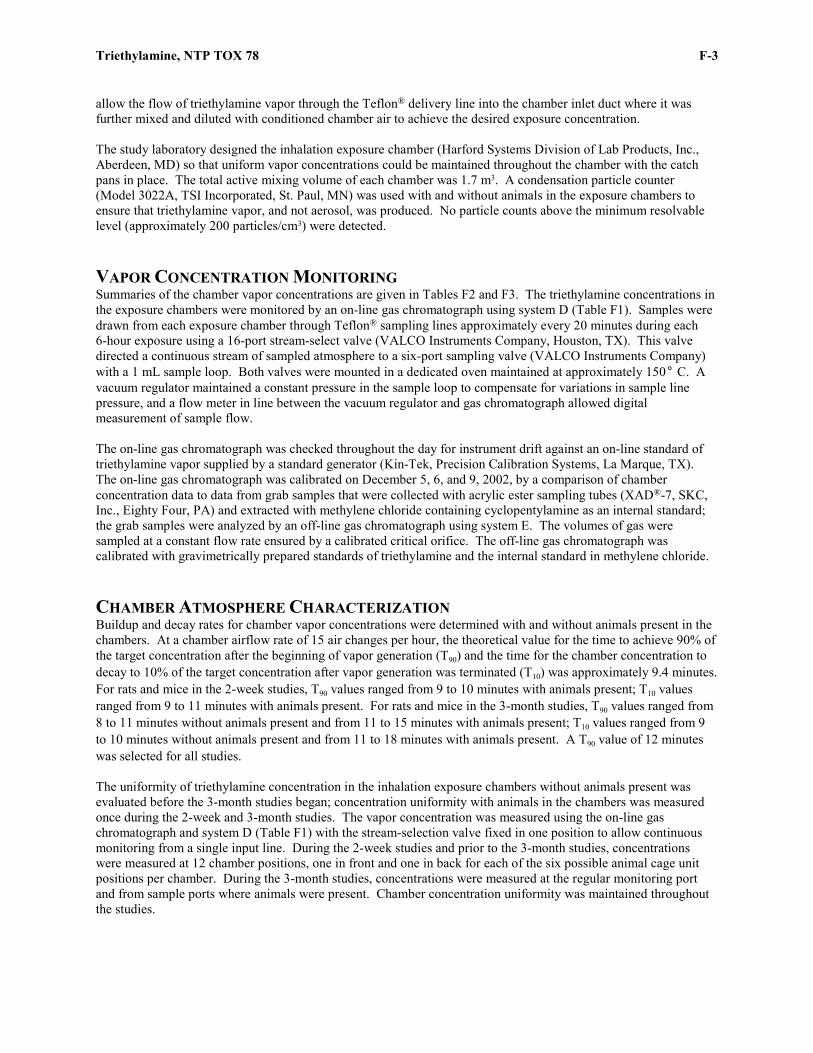
Triethylamine, NTP TOX 78 F-3
Peer Review Draft NOT FOR ATTRIBUTION
allow the flow of triethylamine vapor through the Teflon® delivery line into the chamber inlet duct where it was further mixed and diluted with conditioned chamber air to achieve the desired exposure concentration. The study laboratory designed the inhalation exposure chamber (Harford Systems Division of Lab Products, Inc., Aberdeen, MD) so that uniform vapor concentrations could be maintained throughout the chamber with the catch pans in place. The total active mixing volume of each chamber was 1.7 m3. A condensation particle counter (Model 3022A, TSI Incorporated, St. Paul, MN) was used with and without animals in the exposure chambers to ensure that triethylamine vapor, and not aerosol, was produced. No particle counts above the minimum resolvable level (approximately 200 particles/cm3) were detected.
VAPOR CONCENTRATION MONITORING Summaries of the chamber vapor concentrations are given in Tables F2 and F3. The triethylamine concentrations in the exposure chambers were monitored by an on-line gas chromatograph using system D (Table F1). Samples were drawn from each exposure chamber through Teflon® sampling lines approximately every 20 minutes during each 6-hour exposure using a 16-port stream-select valve (VALCO Instruments Company, Houston, TX). This valve directed a continuous stream of sampled atmosphere to a six-port sampling valve (VALCO Instruments Company) with a 1 mL sample loop. Both valves were mounted in a dedicated oven maintained at approximately 150° C. A vacuum regulator maintained a constant pressure in the sample loop to compensate for variations in sample line pressure, and a flow meter in line between the vacuum regulator and gas chromatograph allowed digital measurement of sample flow. The on-line gas chromatograph was checked throughout the day for instrument drift against an on-line standard of triethylamine vapor supplied by a standard generator (Kin-Tek, Precision Calibration Systems, La Marque, TX). The on-line gas chromatograph was calibrated on December 5, 6, and 9, 2002, by a comparison of chamber concentration data to data from grab samples that were collected with acrylic ester sampling tubes (XAD®-7, SKC, Inc., Eighty Four, PA) and extracted with methylene chloride containing cyclopentylamine as an internal standard; the grab samples were analyzed by an off-line gas chromatograph using system E. The volumes of gas were sampled at a constant flow rate ensured by a calibrated critical orifice. The off-line gas chromatograph was calibrated with gravimetrically prepared standards of triethylamine and the internal standard in methylene chloride.
CHAMBER ATMOSPHERE CHARACTERIZATION Buildup and decay rates for chamber vapor concentrations were determined with and without animals present in the chambers. At a chamber airflow rate of 15 air changes per hour, the theoretical value for the time to achieve 90% of the target concentration after the beginning of vapor generation (T90) and the time for the chamber concentration to decay to 10% of the target concentration after vapor generation was terminated (T10) was approximately 9.4 minutes. For rats and mice in the 2-week studies, T90 values ranged from 9 to 10 minutes with animals present; T10 values ranged from 9 to 11 minutes with animals present. For rats and mice in the 3-month studies, T90 values ranged from 8 to 11 minutes without animals present and from 11 to 15 minutes with animals present; T10 values ranged from 9 to 10 minutes without animals present and from 11 to 18 minutes with animals present. A T90 value of 12 minutes was selected for all studies. The uniformity of triethylamine concentration in the inhalation exposure chambers without animals present was evaluated before the 3-month studies began; concentration uniformity with animals in the chambers was measured once during the 2-week and 3-month studies. The vapor concentration was measured using the on-line gas chromatograph and system D (Table F1) with the stream-selection valve fixed in one position to allow continuous monitoring from a single input line. During the 2-week studies and prior to the 3-month studies, concentrations were measured at 12 chamber positions, one in front and one in back for each of the six possible animal cage unit positions per chamber. During the 3-month studies, concentrations were measured at the regular monitoring port and from sample ports where animals were present. Chamber concentration uniformity was maintained throughout the studies.
F-4 Triethylamine, NTP TOX 78
NOT FOR ATTRIBUTION Peer Review Draft
The persistence of triethylamine in the chambers after vapor delivery ended was determined by monitoring the concentration in the 1,000 ppm chambers with animals present in the 2-week studies and in the 200 ppm chambers with and without animals present in the 3-month studies. In the 2-week studies, the concentration decreased to 1% of the target concentration within 21 minutes. In the 3-month studies, the concentration decreased to 1% of the target concentration within 56 minutes with animals present and within 22 minutes without animals present. Test article stability in the distribution lines and low and high exposure concentration chambers was characterized during the 2-week and 3-month studies; characterization of the chamber test atmosphere during the first and last 2 hours of one generation day was conducted with animals present in the exposure chambers. Similar stability studies were conducted prior to the start of the 3-month studies; in these studies, exposure chamber measurements were taken from unoccupied chambers. Additional samples were collected from the generator reservoir during the 2-week studies and prior to the 3-month studies. Samples of the bulk chemical taken from the generator reservoir were diluted with methylene chloride containing diethylamine as an internal standard and analyzed by GC using system F. Samples of the test atmosphere from the distribution lines and exposure chambers were collected with XAD®-7 (SKC, Inc.) and ORBOTM-32 (Supelco Inc., Bellefonte, PA) sorbent tubes, extracted with methylene chloride, and analyzed using GC by a system similar to system B. To assess whether impurities or degradation products co-eluted with the test chemical or the solvent, a second analysis of the test atmosphere samples was performed with GC by system G using a polar column that permitted resolution of compounds with similar boiling points but small differences in polarity. Some of the samples of the test atmosphere from the distribution lines and exposure chambers in these studies contained one impurity with an area greater than 0.1% of the total peak area; the identity of this impurity was confirmed as diethylamine using GC/MS by system C. The highest concentrations of diethylamine noted in the test atmosphere samples during the 2-week studies and prior to and during the 3-month studies were 0.16%, 0.24%, and 0.34% of the total peak areas, respectively; the presence of this impurity was attributed to artifacts of sample collection or formation in the injector port. Diethylamine was shown to be present at less than 0.1% in all samples from the generator reservoir. No evidence of degradation of the test chemical was detected, and no other impurities were detected in any of the reservoir, distribution line, or exposure chamber samples. These results indicated that triethylamine was stable in the exposure system.

Triethylamine, NTP TOX 78 F-5
Peer Review Draft NOT FOR ATTRIBUTION
FIGURE F1 Infrared Absorption Spectrum of Triethylamine

F-6 Triethylamine, NTP TOX 78
NOT FOR ATTRIBUTION Peer Review Draft
FIGURE F2 Proton Nuclear Magnetic Resonance Spectrum of Triethylamine

Triethylamine, NTP TOX 78 F-7
Peer Review Draft NOT FOR ATTRIBUTION
FIGURE F3 Low Resolution Mass Spectrum of Triethylamine
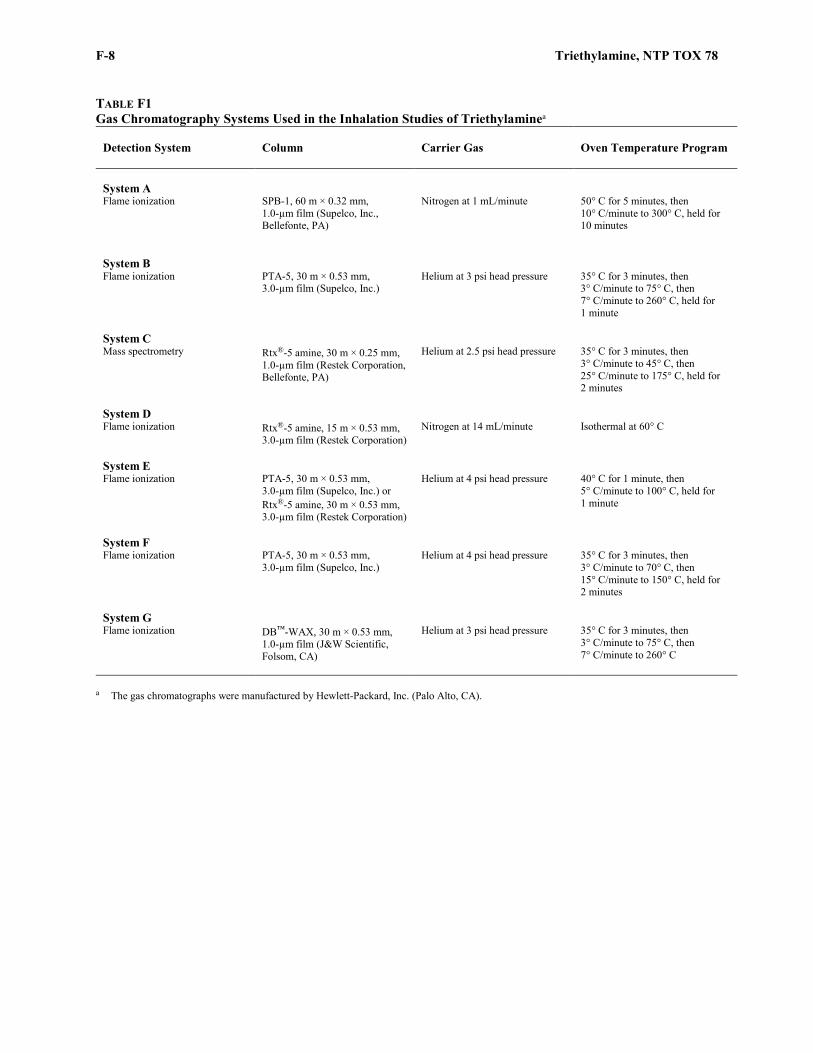
F-8 Triethylamine, NTP TOX 78
NOT FOR ATTRIBUTION Peer Review Draft
TABLE F1 Gas Chromatography Systems Used in the Inhalation Studies of Triethylaminea
Detection System
Column
Carrier Gas
Oven Temperature Program
System A Flame ionization
SPB-1, 60 m × 0.32 mm, 1.0-µm film (Supelco, Inc., Bellefonte, PA)
Nitrogen at 1 mL/minute 50° C for 5 minutes, then 10° C/minute to 300° C, held for 10 minutes
System B Flame ionization
PTA-5, 30 m × 0.53 mm, 3.0-µm film (Supelco, Inc.)
Helium at 3 psi head pressure 35° C for 3 minutes, then 3° C/minute to 75° C, then 7° C/minute to 260° C, held for 1 minute
System C Mass spectrometry
Rtx®-5 amine, 30 m × 0.25 mm, 1.0-µm film (Restek Corporation, Bellefonte, PA)
Helium at 2.5 psi head pressure 35° C for 3 minutes, then 3° C/minute to 45° C, then 25° C/minute to 175° C, held for 2 minutes
System D Flame ionization
Rtx®-5 amine, 15 m × 0.53 mm, 3.0-µm film (Restek Corporation)
Nitrogen at 14 mL/minute Isothermal at 60° C
System E Flame ionization
PTA-5, 30 m × 0.53 mm, 3.0-µm film (Supelco, Inc.) or Rtx®-5 amine, 30 m × 0.53 mm, 3.0-µm film (Restek Corporation)
Helium at 4 psi head pressure 40° C for 1 minute, then 5° C/minute to 100° C, held for 1 minute
System F Flame ionization PTA-5, 30 m × 0.53 mm,
3.0-µm film (Supelco, Inc.) Helium at 4 psi head pressure 35° C for 3 minutes, then
3° C/minute to 70° C, then 15° C/minute to 150° C, held for 2 minutes
System G Flame ionization
DB™-WAX, 30 m × 0.53 mm, 1.0-µm film (J&W Scientific, Folsom, CA)
Helium at 3 psi head pressure 35° C for 3 minutes, then 3° C/minute to 75° C, then 7° C/minute to 260° C
a The gas chromatographs were manufactured by Hewlett-Packard, Inc. (Palo Alto, CA).
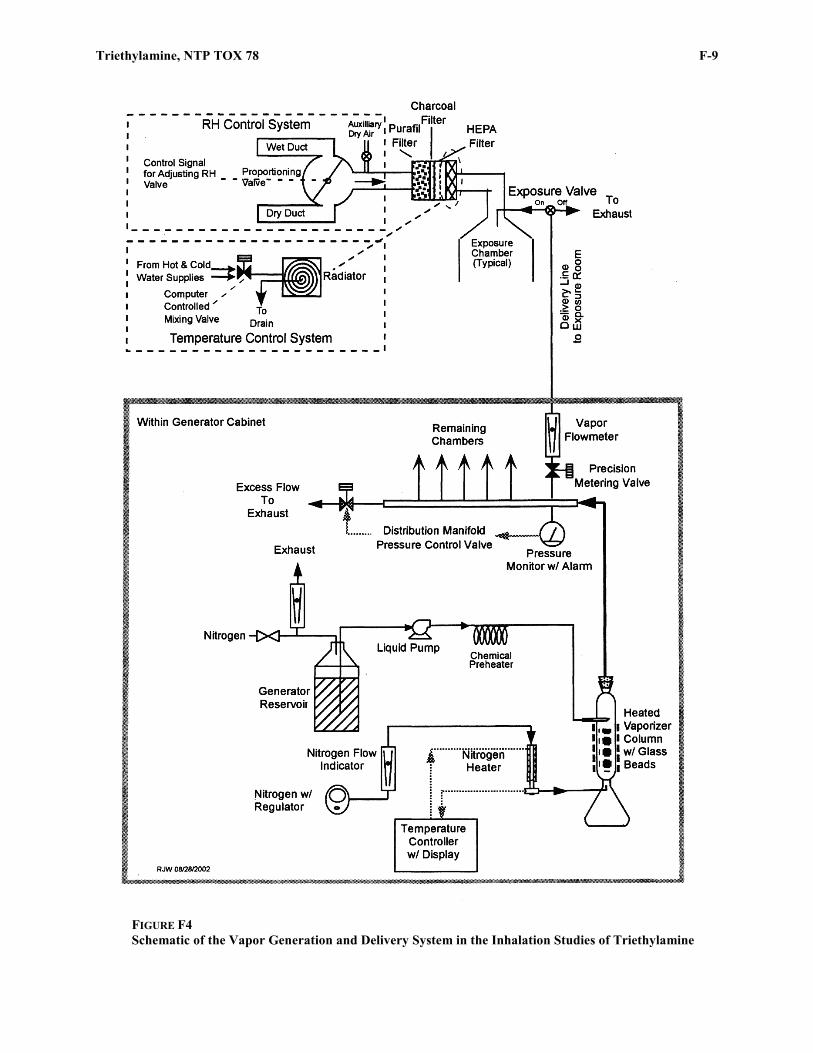
Triethylamine, NTP TOX 78 F-9
Peer Review Draft NOT FOR ATTRIBUTION
FIGURE F4 Schematic of the Vapor Generation and Delivery System in the Inhalation Studies of Triethylamine

F-10 Triethylamine, NTP TOX 78
NOT FOR ATTRIBUTION Peer Review Draft
TABLE F2 Summary of Chamber Concentrations in the 2-Week Inhalation Studies of Triethylamine
Target Concentration
(ppm)
Total Number of Readings
Average Concentrationa
(ppm)
Rat Chambers 100 218 101 ± 2 200 221 201 ± 2 400 222 399 ± 6 800 20 817 ± 5 1,000 20 1,009 ± 8 Mouse Chambers 100 237 101 ± 2 200 241 201 ± 2 400 242 400 ± 6 800 167 802 ± 14 1,000 168 988 ± 16
a Mean ± standard deviation
TABLE F3 Summary of Chamber Concentrations in the 3-Month Inhalation Studies of Triethylamine
Target Concentration
(ppm)
Total Number of Readings
Average Concentrationa
(ppm)
Rat Chambers 12.5 1,285 12.5 ± 0.3 25 1,302 25.1 ± 0.5 50 1,332 50.2 ± 0.9 100 1,332 99.9 ± 2.1 200 1,333 201 ± 4 Mouse Chambers 12.5 1,322 12.5 ± 0.3 25 1,339 25.1 ± 0.5 50 1,371 50.3 ± 0.9 100 1,372 99.9 ± 2.1 200 1,373 201 ± 4
a Mean ± standard deviation
G-1
Peer Review Draft NOT FOR ATTRIBUTION
APPENDIX G INGREDIENTS, NUTRIENT COMPOSITION,
AND CONTAMINANT LEVELS IN NTP-2000 RAT AND MOUSE RATION
TABLE G1 Ingredients of NTP-2000 Rat and Mouse Ration ........................................................................... G-2 TABLE G2 Vitamins and Minerals in NTP-2000 Rat and Mouse Ration ........................................................ G-2 TABLE G3 Nutrient Composition of NTP-2000 Rat and Mouse Ration .......................................................... G-3 TABLE G4 Contaminant Levels in NTP-2000 Rat and Mouse Ration ............................................................ G-4
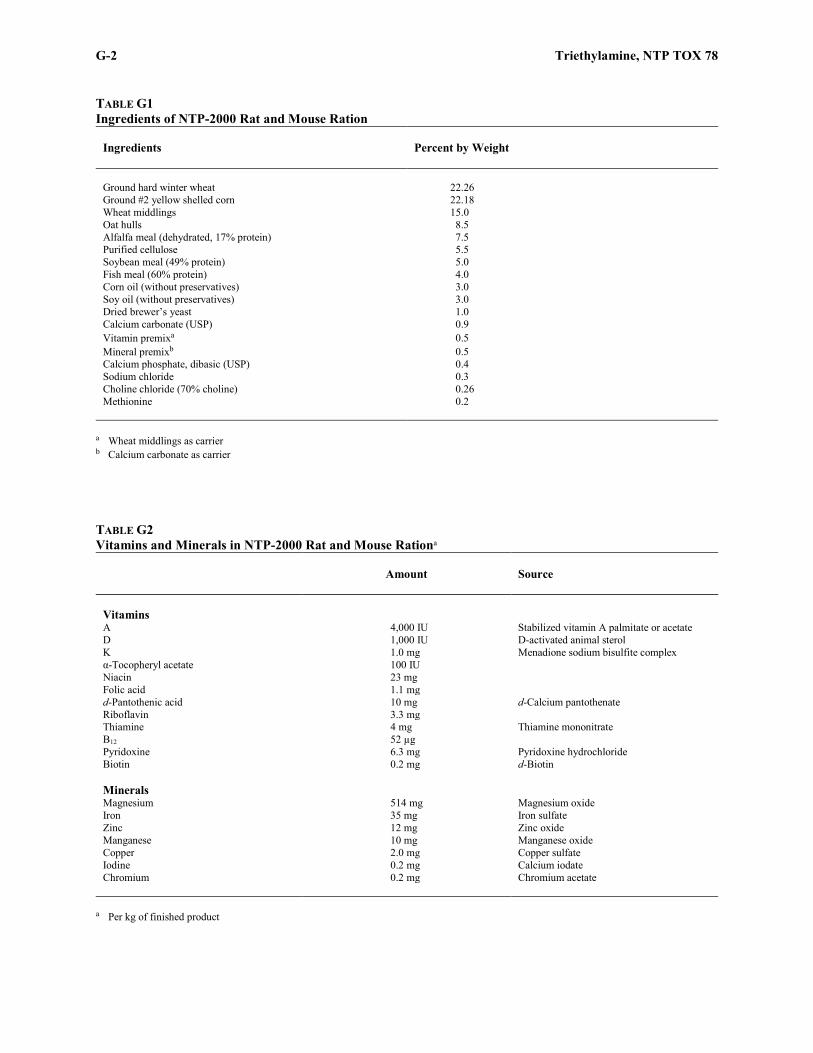
G-2 Triethylamine, NTP TOX 78
NOT FOR ATTRIBUTION Peer Review Draft
TABLE G1 Ingredients of NTP-2000 Rat and Mouse Ration
Ingredients
Percent by Weight
Ground hard winter wheat 22.26 Ground #2 yellow shelled corn 22.18 Wheat middlings 15.0 Oat hulls 8.5 Alfalfa meal (dehydrated, 17% protein) 7.5 Purified cellulose 5.5 Soybean meal (49% protein) 5.0 Fish meal (60% protein) 4.0 Corn oil (without preservatives) 3.0 Soy oil (without preservatives) 3.0 Dried brewer’s yeast 1.0 Calcium carbonate (USP) 0.9 Vitamin premixa 0.5 Mineral premixb 0.5 Calcium phosphate, dibasic (USP) 0.4 Sodium chloride 0.3 Choline chloride (70% choline) 0.26 Methionine 0.2
a Wheat middlings as carrier b Calcium carbonate as carrier
TABLE G2 Vitamins and Minerals in NTP-2000 Rat and Mouse Rationa
Amount
Source
Vitamins A 4,000 IU Stabilized vitamin A palmitate or acetate D 1,000 IU D-activated animal sterol K 1.0 mg Menadione sodium bisulfite complex α-Tocopheryl acetate 100 IU Niacin 23 mg Folic acid 1.1 mg d-Pantothenic acid 10 mg d-Calcium pantothenate Riboflavin 3.3 mg Thiamine 4 mg Thiamine mononitrate B12 52 µg Pyridoxine 6.3 mg Pyridoxine hydrochloride Biotin 0.2 mg d-Biotin Minerals Magnesium 514 mg Magnesium oxide Iron 35 mg Iron sulfate Zinc 12 mg Zinc oxide Manganese 10 mg Manganese oxide Copper 2.0 mg Copper sulfate Iodine 0.2 mg Calcium iodate Chromium 0.2 mg Chromium acetate
a Per kg of finished product
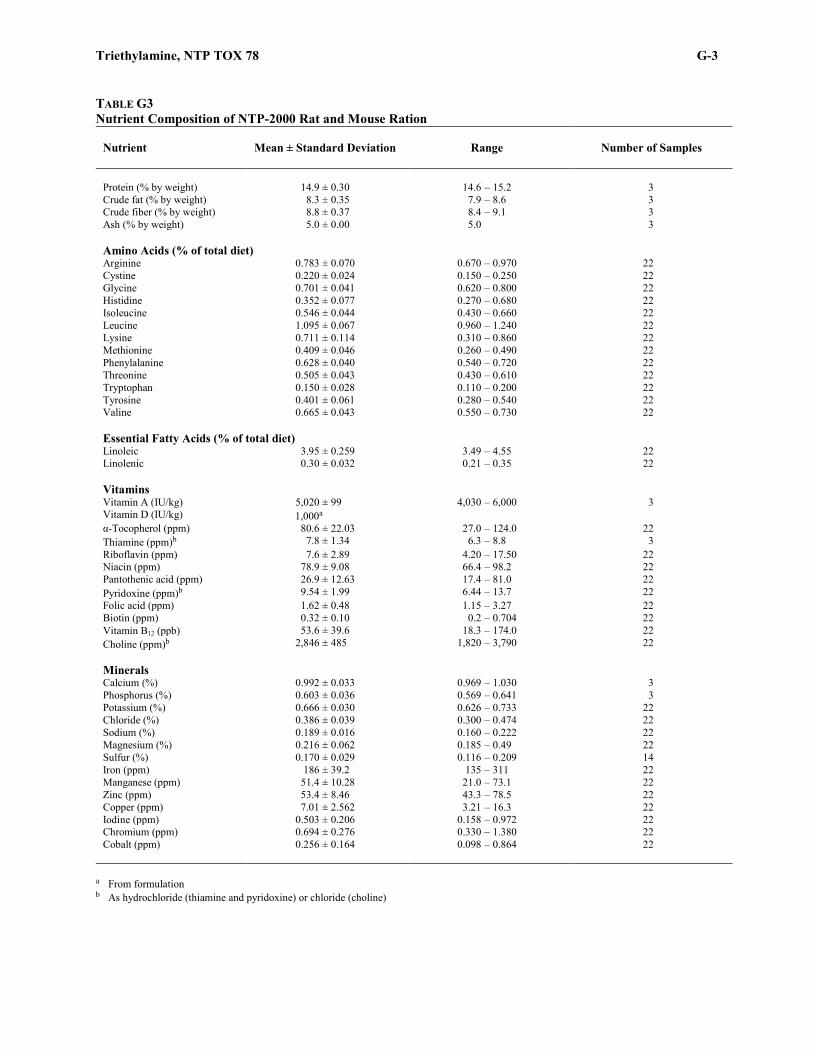
Triethylamine, NTP TOX 78 G-3
Peer Review Draft NOT FOR ATTRIBUTION
TABLE G3 Nutrient Composition of NTP-2000 Rat and Mouse Ration
Nutrient
Mean ± Standard Deviation
Range
Number of Samples
Protein (% by weight) 14.9 ± 0.30 14.6 – 15.2 3 Crude fat (% by weight) 8.3 ± 0.35 7.9 – 8.6 3 Crude fiber (% by weight) 8.8 ± 0.37 8.4 – 9.1 3 Ash (% by weight) 5.0 ± 0.00 5.0 3 Amino Acids (% of total diet) Arginine 0.783 ± 0.070 0.670 – 0.970 22 Cystine 0.220 ± 0.024 0.150 – 0.250 22 Glycine 0.701 ± 0.041 0.620 – 0.800 22 Histidine 0.352 ± 0.077 0.270 – 0.680 22 Isoleucine 0.546 ± 0.044 0.430 – 0.660 22 Leucine 1.095 ± 0.067 0.960 – 1.240 22 Lysine 0.711 ± 0.114 0.310 – 0.860 22 Methionine 0.409 ± 0.046 0.260 – 0.490 22 Phenylalanine 0.628 ± 0.040 0.540 – 0.720 22 Threonine 0.505 ± 0.043 0.430 – 0.610 22 Tryptophan 0.150 ± 0.028 0.110 – 0.200 22 Tyrosine 0.401 ± 0.061 0.280 – 0.540 22 Valine 0.665 ± 0.043 0.550 – 0.730 22 Essential Fatty Acids (% of total diet) Linoleic 3.95 ± 0.259 3.49 – 4.55 22 Linolenic 0.30 ± 0.032 0.21 – 0.35 22 Vitamins Vitamin A (IU/kg) 5,020 ± 99 4,030 – 6,000 3 Vitamin D (IU/kg) 1,000a α-Tocopherol (ppm) 80.6 ± 22.03 27.0 – 124.0 22 Thiamine (ppm)b 7.8 ± 1.34 6.3 – 8.8 3 Riboflavin (ppm) 7.6 ± 2.89 4.20 – 17.50 22 Niacin (ppm) 78.9 ± 9.08 66.4 – 98.2 22 Pantothenic acid (ppm) 26.9 ± 12.63 17.4 – 81.0 22 Pyridoxine (ppm)b 9.54 ± 1.99 6.44 – 13.7 22 Folic acid (ppm) 1.62 ± 0.48 1.15 – 3.27 22 Biotin (ppm) 0.32 ± 0.10 0.2 – 0.704 22 Vitamin B12 (ppb) 53.6 ± 39.6 18.3 – 174.0 22 Choline (ppm)b 2,846 ± 485 1,820 – 3,790 22 Minerals Calcium (%) 0.992 ± 0.033 0.969 – 1.030 3 Phosphorus (%) 0.603 ± 0.036 0.569 – 0.641 3 Potassium (%) 0.666 ± 0.030 0.626 – 0.733 22 Chloride (%) 0.386 ± 0.039 0.300 – 0.474 22 Sodium (%) 0.189 ± 0.016 0.160 – 0.222 22 Magnesium (%) 0.216 ± 0.062 0.185 – 0.49 22 Sulfur (%) 0.170 ± 0.029 0.116 – 0.209 14 Iron (ppm) 186 ± 39.2 135 – 311 22 Manganese (ppm) 51.4 ± 10.28 21.0 – 73.1 22 Zinc (ppm) 53.4 ± 8.46 43.3 – 78.5 22 Copper (ppm) 7.01 ± 2.562 3.21 – 16.3 22 Iodine (ppm) 0.503 ± 0.206 0.158 – 0.972 22 Chromium (ppm) 0.694 ± 0.276 0.330 – 1.380 22 Cobalt (ppm) 0.256 ± 0.164 0.098 – 0.864 22
a From formulation b As hydrochloride (thiamine and pyridoxine) or chloride (choline)
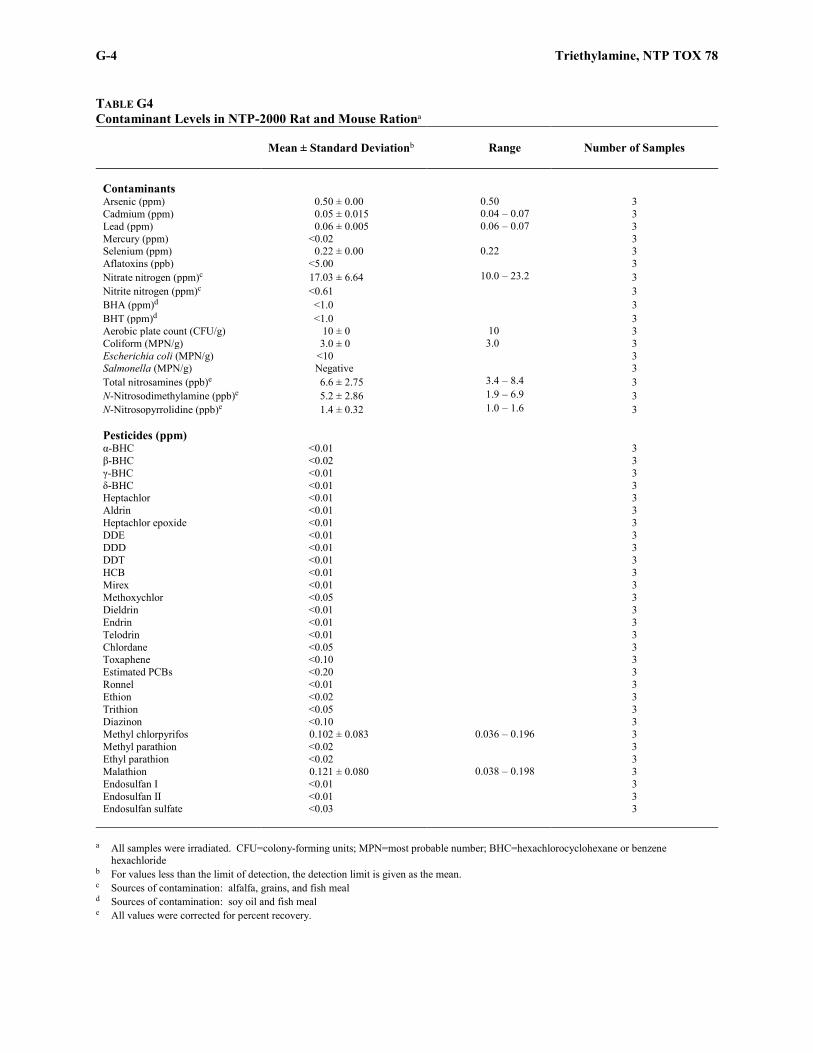
G-4 Triethylamine, NTP TOX 78
NOT FOR ATTRIBUTION Peer Review Draft
TABLE G4 Contaminant Levels in NTP-2000 Rat and Mouse Rationa
Mean ± Standard Deviationb
Range
Number of Samples
Contaminants Arsenic (ppm) 0.50 ± 0.00 0.50 3 Cadmium (ppm) 0.05 ± 0.015 0.04 – 0.07 3 Lead (ppm) 0.06 ± 0.005 0.06 – 0.07 3 Mercury (ppm) <0.02 3 Selenium (ppm) 0.22 ± 0.00 0.22 3 Aflatoxins (ppb) <5.00 3 Nitrate nitrogen (ppm)c 17.03 ± 6.64 10.0 – 23.2 3 Nitrite nitrogen (ppm)c <0.61 3 BHA (ppm)d <1.0 3 BHT (ppm)d <1.0 3 Aerobic plate count (CFU/g) 10 ± 0 10 3 Coliform (MPN/g) 3.0 ± 0 3.0 3 Escherichia coli (MPN/g) <10 3 Salmonella (MPN/g) Negative 3 Total nitrosamines (ppb)e 6.6 ± 2.75 3.4 – 8.4 3 N-Nitrosodimethylamine (ppb)e 5.2 ± 2.86 1.9 – 6.9 3 N-Nitrosopyrrolidine (ppb)e 1.4 ± 0.32 1.0 – 1.6 3 Pesticides (ppm) α-BHC <0.01 3 β-BHC <0.02 3 γ-BHC <0.01 3 δ-BHC <0.01 3 Heptachlor <0.01 3 Aldrin <0.01 3 Heptachlor epoxide <0.01 3 DDE <0.01 3 DDD <0.01 3 DDT <0.01 3 HCB <0.01 3 Mirex <0.01 3 Methoxychlor <0.05 3 Dieldrin <0.01 3 Endrin <0.01 3 Telodrin <0.01 3 Chlordane <0.05 3 Toxaphene <0.10 3 Estimated PCBs <0.20 3 Ronnel <0.01 3 Ethion <0.02 3 Trithion <0.05 3 Diazinon <0.10 3 Methyl chlorpyrifos 0.102 ± 0.083 0.036 – 0.196 3 Methyl parathion <0.02 3 Ethyl parathion <0.02 3 Malathion 0.121 ± 0.080 0.038 – 0.198 3 Endosulfan I <0.01 3 Endosulfan II <0.01 3 Endosulfan sulfate <0.03 3
a All samples were irradiated. CFU=colony-forming units; MPN=most probable number; BHC=hexachlorocyclohexane or benzene hexachloride
b For values less than the limit of detection, the detection limit is given as the mean. c Sources of contamination: alfalfa, grains, and fish meal d Sources of contamination: soy oil and fish meal e All values were corrected for percent recovery.

H-1
Peer Review Draft NOT FOR ATTRIBUTION
APPENDIX H SENTINEL ANIMAL PROGRAM
METHODS ............................................................................................................................................................. H-2 RESULTS ............................................................................................................................................................. H-3

H-2 Triethylamine, NTP TOX 78
NOT FOR ATTRIBUTION Peer Review Draft
SENTINEL ANIMAL PROGRAM
METHODS Rodents used in the Carcinogenesis Program of the National Toxicology Program are produced in optimally clean facilities to eliminate potential pathogens that may affect study results. The Sentinel Animal Program is part of the periodic monitoring of animal health that occurs during the toxicologic evaluation of chemical compounds. Under this program, the disease state of the rodents is monitored via serology on sera from extra (sentinel) animals in the study rooms. These animals and the study animals are subject to identical environmental conditions. The sentinel animals come from the same production source and weanling groups as the animals used for the studies of chemical compounds. Serum samples were collected from five male and five female chamber control rats and mice at the end of the 2-week studies. In the 3-month studies, serum samples were collected from five male and five female sentinel rats and mice at 2 weeks and from five male and five female chamber control rats and mice at study termination. Blood from each animal was collected and allowed to clot, and the serum was separated. Samples were processed appropriately, and antibody titers were determined by BioReliance Corporation (Rockville, MD). The laboratory methods and agents for which testing was performed are tabulated below; the times at which samples were collected during the studies are also listed.
Method and Test Time of Collection RATS 2-Week Study ELISA
H-1 (Toolan’s H-1 virus) Study termination KRV (Kilham rat virus) Study termination Mycoplasma pulmonis Study termination PVM (pneumonia virus of mice) Study termination RCV/SDA (rat coronavirus/sialodacryoadenitis virus) Study termination Sendai Study termination
3-Month Study ELISA
H-1 2 Weeks KRV 2 Weeks Mycoplasma arthritidis Study termination M. pulmonis 2 Weeks, study termination PVM 2 Weeks, study termination RCV/SDA 2 Weeks, study termination Sendai 2 Weeks, study termination
Immunofluorescence Assay
Parvovirus Study termination

Triethylamine, NTP TOX 78 H-3
Peer Review Draft NOT FOR ATTRIBUTION
Method and Test Time of Collection MICE 2-Week Study ELISA
MHV (mouse hepatitis virus) Study termination MVM (minute virus of mice) Study termination M. pulmonis Study termination PVM Study termination Sendai Study termination TMEV (Theiler’s mouse encephalomyelitis virus) Study termination
3-Month Study ELISA
Ectromelia virus Study termination EDIM (epizootic diarrhea of infant mice) Study termination LCM (lymphocytic choriomeningitis virus) Study termination Mouse adenoma virus Study termination MCMV (mouse cytomegalovirus) Study termination MHV 2 Weeks, study termination MVM 2 Weeks M. arthritidis Study termination M. pulmonis 2 Weeks, study termination PVM 2 Weeks, study termination Reovirus Study termination Sendai 2 Weeks, study termination TMEV 2 Weeks, study termination
Immunofluorescence Assay Parvovirus Study termination
RESULTS All test results were negative.

H-4 Triethylamine, NTP TOX 78
NOT FOR ATTRIBUTION Peer Review Draft


![Water soluble {2-[3-(diethylamino)phenoxy]ethoxy ... · compounds were characterized by using elemental analysis, UV–vis, IR, 1H NMR, 13C NMR and mass spectroscopies. The photophysical](https://static.fdocuments.net/doc/165x107/5f71d280377bf43e595d0adf/water-soluble-2-3-diethylaminophenoxyethoxy-compounds-were-characterized.jpg)
