Township of Haverford Climate Change Action Plan · 2011-06-15 · 2.1 Methodology and Model ......
96
Township of Haverford Climate Change Action Plan
Transcript of Township of Haverford Climate Change Action Plan · 2011-06-15 · 2.1 Methodology and Model ......
Township of Haverford
Climate Change Action
Plan
Haverford Township Climate Action Plan Page 2 of 96
Credits and Acknowledgements ICLEI would like to extend thanks to the following individuals who made this report possible:
Township of Haverford Board of Commissioners Tom Broido Larry Holmes Jan Marie Rushforth Steve D’Emilio James E. McGarrity Robert E. Trumbull Jeff Heilmann Mario Oliva William F. Wechsler Township of Haverford Environmental Advisory Council Alfred J. Baginski Pamela Kenney Tom Chiomento Carol McCabe Fred Floyd Thomas Morgan Matthew C. Geary Dale Yanocha
Haverford Stakeholder Committee:
Township Representatives: Larry Gentile – Township Manager Maryann DelPizzo – Human Resources Tim Denny – Assistant Township Manager Mike Giordano – Public Works Lori Hanlon-Widdop – Community Development
Rick Maclary - Information Technology Jim Marino – Fire Marshall Lt. Charles Moore – Police Department George Rementer – Finance Carl Spangler – Health Department Larry Yates – Skatium
Community Representatives: Anne Ackerman, Darby Creek Valley Assoc. Ralph Brown, Pennsylvania Electric Co. (PECO) Addie Ciannella, Haverford Township Free Library Don Dukert, Quadrangle Alex Flemming, SEPTA Rob Graff, Delaware Valley Regional Planning Commission (DVRPC) David Hartke, Keystone Green Building Initiative Karen Holm, Delaware County Planning Department
Claudia Kent, Haverford College Preston Luitweiler, P.E., Aqua Services, Inc. Joe Martin, P.E., PhD, Haverford Township School District Rebecca Ross, Delaware County Planning Department Alan Rushforth, Rushforth Solar LLC Jeff Vermeulen, Delaware County Chamber of Commerce Philip Witmer, Haverford Township Civic Council
ICLEI – Local Governments for Sustainability Kim Lundgren – U.S. Services Director, ICLEI-Local Governments for Sustainability, U.S.A. Angela Vincent - Director - ICLEI’s Northeast and Mid-Atlantic Regional Capacity Center Missy Stults – Senior Program Officer - ICLEI’s Northeast and Mid-Atlantic Regional Capacity Center Jonathan Knauer – Program Associate, ICLEI’s Northeast and Mid-Atlantic Regional Capacity Center This report was prepared by ICLEI – Local Governments for Sustainability, and made possible with support from The Commonwealth of Pennsylvania and Representative Gregory S. Vitali. The authors gratefully acknowledge the dedication of the staff of the Township of Haverford, who provided much of the insight and local knowledge necessary for the completion of this report.

Haverford Township Climate Action Plan Page 3 of 96
Table of Contents
Letter from Board of Commissioners (Forthcoming)..............................................................................6
Executive Summary ....................................................................................................................................7
1. Introduction...........................................................................................................................................15 1.1 Climate Change Science Background ...................................................................................................15 1.2 Forecasted Regional and Local Impacts................................................................................................16 1.3 The ICLEI Five-Milestone Process.......................................................................................................17 1.4 Benefits of Climate Protection to the Township of Haverford..............................................................18
2. Greenhouse Gas Emissions Inventory.................................................................................................19 2.1 Methodology and Model .......................................................................................................................19 2.2 Clean Air and Climate Protection® (CACP) Software.........................................................................20 2.3 Creating the Inventory...........................................................................................................................21 2.4 Government Inventory Summary..........................................................................................................21 2.5 Community Inventory Summary...........................................................................................................22
3. Emissions Forecast ................................................................................................................................23 3.1 Government Forecast ............................................................................................................................23 3.2 Community Forecast .............................................................................................................................23
4. Greenhouse Gas Emissions Reduction Target....................................................................................25
5. Action Planning Process .......................................................................................................................26
6. Township Operations Measures ..........................................................................................................29 6.1 Create a Municipal Green Team ...........................................................................................................30 6.2 Establish an Environmentally Preferable Purchasing Policy; Buy Energy STAR Electronics and Appliances...................................................................................................................................................31 6.3 Establish a Sustainable Parks Policy.....................................................................................................32 6.4 Establish Energy Efficiency Standards for any New Township Facilities and/or Retrofits of Existing Facilities…...………………………………………………………………………………………………33 6.5 Establish Program for Businesses/Homeowners to Register Improvements w/ Township and Receive Recognition .................................................................................................................................................34 6.6 Replace Existing Streetlights with LED Models...................................................................................35 6.7 Create an Urban Tree Planting Program ...............................................................................................36 6.8 Switch from Incandescent to Fluorescent Lighting...............................................................................38 6.9 Undertake Building Retro-Commissioning...........................................................................................39 6.10 Create a Green Fleets Program............................................................................................................40 6.11 Undertake Building Enveloping ………………………………..……………………………………41 6.12 Switch from T 12s to T 8s...................................................................................................................42 6.13 Hold Vehicle Maintenance Clinics/Driver Education for Township Employees to Improve Vehicle Efficiency. Reward Drivers Whose Vehicle Efficiency Improves.............................................................43 6.14 Install Programmable Thermostats in Township Buildings ................................................................44 6.15 Install Occupancy Sensors for Lighting……………………………………………………...............45 6.16 Install EPA EZ-GPO Computer Shut-Down Software .......................................................................46 6.17 Improve the Energy Efficiency of the Skatium...................................................................................47 6.18 Install LED Exit Signs in Township Buildings...................................................................................48
7 Community Measures............................................................................................................................49 7.1 Buildings Measures…………………………………………………………………………………..49 7.1.1 Haverford 10 Percent Challenge: Residential Energy Reduction ...............................................50

Haverford Township Climate Action Plan Page 4 of 96
7.1.1.1 Promote Renewable Energy Purchases by Homeowners/Tenants ..................................................51 7.1.1.2 Conduct a CFL Replacement Campaign.........................................................................................52 7.1.1.3 Promote Purchase of Energy STAR and Other Energy Efficient Home Appliances......................53 7.1.1.4 Educate and Promote the Unplugging of Appliances and Power Strips .........................................54 7.1.1.5 Encourage 10 Percent of Households to use Programmable Thermostats ......................................55 7.1.1.6 Meeting the 10 Percent Challenge ..................................................................................................56 7.1.2 Public Climate Change Outreach and Education Campaign.......................................................57 7.1.2.1 Conduct a Multi-Media Outreach Initiative to Publicize the 10 Percent Challenge .......................58 7.1.2.2 Conduct Educational Initiatives to Support the 10 Percent Challenge............................................59 7.1.2.3 Work with Schools to Incorporate Climate into Service Projects...................................................60 7.1.2.4 Include Climate/Energy Component in School District Curriculum ..............................................61
7.2 Community Transportation Measures..............................................................................................62 7.2.1 Improve Traffic Signal Coordination at Municipal Borders ..............................................................62 7.2.2 Promote TransitChek to Transit-Accessible Employers ....................................................................63 7.2.3 Promote Existing Regional Carpooling Programs such as Share A Ride ..........................................64 7.2.4 Enhance Pedestrian Safety and Access to Sidewalks and Bike Paths, and Review Existing Ordinances to Identify Barriers for Bike and Pedestrian Users..........................................................................................65 7.2.5 Work with Area Businesses to Promote Telecommuting ..................................................................66 7.2.6 Install Bike Racks at Key Destinations Through-out the Township ..................................................66 7.2.7 Create Zoning that Encourages Compact, Walk-able, Mixed Use Development, Promote Transit Access of Haverford Township ...............................................................................................................................67 7.2.8 Encourage Residents and Commercial Fleet Users to Consider Alternative Fuel Vehicles ..............68
7.3 Recycling and Waste Measures..........................................................................................................69 7.3.1 Encourage Home Composting of Food and Yard Waste to Reduce Demand for Curbside Pickup...69 7.3.2 Expand Recycling Programs in School Facilities ..............................................................................70 7.3.3 Increase the Number of Recycling Containers in Public Areas Around the Township .....................71 7.3.4 Expand Recycling Programs in Municipal Facilities .........................................................................72 7.3.5 Reduce Household Hazardous Waste Through Proper Recycling of Batteries and Flourescent Lights ……................……………………………………………………………………………………………..73 7.3.6 Increase Community Participation in Expanded Recycling Program ................................................73
8 Conclusion and Next Steps ....................................................................................................................74 A. Administration and Staffing ...................................................................................................................74 B. Financing and Budget.............................................................................................................................74 C. Developing a Timeline ...........................................................................................................................74 D. Public Involvement in the Implementation Process ...............................................................................74 E. Monitoring ..............................................................................................................................................75 F. Re-Inventory ...........................................................................................................................................75
Appendix A: Measure Quantification .....................................................................................................76 Township Operations: .................................................................................................................................76 Community Measures: ................................................................................................................................81 Community Transportation: ........................................................................................................................85 Community Waste & Recycling: ................................................................................................................87
Appendix B: Inventory Results………………………………………………………………………….89

Haverford Township Climate Action Plan Page 5 of 96
Haverford Township Climate Change Action Plan Quick Reference Guide Tell me about: Go to:
Overview of Haverford Township’s Action Plan
Executive Summary
Climate Change Introduction Haverford Township’s Greenhouse Gas
Emissions Inventory Emissions Inventory
Projected Future Greenhouse Gas Emissions Emissions Forecast Township’s Emissions Reduction Goal Reduction Target
Who Did This Report? Action Planning Process The Township’s Plans for Climate Protection Township Operations
What Can I Do? Meeting the 10 Percent Challenge Proposed Community Actions for Climate
Protection Community Measures

Haverford Township Climate Action Plan Page 6 of 96
Letter from Board of Commissioners
I etEI L Loca l Governments
for Sustai nabili ty

Haverford Township Climate Action Plan Page 7 of 96
Executive Summary In July 2007, Haverford Township joined an international membership association of local governments dedicated to taking action on climate protection and sustainability known as ICLEI – Local Governments for Sustainability (ICLEI). By joining ICLEI, the Township recognized the profound effect that greenhouse gases emitted by human activity are having on the Earth’s climate. As a member of ICLEI, the Township receives resources, assistance, and information to help move through the ICLEI 5-Milestone methodology for climate protection: Milestone 1: Conduct a baseline greenhouse gas emissions inventory and forecast. Milestone 2: Adopt an emissions reduction target. Milestone 3: Develop a Climate Action Plan for reducing emissions. Milestone 4: Implement policies and measures identified in your Climate Action Plan. Milestone 5: Monitor, re-evaluate, and verify results. This document signifies the completion of the third milestone in ICLEI’s Five Milestone process: creation of a Climate Action Plan. In March 2008, the Haverford Township Greenhouse Gas Inventory was completed. The Inventory cataloged all major sources of greenhouse gas emissions generated within the Township, including buildings, transportation, and waste. Community emissions sources totaled 388,906 metric tons of equivalent carbon dioxide (CO2e) in 2005. In addition to the community analysis, a detailed analysis was done of government operations, which included Township operations, fire companies, Haverford Township Free Library, and the Haverford Township School District. The inventory analysis determined that in the base year 2005, total government emissions in the Township of Haverford amounted to 15,313 metric tons CO2e. Total government energy expenditures in 2005 totaled $3,363,272. Haverford’s government emissions of 15,313 metric tons of CO2e are 3.9 percent of overall community emissions. Charts ES-1 and ES-2 depict the CO2e emissions breakdowns for the community and government sectors:

Haverford Township Climate Action Plan Page 8 of 96
The Haverford Township Climate Action Plan builds upon the findings of the Inventory and is designed to serve as a “roadmap” for how the Township of Haverford is proposing to approach its climate protection efforts. Within the pages of this document are strategies that the Township has identified as being important first steps to help reduce both government and community emissions, save money, and ensure that the Township develops in a sustainable and just manner. This document was created with substantial input from various Township and community stakeholders and measures identified within this report have been critically evaluated based on a series of decision criteria and priority areas identified by the Township. As part of the Action Planning process, Township officials decided to set an emissions reduction target. An emissions reduction target provides a tangible goal for Haverford’s emissions reduction efforts. The Township strove to choose a target that is both aggressive and achievable given local circumstances. Many factors were considered when selecting Haverford’s reduction target, including consideration of the Intergovernmental Panel on Climate Change’s 4th Assessment Report, which denoted that an 80% reduction below 1990 levels globally by 2050 would be necessary to stabilize the climate.1 Given these criteria, Haverford Township has chosen a reduction target of 30% below 2005 levels by the year 2020 for Township Operations. Aggressive pursuit of this objective will demonstrate leadership and, in conjunction with a public outreach and education campaign, will provide valuable examples to the community of steps they can take in their own homes to reduce their carbon footprint. Like the Inventory, the Climate Action Plan includes sections denoting actions specific to the government and the community. However, it is important to note that while the School District was included in the government category for the inventory, all measures listed in this Plan (and the cost savings and emissions reduction figures associated with them) apply only to Township Operations. The School District is engaged in its own ongoing energy savings efforts, primarily via the employment of an energy services company to improve the efficiency of existing buildings, as well as the construction of new, green facilities. If the School District is excluded, all other Township Operations (Township, Library, fire companies) account for approximately 33 percent of the government emissions total, or 5,034 metric tons CO2e. The Township Operations portion of the Plan contains 18 measures that address emissions reductions and energy savings in buildings, vehicles, and street lighting. The full list of Township Operations measures can be found on Table ES-3. Table ES-1, below, provides a summary of the emissions and energy savings that could be achieved from the measures denoted in the Township Operations portion of the Action Plan:
Table ES-1: Township Operations Emissions Reduction Summary CO2e Emissions in 2005: 5,034 metric tons Energy Expenses in 2005: $1,212,232
Township Operations Emissions Reduction Target:
30 percent below 2005 levels by 2020
CO2e Savings Needed to Reach Target: 1,510 metric tons CO2e Savings Projected in Action Plan: 2,550 metric tons
Annual Cost Savings Projected in Action Plan: $452,920 (2005 dollars) The 18 Township Operations measures have an aggregate estimated emissions reduction of 2,550 metric tons of CO2e when fully implemented. In order to achieve its target of reducing emissions 30 percent below 2005 levels by the year 2020, Haverford must reduce annual emissions by 1,510 metric tons CO2e. If all measures are enacted by 2020, the Township will have a comfortable margin in achieving that goal.
1 Intergovernmental Panel on Climate Change. At: http://www.ipcc.ch/.

Haverford Township Climate Action Plan Page 9 of 96
The Township has also identified a number of measures to help reduce community emissions from the building, transportation, and waste sectors. Unlike Township Operations, there is no specific reduction target associated with the community section of the Plan; rather the Plan contains a number of proposals to be considered for implementation by the municipal Green Team. Additionally, the community section of the Plan focuses on public outreach and education as a critical way of achieving substantial reductions in community emissions. A key feature of this outreach and education effort is the 10 Percent Challenge, which will encourage Township residents to reduce energy consumption in their home by at least 10 percent. This program supports easy to implement energy efficiency and conservation measures as well as the purchase of alternative energy. Other community measures include increased transit use, carpooling, zoning reform, encouraging more bicycle and pedestrian activity, and increased participation in recycling. All attempts were made to quantify, to the extent possible, forecasted emissions and energy savings achievable by the proposed measures. A full list of community measures can be found in Table ES-4. Adopting all of the measures set out in this Plan will require a persistent, systematic approach carried out over a number of years. However, there are a few steps that the Township can take immediately that will lay the groundwork for success in achieving reductions in emissions and energy use in both Township Operations and the community. Table ES-2 lists these initial steps:
Table ES-2: Recommended Initial Steps to Implement Action Plan Measure Name Description
Create a Municipal Green Team
A Municipal Green Team is a permanent committee made up of employees who are committed to energy
efficiency and who play a key role in implementing the Action Plan.
Establish a Responsible Purchasing Policy
Establishes energy efficiency, environmental sustainability, and lifecycle costs as key factors driving Township purchasing decisions on items ranging from
office paper to vehicles
Establish a Sustainable Parks Policy Goal is to reduce maintenance expenses in Township parks without sacrificing appearance and function.
Establish Energy Efficiency Standards for any New Township Facilities and/or Retrofits of
Existing Facilities
Investigate green building standards and consider passing a resolution requiring all Township buildings
adhere to energy efficiency standards The Haverford Climate Action Plan is intended to be a dynamic document. As such, the Township of Haverford should re-evaluate the measures identified within this Plan as well as how successful the Township was in implementing the identified measures, within 5 years of adoption of this Plan.

Haverford Township Climate Change Action Plan Table ES-3: Municipal Measures Implementation Matrix Target: Reduce CO2e Emissions 30 Percent Below 2005 Levels by 2020. Reduction Needed to Achieve Target: 1,510 Metric tons CO2e.
Measure Number
Measure Name Measure Status
Estimated Implementation
Cost*
Estimated Energy
Savings Per Year ($)**
Estimated Emissions Reduction Per Year (tonnes of CO2e)**
Percentage of
Reduction Target
Estimated Payback Period (Years)
Responsible Entity Term
6.1 Create Municipal Green
Team Proposed Unknown Unknown Unknown N/A Unknown Administration Short
6.2
Establish a Responsible Purchasing Policy; Buy
Energy STAR Electronics and Appliances
Proposed Marginal $21,800 124 8.21% 2 Administration,
Green Team Short
6.3 Establish a Sustainable
Parks Policy Proposed Unknown Unknown Unknown N/A Unknown
Parks and Recreation, Public
Works Short
6.4
Establish Energy Efficiency Standards for
any New Township Facilities and/or Retrofits
of Existing Facilities
Proposed
4 to 11 percent of total construction
costs, 1 to 3 percent of which are "soft costs"
25% to 30% reduction in energy costs versus non-
Efficient buildings
Unknown N/A Unknown Community
Development Short
6.5
Establish Program for Businesses/Homeowners to Register Improvements w/ Township and Receive
Recognition
Proposed Unknown Unknown Unknown N/A Unknown Green Team Short
6.6 Replace Existing Street
Lights with LED Models Proposed $1,700,000 $196,000 500 33.11% 8
Community Development,
Planning Commission,
Township Engineer
Long
6.7 Create an Urban Tree
Planting Program Proposed $254,400 N/A. 497 32.91% N/A.
Parks and Recreation, Public
Works Long
6.8 Switch from Incandescent to Fluorescent Lighting
Proposed $3-$20 per lamp $47,000 332 21.99% 1 All
Departments/Public Works
Short

Haverford Township Climate Action Plan Page 11 of 96
Measure Number Measure Name
Measure Status
Estimated Implementation
Cost*
Estimated Energy
Savings Per Year ($)**
Estimated Emissions Reduction Per Year (metric tons of
CO2e)**
Percentage of
Reduction Target
Estimated Payback Period (Years)
Responsible Entity Term
6.9 Undertake Building
Retro-Commissioning Proposed $39,500 $55,600 304 20.13% 1
Administration, Public Works,
Township Engineer Short
6.10 Create a Green Fleets
Program Proposed Unknown $39,000 230 15.23% Unknown
Public Works, Green Team
Long
6.11 Undertake Building
Enveloping Proposed Widely variable $25,400 149 9.87% Unknown
Administration, Public Works
Long
6.12 Switch from T 12s to T 8s Ongoing $20 per lamp $16,700 115 7.62% 3 Public Works Long
6.13
Hold Vehicle Maintenance
Clinics/Driver Education for Township Employees
to Improve Vehicle Efficiency. Reward
Drivers Whose Vehicle Efficiency Improves.
Proposed $2,000 to $3,000 $16,000 85 5.63% Immediate. Administration,
Human Resources Short
6.14 Install Programmable
Thermostats in Township Buildings
Ongoing $5,000-$7,000 $10,800 74 4.90% 1 Public Works Short
6.15 Install Occupancy
Sensors for Lighting Proposed $50 per sensor $10,400 72 4.77% Unknown Public Works Long
6.16 Install EPA EZ-GPO Computer Shut Down
Software Proposed $500 $7,000 39 2.58% Immediate
Information Technology
Long
6.17 Improve the Energy
Efficiency of the Skatium Proposed Unknown $6,800 27 1.79% Unknown
Administration, Parks and
Recreation, Public Works
Short
6.18 Install LED Exit Signs in
Township Buildings Proposed $50 per exit sign $420.00 2 0.13% 3 Public Works Short
* Does not include installation costs. ** Figure reflects savings once measure is fully implemented.

Haverford Township Climate Action Plan Page 12 of 96
Haverford Township Climate Change Action Plan
Table ES-4: Community Measures Implementation Matrix
Measure Number Measure Name Measure
Type
Estimated Implementation
Cost
Estimated Energy Savings Per Year
(MMBtu)
Estimated Emissions
Reduction Per Year (tonnes of
CO2e)
Estimated Payback Period (Years)
Notes
Buildings
10% Challenge Measures
7.1.1.1 Promote Renewable Energy
Purchases by Homeowners/Tenants
Buildings $388,290 None 8,430 None
Cost is based on 10% of households spending an extra
$215 annually to purchase renewables.
7.1.1.2 Run a CFL Replacement
Campaign Buildings $90,300 10,102 1,143 1
Cost is based on 10% of households installing 20
bulbs costing $50.
7.1.1.3 Promote Purchase of Energy
STAR and Other Energy Efficient Home Appliances
Buildings $45,150 to $1,806,000
9,551 1,081 Unknown
Cost is based on 10% of households spending
anywhere from $25 to $1,000 on more efficient appliances.
7.1.1.4 Educate and Promote the
Unplugging of Appliances and Power Strips
Buildings None 2,939 503 None
7.1.1.5 Utilize Programmable
Thermostats Buildings $180,600 4,890 411 1
Cost is based on 10% of households installed
thermostats costing $100.
Education and Outreach Measures
7.1.2.1
Conduct a Multi-Media Outreach Initiative to
Publisize the 10 Percent Challenge
Buildings Unknown Unknown Unknown Unknown

Haverford Township Climate Action Plan Page 13 of 96
Measure Number Measure Name Measure
Type
Estimated Implementation
Cost
Estimated Energy Savings Per Year
(MMBtu)
Estimated Emissions
Reduction Per Year (metric tons of CO2e)
Estimated Payback Period (Years)
Notes
7.1.2.2 Conduct Educational
Initiatives to Support the 10 Percent Challenge
Buildings Unknown Unknown Unknown Unknown
7.1.2.3 Work with Schools to
Incorporate Climate into Service Projects
Buildings Unknown 68 2 Unknown
7.1.2.4 Include Climate/Energy Component in School District Curriculum
Buildings Unknown Unknown Unknown Unknown
Transportation
7.2.1 Improve Traffic Signal
Coordination at Municipal Borders
Transportation Unknown $560,834 7,622 Unknown
7.2.2 Promote TransitChek to
Transit-Accessible Employers
Transportation Unknown $75,000 672 Unknown
7.2.3 Promote Existing Regional Carpooling Programs such
as Share A Ride Transportation Unknown $30,000 74 Unknown
7.2.4 Enhance Pedestrian Safety and Access to Sidewalks
and Bike Paths Transportation Unknown $6,000 15 Unknown
7.2.5 Work with Area Businesses to Promote Telecommuting
Transportation $1,000 $5,000 13 1
7.2.6 Install Bike Racks at Key
Destinations Throughout the Township
Transportation $15,000 Unknown Unknown Unknown Cost is based on 30 racks at
$500 each.
7.2.7
Create Zoning that Encourages Compact, Walk-able, Mixed Use Development, Promote
Transit Access of Haverford Township
Transportation Unknown Unknown Unknown Unknown

Haverford Township Climate Action Plan Page 14 of 96
Measure Number Measure Name Measure
Type
Estimated Implementation
Cost
Estimated Energy Savings Per Year
(MMBtu)
Estimated Emissions
Reduction Per Year (metric tons of CO2e)
Estimated Payback Period (Years)
Notes
7.2.8
Encourage Residents and Commercial Fleet Users to Consider Alternative Fuel
Vehicles
Transportation Unknown Unknown Unknown Unknown
Waste
7.3.1
Increase Yard Waste Recycling and Encourage
Home Composting of Food and Yard Waste to Reduce
Demand for Curbside Pickup
Waste Unknown Unknown 172 Unknown
7.3.2 Expand Recycling Programs
in School Facilities Waste $3,000 Unknown 61 Unknown
Cost is based on 20 containers at $150 each.
7.3.3
Increase the Number of Recycling Containers in Public Areas Around the
Township
Waste $4,500 Unknown 11 Unknown Cost is based on 30
containers at $150 each.
7.3.4 Expand Recycling Programs
in Municipal Facilities Waste $1,000 Unknown 2 Unknown
Cost is based on 20 containers at $50 each.
7.3.5
Reduce Household Hazardous Waste Through
Proper Recycling of Batteries and Compact
Florescent Lights
Waste None None None None
7.3.6 Increase Community
Participation in Expanded Recycling Program
Waste Unknown Unknown Unknown Unknown

1. Introduction 1.1 Climate Change Science Background The Earth’s atmosphere is naturally composed of a number of gases that help to trap heat from the sun, thereby keeping the Earth’s climate stable and hospitable for life. This phenomenon, known as the greenhouse effect, is the primary reason why the Earth has historically had a relatively stable global average temperature of 60 degrees Fahrenheit. Of the identified greenhouse gases, carbon dioxide (CO2) is the most prolific. Other notable greenhouse gases include methane (CH4), nitrous oxide (N2O), ozone (O3), and halocarbons. Without the natural warming effect of these gases, the average surface temperature of the Earth would be around 14 degrees Fahrenheit (Figure 1.1).
Figure 1.1: The Greenhouse Effect (Source: NACC/USGCP graphic from Union of Concerned Scientists Website) However, modern human activity, most notably the burning of fossil fuels for transportation, electricity generation, and heating and cooling, are introducing large amounts of additional carbon dioxide and other greenhouse gases into the atmosphere. Collectively, these additional gases are intensifying the natural greenhouse effect, causing global average surface temperature to rise, which in turn affects global climate patterns.
This phenomenon, known as global climate change, has been verified and researched by a number of scientific bodies, such as the Intergovernmental Panel on Climate Change (IPCC). In their latest report, the IPCC, the international community’s most respected assemblage of scientists, found that climate change is a
Haverford Township Climate Action Plan Page 16 of 96
reality and that human activities are largely responsible for increasing concentrations of global warming pollutants2. Additionally, the National Science Foundation, the National Oceanic and Atmospheric Administration, the U.S. Environmental Protection Agency, the National Aeronautic and Space Administration, the Department of Energy, and the Bush Administration have acknowledged the significant role of human activity in exacerbating climate change.
The most commonly discussed impact of climate change is an increase in temperature. According, to the National Aeronautic and Space Administration (NASA), global average surface temperatures increased during the 20th century by about 1 degree Fahrenheit, with the 1990s being the warmest decade of the century3. Additionally, the six warmest years in the recorded history, according to the Goddard Institute for Space Studies (a branch of NASA), have all occurred since 1998, and the 15 warmest years in the recorded history have all occurred since 19884.
When discussing climate change, it is important to note that the climate and the atmosphere do not react in a linear fashion to increased greenhouse gases. This means that one cannot simply predict that for each tonne of CO2 emitted from a power plant or a vehicle’s tailpipe, the Earth will warm a certain amount. This is because the Earth’s climate has a number of feedback loops and tipping points, which scientists believe will accelerate global climate change beyond the rate at which it is currently occurring. For example, as CO2
emissions have increased in recent human history, the oceans have been absorbing a significant portion of these gases. But as the oceans become more saturated, scientists anticipate they will reach maximum retention, after which they will be unable to absorb any more CO2, meaning that each tonne of anthropogenically emitted CO2 will be released directly into the atmosphere, leading to a more substantial impact on global climate patterns.5
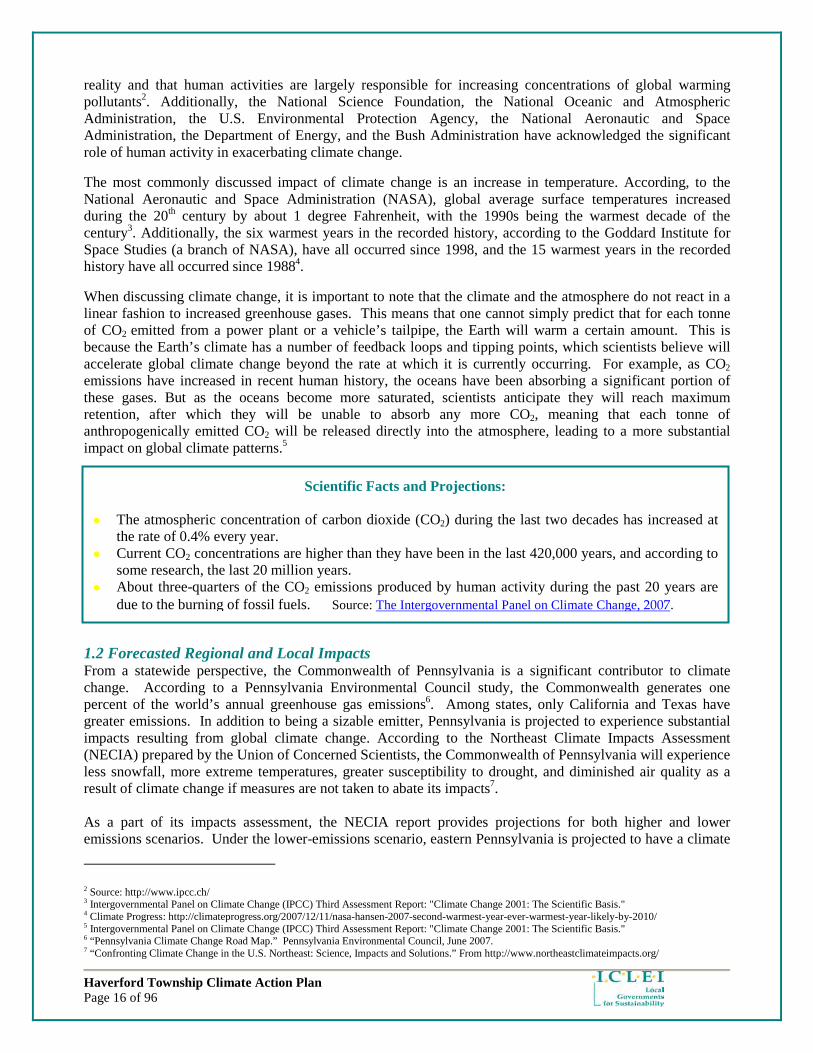
1.2 Forecasted Regional and Local Impacts From a statewide perspective, the Commonwealth of Pennsylvania is a significant contributor to climate change. According to a Pennsylvania Environmental Council study, the Commonwealth generates one percent of the world’s annual greenhouse gas emissions6. Among states, only California and Texas have greater emissions. In addition to being a sizable emitter, Pennsylvania is projected to experience substantial impacts resulting from global climate change. According to the Northeast Climate Impacts Assessment (NECIA) prepared by the Union of Concerned Scientists, the Commonwealth of Pennsylvania will experience less snowfall, more extreme temperatures, greater susceptibility to drought, and diminished air quality as a result of climate change if measures are not taken to abate its impacts7. As a part of its impacts assessment, the NECIA report provides projections for both higher and lower emissions scenarios. Under the lower-emissions scenario, eastern Pennsylvania is projected to have a climate
2 Source: http://www.ipcc.ch/ 3 Intergovernmental Panel on Climate Change (IPCC) Third Assessment Report: "Climate Change 2001: The Scientific Basis." 4 Climate Progress: http://climateprogress.org/2007/12/11/nasa-hansen-2007-second-warmest-year-ever-warmest-year-likely-by-2010/ 5 Intergovernmental Panel on Climate Change (IPCC) Third Assessment Report: "Climate Change 2001: The Scientific Basis." 6 “Pennsylvania Climate Change Road Map.” Pennsylvania Environmental Council, June 2007. 7 “Confronting Climate Change in the U.S. Northeast: Science, Impacts and Solutions.” From http://www.northeastclimateimpacts.org/
Scientific Facts and Projections: ● The atmospheric concentration of carbon dioxide (CO2) during the last two decades has increased at
the rate of 0.4% every year. ● Current CO2 concentrations are higher than they have been in the last 420,000 years, and according to
some research, the last 20 million years. ● About three-quarters of the CO2 emissions produced by human activity during the past 20 years are
due to the burning of fossil fuels. Source: The Intergovernmental Panel on Climate Change, 2007.

Haverford Township Climate Action Plan Page 17 of 96
Figures 1.2: Climate Change Forecast for Pennsylvania under a high and a low emissions scenario. Source: NECIA
more akin to southern Virginia by the end of the century, or roughly a 5 degree Fahrenheit increase in average annual temperature. Under the high emissions scenario, Pennsylvania could have a climate similar to that of southern Georgia by the end of the century. The higher-emissions scenario represents an annual average temperature increase of approximately 10 degrees Fahrenheit. Under the higher emissions scenario, the number of days in the Philadelphia area surpassing 100 degrees Fahrenheit would increase from 10 to 30 (Figure 1.2). Changes to the climate of this magnitude would have a devastating impact on the Pennsylvania environment, economy, and social structure. 1.3 The ICLEI Five-Milestone Process By joining ICLEI and committing to climate protection, the Township of Haverford has become part of an international movement of local governments committed to taking action on climate protection. More than 850 local governments, including over
470 in the United States, have joined ICLEI and committed to the Five-Milestone climate protection process. In addition to the Township of Haverford, neighboring ICLEI members include: the City of Philadelphia, the Townships of Lower Makefield, Nether Providence, Radnor, and Upper Dublin, as well as the Borough of West Chester.
ICLEI’s Five-Milestone process provides a framework for local communities to identify and reduce greenhouse gas emissions. The five Milestones are:
(1) Conduct an inventory of local greenhouse gas emissions;
(2) Establish a greenhouse gas emissions reduction target;
(3) Develop an action plan for achieving the emissions reduction target;
(4) Implement the action plan; and,
(5) Monitor and report on progress.
The ICLEI 5-Milestone Process
Milestone 1Inventory Emissions
Milestone 2
Establish Target
Milestone 3Develop Climate
Action Plan
Milestone 5Monitor/Evaluate
Progress
Milestone 4Implement Climate
Action Plan
Leadership Commitment
This report represents the completion of the third Milestone: development of a Climate Action Plan. This Action Plan provides a blueprint for the Township’s climate protection efforts by identifying measures the Township and the community can implement to reduce both energy use and greenhouse gas emissions.

Haverford Township Climate Action Plan Page 18 of 96
1.4 Benefits of Climate Protection to the Township of Haverford Acting to reduce greenhouse gas emissions and protect the climate has numerous benefits to the Haverford Township government and community, including: ● Saving taxpayer money. Actions that reduce greenhouse gas emissions cut electricity and fuel use,
thereby leading to reductions in energy costs for citizens, businesses, and institutions. ● Improving air quality and public health. In the short-term, reducing fossil fuel use means less air
pollution and fewer air quality-related public health impacts, such as asthma and other respiratory ailments. In the long-term, acting to reduce greenhouse gases decreases the likelihood of climate-related public health problems, such as the spread of heat-dependent diseases.
● Enhancing community livability. Cutting greenhouse gas emissions with measures that make Haverford Township more sustainable can reduce traffic congestion, clean the air, and contribute to more efficient homes, offices, and land use patterns. In combination, these types of measures can help build a more livable Township.
● Boosting local economy. Decreased energy costs, coupled with expansion into new services and technologies (e.g. energy efficiency and renewable energy) give local firms a competitive edge. The demand for energy efficient products and services and for new or alternative energy technologies expands local business, creates local jobs, and boosts the local economy.
● Demonstrating commitment to climate protection. By taking action on climate change, Haverford Township is making a national statement regarding its commitment to reducing the impacts of global climate change.

Haverford Township Climate Action Plan Page 19 of 96
2. Greenhouse Gas Emissions Inventory The first step toward reducing greenhouse gas emissions is to identify baseline levels and sources of emissions. ICLEI’s methodology allows local governments to systematically estimate and track greenhouse gas emissions from energy and waste related activities at the community-level and those resulting directly from municipal operations. Once completed, these inventories provide the basis for creating an emissions forecast and reduction target, and enable the quantification of emissions reductions associated with implemented and proposed measures. For Haverford Township, conducting an inventory of energy use and associated greenhouse gas emissions provided the Township with: an understanding of baseline energy performance; the comparison of alternative scenarios; an illustration of energy saving opportunities; and allowed for the monitoring and demonstration of progress towards meeting an emissions reduction goal.
2.1 Methodology and Model ICLEI’s greenhouse gas inventory methodology involves performing two analyses: a community-wide and government operations analysis. The government analysis, or inventory, is a subset of the community inventory. Included in the government analysis is energy usage and associated emissions for Township buildings, vehicles, street and traffic lights, and wastewater pumping. For the community-wide inventory, energy usage from the residential, commercial/industrial, waste, and transportation sectors are analyzed. For both the inventory of community activities and government operations, emissions sources are categorized as Key and Secondary. Key emissions sources are those sources that ICLEI considers essential components of a local greenhouse gas inventory. This determination is based on significance of the category in terms of the total emissions profile of most local governments, applicability of data to policy-relevant climate protection solutions available to local governments, and availability of data at the local government scale. In conducting Haverford’s inventory, all Key emissions categories were included. Secondary emissions sources are those that are generally challenging to gather reliable data for at a local level, and/or which are usually minimal in magnitude, such as decentralized fuel consumption (e.g., propane, kerosene, fuel oil, stationary diesel). In general, it is acceptable to rely on less specific data sources for estimating secondary emissions sources. ICLEI categorizes community emissions sources in terms of where they occur in relationship to the geographic boundaries of a place and the timescale of an inventory. There are three categories of emissions sources; Scope 1, Scope 2 and Scope 3. Table 2.1 summarizes the three categories.
Table 2.1: Emissions Source Categories Category Definition Examples
Scope 1 All direct greenhouse gas emissions Natural gas and fuel oil used for heat, gasoline burned to power
vehicles.
Scope 2
Indirect greenhouse gas emissions associated with the consumption of purchased or acquired electricity,
steam, heating, or cooling
Emissions produced by power plants in the course of electricity
generation.
Scope 3
All other indirect emissions, including emissions from up-stream processes of lifecycle/lifetime energy embodiment and process emissions
Electricity consumption at factory where a community’s
vehicles were made, energy used to transport fuel oil.

Haverford Township Climate Action Plan Page 20 of 96
Figure 2.1 provides a graphic representation of the emissions Scopes. The Haverford inventory primarily contains Key emissions sources falling within Scope 1 and Scope 2. Data
availability and other constraints necessitated the exclusion of most Secondary emissions sources and Scope 3 items. 2.2 Clean Air and Climate Protection® (CACP) Software To facilitate community efforts to reduce greenhouse gas emissions, ICLEI developed the Clean Air and Climate Protection® (CACP) software package with the organization formerly known as the State and Territorial Air Pollution Program Administrators (STAPPA), the Association of Local Air Pollution Control Officials (ALAPCO), and Torrie Smith Associates. This software calculates emissions resulting from energy consumption and waste generation. The CACP software determines emissions using specific factors (or coefficients) according to the type of fuel used. Greenhouse gas emissions are aggregated and reported in terms of carbon dioxide equivalent units, or CO2e. Converting all emissions to carbon dioxide equivalent units allows for the consideration of different greenhouse gases in comparable terms. For example, methane is twenty-one times more powerful than carbon dioxide on a per molecule basis in its capacity to trap heat, so the CACP software converts one ton of methane emissions to 21 metric tons of carbon dioxide equivalents.
The emissions coefficients and methodology employed by the CACP software are consistent with national and international inventory standards established by the Intergovernmental Panel on Climate Change (1996 Revised IPCC Guidelines for the Preparation of National Inventories) and the U.S. Voluntary Greenhouse Gas Reporting Guidelines (EIA form1605).
Over 470 cities, towns, and counties in the U.S. are using the CACP software to quantify emissions and establish policies and practices that will reduce greenhouse gas emissions. While the CACP software provides the Township of Haverford with a sophisticated and useful tool, calculating emissions from energy use with precision is difficult. Like all models, the software relies on numerous assumptions, and its accuracy is heavily dependent on the quantity and quality of data available. The CACP software is a policy tool. Emissions figures produced using the CACP software are not exact figures, but they do provide a high level of certainty for decision makers seeking alternative policies that enhance sustainability.
Figure 2.1: Emissions Scopes. Source: WRI/WBCSD GHG Protocol Corporate Accounting and Reporting Standard (Revised Edition), Chapter 4.

Haverford Township Climate Action Plan Page 21 of 96
2.3 Creating the Inventory Haverford’s greenhouse gas emissions inventory consists of two essentially distinct inventories: one for the Township of Haverford community as a whole, and one highlighting emissions resulting from the Township of Haverford’s internal government operations. The government inventory is a subset of the community-scale inventory (the two are not mutually exclusive). Creating the emissions inventory required the collection of information from a variety of sources. Data from the year 2005 was collected and used as the baseline year for both the community and government inventories.
NOTE: The government operations portion of the inventory includes emissions associated with Township operations, fire companies, the Haverford Township Free Library, and the Haverford School District. The Township chose to take an inclusive approach on the government inventory side so as simplify comparisons with other communities. 2.4 Government Inventory Summary A detailed inventory of energy use for government operations was conducted. Included in the government analysis is energy usage and associated emissions for government buildings, vehicles, street and traffic lights, and wastewater pumping. Table 2.1 below illustrates overall government operations results.
Haverford’s government inventory analysis determined that in base year 2005, total government emissions in the Township amounted to 15,313 metric tons of carbon dioxide equivalent (CO2e), the equivalent of annual energy use for 1,352 homes, or the annual emissions of 2,805 automobiles.8 Buildings represented 72.6% of emissions, the vehicle fleet comprised approximately 18.8% and street lighting accounted for 8%. Emissions attributable to wastewater pumping amounted to less than 1%. Total government energy expenditures in 2005 were $3,363,272. Haverford’s government emissions of 15,313 metric tons of CO2e represent 3.9 percent of overall community emissions. It is important to note that while the School District was included in the government category for the inventory, all measures listed in this Plan (and the cost savings and emissions reduction figures associated with them) apply only to Township Operations. As such, all further references to Township Operations refer to activities within
8 Source: http://epa.gov/cleanenergy/energy-resources/calculator.html
Table 2.1: Government Operations Emissions Summary Sector CO2e (tonnes) Energy (MMBtu) Cost ($)
Buildings 11,119 94,377 $2,349,666 Vehicle fleet 2,888 36,861 $558,310 Streetlights 1,223 8,203 $434,945
Water/Sewage pumping 83 555 $20,351 Total 15,313 139,994 $3,363,272
Haverford Township Climate Action Plan Page 22 of 96
the Township, fire departments, and the Haverford Free Library. The reason for excluding the School District from the Action Plan is that they are currently engaged in their own ongoing energy saving efforts, primarily via the employment of an energy services company to improve the efficiency of existing buildings, as well as the construction of new, green facilities. Emissions generated from Township Operations account for approximately 36 percent of the government emissions total and are detailed in Table 2.2 below.
Table 2.2: Township Operations Emissions Summary
Sector CO2e (metric
tons) Energy (MMBtu) Cost ($)
Buildings 2,028 18,827 $441,258 Vehicle fleet 1,692 21,453 $315,688 Streetlights 1,223 8,203 $434,935
Water/Sewage pumping 83 555 $20,351 Total 5,037 49,128 $1,212,232
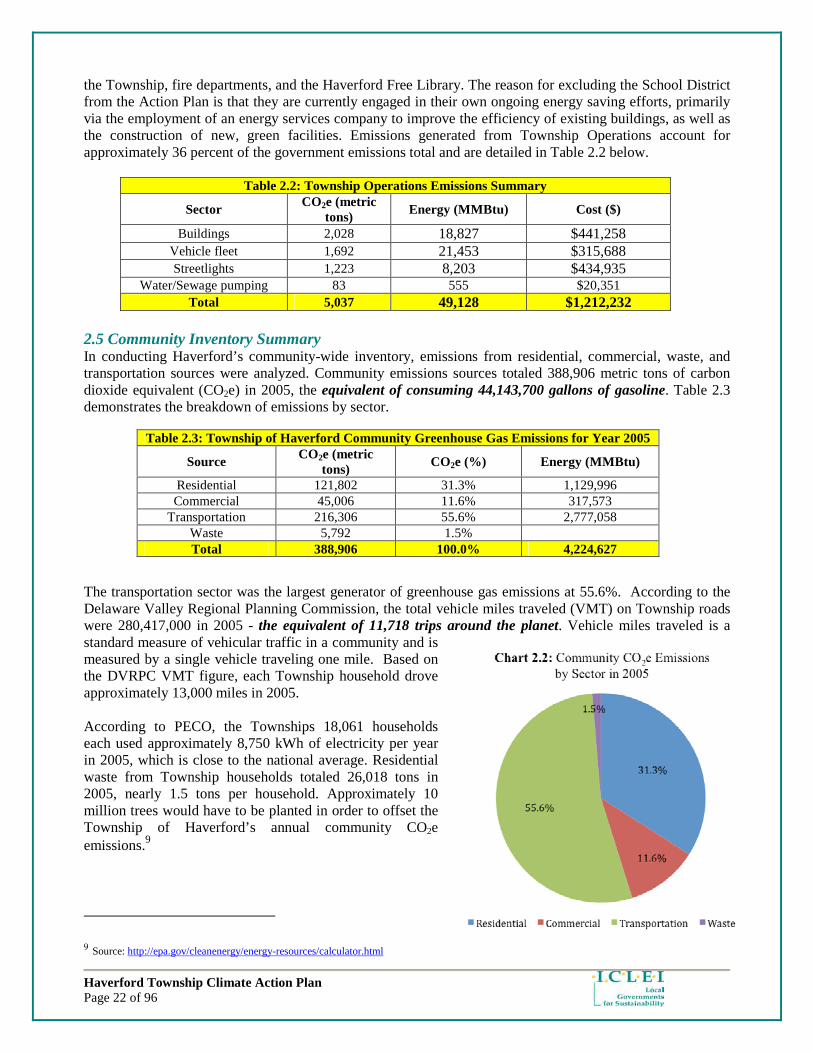
2.5 Community Inventory Summary In conducting Haverford’s community-wide inventory, emissions from residential, commercial, waste, and transportation sources were analyzed. Community emissions sources totaled 388,906 metric tons of carbon dioxide equivalent (CO2e) in 2005, the equivalent of consuming 44,143,700 gallons of gasoline. Table 2.3 demonstrates the breakdown of emissions by sector. The transportation sector was the largest generator of greenhouse gas emissions at 55.6%. According to the Delaware Valley Regional Planning Commission, the total vehicle miles traveled (VMT) on Township roads were 280,417,000 in 2005 - the equivalent of 11,718 trips around the planet. Vehicle miles traveled is a standard measure of vehicular traffic in a community and is measured by a single vehicle traveling one mile. Based on the DVRPC VMT figure, each Township household drove approximately 13,000 miles in 2005. According to PECO, the Townships 18,061 households each used approximately 8,750 kWh of electricity per year in 2005, which is close to the national average. Residential waste from Township households totaled 26,018 tons in 2005, nearly 1.5 tons per household. Approximately 10 million trees would have to be planted in order to offset the Township of Haverford’s annual community CO2e emissions.9
9 Source: http://epa.gov/cleanenergy/energy-resources/calculator.html
Table 2.3: Township of Haverford Community Greenhouse Gas Emissions for Year 2005
Source CO2e (metric
tons) CO2e (%) Energy (MMBtu)
Residential 121,802 31.3% 1,129,996 Commercial 45,006 11.6% 317,573
Transportation 216,306 55.6% 2,777,058 Waste 5,792 1.5% Total 388,906 100.0% 4,224,627

Haverford Township Climate Action Plan Page 23 of 96
3. Emissions Forecast 3.1 Government Forecast To provide an estimate of future emissions under a business as usual trajectory, a forecast was conducted for year 2020. For government operations, including the School District, it is assumed that no substantial increase in energy use will take place. On the School District side, a new, marginally larger Manoa Elementary is being built to replace the existing school. The School District has indicated that the new building will be as energy efficient as possible within budgetary constraints. For the Township, it is possible that new facilities may be constructed, such as a library or community facilities at Haverford Reserve. But as of now there are no specific plans to be factored into the forecast. As such, emissions in 2020 are forecasted to be 15,685 metric tons CO2e. Table 3.1 shows the projected difference between 2005 and 2020 government emissions.
Table 3.1: Government Forecast Comparison – 2005 and 2020 Sector CO2e (metric tons): 2005 CO2e (metric tons): 2020 Percent Change
Buildings 11,119 11,445 +2.85% Vehicle fleet 2,888 2,886 -.07% Streetlights 1,223 1,268 +3.55%
Water/Sewage 83 86 +3.49% Total 15,313 15,685 +2.37%
The forecast projects an approximate increase of 372 metric tons CO2e from 2005 to 2020 as a result of government operations, or an increase of 2.37%. Of these, 326 metric tons are forecast to come from increased building emissions, 45 metric tons from street light emissions, and 3 from water/sewer emissions. Vehicle emissions are projected to fall by 2 metric tons. Table 3.2 shows the projected difference between 2005 and 2020 emissions solely for Township Operations (excluding School District):
Table 3.2: Township Operations Forecast Comparison – 2005 and 2020 Sector CO2e (metric tons): 2005 CO2e (metric tons): 2020 Percent Change
Buildings 2,028 2,090 3.06% Vehicle fleet 1,692 1,691 -0.11% Streetlights 1,223 1,268 3.77%
Water/Sewage 83 86 4.40% Total 5,037 5,148 2.19%
The forecast projects an approximate increase of 111 metric tons CO2e from 2005 to 2020 as a result of Township operations, or an increase of 2.19%. Of these, 62 metric tons are forecast to come from increased building emissions, 45 metric tons from street light emissions, and 3 from water/sewer emissions. Vehicle emissions are projected to fall by 1 metric ton. The forecast assumes no emissions reduction measures are undertaken. 3.2 Community Forecast For the entire Haverford Township community, CO2e emissions are projected to increase from 2005 levels of 388,906 metric tons to a 2020 level of 562,831 metric tons. This represents an increase of 30.9 percent over 2005 levels. Table 3.3 shows the projected difference between 2005 and 2020 community emissions.
Table 3.3: Community Forecast Comparison – 2005 and 2020 Sector CO2e (metric tons): 2005 CO2e (metric tons): 2020 Percent Change
Residential 121,802 234,181 +47.99% Commercial 45,006 62,561 +28.06%

Haverford Township Climate Action Plan Page 24 of 96
Transportation 216,306 260,297 +16.90% Waste 5,792 5,792 0% Total 388,906 562,831 +30.90%
The community forecast is based on growth factors from the Energy Information Administration’s (EIA) 2007 Annual Energy Outlook.10 The EIA forecasts that residential electricity consumption will increase an average of 1.3 percent annually, natural gas use is projected to increase 0.4 percent annually, and fuel oil usage is projected to decline slightly.
There are multiple factors that lead to increased residential energy use, even in a largely built out community such as Haverford. The continued proliferation of appliances and electronic devices is one factor. Many of the devices drawing power in today’s homes were not in widespread use as recently as ten years ago. Furthermore, factors such as additions to existing homes, air conditioning retrofits, and new construction all contribute to increases in energy use.
The EIA forecasts commercial electricity usage will increase at an annual average of 2 percent, natural gas at 1.3 percent, and fuel oil at 0.2 percent. The greater increase in commercial usage is reflective of a transition to a more energy intensive, service-oriented economy with growth in industries such as healthcare.
Energy use in the transportation sector is projected by the EIA to grow at a 1.4 percent annual average. Nationally, vehicle miles traveled (VMT) have increased at a rate that exceeds the population growth. Pennsylvania has the second worst ratio of VMT growth to population growth in the nation – only Iowa has worse.
No growth was projected for the waste sector. This was confirmed by an analysis of trash tonnage figures for Haverford Township done by the Delaware County Solid Waste Authority, which revealed no significant change in tonnage from 2000 to 2007.
10 Energy Information Administration At: tonto.eia.doe.gov/ftproot/forecasting/0383(2007).pdf
Haverford Township Climate Action Plan Page 25 of 96
4. Greenhouse Gas Emissions Reduction Target Many factors were considered when selecting Haverford’s greenhouse gas reduction target. The Township strove to choose a target that was both aggressive and achievable given local circumstances. Additionally, the Township felt it was important to set a Township Operations emission reduction target, and demonstrate progress towards achieving that target, prior to setting a community emissions reduction target.
To help gauge a decision surrounding an appropriate emissions reduction target, the Township took into consideration the IPCC’s 4th Assessment Report, which denoted that an 80% reduction below 1990 levels globally will be necessary to stabilize the climate.11
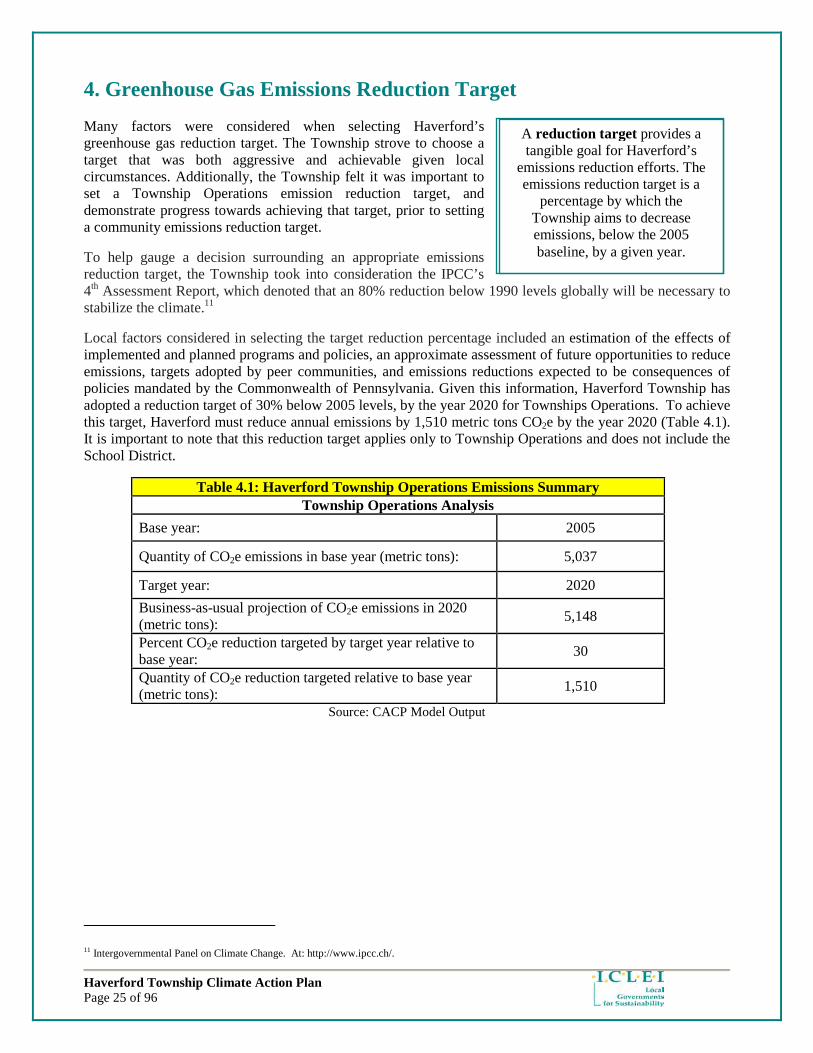
Local factors considered in selecting the target reduction percentage included an estimation of the effects of implemented and planned programs and policies, an approximate assessment of future opportunities to reduce emissions, targets adopted by peer communities, and emissions reductions expected to be consequences of policies mandated by the Commonwealth of Pennsylvania. Given this information, Haverford Township has adopted a reduction target of 30% below 2005 levels, by the year 2020 for Townships Operations. To achieve this target, Haverford must reduce annual emissions by 1,510 metric tons CO2e by the year 2020 (Table 4.1). It is important to note that this reduction target applies only to Township Operations and does not include the School District.
Table 4.1: Haverford Township Operations Emissions Summary Township Operations Analysis
Base year: 2005
Quantity of CO2e emissions in base year (metric tons): 5,037
Target year: 2020
Business-as-usual projection of CO2e emissions in 2020 (metric tons):
5,148
Percent CO2e reduction targeted by target year relative to base year:
30
Quantity of CO2e reduction targeted relative to base year (metric tons):
1,510
Source: CACP Model Output
11 Intergovernmental Panel on Climate Change. At: http://www.ipcc.ch/.
A reduction target provides a tangible goal for Haverford’s
emissions reduction efforts. The emissions reduction target is a
percentage by which the Township aims to decrease emissions, below the 2005 baseline, by a given year.

Haverford Township Climate Action Plan Page 26 of 96
School District of Haverford Township
Sustainable Energy Goals
The following goals have been set out by the School Board as a path towards making the District’s operations more efficient, cost effective and sustainable:
1. All school district facilities over the next five years will be under a facilities management contract to manage and operate the HVAC systems so they are used in the most efficient way possible. Several electrical and pneumatic systems are in operation; all will be converted to Johnson Controls, Inc.
2. By 2012, 75 percent of facilities will be fully renovated with new heating, cooling and electrical sensor systems featuring:
a. Heat recovery and other energy saving design systems. b. Dual fuel capability – natural gas or fuel oil in all schools. c. All construction waste management consistent with state recycling obligations. d. Installation of occupancy sensors and other lighting control devices.
3. District transportation software, Advanced Route Software, will maintain and create time and fuel-
efficient routes as costs increase and needs change depending on population and the locations and number of schools that change yearly.
4. The district fleet of trucks and buses will as the replacement schedule allows be swapped out for more fuel-efficient vehicles. When grant money is made available to make up the difference for the cost of hybrids ($300,000 per bus versus $46,500) we will match our needs to those that are available to the district.
5. We will continue as costs permit to use biodiesel and other fuel(s) that are made available to school
districts. We will continue to assist the township fleet through our joint purchasing and fuel initiatives.
6. Electric heaters will continue to be provided on our buses allowing our no idling policy to continue.
7. PTO’s will be encouraged to support with their membership walking to school initiatives when appropriate and along safe routes.
8. Our recycling efforts will increase with food service using recyclable cardboard platters and limit the
use of plastic where cost effective.
9. Highlight and continue to “green” the curriculum where science, social studies, and math merge. Continue to develop with Bryn Mawr College the environmental course sequence at our high school as a capstone to the continued integration of environmental and sustainable science throughout the curriculum.
10. Install solar panels and/or other energy producing devices as best fit our needs and as grants or state
funding allows us to pursue within our financial resources.

Haverford Township Climate Action Plan Page 27 of 96
5. Action Planning Process
Haverford Township undertook a thorough process to decide which measures to include in the Township’s Action Plan. There were two working groups who were responsible for developing the measures in this Plan: a municipal group and a community group. The municipal group consisted of the Township Manager and all Department Directors and worked on the Government section of the Plan. The community group consisted of the Township’s Environmental Advisory Council, the Board of Commissioners, representatives of community civic groups, community institutions, County government, business leaders, utilities, and regional agencies – this group developed the Community section of the Action Plan. The community group had three subcommittees focusing on buildings, transportation, and waste.
Each group (municipal and community) met four times while developing measures for the Action Plan. The first meeting was conducted to brainstorm all possible measures to include in both the Government and Community portions of the Plan. For the second meeting, ICLEI had compiled the ideas from the initial brainstorming session, and provided examples from other communities’ action plans where similar measures had been proposed. This allowed the group to begin a discussion of which measures stood a good chance of succeeding and how Haverford might go about implementing some of the ideas listed. At the third meeting the groups reviewed a list of decision criteria that ICLEI developed to help the stakeholders identify which measures to include in the Climate Action Plan. Table 5.1 shows the Decision Criteria for the project:
Table 5.1: Climate Change Action Plan Decision Criteria Criteria Definition Viability Is the proposed action financially, technologically, and politically viable? Cost Effectiveness Are the costs and benefits equitable and reasonable?
Implement-ability Is there a readiness to implement and are potential barriers to implementation capable of being overcome?
Consistency With Goals Does the proposed action contribute to short – and long-term reduction goals? Is there a cumulative impact over time? Does it achieve our goal in an effective manner?
Engaging Does the measure involve multiple sectors and can public education or publicity be tied into measure?
Timeliness Can measure be started and mostly implemented before 2020? Following these meetings the potential measures selected by the groups were quantified, to the extent possible, and a prioritization sheet listing all measures was sent to the groups. The prioritization sheet
The April Stakeholder meeting.
Township staff at a May meeting.

Haverford Township Climate Action Plan Page 28 of 96
contained the decision criteria, and group members were asked to rank the measures based on the criteria. ICLEI compiled the rankings, and the measures with the highest average score were selected for inclusion in the Draft Action Plan. Initially, ICLEI showed the top 15 measures for Government Operations, top 10 for Transportation and Buildings, and the top 5 in Waste. During the final group meetings, the stakeholders reviewed the rankings and adjustments were made to reflect priorities and to streamline the selections. Ultimately, the Action Plan was written to include 18 Government Operations, 10 Building, 8 Transportation, and 6 Waste measures.
I etEI L Loca l Governments
for Sustai nabili ty

Haverford Township Climate Action Plan Page 29 of 96
6. Township Operations Measures
Emissions generated from Township Operations account for approximately 36 percent of the government emissions total, the remainder of which was generated by the School District. It is important to note that while the School District was included in the government category for the inventory, all measures below (and the cost savings and emissions reduction figures associated with them) apply only to Township Operations, including the Township, Library, and fire companies. The School District is engaged in its own ongoing efforts, primarily via the employment of an energy services company to improve the efficiency of existing buildings, as well as the construction of new, green facilities (for more information on School District efforts, please see Section 4. Based on the Township’s greenhouse gas emissions reduction target, the distribution of existing priorities and resources, the identified decision criteria, and the potential costs and benefits of various potential reduction projects, Haverford Township has identified 18 emissions reduction measures to pursue.
The measures outlined below have a total estimated emissions reduction of 2,550 metric tons of CO2e when fully implemented. In order to achieve its target of reducing emissions 30 percent below 2005 levels by the year 2020, Haverford must reduce annual emissions by 1,510 metric tons CO2e. If all measures denoted below are enacted by 2020, the Township will have a comfortable margin in achieving that goal. The order of the measures listed below has significance. Measures 6.1 through 6.5 are measures that deal with assigning staff responsibility and the initiation of new policy. These five measures establish the infrastructure needed to carry out the remainder of the Plan. By implementing these measures first, the Township will ensure that roles and responsibilities for the implementation of other measures are clearly defined, and that effective mechanisms are in place to conduct public outreach and education. From these measures follow measures 6.6 through 6.18, which involve upgrading or replacing of building components or systems, vehicles, and other Township areas of operation. Measures 6.6 through 6.18 are listed from highest to lowest according to estimated emissions reductions achievable once the measure has been fully implemented.

Haverford Township Climate Action Plan Page 30 of 96
Members of the Haverford Stakeholder group.
6.1 Create a Municipal Green Team
Measure Status:
Estimated Implementation
Cost:
Estimated Cost Savings Per
Year:
Estimated Emissions Reduction Per Year:
Estimated Payback Period:
Responsible Entity:
Term:
Proposed Unknown Unknown Unknown Unknown Administration Short A Municipal Green Team is a permanent committee made up of employees who are committed to energy efficiency and who have a key role in implementing the Township’s Action Plan. The proposed Haverford Township Green Team would have several main areas of responsibility: ● Develop policies and priorities for the Township; ● Coordinate energy saving work across departments; ● Oversee the 10 Percent Challenge; ● Conduct outreach to citizen groups and help develop
community programs; ● Develop Township policies to guide purchasing
decisions, construction practices, waste management, vehicle use, and other activities with the aim of reducing energy use, vehicle miles traveled, fuel consumption, and waste disposal;
● Develop a mechanism to inform Township employees about climate protection activities and resources and a recognition program for outstanding employee efforts;
● Work with the School District to incorporate environmental principles into the curriculum at all levels and to develop student projects that help carry out some of the actions in the Plan.
Implementation: This measure is targeted for short-term implementation, which means that the measure would be fully enacted prior to 2012. The establishment of a municipal Green Team ideally would be the first step taken upon adoption of this Climate Action Plan, as the Green Team will play a key role in the implementation of this Plan. A staff member should be designated to lead the Green Team, and a representative from each Department appointed to serve on the Green Team. Each member of the Green Team should have an area of responsibility – buildings, vehicles, parks, street lighting, purchasing, etc. The Green Team should coordinate its activities with the Township Environmental Advisory Council, and, when appropriate, environmentally focused community groups such as the Darby Creek Valley Association. The Green Team can also serve as a clearinghouse for any potential grant funding that could advance other elements of the Action Plan.
Quantification: There is no quantification associated with this measure; reductions achieved by the Green Team have been captured in the quantification of other measures. Co-Benefits: ● Staff education. ● Opportunity for publicizing Township’s efforts.
Success Story:
Nashua, New Hampshire created a Green Team in 2006 as an advisory committee to the Mayor, Board of Aldermen, and Division Directors. The Green Team: ● Identifies strategies the City can take
to becoming more energy efficient; ● Created the City’s Action Plan; and ● Is responsible for aiding in the
implementation of strategies identified in the Action Plan.
The Green Team is comprised of appointed representatives from City Departments, public officials, businessmen, citizens, and environmental experts.

Haverford Township Climate Action Plan Page 31 of 96
6.2 Establish an Environmentally Preferable Purchasing Policy; Buy Energy STAR Electronics and Appliances
Measure Status:
Estimated Implementation
Cost:
Estimated Cost Savings Per
Year:
Estimated Emissions Reduction Per Year:
Estimated Payback Period:
Responsible Entity:
Term:
Proposed Marginal $21,767 124 metric tons CO2e 2 years Administration, Green Team
Short
The purpose of this measure is to make energy efficiency, environmental sustainability and lifecycle costs key factors driving Township purchasing decisions on items ranging from office paper to vehicles. One example of a component of an Environmentally Preferable Purchasing Policy (EPPP) is to commit to purchasing only Energy STAR equipment and appliances for the Township as old devices are replaced. Appliances that carry the EPA Energy STAR label incorporate advanced technologies that use 10–50% less energy than standard models. The Energy STAR label can be found on a wide range of devices, ranging from DVD players to refrigerators.
Implementation: This measure is targeted for short-term implementation, which means that the measure would be fully enacted prior to 2012. The Administration Department would create the EPPP with input from the Green Team. The EPPP should include specific allowances on initial cost differences, preference for recycled/recyclable goods, and should consider the environmental and health benefits of purchased goods. As part of this effort, the Township should consider joining the Responsible Purchasing Network. The Township should also consider partnering with neighboring municipalities to leverage better prices on energy efficient goods and services. As the Township does not have a purchasing agent, an EPPP will help to ensure that all department heads are on the same page and buying the more environmentally preferable products. The EPPP will be the driving force behind many other measures, such as purchasing more efficient vehicles.
Quantification: The cost savings and emissions reductions associated with this measure assume a 30 percent drop in energy use by electronic devices (electronics, refrigeration, cooking and computers) across all Township facilities. According to the 2007 EIA Buildings Energy Data Book, electronic devices account for 15 percent of energy use in commercial facilities. Overall, Township facilities used 18,827 MMBtu of energy in 2005, of which an estimated 2,824 MMBtu can be attributed to electronic devices. Cutting this figure by 30 percent would result in a savings of 847 MMBtu. ICLEI’s CACP software was used to determine the impact of a 10 percent reduction in lighting costs across all Township facilities. At current electricity prices, cutting lighting usage by 847 MMBtu would result in a cost savings of $21,767 and an emissions reduction of 124 metric tons CO2e annually. Co-Benefits: ● Employee education. ● Ability to grow into other purchasing areas: vehicles, energy, etc.
Success Story:
In 1989, King County adopted its original recycled product procurement policy in response to overburdened landfills and the need to create markets for newly collected recyclables. Today, the King County Environmental Purchasing Program (EPP) provides county personnel with information and technical assistance to help them identify and evaluate, and ultimately buy, economical and effective environmentally preferable products and services. In the past year (2007), King County agencies purchased 36 million dollars worth of these products, saving $640,000 compared to the cost of conventional products.
Source: King County EPP Program
Haverford Township Climate Action Plan Page 32 of 96
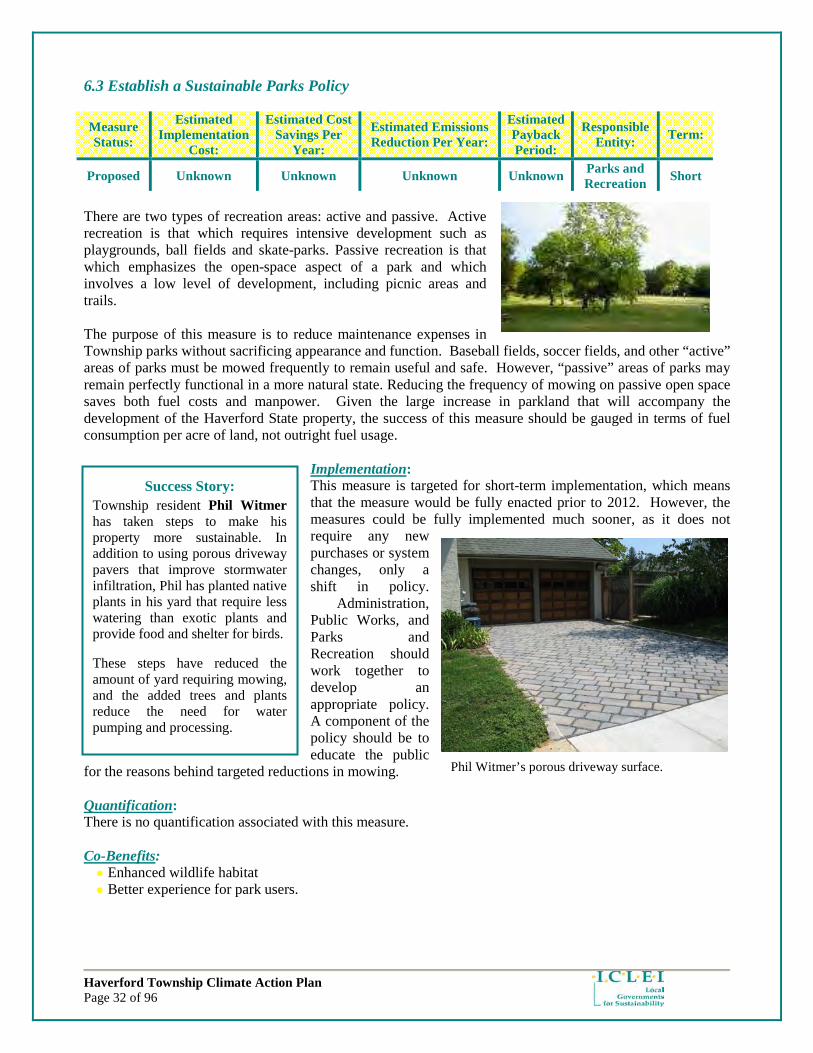
6.3 Establish a Sustainable Parks Policy
Measure Status:
Estimated Implementation
Cost:
Estimated Cost Savings Per
Year:
Estimated Emissions Reduction Per Year:
Estimated Payback Period:
Responsible Entity:
Term:
Proposed Unknown Unknown Unknown Unknown Parks and Recreation
Short
There are two types of recreation areas: active and passive. Active recreation is that which requires intensive development such as playgrounds, ball fields and skate-parks. Passive recreation is that which emphasizes the open-space aspect of a park and which involves a low level of development, including picnic areas and trails. The purpose of this measure is to reduce maintenance expenses in Township parks without sacrificing appearance and function. Baseball fields, soccer fields, and other “active” areas of parks must be mowed frequently to remain useful and safe. However, “passive” areas of parks may remain perfectly functional in a more natural state. Reducing the frequency of mowing on passive open space saves both fuel costs and manpower. Given the large increase in parkland that will accompany the development of the Haverford State property, the success of this measure should be gauged in terms of fuel consumption per acre of land, not outright fuel usage.
Implementation: This measure is targeted for short-term implementation, which means that the measure would be fully enacted prior to 2012. However, the measures could be fully implemented much sooner, as it does not require any new purchases or system changes, only a shift in policy.
Administration, Public Works, and Parks and Recreation should work together to develop an appropriate policy. A component of the policy should be to educate the public
for the reasons behind targeted reductions in mowing. Quantification: There is no quantification associated with this measure. Co-Benefits: ● Enhanced wildlife habitat ● Better experience for park users.
Success Story:
Township resident Phil Witmer has taken steps to make his property more sustainable. In addition to using porous driveway pavers that improve stormwater infiltration, Phil has planted native plants in his yard that require less watering than exotic plants and provide food and shelter for birds.
These steps have reduced the amount of yard requiring mowing, and the added trees and plants reduce the need for water pumping and processing.
Phil Witmer’s porous driveway surface.

Haverford Township Climate Action Plan Page 33 of 96
6.4 Establish Energy Efficiency Standards for any New Township Facilities and/or Retrofits of Existing Facilities
Measure Status:
Estimated Implementation
Cost:
Estimated Cost Savings Per
Year:
Estimated Emissions
Reduction Per Year:
Estimated Payback Period:
Responsible Entity:
Term:
Proposed 4 to 11% of
construction costs 25 to 30%
energy savings Unknown Unknown
Community Development
Short
There are several proposals for the construction or renovation of facilities in Haverford Township. In order to ensure that new facilities are economical to operate and sustainable over the long term, energy efficient design should be integral to the design of any facility. The Township should investigate green building standards and consider passing a resolution requiring that all Township buildings adhere to energy efficiency standards. The most prominent building standard is the Leadership in Energy and Environmental Design (LEED) Green Building Rating System developed by the United States Green Building Council. LEED encourages the adoption of sustainable green building and development practices through universally recognized and accepted tools and performance criteria.
LEED promotes a whole-building approach to sustainability by recognizing performance in five key areas of human and environmental health: sustainable site development, water savings, energy efficiency, materials selection and indoor environmental quality. LEED ratings are available at four levels: Certified, Silver, Gold and Platinum. A recent study, the LEED Energy Performance Project12, conducted by researchers at the New Buildings Institute, concluded that LEED buildings are, on average, 25%–30% more energy-efficient than non-LEED buildings as represented in the U.S. Department of Energy’s Commercial Buildings Energy Consumption Survey (CBECS) database13.
Implementation Strategy: This measure is targeted for short-term implementation, which means that the measure would be fully enacted prior to 2012. The Administration, Community Development Department and Green Team should work together to develop a policy. LEED is a widespread standard, although other options could be considered. For example, the Township could specify new, larger structures that would at the very least not use more energy than the facilities they are replacing. Quantification: There is no quantification for this measure, as the savings will depend on the specifications of buildings that have yet to be designed. Co-Benefits: ● Green buildings can be used for education of home and business owners. ● Work environment is healthier. ● Employees are happier and more productive.
12 New Buildings Institute. http://www.newbuildings.org/measuredPerformance.htm 13 U.S. Department of Energy, Energy Efficiency and Renewable Energy. http://eere.buildinggreen.com/
Success Story: The Cusano Environmental Education Center is an 18,000 square foot visitor center and educational facility in Tinicum Township, Delaware County and is the most urban wildlife refuge in the U.S. Fish and Wildlife system. The building upholds the principles of sustainable design, minimizing impacts to the environment through energy efficiency, the use of recycled materials, and in the treatment of the site.
The Cusano Environmental Education Center. Source: DVRBC

Haverford Township Climate Action Plan Page 34 of 96
6.5 Establish Program for Businesses/Homeowners to Register Improvements with Township and Receive Recognition
Measure Status:
Estimated Implementation
Cost:
Estimated Cost Savings Per
Year:
Estimated Emissions Reduction Per Year:
Estimated Payback Period:
Responsible Entity:
Term:
Proposed Unknown Unknown Unknown Unknown Green Team Short
This measure envisions a program, as part of the 10 Percent Challenge (see community building measures), in which businesses and homeowners would report efficiency improvements they have made to the Township. When individuals sign up to participate in the 10 Percent Challenge, they will be asked to report any measures they implement to reduce energy consumption to the Township. This will serve a twofold purpose: individuals will receive recognition for their accomplishments, and the Township will have a framework for monitoring reductions in community emissions that would otherwise be difficult to accurately assess. Implementation: This measure is targeted for short-term implementation, which means that the measure would be fully enacted prior to 2012. In addition to developing a process for receiving notices of upgrades and distributing awards, implementation of this measure will require a significant outreach, education, and publicity campaign (see community building measures – public outreach campaign). Residents must be made aware of the existence of the program in order for it to achieve its intended purpose. Outreach, coordinated by the Green Team, could be conducted via presentations to civic groups, the Commissioners Newsletters, Representative Vitali’s office, and articles in local newspapers. Quantification: There is no quantification associated with this measure. Co-Benefits: ● Public visibility, education, and outreach. ● Ability to quantify progress on community measures.

Haverford Township Climate Action Plan Page 35 of 96
Success Story:
Ann Arbor, Michigan is one of several communities that have joined the LED City Initiative, a program promoting an expansion in use of LED street light technology. Ann Arbor will install more than 1,000 LED streetlights over the next two years, projecting a 50 percent energy savings and a 3.8-year payback on its initial investment. Full implementation of LEDs is projected to cut Ann Arbor’s public lighting greenhouse gas emissions by 2,425 tons of CO2e annually, the equivalent of taking 400 cars off the road for a year.
6.6 Replace Existing Street Lights with LED Models
Measure Status:
Estimated Implementation
Cost:
Estimated Cost
Savings Per Year:
Estimated Emissions Reduction Per Year:
Estimated Payback Period:
Responsible Entity: Term:
Proposed $1,700,000 $196,000 500 metric tons CO2e
8 years
Planning Commission, Community
Development, Township Engineer
Long
The use of LED traffic signals has become quite common; in fact, Haverford Township has converted to LED traffic signals entirely. LED traffic signals, between energy savings and reduced maintenance costs, can cut costs approximately 90 percent compared to conventional lights. LED street lights have energy savings potential similar to traffic signals, although their use is not yet widespread. LEDs offer the most efficient and environmentally clean lighting source. They are solid-state devices rather than glass tubes with filaments, which makes LEDs far more durable and long lasting. LEDs exceptional lifespan significantly reduces maintenance costs and reduces the overall impact on landfills and the environment.
Haverford Township spends a significant amount of money on street lighting, roughly $32,770 monthly in 2005. Moreover, 2005 energy expenditures on street lighting were higher than either the Township buildings or vehicles sector. Installing LED streetlights presents a unique opportunity to reduce these energy costs and associated greenhouse gas emissions. However, prior to the initiation of any campaign to upgrade lighting, a careful inventory of existing lighting should be conducted to determine whether or not the current lights are appropriately sited and producing a proper amount of light. Implementation: This measure is targeted for long-term implementation, which means that the measure would be fully enacted prior to 2020. The Planning Commission is currently reviewing both existing lighting standards and standards for new construction. Progress towards adoption of a LED standard will largely depend on the Planning Commission’s findings. LED street lighting is cutting edge technology. If the Township were to move forward with an LED standard and join the LED City Initiative, it would likely be able to leverage significant grant funding towards implementation. Quantification: The cost savings and emissions reductions associated with this measure assume a 50 percent drop in energy usage for street lighting. Haverford could cut energy usage for lighting by approximately one million kWh by switching entirely to LED streetlights. Cost savings would be almost $200,000 annually, and CO2e savings would be approximately 500 metric tons annually. Co-Benefits: ● Reduced maintenance. ● Better quality light. ● Enhanced safety
A cobra-head style LED street light. Source: LED City Initiative.

Haverford Township Climate Action Plan Page 36 of 96
6.7 Create an Urban Tree Planting Program
Measure Status:
Estimated Implementation
Cost:
Estimated Cost Savings
Per Year:
Estimated Emissions
Reduction Per Year:
Estimated Payback Period:
Responsible Entity: Term:
Proposed $254,400 N/A 497 metric tons
CO2e N/A
Parks and Recreation, Public Works, Shade Tree
Commission
Long
Trees, through a process known as carbon sequestration, have the ability to remove carbon dioxide from the atmosphere. Because growing vegetation absorbs carbon dioxide, the international carbon accounting protocols permit countries that have large areas of forest (or other vegetation) to utilize sequestration benefits in their emissions accounting, thus making it easier for them to achieve the desired net emission levels. The same principle could be applied in Haverford. This measure is based on a 5 percent increase in wooded area in the Township, although a significant level of citizen participation could potentially increase that figure. Implementation: This measure is targeted for long-term implementation, which means that the measure would be fully enacted prior to 2020. The implementation of this measure should be approached on two fronts; municipal action to plant trees and asking citizens to plant trees and report their activities to the Township. In addition to developing a process for receiving notices of tree plantings from citizens, implementation of this measure will require a significant campaign of outreach, education, and publicity. Residents must be made aware of the existence of the program in order for it to achieve its intended purpose. Outreach, coordinated by the Green Team, could be conducted via presentations to civic groups, the Commissioners Newsletters, Representative Vitali’s office, and articles in local newspapers. The Township could consider partnering with relevant non-profit and community organizations, as well as seek grant funding for their own efforts. Additionally, the Township will need to ensure that proper personnel are trained on how to maintain the newly planted trees. Quantification: The emissions reductions associated with this measure assume a 5 percent increase in the tree canopy in Haverford Township. According to DVRPC land use data, 636 acres in the Township are classified as “wooded” comprising 10 percent of land area. Increasing the canopy 5 percent would mean an additional 31.8 acres of wooded area. It is recommended that approximately 400 trees per acre be planted for a total of 12,720 trees. This number of trees, at $20 a tree, would cost $254,400 to purchase. According to EPA, a medium growth coniferous tree, planted in an urban setting and allowed to grow for 10 years, sequesters 0.012 metric tons of carbon. This estimate is based on the following assumptions:
● The medium growth coniferous trees are raised in a nursery for one year until they become 1 inch in diameter at 4.5 feet above the ground (the size of tree purchased in a 15-gallon container).
● The nursery-grown trees are then planted in a suburban/urban setting; the trees are not densely planted. ● The calculation takes into account "survival factors" developed by U.S. DOE (1998). For example, after 5
years (one year in the nursery and 4 in the urban setting), the probability of survival is 68 percent; after 10 years, the probability declines to 59 percent. For each year, the sequestration rate (in lb per tree) is multiplied by the survival factor to yield a probability-weighted sequestration rate. These values are
Planting a tree in a park. Source: Natural Lands Trust.

Haverford Township Climate Action Plan Page 37 of 96
summed for the 10-year period, beginning from the time of planting, to derive the estimate of 23.2 lbs of carbon per tree.
Co-Benefits: ● Increased shade and comfort. ● Reduced storm water runoff. ● Reduced cooling costs.
I etEI L Loca l Governments
for Sustai nabili ty

Haverford Township Climate Action Plan Page 38 of 96
Compact fluorescent light bulb.
6.8 Switch from Incandescent to Fluorescent Lighting
Measure Status:
Estimated Implementation
Cost:
Estimated Cost
Savings Per Year:
Estimated Emissions
Reduction Per Year:
Estimated Payback Period:
Responsible Entity: Term:
Proposed $3 per lamp $47,000 332 metric tons CO2e
1 year All Departments, Public Works
Short
According to the U.S. EPA Energy STAR website, Compact Fluorescent Lights (CFLs) use about 75 percent less energy than standard incandescent bulbs and last up to 10 times longer. On average, each CFL saves slightly over $30 in electricity cost over its lifetime, while producing 75 percent less heat, thereby reducing the operating costs of cooling buildings. CFLs provide the greatest savings in fixtures that are on for a substantial amount of time each day. CFLs have a very favorable payback period, and prices for CFLs continue to fall as use becomes more widespread. Implementation: This measure is targeted for short-term implementation, which means that the measure would be fully enacted prior to 2012. This measure falls under the purview of the Responsible Purchasing Policy. It will be up to individual departments to order CFLs for their building or offices as old incandescent bulbs burn out. Quantification: The cost savings and emissions reductions associated with this measure assume a 75 percent drop in lighting costs across Township facilities currently using incandescent lighting, estimated at 60 percent. According to the 2007 DOE Buildings Energy Data Book14, lighting accounts for 26 percent of energy use in commercial facilities. Overall, Township facilities used 18,827 MMBtu of energy in 2005, of which an estimated 4,895 MMBtu can be attributed to lighting, and 2,937 MMBtu attributed to incandescent lighting. A 75 percent cut in incandescent lighting use would result in a savings of 2,202 MMBtu. ICLEI’s CACP software was used to determine the impact of a 75 percent reduction in lighting costs in Township facilities currently using incandescent lights. At current electricity prices, cutting lighting usage by 2,202 MMBtu would result in a cost savings of $47,000 and an emissions reduction of 332 metric tons CO2e annually. Co-Benefits: ● Cooling costs may be lower. ● Increased lighting life. ● Reduced maintenance costs.
14 U.S. Department of Energy, Energy Efficiency and Renewable Energy. http://www.btscoredatabook.net/ This resouce is referenced extensively throughout the remainder of this report, and will be cited as a hyperlink in the text.

Haverford Township Climate Action Plan Page 39 of 96
6.9 Undertake Building Retro-Commissioning
The process of commissioning a new building provides confirmation that building systems function according to criteria specified in the building specifications. Commissioning existing systems may require developing new functional criteria to address the owner’s current requirements for system performance. This process, known as retro-commissioning, is a systematic process for investigating, analyzing, and optimizing the performance of building systems by improving operation and maintenance to ensure continued performance over time. A comprehensive 2004 study of building commissioning projects found that building performance problems are pervasive. Design flaws, construction defects, malfunctioning equipment, and deferred maintenance have a host of detrimental ramifications, including equipment failure, poor indoor air quality and comfort, unnecessarily elevated energy use and under-performance of energy-efficiency strategies. The study found, for existing buildings, median commissioning costs of $0.27 per square foot, energy savings of 15 percent, and a payback period of less than one year. At $0.27 per square foot, all Township facilities could be retro-commissioned at a cost of about $39,500. Implementation: This measure is targeted for short-term implementation, which means that the measure would be fully enacted prior to 2012. Retro-commissioning of Township facilities is estimated to cost $39,600. Inquiries should be made with the Township Engineer to determine whether this is a service they are able to provide or whether the work should be bid out to an energy services company. Whichever route is taken, both Administration and Public Works would have a role to play in both the investigation process and the correction of operations and maintenance issues. Quantification: The cost savings and emissions reductions associated with this measure assume a 15 percent drop in energy costs across all Township facilities per the study above. Total energy costs for all Township facilities were $441,258 in 2005, and a 15 percent reduction in this cost would be approximately $66,200. Total CO2e emissions for all Township facilities were 2,028 metric tons in 2005, and a 15 percent reduction in these emissions would be approximately 304 metric tons CO2e. This measure does not take into account retro-commissioning of School District buildings. Co-Benefits: ● More comfortable working environments. ● Enhanced employee productivity.
Measure Status:
Estimated Implementation
Cost:
Estimated Cost
Savings Per Year:
Estimated Emissions
Reduction Per Year:
Estimated Payback Period:
Responsible Entity: Term:
Proposed $39,500 $66,200 304 metric tons CO2e
1 year Administration, Public Works,
Township Engineer Short
A Retro-commissioning flow chart. Source: Automated Buildings.

Haverford Township Climate Action Plan Page 40 of 96
Success Story:
The Township of Hamilton, NJ adopted a Green Fleets Policy to facilitate a reduction in fuel usage and emissions that result from municipal vehicle operations. The objective of the policy is to reduce both energy use and emissions by incorporating practical decision making in the operation of the Township’s fleet and through the purchasing of clean and energy efficient vehicles.
6.10 Create a Green Fleets Program
Measure Status:
Estimated Implementation
Cost:
Estimated Cost Savings
Per Year:
Estimated Emissions
Reduction Per Year:
Estimated Payback Period:
Responsible Entity:
Term:
Proposed Unknown $39,000 230 metric tons CO2e
Unknown Green Team Long
The Green Fleets program proposes that the Township purchase passenger cars that get at least 25 miles per gallon (mpg) in EPA mixed driving and light trucks that get at least 15 mpg EPA mixed driving. It is estimated that the policy would result in a minimum 25 percent reduction in gasoline consumption. Implementation: This measure is targeted for long-term implementation, which means that the measure would be fully enacted prior to 2020. The Township has approximately 75 gasoline-powered vehicles and replaces 6-8 per year. At that rate, it would take 10-12 years to turn over the entire fleet. A Green Fleets Program is a good fit as a component of an Environmentally Preferable Purchasing Policy and would provide a mechanism to allow fuel efficiency considerations to receive greater weight in purchasing decisions than it currently does. Staff and officials who do the purchasing must be made aware of the bevy of options available through state purchasing contracts, many of which have reduced upfront costs, not to mention reduced lifecycle costs.
Quantification: The costs savings and emissions reduction associated with this measure assume a 25 percent increase in the fuel efficiency of gasoline-powered vehicles in the fleet once the program is fully implemented. In 2005, the Township spent $157,796 on 93,476 gallons of gasoline. The Township’s approximately 75 gasoline-powered vehicles emitted an estimated 914 metric tons of CO2e in 2005. A 25 percent increase in fuel efficiency would cut CO2e emissions by approximately 230 metric tons and fuel expenses by $39,000. However, given the recent rise in fuel prices, savings could be as much as twice the stated figure. Co-Benefits: ● Public visibility and outreach. ● Reduced emissions of criteria air pollutants.
Cutaway Ford Escape showing hybrid components. Source: Green Car Congress.

Haverford Township Climate Action Plan Page 41 of 96
6.11 Undertake Building Enveloping
Measure Status:
Estimated Implementation
Cost:
Estimated Cost Savings Per
Year:
Estimated Emissions Reduction Per Year:
Estimated Payback Period:
Responsible Entity:
Term:
Proposed Widely Variable
$25,400 149 metric tons CO2e Unknown Administration, Public Works
Long
Sealing and insulating the envelope of a building, including its outer walls, ceiling, windows, doors, and floors, is a cost effective way to improve energy efficiency and comfort. Energy STAR estimates that sealing and insulating can save up to 20 percent on heating and cooling costs, or up to 10 percent of total annual energy costs. The costs of building enveloping are widely variable and depend on a number of factors such as building age, construction materials, number of windows, and solar orientation, among others. Savings associated with building enveloping must be evaluated on a case-by-case basis.
Implementation: This measure is targeted for long-term implementation, which means that the measure would be fully enacted prior to 2020. This measure could be implemented by earmarking funds each year in the Public Works budget for building maintenance with the target of upgrading one facility per year. A component of the program should be to publicize the improvements made and the cost savings accrued as part of a campaign to educate the public about building enveloping opportunities in their own homes.
Quantification: The cost savings and emissions reductions associated with this measure assume a 20 percent drop in heating and cooling costs across all Township facilities. According to the 2007 DOE Buildings Energy Data Book, heating accounts for 14 percent of energy use in commercial facilities and cooling accounts for 13 percent, for a total of 27 percent. Overall, Township facilities used 18,827 MMBtu of energy in 2005, of which 5,083 MMBtu can be attributed to heating and cooling. Cutting this figure by 20 percent would result in a savings of 1,017 MMBtu. ICLEI’s CACP software was used to determine the impact of a 20 percent reduction in heating and cooling costs across all Township facilities. At current electricity and natural gas prices, cutting heating and cooling usage by 1,017 MMBtu would result in a cost
savings of $25,400 and an emissions reduction of 149 metric tons CO2e annually. Co-Benefits: ● More comfortable indoor environment. ● Community education opportunities.
Success Story:
A host of efficiency improvements have recently been completed at the Manoa Fire Company. These include additional insulation, high efficiency lighting, and switches that turn off the heat in the garage when the bay doors open. The savings from these changes should be carefully tracked and the measures considered for adoption in the other fire companies.

Haverford Township Climate Action Plan Page 42 of 96
T8 light
6.12 Switch from T 12s to T 8s
Measure Status:
Estimated Implementation
Cost:
Estimated Cost Savings Per
Year:
Estimated Emissions Reduction Per Year:
Estimated Payback Period:
Responsible Entity:
Term:
Ongoing $20 per lamp $16,700 115 metric tons CO2e 3 years Public Works
Long
T-8 fluorescent lamps have quickly become the standard for new fixtures and retrofits in most school, office, commercial, and industrial applications. T-8’s provide 40 percent more light output than T-12’s, so fewer lights are needed to maintain the same output. Additionally, T-8’s last approximately 20 percent longer than T-12’s. T-8 fixtures can save over 40 percent in annual energy costs, or about $27 per fixture. According to Alliant Energy, a Wisconsin utility, a typical conversion of T12 fixtures with magnetic ballast to T8 fixtures with electronic ballast costs about $20 per lamp including parts and labor. Energy savings from the conversion can pay back the initial investment in two to three years in an industrial application, and five to seven years in a commercial application. Implementation: This measure is targeted for long-term implementation, which means that the measure would be fully enacted prior to 2020. Although T8 installations have begun in the Skatium, long-term implementation was selected, as T8s are a more expensive and labor-intensive switch-outs than CFLs. One way to advance this measure is to earmark funds each year in the Public Works budget for building maintenance with the target of upgrading one facility per year. Quantification: The cost savings and emissions reductions associated with this measure assume a 40 percent drop in lighting costs and energy across Township facilities currently using T12s, estimated at 40 percent. According to the 2007 DOE Buildings Energy Data Book, lighting accounts for 26 percent of energy use in commercial facilities. Overall, Township facilities used 18,827 MMBtu of energy in 2005, of which an estimated 4,895 MMBtu can be attributed to lighting, and 1,958 MMBtu attributed to fluorescent lighting. A 40 percent cut in fluorescent lighting use would result in a savings of 783 MMBtu. ICLEI’s CACP software was used to determine the impact of a 40 percent reduction in lighting costs in Township facilities currently using fluorescents. At current electricity prices, cutting lighting usage by 783 MMBtu would result in a cost savings of $16,700 and an emissions reduction of 115 metric tons CO2e annually. Co-Benefits: ● Increased lighting life. ● Reduced maintenance costs.
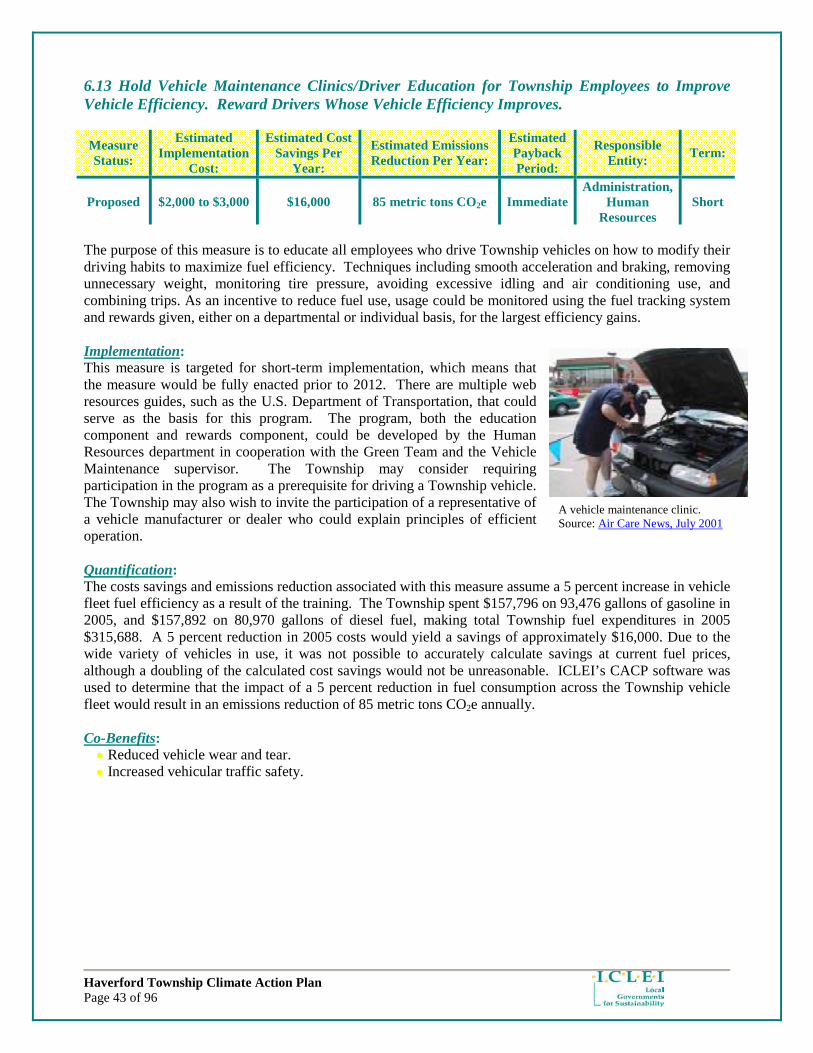
Haverford Township Climate Action Plan Page 43 of 96
A vehicle maintenance clinic. Source: Air Care News, July 2001
6.13 Hold Vehicle Maintenance Clinics/Driver Education for Township Employees to Improve Vehicle Efficiency. Reward Drivers Whose Vehicle Efficiency Improves.
Measure Status:
Estimated Implementation
Cost:
Estimated Cost Savings Per
Year:
Estimated Emissions Reduction Per Year:
Estimated Payback Period:
Responsible Entity:
Term:
Proposed $2,000 to $3,000 $16,000 85 metric tons CO2e Immediate Administration,
Human Resources
Short
The purpose of this measure is to educate all employees who drive Township vehicles on how to modify their driving habits to maximize fuel efficiency. Techniques including smooth acceleration and braking, removing unnecessary weight, monitoring tire pressure, avoiding excessive idling and air conditioning use, and combining trips. As an incentive to reduce fuel use, usage could be monitored using the fuel tracking system and rewards given, either on a departmental or individual basis, for the largest efficiency gains. Implementation: This measure is targeted for short-term implementation, which means that the measure would be fully enacted prior to 2012. There are multiple web resources guides, such as the U.S. Department of Transportation, that could serve as the basis for this program. The program, both the education component and rewards component, could be developed by the Human Resources department in cooperation with the Green Team and the Vehicle Maintenance supervisor. The Township may consider requiring participation in the program as a prerequisite for driving a Township vehicle. The Township may also wish to invite the participation of a representative of a vehicle manufacturer or dealer who could explain principles of efficient operation. Quantification: The costs savings and emissions reduction associated with this measure assume a 5 percent increase in vehicle fleet fuel efficiency as a result of the training. The Township spent $157,796 on 93,476 gallons of gasoline in 2005, and $157,892 on 80,970 gallons of diesel fuel, making total Township fuel expenditures in 2005 $315,688. A 5 percent reduction in 2005 costs would yield a savings of approximately $16,000. Due to the wide variety of vehicles in use, it was not possible to accurately calculate savings at current fuel prices, although a doubling of the calculated cost savings would not be unreasonable. ICLEI’s CACP software was used to determine that the impact of a 5 percent reduction in fuel consumption across the Township vehicle fleet would result in an emissions reduction of 85 metric tons CO2e annually. Co-Benefits: ● Reduced vehicle wear and tear. ● Increased vehicular traffic safety.

Haverford Township Climate Action Plan Page 44 of 96
6.14 Install Programmable Thermostats in Township Buildings
Measure Status:
Estimated Implementation
Cost:
Estimated Cost Savings Per
Year:
Estimated Emissions Reduction Per Year:
Estimated Payback Period:
Responsible Entity:
Term:
Ongoing $5,000 to $7,000 $10,800 74 metric tons CO2e 1 year Public Works
Short
Programmable thermostats allow for the automatic adjustment of building temperatures at times when they are unoccupied. By turning down heating and cooling systems when they are not needed, programmable thermostats can reduce heating and cooling costs by approximately 10 percent. Programmable thermostats were installed in the Township Administration building in April 2008 and will ultimately be adopted in all Township facilities. The performance of the thermostats in the Administration building should be closely tracked to determine the benefits to be expected from installation in other buildings. Implementation Strategy: This measure is targeted for short-term implementation, which means that the measure would be fully enacted prior to 2012. One way to advance this measure is to earmark funds each year in the Public Works budget for building maintenance with the target of upgrading appropriate areas in one or two facilities per year. Quantification: The cost savings and emissions reductions associated with this measure assume a 10 percent drop in heating and cooling costs across all Township facilities. According to the 2007 DOE Buildings Energy Data Book, heating accounts for 14 percent of energy use in commercial facilities and cooling accounts for 13 percent, for a total of 27 percent. Overall, Township facilities used 18,827 MMBtu of energy in 2005, of which 5,083 MMBtu can be attributed to heating and cooling. Cutting this figure by 10 percent would result in a savings of 508 MMBtu. ICLEI’s CACP software was used to determine the impact of a 10 percent reduction in heating and cooling across all Township facilities. At current electricity and natural gas prices, cutting heating and cooling usage by 508 MMBtu would result in a cost savings of $10,800 and an emissions reduction of 74 metric tons CO2e annually. Co-Benefits: ● More comfortable indoor environment. ● Greater employee productivity.
A typical programmable thermostat. Source: Honeywell.

Haverford Township Climate Action Plan Page 45 of 96
Sample lighting sensor.
6.15 Install Occupancy Sensors for Lighting
Measure Status:
Estimated Implementation
Cost:
Estimated Cost Savings
Per Year:
Estimated Emissions
Reduction Per Year:
Estimated Payback Period:
Responsible Entity:
Term:
Proposed $50 per sensor $10,400 72 metric tons CO2e
Unknown Public Works Long
Occupancy sensors automatically turn off lighting in unoccupied spaces such as classrooms, conference rooms, restrooms and storage areas. Occupancy sensors can reduce energy expenditures on lighting by 15 to 90 percent depending on the application. Savings of 50 percent or more are common. Facility staff can determine the best areas to install occupancy sensors by using lighting loggers or random surveys about room/area occupancy. Lighting loggers can count lighting hours and can correlate lighting duration with detected occupancy. Occupancy sensor costs range from approximately $30 to $130, depending on the type. The payback period of occupancy sensors retrofits range from 0.5 to 5 years, depending upon the level of occupancy and energy savings potential of the area controlled. Implementation: This measure is targeted for long-term implementation, which means that the measure would be fully enacted prior to 2020. One way to advance this measure is to earmark funds each year in the Public Works budget for building maintenance with the target of upgrading appropriate areas in one facility per year. Quantification: The cost savings and emissions reductions associated with this measure conservatively assume a 10 percent drop in lighting costs across all Township facilities. According to the 2007 DOE Buildings Energy Data Book, lighting accounts for 26 percent of energy use in commercial facilities. Overall, Township facilities used 18,827 MMBtu of energy in 2005, of which an estimated 4,895 MMBtu can be attributed to lighting. Cutting this figure by 10 percent would result in a savings of 489 MMBtu. ICLEI’s CACP software was used to determine the impact of a 10 percent reduction in lighting costs across all Township facilities. At current electricity prices, cutting lighting usage by 489 MMBtu would result in a cost savings of $10,400 and an emissions reduction of 72 metric tons CO2e annually. Co-Benefits: ● Increased lighting life. ● Cooling costs may be lower.

Haverford Township Climate Action Plan Page 46 of 96
6.16 Install EPA EZ-GPO Computer Shut-Down Software
Measure Status:
Estimated Implementation
Cost:
Estimated Cost Savings Per
Year:
Estimated Emissions Reduction Per Year:
Estimated Payback Period:
Responsible Entity:
Term:
Proposed $500 or less $7,000 39 metric tons CO2e Immediate Information Technology
Short
EZ-GPO is a free tool that provides centralized control of user power management settings (monitor power management, system standby, and hibernate) in Windows 2000 and XP. It requires no special hardware or network processes and has no licensing fees. Its only cost is the time it takes to install, typically one or two days depending on network complexity.
Implementation Strategy: This measure is targeted for short-term implementation, which means that the measure would be fully enacted prior to 2012. The IT Department is currently working on getting all Township computers set up on the same network. Once this task is complete, the IT Department should work to ensure that all computers are properly equipped with the EZ-GPO software. Quantification: The cost savings and emissions reductions associated with this measure are based on an EPA worksheet designed to calculate the benefits of the EZ-GPO software. Township facilities, including the
Haverford Township Free Library, contain approximately 100 computers. Assuming computers enter sleep mode after 5 minutes of inactivity, hibernate after 15 minutes of inactivity, electricity at 9 cents per kWh, and a 40 hour work week, 5 days a week, with 22 vacation days per year, annual savings would be $7,000 and 77,910 kWh, according to EPA. This translates into an emissions reduction of 39 metric tons of CO2e a year. Co-Benefits: ● Increased monitor and CPU life. ● Less heat generated by electronics, thereby reducing cooling costs.
Success Story:
North Thruston Public Schools (NTPS), Thruston County, WA activated sleep settings on 4,000 computers during regular software upgrades in Spring 2005, saving $45,000 per year. According to Dean Martinolich, NTPS Resource Conservation Manager, this is equivalent to the electricity consumption of two district elementary schools. The district will save close to 900,000 kWh annually, enough electricity to light over 700 homes for a year; and prevent 500 tons of carbon dioxide pollution, equivalent to planting close to 200 acres of trees. Source: EPA

Haverford Township Climate Action Plan Page 47 of 96
6.17 Improve the Energy Efficiency of the Skatium
Measure Status:
Estimated Implementation
Cost:
Estimated Cost
Savings Per Year:
Estimated Emissions
Reduction Per Year:
Estimated Payback Period:
Responsible Entity: Term:
Proposed Unknown $6,800 27 metric tons
CO2e Unknown
Administration, Public Works, Parks and
Recreation Short
The Skatium represents approximately 50 percent of building energy consumption in the Township, and was built in an era where energy efficiency was not of paramount concern, so it represents the greatest single opportunity among Township buildings to improve efficiency. Some measures, such as lighting replacements, are underway, but there are a number of additional approaches that could be taken to make the Skatium more efficient.
The most immediate need is for a roof replacement. The existing roof is original to the building and has been leaking for some time and has little to no insulation. To correct this efficiency shortcoming, the replacement roof should be heavily insulated. Like the roof, the Skatium walls have little to no insulation, resulting in significant energy losses. Lack of adequate insulation in the roof and walls are just two examples of opportunities to improve the performance of the Skatium. However, a comprehensive assessment of savings opportunities should be conducted. Once a roof replacement has been done, the installation
of solar panels on the Skatium roof should be strongly considered. The roof area is approximately 35,000 square feet, and the building is tall enough that there are no substantial obstructions from any side. Due to the chillers on the roof and the need for access for maintenance, not all 35,000 square feet would be available, but 20,000 to 25,000 are estimated to be available. The inventory identified that in 2005, $114,911 was spent in electricity at the Skatium. A tool provided on the FindSolar.com website was used, inputting building location, type, estimated monthly average electricity usage, and current electricity rates. Installing solar on the Skatium roof was estimated to have of net installation cost of between $1.5 million to $2.2 million covering 80 percent of the Skatium roof. This would save $46,000 to $121,000 a year and would cut CO2e emissions by 252 metric tons per year. Further engineering studies should be conducted to refine these estimated figures. Implementation: This measure is targeted for short-term implementation, which means that the measure would be fully enacted prior to 2012. There is currently a bid to replace the roof and add insulation for approximately $600,000, although the specifics regarding the quality of the insulation are not clear. Quantification: The costs savings and emissions reduction associated with this measure assume a 20 percent decrease in heating and cooling costs for the Stakium resulting from the roof replacement, which is consistent with the savings expected from building envelope improvements. Total energy costs for the Stakium were $172,989 in 2005. Of this, $46,707 can be attributed to heating and cooling costs, although this number is likely to be low, as the energy use profile of the Skatium falls outside of normal commercial building profiles. ICLEI’s
The exterior of the Skatium.

Haverford Township Climate Action Plan Page 48 of 96
CACP software was used to determine that if the Skatium’s energy consumption from heating and cooling were reduced 20 percent due to building envelope improvements, cost savings of $6,800 and an emissions reduction of 27 metric tons of CO2e would result. Co-Benefits: ● Roof could eventually house solar arrays. ● Could be educational and publicly visible sign of Township’s commitment to reducing energy usage.
6.18 Install LED Exit Signs in Township Buildings
Measure Status:
Estimated Implementation
Cost:
Estimated Cost Savings
Per Year:
Estimated Emissions
Reduction Per Year:
Estimated Payback Period:
Responsible Entity: Term:
Proposed $50 per sign $420 2 metric tons CO2e
3 years Public Works Short
Illuminated exit signs are an important and legally required safety feature for any public facility. In the case of an emergency such as a fire, their operation is critical in protecting the well being of building occupants. By design, exit signs operate 24 hours per day, and can consume large amounts of energy to operate. Older exit signs consume over 350 kilowatt-hours (kWh) and cost $28 each annually to operate. However, ENERGY STAR labeled LED exit signs use approximately 44 kWh of electricity annually. A LED exit sign usually costs less than $4 annually to operate. To be Energy STAR labeled, a LED exit sign must be guaranteed to last at least 5 years, however, many manufacturers state that their lamps will maintain National Fire Protection Association compliant levels of luminance for 10 to 25 years. Implementation: This measure is targeted for short-term implementation, which means that the measure would be fully enacted prior to 2012. This measure could be implemented either via the Environmentally Preferable Purchasing Policy, or by earmarking funds each year in the Public Works budget for building maintenance with the target of upgrading two or three facilities per year. Quantification: The cost savings and emissions reductions associated with this measure assume that 12 exit signs are replaced with high-efficiency LED models, saving 250 kWh per unit per year, for an annual total savings of 3,000 kWh. ICLEI’s CACP software was used to determine the impact of a 3,000 kWh reduction in electricity usage across all Township facilities. At current electricity prices, cutting lighting usage by 3,000 kWh would result in a cost savings of $420 and an emissions reduction of 2 metric tons CO2e annually. Co-Benefits: ● Enhanced safety. ● Reduced maintenance.
An LED exit sign.

Haverford Township Climate Action Plan Page 49 of 96
7 Community Measures The Township has identified a number of measures to help reduce community emissions from the buildings, transportation, and waste sectors. Unlike the Township Operations portion of the Plan, there is no specific reduction target associated with the community section of the Plan; rather it contains a number of proposals to be considered for implementation by the municipal Green Team. Public outreach and education is an essential component to substantial reductions in community emissions and is frequently mentioned in the measures denoted below.
7.1 Buildings Measures The Township has identified a number of measures to help reduce community emissions from the built environment. These measures are denoted below. It is important to note that all measures in the community buildings sector fall within two major categories: the Haverford 10% Challenge and a Public Climate Change Educational Campaign.

Haverford Township Climate Action Plan Page 50 of 96
Success Story:
Burlington, Vermont created a 10% Challenge to encourage individuals, businesses, and City government officials to reduce energy consumption by 10%. Challenge participants use a website-based calculator to estimate their emissions and track progress toward meeting their emissions reduction goal. Posters, business cards, and materials have helped to create a strong “brand” recognition of the 10% Challenge by the public.
7.1.1 Haverford 10 Percent Challenge: Residential Energy Reduction Measure Status CO2e Savings: Energy Savings: Financial Payback: Proposed Encapsulated in other
measures Encapsulated in other measures
Encapsulated in other measures
The purpose of the Haverford 10 Percent Challenge is to encourage Township residents to reduce energy consumption in their home by at least 10 percent. This program supports easy to implement energy efficiency and conservation measures as well as the purchase of alternative energy. As part of the 10 Percent Challenge, the Township has identified five initial strategies.
Emissions reductions for this measure are not quantified as they are embodied in the five sub-measures that make up the basis of the 10 Percent Challenge. These sub-measures, in no particular order, are:
● Promote renewable energy purchases by homeowners/tenants; ● Run a CFL replacement campaign; ● Promote the purchasing of Energy STAR appliances; ● Educate and promote the unplugging of appliances
and power strips; and ● Encourage 10 percent of households to use
programmable thermostats; The estimated implementation cost for the Township of the 10 Percent Challenge is approximately $5,000 for the cost of educational materials and $10,000 for staff time to organize, run, and oversee the Challenge. However, the Township can greatly reduce these costs by integrating information about these campaigns into existing materials being developed by the Township (as opposed to creating new materials and new mailings).
The five identified sub-measures are the beginning phases of the Haverford 10 Percent Challenge. It is important to note that the Township will phase in this measure with an ultimate goal of having 100% of households participate in the Challenge. However, in the short-term, the Township is aiming to enlist 10 percent of all households in the Challenge by 2012, at which point the program will be evaluated and a new target put into place. To track the number of participants, the Township is considering creating a ‘Climate Action Pledge’ that local residents’ can sign to voluntary commit to the 10% Challenge. The Township is also investigating the feasibility of creating a registry that allows local residents and businesses to register energy and emissions reductions measures to receive recognition for their efforts in helping the Township reduce its overall carbon footprint (for more details on the registry, please see the Township measures section of this Plan).
Co-Benefits
● Saves money on energy and utility bills. ● Reduces vulnerability to spikes in fuel prices. ● Creates market for renewable energy. ● Reduces air pollution emissions that contribute to health problems. ● Empower local residents to take action on climate change.

Haverford Township Climate Action Plan Page 51 of 96
Success Story:
In March of 2005, the Worcester, MA City Council unanimously passed a Clean Energy Resolution making Worcester the largest city in the country to set a goal of purchasing 20% of the electricity used for municipal operations from clean, renewable sources by 2010.
The Worcester Energy Task Force is also engaged in a campaign to get homeowners to sign up for clean energy through a variety of suppliers for an extra $4-12 per month per household.
7.1.1.1 Promote Renewable Energy Purchases by Homeowners/Tenants
Measure Status: CO2e Savings: Energy Savings: Estimated Implementation Cost:
Payback Period:
Proposed 8,430 metric tons Not Applicable $388,290 Not Applicable
The average household in Haverford Township uses approximately 700 kWh of electricity per month. Through a program run by PECO, each household that is currently supplied with electricity from PECO has the option of signing up to receive renewable energy through the PECO wind fund. The program works by asking interested parties to pay a small additional monthly cost on their utility bill, which covers the added expense of generating the wind power used in the program. The wind supported through the program is delivered into the Pennsylvania electric grid, reducing the need for energy from fossil fuel sources. The incremental cost difference between PECO’s traditional energy sources and renewable options are approximately $215 per year (or roughly $18/month).
Haverford proposes working closely with PECO to educate more households in the Township about options to purchase renewable energy. Additionally, the Township should consider disseminating information about renewable energy purchases in relevant avenues, including informational booths at Township events, flyers in the Township building, and flyers included in regular Township correspondence/mailings for residents.
The cost savings and emissions reductions associated with this measure assume a 100 percent drop in electricity emissions in 10 percent of Township households. According to ICLEI’s CACP software a 100 percent drop in electricity emissions in 10 percent of Township households would result in a CO2e reduction of 8,430 metric tons.
Co-Benefits
● Allows households to reduce carbon footprint without any drastic changes in lifestyle ● Cost is fairly minimal and is directly dependent on the amount of electricity consumed per household. ● Requires little direct oversight and investment from the Township as PECO facilitates the program. ● Reduces the amount of air pollution and criteria air pollutants.
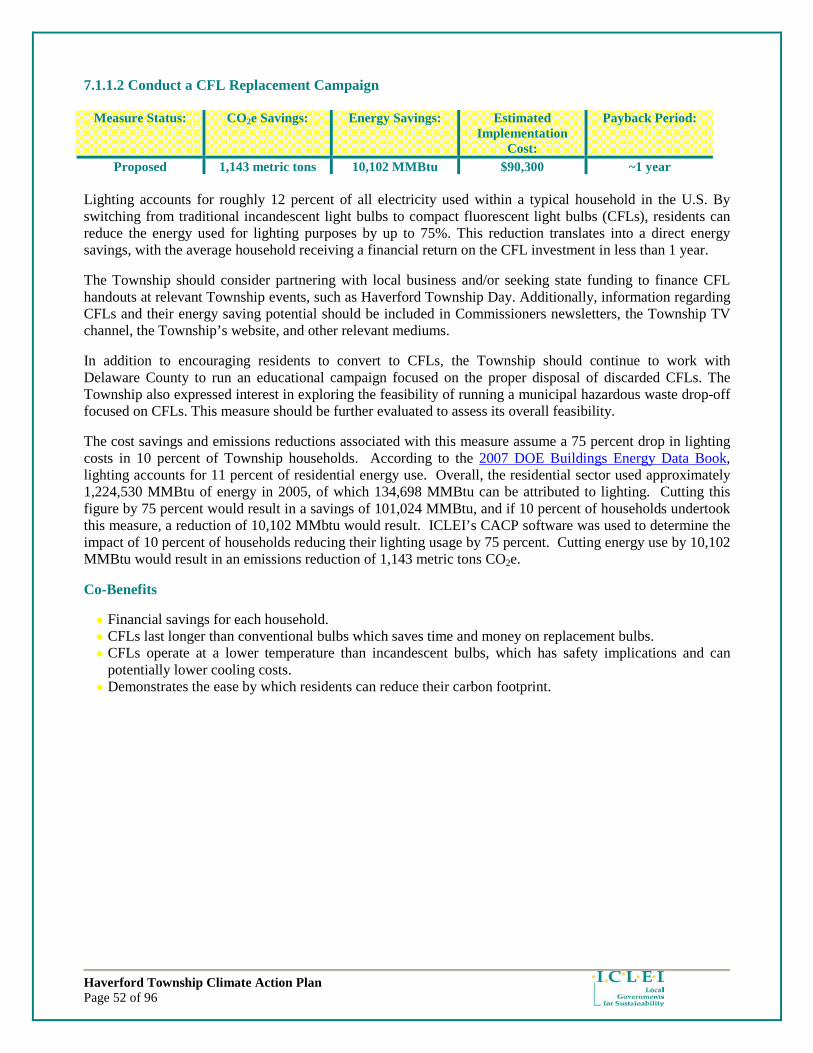
Haverford Township Climate Action Plan Page 52 of 96
7.1.1.2 Conduct a CFL Replacement Campaign
Measure Status: CO2e Savings: Energy Savings: Estimated Implementation
Cost:
Payback Period:
Proposed 1,143 metric tons 10,102 MMBtu $90,300 ~1 year Lighting accounts for roughly 12 percent of all electricity used within a typical household in the U.S. By switching from traditional incandescent light bulbs to compact fluorescent light bulbs (CFLs), residents can reduce the energy used for lighting purposes by up to 75%. This reduction translates into a direct energy savings, with the average household receiving a financial return on the CFL investment in less than 1 year.
The Township should consider partnering with local business and/or seeking state funding to finance CFL handouts at relevant Township events, such as Haverford Township Day. Additionally, information regarding CFLs and their energy saving potential should be included in Commissioners newsletters, the Township TV channel, the Township’s website, and other relevant mediums.
In addition to encouraging residents to convert to CFLs, the Township should continue to work with Delaware County to run an educational campaign focused on the proper disposal of discarded CFLs. The Township also expressed interest in exploring the feasibility of running a municipal hazardous waste drop-off focused on CFLs. This measure should be further evaluated to assess its overall feasibility.
The cost savings and emissions reductions associated with this measure assume a 75 percent drop in lighting costs in 10 percent of Township households. According to the 2007 DOE Buildings Energy Data Book, lighting accounts for 11 percent of residential energy use. Overall, the residential sector used approximately 1,224,530 MMBtu of energy in 2005, of which 134,698 MMBtu can be attributed to lighting. Cutting this figure by 75 percent would result in a savings of 101,024 MMBtu, and if 10 percent of households undertook this measure, a reduction of 10,102 MMbtu would result. ICLEI’s CACP software was used to determine the impact of 10 percent of households reducing their lighting usage by 75 percent. Cutting energy use by 10,102 MMBtu would result in an emissions reduction of 1,143 metric tons CO2e.
Co-Benefits
● Financial savings for each household. ● CFLs last longer than conventional bulbs which saves time and money on replacement bulbs. ● CFLs operate at a lower temperature than incandescent bulbs, which has safety implications and can
potentially lower cooling costs. ● Demonstrates the ease by which residents can reduce their carbon footprint.

Haverford Township Climate Action Plan Page 53 of 96
7.1.1.3 Promote Purchase of Energy STAR and Other Energy Efficient Home Appliances
Measure Status: CO2e Savings: Energy Savings: Estimated Implementation
Cost:
Payback Period:
Proposed 1,083 metric tons 9,551 MMBtu $45,150 to 180,600 (depends on appliance)
Unknown (depends on appliance)
Home appliances, ranging from refrigerators to microwaves and alarm clocks, all utilize a significant amount of energy. By purchasing more efficient appliances, home dwellers can substantially reduce their energy consumption and their carbon footprint. Home appliances with the Energy STAR label are a good place to start when investigating energy efficient appliances. The U.S. Environmental Protection Agency in partnership with the U.S. Department of Energy developed the Energy STAR labeling program to identify energy efficient equipment and appliances so that consumers could more easily navigate between more efficient and less efficient models.
One example of a commonly labeled Energy STAR product is the computer tower and monitor, which on average save $15 to $25 per year in energy costs compared to their non-Energy STAR counterparts.
The Township should provide educational materials and conduct outreach about the benefits of purchasing energy efficient appliances. Additionally, the Township should consider partnering with local distributors of energy efficient appliances to hold an educational forum on the types of energy efficient appliances currently in circulation.
The cost savings and emissions reductions associated with this measure assume a 30 percent drop in electronic device energy consumption in 10 percent of Township households. According to the 2007 DOE Buildings Energy Data Book, electronic devices (consumer electronics, refrigerators, washers/dryers, computers, etc) account for 26 percent of residential energy use. Overall, the residential sector used approximately 1,224,530 MMBtu of energy in 2005, of which 318,378 MMBtu can be attributed to electronic devices. Cutting this figure by 30 percent in 10 percent of households would result in a savings of 9,551 MMBtu. ICLEI’s CACP software was used to determine the impact of 10 percent of households reducing their electronic devices usage by 30 percent. Cutting energy use by 9,551 MMBtu would result in an emissions reduction of 1,081 metric tons CO2e.
Co-Benefits
● Saves money on utility bills. ● Encourages a market for green products. ● Allows for education about energy efficiency.

Haverford Township Climate Action Plan Page 54 of 96
7.1.1.4 Educate and Promote the Unplugging of Appliances and Power Strips
Measure Status: CO2e Savings: Energy Savings: Estimated Implementation
Cost:
Payback Period:
Proposed 503 metric tons 2,939 MMBtu Not Applicable Not Applicable While most people are aware that appliances are large consumers of energy, very few people realize that appliances not in use, but still plugged in, utilize energy. This energy, known as the phantom load, can be a significant amount of a households monthly energy use. In order to reduce the amount of energy used per household, the Township would like to run a ‘phantom load’ reduction campaign primarily focused on the use of power strips and the unplugging of appliances when not in use. As part of this educational campaign, the Township should include educational information about what ‘phantom load’ is and how households can work to reduce energy consumption from this load. Information on ‘phantom load’ and reduction options could be distributed through Commissioners newsletters, educational flyers, the Township website, and the Township TV Channel.
The cost savings and emissions reductions associated with this measure assume a 30 percent drop in electronics (computers and consumer electronics) energy usage in 10 percent of Township households. According to the 2007 DOE Buildings Energy Data Book, electronics account for 8 percent of residential energy use. Overall, the residential sector used approximately 1,224,530 MMBtu of energy in 2005, of which 97,962 MMBtu can be attributed to electronics. Cutting this figure by 30 percent in 10 percent of households would result in a savings of 2,939 MMBtu. ICLEI’s CACP software was used to determine the impact of 10 percent of households reducing their electronics usage by 30 percent. Cutting energy use by 2,939 MMBtu would result in an emissions reduction of 503 metric tons CO2e.
Success Story:
Township resident’s Jan Marie and Alan Rushforth have installed a 5.2 kilowatt solar photo voltaic system on their home. It generates most of their summer electricity. A Solar Hot Water system heats their domestic hot water with the sun alone for 3 seasons, and a Solar Hot Air System helps space heating. The sun’s heat is supplemented in the winter with a highly efficient wood gasification wood burning boiler along with a 950 gallon hot water tank. The Rushforth’s used to use about 1100 gallons of fuel oil to heat their home, which is roughly the equivalent of 2 cars driving for a year.

Haverford Township Climate Action Plan Page 55 of 96
7.1.1.5 Encourage 10 Percent of Households to use Programmable Thermostats
Measure Status: CO2e Savings: Energy Savings: Estimated
Implementation Cost:
Payback Period:
Proposed 411 metric tons 5,633 MMBtu $180,600 ~1 year
As part of the 10% Challenge, the Township is looking into providing educational materials to encourage at least 10% of households to install programmable thermostats. Distribution of information regarding the benefits of programmable thermostats can happen, for example, via:
● Inclusion in Board of Commissioner’s newsletters; ● Information presented on Township website and TV Channel; ● Informational booths at Haverford Township Day; and ● Inclusion in School District mailings.
The Township should consider partnering with local businesses and/or seeking state/federal funding to discount the cost of programmable thermostats for Township residents. Coupons and free thermostat handouts would help to increase the participation rate amongst community residents. In addition, the Township should include educational materials about how to properly operate a programmable thermostat in hand-out and promotional materials.
The cost savings and emissions reductions associated with this measure assume a 10 percent drop in heating and cooling costs in 10 percent of Township households. According to the 2007 DOE Buildings Energy Data Book, heating accounts for 34 percent of residential energy use and cooling accounts for 12 percent, for a total of 46 percent. Overall, the residential sector used approximately 1,224,530 MMBtu of energy in 2005, of which 563,284 MMBtu can be attributed to heating and cooling. Cutting this figure by 10 percent would result in a savings of 5,633 MMBtu. ICLEI’s CACP software was used to determine the impact of a 10 percent reduction in heating and cooling energy use in the residential sector. Cutting energy use by 5,633 MMBtu would result in an emissions reduction of 411 metric tons CO2e.

Haverford Township Climate Action Plan Page 56 of 96
7.1.1.6 Meeting the 10 Percent Challenge
The graphic below provides Haverford residents a simple, concise, step-by-step process to follow in order to meet the 10 Percent Challenge. Similar guides could be produced for more ambitious reductions (20 percent, 30 percent, etc) as well as for business owners.
Meeting the 10 Percent Challenge in Your Home:
Step 1: Trim along the dashed line and hang this sheet on your refrigerator. Step 2: Replace incandescent light bulbs with compact fluorescent light (CFL) bulbs. The average home in Haverford uses 8,837 kilowatt-hours (kWh) of electricity annually. According to the Department of Energy, 11 percent of household energy use, or 972 kWh, is attributable to lighting. And according to the EPA, CFLs cut lighting energy use by 75 percent, or 729 kWh. That’s an annual cost savings of approximately $100 and a reduction in carbon dioxide (CO2) emissions of 0.47 metric tons. Step 3: Install programmable thermostats. According to the Department of Energy, 34 percent of household energy use is attributable to heating and 12 percent to cooling. Programmable thermostats cost about $100 and can reduce heating and cooling demand by ten percent. Assuming a home heated by natural gas, as most Township residences are, this means a cost savings of approximately $180 and a reduction in CO2 emissions of 0.41 metric tons. Step 4: Unplug something. Every electronic device in your home, whether it’s a flat screen TV or a phone charger is using electricity even when not in use. According to the Department of Energy, 75 percent of the electricity used to power home electronics is consumed while the products are turned off. Electronic devices account for 8 percent of home energy use, cutting this “phantom load” in half by unplugging seldom-used devices could save approximately $40 per year, and reduce CO2 emissions by 0.17 metric tons. Totals: CO2 Emissions from typical Haverford Residence: 7.62 metric tons. Savings from measures outlined above: 1.05 metric tons. Percent Reduction: 13.8% Congratulations! You have met the 10 Percent Challenge! You spent approximately $150 to save about $320 annually. Use the EPA Personal Emissions Calculator to get figures specific to your home: http://www.epa.gov/climatechange/emissions/ind_calculator.html

Haverford Township Climate Action Plan Page 57 of 96
7.1.2 Public Climate Change Outreach and Education Campaign
Measure Status: CO2e Savings: Energy Savings: Estimated Implementation
Cost:
Payback Period:
Proposed Unknown Unknown $10,000 Not Applicable Effective engagement of the public is critical to the successful implementation of the 10 Percent Challenge. The Township has an important role in public outreach and education to drive the 10 Percent Challenge. For the Challenge to be successful, residents must first and foremost be made aware of the initiative. There are a number of existing mediums by which the Township can publicize the program, including inserts in tax bills, public displays, informational booths at Haverford Township Day, press coverage, the Township website, inclusion in Board of Commissioners newsletters, and through the Township and School District TV channels. Disseminating the message through a wide array of mediums ensures that it reaches the largest audience possible. Additionally, the Township could partner with existing environmental education organizations and regional entities that have the materials and experience needed to spread the message. The second, and parallel, component of the 10 Percent Challenge is education. The outreach section identifies mediums by which to describe to the public what the Challenge is, but the Township must also provide educational information on how residents can meet the Challenge. There are two basic ways to deliver these educational messages. The first is through the same mediums (newsletters, website, etc.) used to publicize the Challenge. The second is through events, such as seminars, lecture series, or demonstrations where residents would have a chance to hear from experts, local vendors, or residents who have met the Challenge to get in-depth guidance regarding steps they can take in their home or workplace. In addition to coordinating education and outreach, the Township should create a mechanism to track the success of the 10 Percent Challenge. For instance, the Township website could contain a list of items needed to achieve the 10 Percent Challenge along with coupons redeemable at a list of local vendors who carry, for example, compact fluorescent light bulbs. The website could feature a short questionnaire that needs to be filled out prior to the printing of coupons, or it could simply track the number of coupons printed for each item. An approach such as this creates a synergy that is beneficial to everyone – residents save money on energy, local businesses are supported, and the Township is able to track the progress of the 10 Percent Challenge. Greenhouse gas emissions reductions and energy savings from community outreach and education are not easily quantified. However, efforts to educate the public about the impacts and causes of climate change and the opportunities to reduce individual energy consumption can have a significant impact on reducing the Townships overall emissions. The administration of a program such as the one outlined above could become the responsibility of a Sustainability Coordinator/Green Team or could fall under the purview of Township employees who regularly conduct outreach to the public. The following outreach and education measures are grouped according to the framework outlined above. The measures outlined under each heading do not represent an exhaustive list, but instead reflect the outreach and education measures the Haverford Action Planning Stakeholders prioritized as being the most effective.
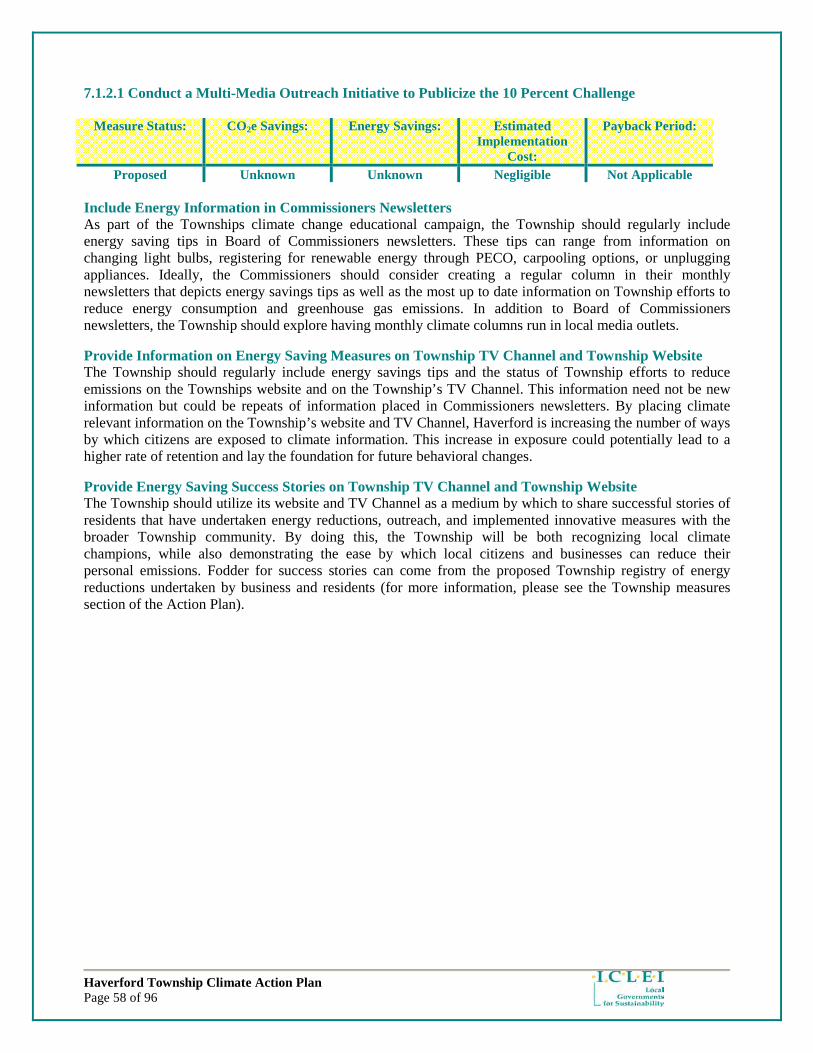
Haverford Township Climate Action Plan Page 58 of 96
7.1.2.1 Conduct a Multi-Media Outreach Initiative to Publicize the 10 Percent Challenge
Measure Status: CO2e Savings: Energy Savings: Estimated Implementation
Cost:
Payback Period:
Proposed Unknown Unknown Negligible Not Applicable Include Energy Information in Commissioners Newsletters As part of the Townships climate change educational campaign, the Township should regularly include energy saving tips in Board of Commissioners newsletters. These tips can range from information on changing light bulbs, registering for renewable energy through PECO, carpooling options, or unplugging appliances. Ideally, the Commissioners should consider creating a regular column in their monthly newsletters that depicts energy savings tips as well as the most up to date information on Township efforts to reduce energy consumption and greenhouse gas emissions. In addition to Board of Commissioners newsletters, the Township should explore having monthly climate columns run in local media outlets.
Provide Information on Energy Saving Measures on Township TV Channel and Township Website The Township should regularly include energy savings tips and the status of Township efforts to reduce emissions on the Townships website and on the Township’s TV Channel. This information need not be new information but could be repeats of information placed in Commissioners newsletters. By placing climate relevant information on the Township’s website and TV Channel, Haverford is increasing the number of ways by which citizens are exposed to climate information. This increase in exposure could potentially lead to a higher rate of retention and lay the foundation for future behavioral changes.
Provide Energy Saving Success Stories on Township TV Channel and Township Website The Township should utilize its website and TV Channel as a medium by which to share successful stories of residents that have undertaken energy reductions, outreach, and implemented innovative measures with the broader Township community. By doing this, the Township will be both recognizing local climate champions, while also demonstrating the ease by which local citizens and businesses can reduce their personal emissions. Fodder for success stories can come from the proposed Township registry of energy reductions undertaken by business and residents (for more information, please see the Township measures section of the Action Plan).

Haverford Township Climate Action Plan Page 59 of 96
7.1.2.2 Conduct Educational Initiatives to Support the 10 Percent Challenge
Measure Status: CO2e Savings: Energy Savings: Estimated Implementation
Cost:
Payback Period:
Proposed Unknown Unknown Varies Not Applicable Organize a Green Building Educational Forum for Trade Professionals and Contractors Given that buildings emit approximately 53.5 percent of community-wide emissions in Haverford, the Township should explore partnering with relevant organizations to offer green building educational forums for design and trade professions and contractors. These forums could be held throughout the year with each forum focusing on specific issues of relevance for trade professionals. Educated local professionals will have an impact on the 10 Percent Challenge because they will be better equipped to advise homeowners about energy efficient home improvements. To help offset the cost of these forums, the Township could partner with local universities, relevant trade organizations, and the Chamber of Commerce where applicable. Examples of topics that could potentially be discussed at the forums include: EPA Energy STAR Green Building Ordinance; the U.S. Green Building Council’s LEED system; how to do a ‘green’ retrofit of an existing home; where to purchase ‘green’ building materials, and how to educate residents about existing ‘green’ building options. Utilize School Auditoriums for a Lecture Series for Residents This series would provide a forum where residents would have a chance to hear from experts, local vendors, or residents who have met the 10 Percent Challenge and to get in-depth guidance regarding steps they can take in their home or workplace.
Organize a Private Sector Recognition Program In order to encourage energy efficiency and emissions reduction measures from the private sector, Haverford Township should explore options for creating a private sector recognition program. The recognition program will strive to highlight positive private sector leaders who are committed to helping the Township achieve its climate protection goals. As part of the recognition program, the Township needs to create a metric and decision criteria that can be used to evaluate potential candidates. The Haverford Green Team can be responsible for analyzing all submissions and for the selection of award winners. The annual awarding of the private sector ‘Green” awards could be done as part of the Haverford Township Day celebration.
The Township should also consider the creation of a logo or branding campaign that all award receipts can prominently display in their place of business. This would allow businesses to highlight their award while also demonstrating to the community that the identified business is considered a local ‘green’ champion.
Tours of Energy Efficient Homes/Demonstration Projects Tours of existing energy efficient homes or specific energy efficiency/alternative energy projects can provide insight into the array of options that individuals can undertake to reduce their energy consumption. Additionally, by demonstrating what other residents are doing, the Township is able to highlight local leadership and to reiterate the ease by which energy reduction measures can be implemented. This measure also requires very little financial resources as it is a passive measure designed to focus on exposure to emissions reduction strategies as opposed to direct behavioral change. Selection of energy efficient demonstration projects can come from the registry of home or business emissions reductions measures that the Township is currently contemplating (for more details on the registry, please see the Township measures section of this report).

Haverford Township Climate Action Plan Page 60 of 96
7.1.2.3 Work with Schools to Incorporate Climate into Service Projects
Measure Status: CO2e Savings: Energy Savings: Estimated Implementation
Cost:
Payback Period:
Proposed 2 metric tons 78 MMBtu Unknown Unknown
Haverford Township should continue to collaborate with the Haverford School District to help ensure that climate information is properly integrated into both school district operations and the educational curriculum. One way to achieve these goals is by working with local schools to provide an opportunity for Seniors to undertake an analysis of their personal energy usage as part of their Senior-year service projects. The service project would focus on having students analyze their home or neighborhood energy use as well as identifying and implementing energy reduction measures (household climate action plan).
The school district and the Township can work with students to help identify easy to implement measures that will reduce household energy consumption. Additionally, Seniors can be encouraged to share their stories with their peers and to formally present their results to students in other years. An award program can be created to recognize the students that conduct the most thorough greenhouse gas inventory or those that create the most creative household climate action plan.
The cost savings and emissions reductions associated with this measure conservatively assume that 5 percent of high school seniors (23 students) will do a service project that will cut the energy usage of a single household by 5 percent. Overall, the residential sector used approximately 1,224,530 MMBtu of energy in 2005, and Haverford contains 18,061 households. Therefore, energy use averaged approximately 68 MMBtu per household. A 5 percent savings per household (approximately 3.4 MMBtu) across 23 households would result in a total savings of 78 MMBtu. ICLEI’s CACP software was used to determine the impact of an energy savings of 78 MMBtu. Cutting energy use by 78 MMBtu would result in an emissions reduction of 2 metric tons CO2e.
Co-Benefits
● Provides education about climate change and potential solutions on a local level. ● Allows for potential engagement from a family/household perspective. ● Provides field relevant training to individuals, making them better prepared for a potential career in the
climate change sector.
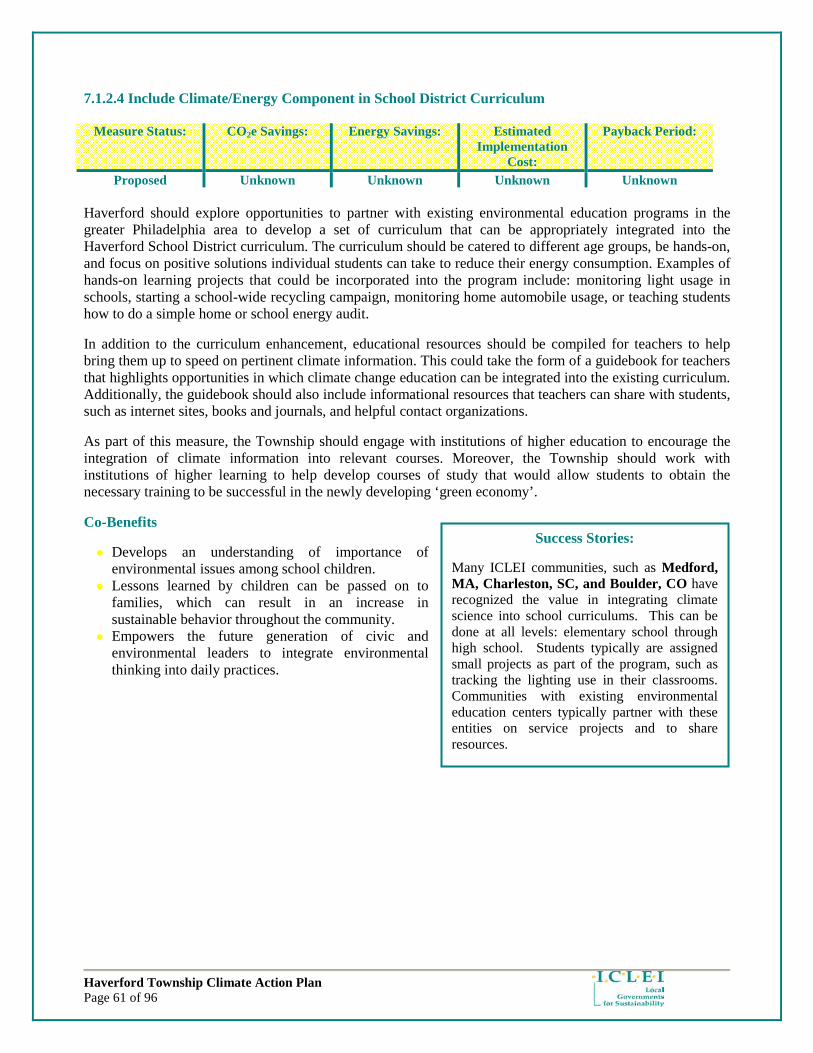
Haverford Township Climate Action Plan Page 61 of 96
Success Stories:
Many ICLEI communities, such as Medford, MA, Charleston, SC, and Boulder, CO have recognized the value in integrating climate science into school curriculums. This can be done at all levels: elementary school through high school. Students typically are assigned small projects as part of the program, such as tracking the lighting use in their classrooms. Communities with existing environmental education centers typically partner with these entities on service projects and to share resources.
7.1.2.4 Include Climate/Energy Component in School District Curriculum
Measure Status: CO2e Savings: Energy Savings: Estimated Implementation
Cost:
Payback Period:
Proposed Unknown Unknown Unknown Unknown Haverford should explore opportunities to partner with existing environmental education programs in the greater Philadelphia area to develop a set of curriculum that can be appropriately integrated into the Haverford School District curriculum. The curriculum should be catered to different age groups, be hands-on, and focus on positive solutions individual students can take to reduce their energy consumption. Examples of hands-on learning projects that could be incorporated into the program include: monitoring light usage in schools, starting a school-wide recycling campaign, monitoring home automobile usage, or teaching students how to do a simple home or school energy audit.
In addition to the curriculum enhancement, educational resources should be compiled for teachers to help bring them up to speed on pertinent climate information. This could take the form of a guidebook for teachers that highlights opportunities in which climate change education can be integrated into the existing curriculum. Additionally, the guidebook should also include informational resources that teachers can share with students, such as internet sites, books and journals, and helpful contact organizations.
As part of this measure, the Township should engage with institutions of higher education to encourage the integration of climate information into relevant courses. Moreover, the Township should work with institutions of higher learning to help develop courses of study that would allow students to obtain the necessary training to be successful in the newly developing ‘green economy’.
Co-Benefits
● Develops an understanding of importance of environmental issues among school children.
● Lessons learned by children can be passed on to families, which can result in an increase in sustainable behavior throughout the community.
● Empowers the future generation of civic and environmental leaders to integrate environmental thinking into daily practices.
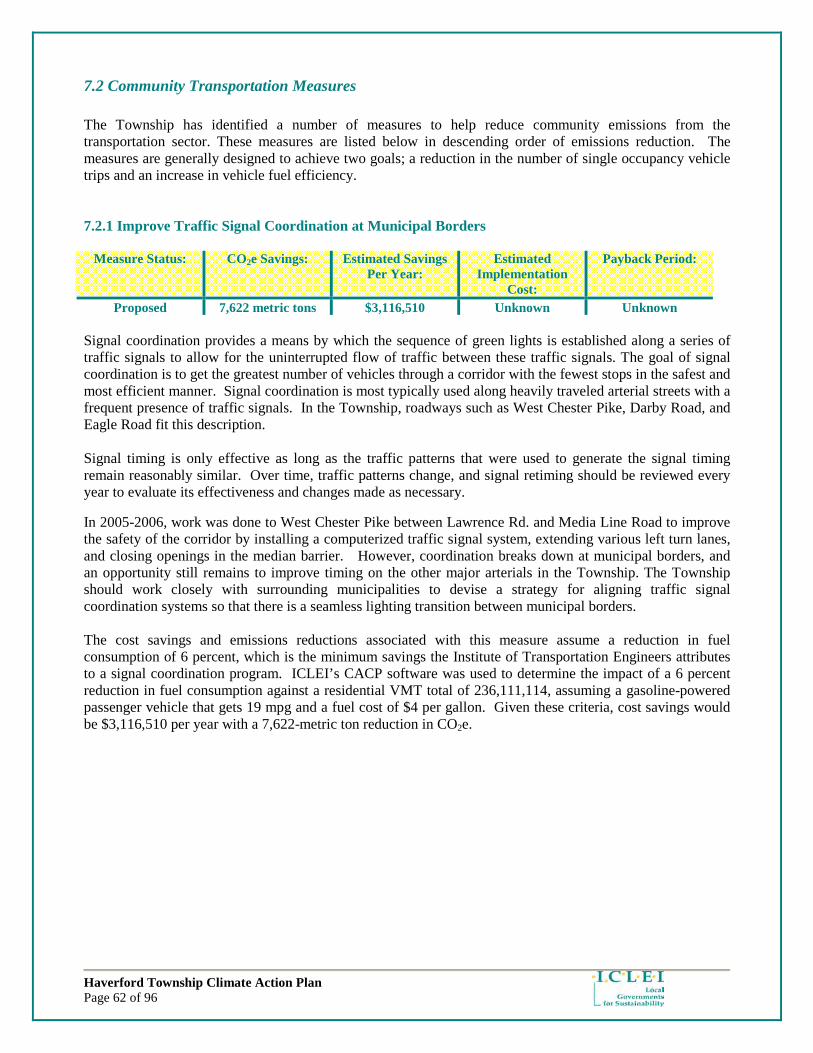
Haverford Township Climate Action Plan Page 62 of 96
7.2 Community Transportation Measures
The Township has identified a number of measures to help reduce community emissions from the transportation sector. These measures are listed below in descending order of emissions reduction. The measures are generally designed to achieve two goals; a reduction in the number of single occupancy vehicle trips and an increase in vehicle fuel efficiency. 7.2.1 Improve Traffic Signal Coordination at Municipal Borders
Measure Status: CO2e Savings: Estimated Savings Per Year:
Estimated Implementation
Cost:
Payback Period:
Proposed 7,622 metric tons $3,116,510 Unknown Unknown Signal coordination provides a means by which the sequence of green lights is established along a series of traffic signals to allow for the uninterrupted flow of traffic between these traffic signals. The goal of signal coordination is to get the greatest number of vehicles through a corridor with the fewest stops in the safest and most efficient manner. Signal coordination is most typically used along heavily traveled arterial streets with a frequent presence of traffic signals. In the Township, roadways such as West Chester Pike, Darby Road, and Eagle Road fit this description. Signal timing is only effective as long as the traffic patterns that were used to generate the signal timing remain reasonably similar. Over time, traffic patterns change, and signal retiming should be reviewed every year to evaluate its effectiveness and changes made as necessary.
In 2005-2006, work was done to West Chester Pike between Lawrence Rd. and Media Line Road to improve the safety of the corridor by installing a computerized traffic signal system, extending various left turn lanes, and closing openings in the median barrier. However, coordination breaks down at municipal borders, and an opportunity still remains to improve timing on the other major arterials in the Township. The Township should work closely with surrounding municipalities to devise a strategy for aligning traffic signal coordination systems so that there is a seamless lighting transition between municipal borders. The cost savings and emissions reductions associated with this measure assume a reduction in fuel consumption of 6 percent, which is the minimum savings the Institute of Transportation Engineers attributes to a signal coordination program. ICLEI’s CACP software was used to determine the impact of a 6 percent reduction in fuel consumption against a residential VMT total of 236,111,114, assuming a gasoline-powered passenger vehicle that gets 19 mpg and a fuel cost of $4 per gallon. Given these criteria, cost savings would be $3,116,510 per year with a 7,622-metric ton reduction in CO2e.

Haverford Township Climate Action Plan Page 63 of 96
Sample SEPTA card.
7.2.2 Promote TransitChek to Transit-Accessible Employers
Measure Status: CO2e Savings: Estimated Savings Per Year:
Estimated Implementation
Cost:
Payback Period:
Proposed 672 metric tons $275,000 Unknown Unknown TransitChek is a commuter benefit program employers offer to their employees. Most companies offer TransitChek through a pre-tax payroll deduction. Employees can set aside up to $115 per month or $1380 a year to pay for commuting on public transit before taxes are taken out. Federal income or FICA taxes are not paid on these dollars. TransitChek vouchers can be redeemed to purchase fare materials on all regional public transit and vanpool providers. Despite the ever-increasing geographic dispersion of jobs throughout the region, 5,228 of Haverford Township’s 23,700 commuters still travel into Philadelphia for work each day.15 Presumably, a significant number of these commuters could use transit. Haverford Township can educate residents about TransitChek, who can then in turn lobby their employers to enroll in the program. Also, Haverford could work with local employers to help them enroll, while recognizing the regional nature of employment and the fact that most residents’ work outside Township borders. The cost savings and emissions reductions associated with this measure assume that 100 households (.0055% of households) will participate in a TransitChek program. This would mean a VMT reduction of 1,307,300 miles. ICLEI’s CACP software was used to determine the impact of a VMT reduction of 1,307,300 against a residential VMT total of 236,111,114, assuming a gasoline-powered passenger vehicle that gets 19 mpg and a fuel cost of $4 per gallon. Given these criteria, cost savings would be $275,000 per year with a 672-metric ton reduction in CO2e.
15 U.S. Census, 2000. Residence MCD/County to Workplace MCD/County Flows for Pennsylvania (County Names CL - L): 2000
Haverford Township Climate Action Plan Page 64 of 96
DVRPC’s Share-a-Ride program
7.2.3 Promote Existing Regional Carpooling Programs such as Share A Ride
Measure Status: CO2e Savings: Estimated Savings Per Year:
Estimated Implementation
Cost:
Payback Period:
Proposed 74 metric tons $30,000 Unknown Unknown The Share-A-Ride program is a free computerized service maintained by the Delaware Valley Regional Planning Commission that could potentially match commuters with convenient transit services, car pools, vanpool groups, and even walking and bicycling opportunities. Additionally, employers can use the program to locate matches for their employees. The Share-A-Ride program is a way for Haverford to promote ride sharing and carpooling without incurring significant expenses. Of Haverford Township’s approximately 23,700 daily commuters, 15,307 are either remaining in Haverford (3,668) or traveling to Philadelphia (5,228), Lower Merion (3,493), Radnor (1,255), Upper Darby (899) and Marple (764).16 Roughly two thirds of commutes concentrated in such a relatively small geographic area suggest large untapped potential for carpooling. The cost savings and emissions reductions associated with this measure assume that 50 people will participate in Share-A-Ride. Furthermore, it is assumed these 50 people would carpool with each other 3 times a week, 12 months a year, traveling round trip of 20 miles. This would equate to a VMT reduction of 144,000 miles. ICLEI’s CACP software was used to determine the impact of a VMT reduction of 144,000 against a residential VMT total of 236,111,114, assuming a gasoline-powered passenger vehicle that gets 19 mpg and a fuel cost of $4 per gallon. Given these criteria, cost savings would be $30,000 per year with a 74-metric ton reduction in CO2e. More Information on DVRPC's Ride-A-Share program can be found by contacting the Office of Commuter Benefits, 215-592-1800.
16 U.S. Census, 2000. Residence MCD/County to Workplace MCD/County Flows for Pennsylvania (County Names CL - L): 2000

Haverford Township Climate Action Plan Page 65 of 96
7.2.4 Enhance Pedestrian Safety and Access to Sidewalks and Bike Paths, and Review Existing Ordinances to Identify Barriers for Bike and Pedestrian Users
Measure Status: CO2e Savings: Estimated Savings Per Year:
Estimated Implementation
Cost:
Payback Period:
Proposed 15 metric tons $6,000 Unknown Unknown Haverford Township’s many neighborhoods generally have interconnected street grids, excellent sidewalk coverage and relatively low traffic volumes, making for a safe and pleasant environment for pedestrians and cyclists. However, pedestrian and bicycle movement from neighborhoods to businesses and institutional areas often involves crossing major thoroughfares such as Darby Road or Eagle Road, which can be dangerous and intimidating. By making targeted intersection improvements, upgrading sidewalks, and designating bike routes, the Township can facilitate the safe and effective use of non-motorized forms of transportation. As part of this measure, the Township should undertake an updated survey that determines where the heaviest concentrations of bicycle and pedestrian activity occur and plan upgrades accordingly. The Township Planning Commission or other groups like the EAC and Green Team could invite suggestions from residents to explore which streets might be improved to increase bicycle and pedestrian access. One means of funding these enhancements is by developing a Safe Routes to School program. The Safe Routes to School program is a national program that works to encourage and enable children to safely walk and bike to school. As part of the national budget, Pennsylvania is projected to receive almost 7 million dollars in federal Safe Routes to School funding for 2009. Haverford Township could capitalize on these funds to initiative a Township-wide Safe Routes to School program. The cost savings and emissions reductions associated with this measure assume that 200 residents walk or bike 2 miles, twice a week, nine months out of the year. This would equate to a VMT reduction of 28,000 miles. ICLEI’s CACP software was used to determine the impact of a VMT reduction of 28,000 against a residential VMT total of 236,111,114, assuming a gasoline-powered passenger vehicle that gets 19 mpg and a fuel cost of $4 per gallon. Given these criteria, cost savings would be $6,000 per year with a 15-metric ton reduction in CO2e.

Haverford Township Climate Action Plan Page 66 of 96
7.2.5 Work with Area Businesses to Promote Telecommuting
Measure Status: CO2e Savings: Estimated Savings Per Year:
Estimated Implementation
Cost:
Payback Period:
Proposed 13 metric tons $5,000 $1,000 1 year Telecommuting is essentially working from home. The employment demographics of Haverford Township residents are ideal for telecommuting. According to the 2000 U.S. Census, 50.3 percent of Township residents are employed in “management, professional, and related occupations” and 28.4 percent work in “sales and office occupations”. These job categories are the types of jobs that, given advances in communications technology, are ideal for enhanced participation in telecommuting. The cost savings and emissions reductions associated with this measure assume that 5 businesses, for a total of 100 employees, will telecommute 1 time per month, thereby avoiding a 20 mile round trip commute. This would equate to a VMT reduction of 24,000 miles. ICLEI’s CACP software was used to determine the impact of a VMT reduction of 24,000 against a residential VMT total of 236,111,114, assuming a gasoline-powered passenger vehicle that gets 19 mpg and a fuel cost of $4 per gallon. Given these criteria, cost savings would be $5,000 per year with a 13-ton reduction in CO2e.
7.2.6 Install Bike Racks at Key Destinations Through-out the Township
Measure Status: CO2e Savings: Estimated Savings Per Year:
Estimated Implementation
Cost:
Payback Period:
Proposed Unknown Unknown $500 per rack Unknown Bicycle racks encourage the use of bicycles for neighborhood errands by providing a secure, centralized means for residents to store their bikes while in buildings. Racks can reduce anxiety regarding theft, and thus eliminate a common barrier to increased bicycle use. This measure proposes installing and/or upgrading bike racks at heavily trafficked destinations such as shopping centers/districts, transit stops, schools, and recreation facilities. Racks should be placed in well-lit areas near building entrances. The presence of racks does not by themselves increase the use of bicycles, but along with bike paths, traffic calming, intersection improvements, and other measures, they are an important piece of infrastructure that facilitates alternative transportation modes.
A typical, high capacity bike rack,

Haverford Township Climate Action Plan Page 67 of 96
7.2.7 Create Zoning that Encourages Compact, Walk-able, Mixed Use Development, Promote Transit Access of Haverford Township
Measure Status: CO2e Savings: Estimated Savings Per Year:
Estimated Implementation
Cost:
Payback Period:
Proposed Unknown Unknown Unknown Unknown The Township of Haverford, due to its proximity to Philadelphia and historical development patterns, has some of the best transit access in the region. The Township should promote the advantages of its location not only to current residents, but also use location as a tool to attract new businesses. A large barrier to public transit use is a general unfamiliarity with and apprehension about routes and schedules. The Township could provide education via the Township TV channel and website so that residents are better informed as to what their transportation options are. The Township website could feature links to the SEPTA route planner tool as well as links to the schedules of the various bus routes in the Township, as well as the R100 high speed line. Additionally, the Township should recognize the locational advantage it has as an inner-ring suburb, and create zoning that capitalizes on these advantages by fostering a greater intensity of use near transit hubs. Compact, walkable, mixed-use communities with access to transit generate less VMT than their auto-dependent equivalents, while also stimulating the local economy.
Haverford Township Climate Action Plan Page 68 of 96
7.2.8 Encourage Residents and Commercial Fleet Users to Consider Alternative Fuel Vehicles
Measure Status: CO2e Savings: Estimated Savings Per Year:
Estimated Implementation
Cost:
Payback Period:
Proposed Unknown Unknown Unknown Unknown Alternative fuel vehicles are either vehicles that use non-traditional fuels such as natural gas, propane or biodiesel, or vehicles that have hybrid drive trains. For personal use, hybrid vehicles are the simplest transition to make, as they do not require the development of new fueling infrastructure or even a change in fuel type. However, there are some perception barriers regarding the lifecycle costs and environmental friendliness of hybrids. $4 gasoline has changed hybrid economics substantially; the most efficient models can now pay back their initial premium within 2 to 3 years. Additionally, the fuel savings quickly offsets any minor increase in the energy consumed during the manufacture of a hybrid. Publicizing the counterpoint to these two persistent hybrid misconceptions could help hasten their adoption by Township residents. For fleet users who rely on heavy-duty commercial vehicles to run their business, there are some additional options. B20 biodiesel can cut CO2e emissions by approximately 16 percent, and natural gas can cut CO2e emissions by 25 to 30 percent. Engines typically can be retrofitted to run on natural gas, or new vehicles can be purchased outright. Creative partnerships with PECO and other entities can help to provide the fueling infrastructure for natural gas vehicles. Co-Benefits: ● Air Quality. ● Residents have more disposable income.
Success Story: PECO is fueling all of its approximately 580 utility trucks with a B20 biodiesel fuel blend. The PECO fleet consumes approximately 15,000 gallons of fuel a week and PECO spends more than $5 million a year on fuel for its fleet. Currently PECO’s alternative fuel fleet includes one prototype hybrid bucket truck, 43 hybrid SUVs and seven natural gas powered vehicles. Combined with the 580 trucks using biodiesel, this brings PECO’s alternative vehicle total to more than 630. PECO has contracted with the Energy Cooperative, a local non-profit with members throughout southeastern Pennsylvania, to supply the biodiesel, which is blended with petroleum diesel from Sunoco and delivered to PECO sites.

Haverford Township Climate Action Plan Page 69 of 96
Compact home composting bin
7.3 Recycling and Waste Measures The Township has identified several measures to help reduce community emissions from waste. These measures are denoted below. The measures are generally designed to achieve three goals; an increase in recycling participation in the Township, a reduction in the amount of organic material that enters the waste stream, and a reduction in the amount of household hazardous waste that enters the waste stream.
7.3.1 Encourage Home Composting of Food and Yard Waste to Reduce Demand for Curbside Pickup
Measure Status: CO2e Savings: Estimated Implementation
Cost:
Estimated Cost Savings Per Year:
Payback Period:
Proposed 172 metric tons Unknown Unknown Unknown The purpose of this measure is to divert compostable materials out of the Township’s waste stream. Combined, food and yard waste account for approximately 25 percent of Haverford Township’s 26,018 tons of residential trash in 2005. Delaware County has taken an innovative and progressive approach to composting. The County operates its own Compost Farm which accepts leaves, Christmas trees and yard waste from all 49 municipalities, as well as from their permitted haulers and landscapers. Additionally, Delaware County residents may go to the Compost Farm and receive free topsoil. This is an admirable effort to divert organic waste from landfills, but the Township still has to incur the significant expense in manpower and fuel to collect these materials and transport them to the Compost Farm. From this perspective, it is still worthwhile to encourage on-site composting. Currently, the Recreation Department sponsors bi-annual composting workshops conducted by Penn State University master gardeners. This program could be expanded and evolved to include a waste reduction component. The Health Department would have to be involved in the development of a composting program, as there are currently restrictions on food composting to reduce rodent issues.
The emission reduction associated with this measure assumes that 5 percent of food waste and 25 percent of yard waste would be diverted from the waste stream into composting piles. Total estimated residential waste collected in 2005 was 26,018 tons, and incinerating this trash produced 5,792 metric tons of CO2e. According to EPA statistics, 12.4 percent of residential waste is food waste, and 12.9 percent is yard waste. In Haverford, this equates to 3,226 tons of food waste, generating 668 metric tons of CO2e, and 3,356 tons of yard waste, generating 695 metric tons of CO2e. For food waste, a 5 percent reduction would reduce emissions by 34 metric tons, and for yard waste, a 25 percent reduction would be 139 metric tons CO2e. Total emissions reduction would be 172 metric tons CO2e.

Haverford Township Climate Action Plan Page 70 of 96
7.3.2 Expand Recycling Programs in School Facilities
Measure Status: CO2e Savings: Estimated Implementation
Cost:
Estimated Cost Savings Per Year:
Payback Period:
Proposed 61 metric tons $3,000 Unknown Unknown An aggressive recycling program in schools could have a substantial impact on recycling rates in Haverford Township. There are approximately 5,600 students in the Haverford Township School District, about 11 percent of the Township’s population. Making recycling a habit at school will ingrain positive behavior in students, making recycling a natural part of running a household as they enter adulthood. Also, students can educate their parents about the benefits of recycling thereby helping to increase overall community recycling collections. Students could even play a role in distributing recycling schedules to ensure households know when to put materials out. The cost of this measure as listed above is based on the purchasing of 20 containers at $150 each.
The emission reduction associated with this measure assumes that the 5,600 students in the Haverford Township School District would divert 10 percent of their waste stream to recycling. Total estimated residential waste collected in 2005 was 26,018 metric tons, and incinerating this trash produced 5,792 metric tons of CO2e. Using this figure as a basis, it was determined that the students produced approximately 2,900 tons of trash and 603 metric tons of CO2e. If 10 percent of this trash were diverted to recycling, it could cut waste by 290 tons and CO2e emissions by 61 metric tons.

Haverford Township Climate Action Plan Page 71 of 96
7.3.3 Increase the Number of Recycling Containers in Public Areas Around the Township
Measure Status: CO2e Savings: Estimated Implementation
Cost:
Estimated Cost Savings Per Year:
Payback Period:
Proposed 11 metric tons $4,500 Unknown Unknown This measure recommends the installation of recycling containers in heavily trafficked public areas throughout the Township. Ideal locations would be adjacent to concession stands in Township parks and along streets in business districts. The Township may also consider partnering with businesses such as Wawa and the Manoa Shopping Center to install recycling containers. Public recycling containers are more expensive than the containers proposed for Township facilities because they are designed for outdoor use and provide higher capacity than indoor units. In order to maintain simplicity and encourage compliance, it may be preferable to offer one container for combined glass, plastic and aluminum in public areas. Proper labeling of the recycling container is critical, as is having a trash can next to the recycling container to reduce the tendency for people to throw trash in the recycling container. The cost of this measure as listed above is based on 30 containers at $150 each.
The emission reduction associated with this measure assumes that 2 percent of the population (approximately 1,000 people) would divert 10 percent of their waste stream to recycling. Total estimated residential waste collected in 2005 was 26,018 tons, and incinerating this trash produced 5,792 metric tons of CO2e. Two percent of this waste stream is equal to 520 tons of trash and 108 metric tons of CO2e. If 10 percent of this trash were diverted to recycling, it could cut waste by 52 tons and CO2e emissions by 11 metric tons.
Recycling containers on a street in Florida.
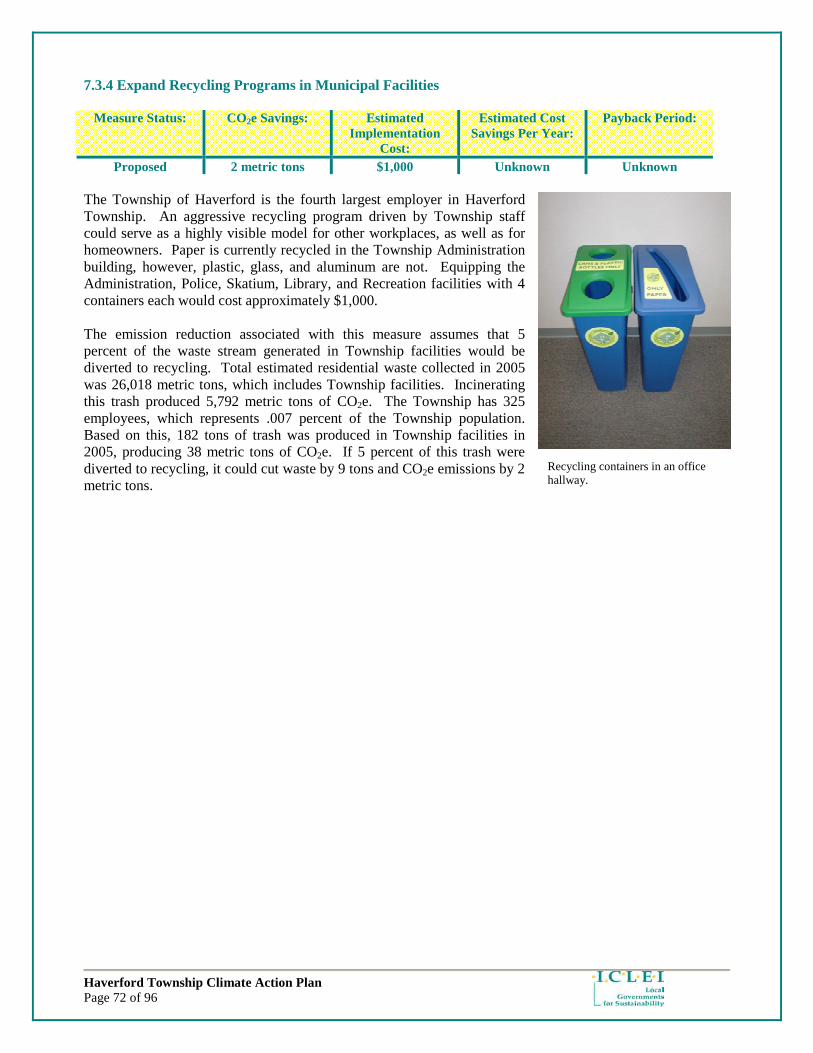
Haverford Township Climate Action Plan Page 72 of 96
7.3.4 Expand Recycling Programs in Municipal Facilities
Measure Status: CO2e Savings: Estimated Implementation
Cost:
Estimated Cost Savings Per Year:
Payback Period:
Proposed 2 metric tons $1,000 Unknown Unknown The Township of Haverford is the fourth largest employer in Haverford Township. An aggressive recycling program driven by Township staff could serve as a highly visible model for other workplaces, as well as for homeowners. Paper is currently recycled in the Township Administration building, however, plastic, glass, and aluminum are not. Equipping the Administration, Police, Skatium, Library, and Recreation facilities with 4 containers each would cost approximately $1,000. The emission reduction associated with this measure assumes that 5 percent of the waste stream generated in Township facilities would be diverted to recycling. Total estimated residential waste collected in 2005 was 26,018 metric tons, which includes Township facilities. Incinerating this trash produced 5,792 metric tons of CO2e. The Township has 325 employees, which represents .007 percent of the Township population. Based on this, 182 tons of trash was produced in Township facilities in 2005, producing 38 metric tons of CO2e. If 5 percent of this trash were diverted to recycling, it could cut waste by 9 tons and CO2e emissions by 2 metric tons.
Recycling containers in an office hallway.
Haverford Township Climate Action Plan Page 73 of 96
7.3.5 Reduce Household Hazardous Waste Through Proper Recycling of Batteries and Compact Florescent Lights
Measure Status: CO2e Savings: Estimated Implementation
Cost:
Estimated Cost Savings Per Year:
Payback Period:
Proposed Unknown Unknown Unknown Unknown The Delaware County Solid Waste Authority, in partnership with the Department of Environmental Protection, is offering a free collection program for recycling compact fluorescent light bulbs (CFLs). While fluorescent lighting yields impressive energy savings compared to incandescent bulbs, they do contain trace amounts of mercury and should therefore be disposed of in a proper fashion. State law requires the recycling of fluorescent lighting. As an offshoot to the Township’s efforts to promote increased use of fluorescents, the Township feels a responsibility to promote the safe disposal of bulbs to help residents and businesses comply with state law. Significant outreach and education will be necessary to ensure bulbs are properly disposed of as there use becomes more widespread. CFLs are accepted at any of the county’s Household Hazardous Waste (HHW) Collection Events. Also accepted at only HHW events are the long, fluorescent tube light bulbs. Additionally, CFLs may be dropped off at the Delaware County Solid Waste Authority’s Office.
According to Sue Cordes, Delaware County’s Recycling Coordinator, there are some potentially more convenient alternatives to CFL collection as part of the Household Hazardous Waste program. Small collection boxes are available, that, when full, can be shipped to an approved disposal center. These boxes could be placed in buildings such as the Library and Township Administration building. The Green Team should work with the County to identify CFL recycling strategies that are appropriate for the Township.
7.3.6 Increase Community Participation in Expanded Recycling Program
Measure Status: CO2e Savings: Estimated Implementation
Cost:
Estimated Cost Savings Per Year:
Payback Period:
Proposed Unknown Unknown Unknown Unknown Presently, Haverford Township ranks third among Delaware County’s 49 municipalities in its rate of recycling collection. The rate of residential recycling is 25 percent, and rises to 31 percent when commercial recycling is included. The Pennsylvania Department of Environmental Protection (DEP) has a recycling participation goal of 35 percent. Attaining this figure may be a good goal for the Township to strive for and attaining it may result in additional grant funding. There are a bevy of options to consider in increasing the recycling participation rate. Each option should be weighed carefully to assess feasibility, revenue implications and public acceptance. DEP grants are available for municipalities who are studying potential changes to their recycling programs. The Green Team along with the Department of Public Works should discuss strategies that can be explored in the Township to increase residential recycling rates.

Haverford Township Climate Action Plan Page 74 of 96
8 Conclusion and Next Steps Climate change is an issue of growing concern for communities across the United States and around the world. Haverford Township has displayed great leadership and foresight in choosing to confront this issue. By reducing the amount of greenhouse gases emitted by our community, Haverford joins hundreds of other American cities in stemming the tide of global warming and the numerous threats associated with it, such as increasingly severe weather events, disrupted agricultural systems, and rising sea levels.
In addition to mitigating the destabilization of the climate and associated effects, Haverford stands to benefit in many other ways from the proposed measures outlined in this report. By undertaking these measures, Haverford Township will save money, improve air quality and public health, enhance community livability, boost the local economy, and demonstrate the Township’s commitment to climate protection.
Meeting Haverford Township’s greenhouse gas emissions reduction target will require both persistence and adaptability. The success of the Plan will be heavily dependent on the Township’s ownership of this document. This will be demonstrated by the approval of the Haverford Climate Action Plan by the Haverford Township Board of Commissioners.
A. Administration and Staffing A key element of an effective climate change action plan is assigning and defining management responsibilities for each of the individual components of the plan. As such the Township has identified the need for the creation of a Township Green Team, to help guide the implementation of measures denoted within this Plan.
B. Financing and Budget The Township should continually look for opportunities to incorporate measures noted in this Plan as part of their annual budgets. Additionally, many of these measures can be included as part of existing practices. Continual review should be undertaken to identify where opportunities for message dissemination and overlap can occur.
In addition, the Township should seek additional funding in the form of state and federal grants and low interest loans to help finance more expensive measures. The Township should also explore partnerships that can help to leverage resources, both financial and staff, to help implement appropriate measures.
C. Developing a Timeline Measures within this Plan are denoted as short or long-term. Short-term measures are measures that the Township or Haverford community can successfully implement by the end of year 2012. Long-term measures are identified as those that should be fully implemented by the end of year 2020. Timelines were assigned based on practicability, administrative support, and technical feasibility. It is highly advised that the Township re-evaluate progress in terms of meeting both their emissions reduction target and implementing all measures identified within this Plan in or before the end of 2012.
D. Public Involvement in the Implementation Process The process of implementing many of the proposed measures in this Climate Action Plan will necessitate the involvement of community stakeholders, including the public at large. Haverford Township will need to explore effective opportunities to involve these stakeholders in the development, review and implementation of this Plan in order to increase community involvement and support. As part of this process, the Township should carefully monitor and document successes and lessons learned as part of the community outreach and education campaign.
Haverford Township Climate Action Plan Page 75 of 96
E. Monitoring The Township should create a system for monitoring the implementation of the enclosed Climate Action Plan and adjusting the Plan as opportunities arise. This should include the adjustment of energy and waste savings numbers from proposed measures as projects are implemented and actual savings are documented. Additionally, greenhouse gas emissions reduction progress should be integrated into other reports Haverford Township is already producing so that the public can regularly monitor the Township’s progress in meeting its emissions reduction target.
F. Re-Inventory Haverford Township is strongly encouraged to update their greenhouse gas emissions inventory as frequently as possible, but no later than 5-years from the baseline year (update in 2010). However, it is strongly advised that the Township monitor emissions levels on a more frequent basis, ideally every year. By frequently updating the Township’s greenhouse gas inventory, progress toward achieving the 30% emissions reduction targets can be monitored. Additionally, updated inventories will provide new information that the Township can use to identify opportunities to integrate new or improved measures into the Township’s Climate Action Plan.

Haverford Township Climate Action Plan Page 76 of 96
Appendix A: Measure Quantification This appendix contains the complete list of measures proposed by the Haverford Climate Initiative Stakeholder Group. Some of the measures denoted below are not included in this version of the Haverford Climate Action Plan. However, they are included here to help the Township in evaluating potential measures when they revisit the success of the Action Plan. Measures that are included as part of this Plan are denoted with a √: Wherever possible, the cost savings, emissions reduction, and reduction in energy use have been calculated. Township Operations: √ Establish Energy Efficiency Standards for Any New Township Facilities: There was no quantification done for this measure, as there were either too many variables or insufficient data to provide an accurate analysis. √ Increase Insulation at Skatium, Both Roof and Walls: The costs savings and emissions reduction associated with this measure assume a 20 percent decrease in heating and cooling costs for the Stakium, which is consistent with the savings expected from building envelope improvements. Total energy costs for the Stakium were $172,989 in 2005. Of this, $46,707 can be attributed to heating and cooling costs. ICLEI’s CACP software was used to determine that if the Skatium’s energy consumption from heating and cooling were reduced 20 percent due to building envelope improvements, cost savings of $6,800 and an emissions reduction of 27 metric tons of CO2e would result. √ Install Programmable Thermostats in Township Buildings: The cost savings and emissions reductions associated with this measure assume a 10 percent drop in heating and cooling costs across all Township facilities. According to the 2007 DOE Buildings Energy Data Book, heating accounts for 14 percent of energy use in commercial facilities and cooling accounts for 13 percent, for a total of 27 percent. Overall, Township facilities used 18,827 MMBtu of energy in 2005, of which 5,083 MMBtu can be attributed to heating and cooling. Cutting this figure by 10 percent would result in a savings of 508 MMBtu. ICLEI’s CACP software was used to determine the impact of a 10 percent reduction in heating and cooling across all Township facilities. At current electricity and natural gas prices, cutting heating and cooling usage by 508 MMBtu would result in a cost savings of $10,800 and an emissions reduction of 74 metric tons CO2e annually. √ Install Computer Shut Down Software: The cost savings and emissions reductions associated with this measure are based on an EPA worksheet designed to calculate the benefits of the EZ-GPO software. Township facilities, including the Haverford Township Free Library, contain approximately 100 computers. Assuming computers enter sleep mode after 5 minutes of inactivity, hibernate after 15 minutes of inactivity, a 40 hour work week, 5 days a week, with 22 vacation days per year, and electricity at 9 cents per kwh, annual savings would be $7,000 and 77,910 kwh, according to EPA. This translates into an emissions reduction of 54 metric tons of CO2e a year. √ Install Occupancy Sensors for Lighting: The cost savings and emissions reductions associated with this measure conservatively assume a 10 percent drop in lighting costs across all Township facilities. According to the 2007 DOE Buildings Energy Data Book, lighting accounts for 26 percent of energy use in commercial facilities. Overall, Township facilities used 18,827 MMBtu of energy in 2005, of which an estimated 4,895 MMBtu can be attributed to lighting. Cutting this figure by 10 percent would result in a savings of 489 MMBtu. ICLEI’s CACP software was used to determine the impact of a 10 percent reduction in lighting costs across all Township facilities. At current electricity prices, cutting lighting usage by 489 MMBtu would result in a cost savings of $10,400 and an emissions reduction of 72 metric tons CO2e annually.

Haverford Township Climate Action Plan Page 77 of 96
√ Switch From T12s to T8s: The cost savings and emissions reductions associated with this measure assume a 40 percent drop in lighting costs and energy across Township facilities currently using T12s, estimated at 40 percent. According to the 2007 DOE Buildings Energy Data Book, lighting accounts for 26 percent of energy use in commercial facilities. Overall, Township facilities used 18,827 MMBtu of energy in 2005, of which an estimated 4,895 MMBtu can be attributed to lighting, and 1,958 MMBtu attributed to fluorescent lighting. A 40 percent cut in fluorescent lighting use would result in a savings of 783 MMBtu. ICLEI’s CACP software was used to determine the impact of a 40 percent reduction in lighting costs in Township facilities currently using fluorescents. At current electricity prices, cutting lighting usage by 783 MMBtu would result in a cost savings of $16,700 and an emissions reduction of 115 metric tons CO2e annually. √ Switch From Incandescent to Fluorescent Lighting: The cost savings and emissions reductions associated with this measure assume a 75 percent drop in lighting costs across Township facilities currently using incandescent lighting, estimated at 60 percent. According to the 2007 DOE Buildings Energy Data Book17, lighting accounts for 26 percent of energy use in commercial facilities. Overall, Township facilities used 18,827 MMBtu of energy in 2005, of which an estimated 4,895 MMBtu can be attributed to lighting, and 2,937 MMBtu attributed to incandescent lighting. A 75 percent cut in incandescent lighting use would result in a savings of 2,202 MMBtu. ICLEI’s CACP software was used to determine the impact of a 75 percent reduction in lighting costs in Township facilities currently using incandescent lights. At current electricity prices, cutting lighting usage by 2,202 MMBtu would result in a cost savings of $47,000 and an emissions reduction of 332 metric tons CO2e annually. √ Establish an Environmentally Preferable Purchasing Policy; Buy Energy Star Electronics and Appliances: The cost savings and emissions reductions associated with this measure assume a 30 percent drop in energy use by electronic devices (electronics, refrigeration, cooking and computers) across all Township facilities. According to the 2007 EIA Buildings Energy Data Book, electronic devices account for 15 percent of energy use in commercial facilities. Overall, Township facilities used 18,827 MMBtu of energy in 2005, of which an estimated 2,824 MMBtu can be attributed to electronic devices. Cutting this figure by 30 percent would result in a savings of 847 MMBtu. ICLEI’s CACP software was used to determine the impact of a 10 percent reduction in lighting costs across all Township facilities. At current electricity prices, cutting lighting usage by 847 MMBtu would result in a cost savings of $21,800 and an emissions reduction of 124 metric tons CO2e annually. √ Building Enveloping: The cost savings and emissions reductions associated with this measure assume a 20 percent drop in heating and cooling costs across all Township facilities. According to the 2007 DOE Buildings Energy Data Book, heating accounts for 14 percent of energy use in commercial facilities and cooling accounts for 13 percent, for a total of 27 percent. Overall, Township facilities used 18,827 MMBtu of energy in 2005, of which 5,083 MMBtu can be attributed to heating and cooling. Cutting this figure by 20 percent would result in a savings of 1,017 MMBtu. ICLEI’s CACP software was used to determine the impact of a 20 percent reduction in heating and cooling costs across all Township facilities. At current electricity and natural gas prices, cutting heating and cooling usage by 1,017 MMBtu would result in a cost savings of $25,400 and an emissions reduction of 149 metric tons CO2e annually.
Switch From Fuel Oil to Natural Gas for Heating in Township Buildings: The cost savings and emissions reductions associated with this measure assume a 36 percent drop in heating costs and a 40 percent drop in heating emissions across all Township facilities. In 2005, Township buildings
17 U.S. Department of Energy, Energy Efficiency and Renewable Energy. http://www.btscoredatabook.net/ This resouce is referenced extensively throughout the remainder of this report, and will be cited as a hyperlink in the text.
Haverford Township Climate Action Plan Page 78 of 96
used 1,897 gallons of fuel oil at a cost of $22,936. Burning this fuel emitted 153 metric tons of CO2e. According to the 2007 Buildings Energy Data Book, heating oil costs $12.09 per million British Thermal Units, while natural gas costs $7.78, a reduction in cost of about 36 percent. And according to the U.S. Energy Information Administration, a high efficiency furnace burning fuel oil would generate 161 pounds of carbon dioxide per million British Thermal Units, nearly 40 percent more than the 117 pounds of carbon dioxide emitted burning pipeline natural gas. If all Township buildings currently using fuel oil (Library, the Grange Estate, and Public Works) were converted to natural gas, emissions would be reduced approximately 38 metric tons of CO2e annually and cost savings would be about $8,175. √ LED Exit Signs and Fire Alarms in Township Buildings: The cost savings and emissions reductions associated with this measure assume that 12 exit signs are replaced with high-efficiency LED models, saving 250 kWh per unit per year, for an annual total savings of 3,000 kWh. ICLEI’s CACP software was used to determine the impact of a 3,000 kWh reduction in electricity usage across all Township facilities. At current electricity prices, cutting lighting usage by 3,000 kWh would result in a cost savings of $420 and an emissions reduction of 2 metric tons CO2e annually.
Purchase Hybrid Vehicles: The cost savings and emissions reductions associated with this measure assume that one Ford Crown Victoria is replaced with a Chevy Malibu hybrid. Based on a fuel cost of $3.50 per gallon and consumption of 13 mpg for the Ford and 28 mpg for the Chevy, at 15,000 miles per year the Malibu would save $2,207 and use 631 fewer gallons of fuel. Using ICLEI’s CACP software it was determined that reducing gasoline consumption by 631 gallons would yield a CO2e reduction of 6 metric tons.
Use of Solar Hot Water Heater at Skatium: The cost savings and emissions reductions associated with this measure assume a 60 percent drop in energy consumed to heat water at the Skatium. According to the 2007 DOE Buildings Energy Data Book, water heating accounts for 8 percent of energy use in commercial facilities. Overall, the Skatium used 8,242 MMBtu of energy in 2005, of which 626 MMBtu can be attributed to heating and cooling. Cutting this figure by 60 percent would result in a savings of 376 MMBtu. ICLEI’s CACP software was used to determine the impact of a 60 percent reduction in energy consumed to heat water at the Skatium. At current natural gas prices, cutting heating and cooling usage by 376 MMBtu would result in a cost savings of $4,500 and an emissions reduction of 21 metric tons CO2e annually.
Encourage Boiler and Chiller Replacements with Energy Star Products: The cost savings and emissions reductions associated with this measure assume a 20 percent drop in heating and cooling costs across all Township facilities. According to the 2007 DOE Buildings Energy Data Book, heating accounts for 14 percent of energy use in commercial facilities and cooling accounts for 13 percent, for a total of 27 percent. Overall, Township facilities used 18,827 MMBtu of energy in 2005, of which 5,083 MMBtu can be attributed to heating and cooling. Cutting this figure by 20 percent would result in a savings of 1,017 MMBtu. ICLEI’s CACP software was used to determine the impact of a 20 percent reduction in heating and cooling costs across all Township facilities. At current electricity and natural gas prices, cutting heating and cooling usage by 1,017 MMBtu would result in a cost savings of $25,400 and an emissions reduction of 149 metric tons CO2e annually.
Solar PV Panels on High School: The cost savings and emissions reductions associated with this measure assume a 100 percent drop in electricity usage for at the High School. A tool provided on the FindSolar.com website was used, inputting building location, type, estimated monthly average electricity usage, and current electricity rates. Installing solar on the High School roof was estimated to save $720,000 a year and cut CO2e emissions by 1,421 metric tons.
Solar PV on Township Building:

Haverford Township Climate Action Plan Page 79 of 96
The cost savings and emissions reductions associated with this measure assume a 100 percent drop in electricity usage for at the Township Administration building. A tool provided on the FindSolar.com website was used, inputting building location, type, estimated monthly average electricity usage, and current electricity rates. Installing solar on the Township Administration building roof was estimated to save $30,000 a year and cut CO2e emissions by 67 metric tons. √ Create an Urban Tree-planting Program: The emissions reductions associated with this measure assume a 5 percent increase in the tree canopy in Haverford Township. According to DVRPC land use data, 636 acres in the Township are classified as “wooded” comprising 10 percent of land area. Increasing the canopy 5 percent would mean an additional 31.8 acres of trees. It is recommended that approximately 400 trees per acre be planted for a total of 12,720 trees. This number of trees, at $20 a tree, would cost $254,400 to purchase. According to EPA, a medium growth coniferous tree, planted in an urban setting and allowed to grow for 10 years, sequesters 23.2 pounds of carbon. This estimate is based on the following assumptions:
• The medium growth coniferous trees are raised in a nursery for one year until they become 1 inch in diameter at 4.5 feet above the ground (the size of tree purchased in a 15-gallon container).
• The nursery-grown trees are then planted in a suburban/urban setting; the trees are not densely planted. • The calculation takes into account "survival factors" developed by U.S. DOE (1998). For example, after 5
years (one year in the nursery and 9 in the urban setting), the probability of survival is 68 percent; after 10 years, the probability declines to 59 percent. For each year, the sequestration rate (in lb per tree) is multiplied by the survival factor to yield a probability-weighted sequestration rate. These values are summed for the 10-year period, beginning from the time of planting, to derive the estimate of 23.2 pounds of carbon per tree.
Look into Energy Service Companies for Township Buildings: There was no quantification done for this measure, as there were either too many variables or insufficient data to provide an accurate analysis.
Undertake an Inventory of Streetlights: There was no quantification done for this measure, as there were either too many variables or insufficient data to provide an accurate analysis. √ Replace Existing Streetlights with LED Models: The cost savings and emissions reductions associated with this measure assume a 50 percent drop in energy usage for street lighting. Haverford could cut energy usage for lighting by approximately one million kWh by switching entirely to LED streetlights. Cost savings would be approximately $196,000 annually, and CO2e savings would be approximately 500 metric tons annually.
Install Solar Lighting for Parks and Parking Lots: The cost savings and emissions reductions associated with this measure assume a 100 percent drop in energy usage for lighting in parks and parking lots. Lighting in parks and parking lots cost $9,903 in 2005 while emitting 33 metric tons of CO2e.
Install Solar Panels on Roof of Skatium: The cost savings and emissions reductions associated with this measure assume a 45 percent drop in electricity usage for at the Skatium. The inventory identified that in 2005, $114,911 was spent in electricity at the Skatium. A tool provided on the FindSolar.com website was used, inputting building location, type, estimated monthly average electricity usage, and current electricity rates. Installing solar on the Skatium roof was estimated to have of net installation cost of between $1.5 million to $2.2 million covering 80 percent of the Skatium roof. This would save $46,000 to $121,000 a year and would cut CO2e emissions by 252 metric tons per year.

Haverford Township Climate Action Plan Page 80 of 96
√ Undertake Building Retro-Commissioning: The cost savings and emissions reductions associated with this measure assume a 15 percent drop in energy costs across all Township facilities per the study above. Total energy costs for all Township facilities were $441,258 in 2005, and a 15 percent reduction in this cost would be approximately $66,200. Total CO2e emissions for all Township facilities were 2,028 metric tons in 2005, and a 15 percent reduction in these emissions would be approximately 304 metric tons CO2e. This measure does not take into account retro-commissioning of School District buildings. √ Run an Employee Climate Change Education Campaign and Create Municipal Green Team: There is no quantification associated with this measure; reductions achieved by the Green Team have been captured in the quantification of other measures.
Have Police on Bike Patrols: The cost savings and emissions reductions associated with this measure assume a 25 percent reduction in patrol car usage for each officer who uses a bicycle to patrol. The typical patrol car is used approximately 25,000 miles per year with a fuel efficiency of 13 mpg. A 25 percent reduction in vehicle use would yield a savings of 480 gallons, and a cost savings $1,923 assuming a fuel cost of $4 per gallon. Using ICLEI’s CACP software it was determined that reducing gasoline consumption by 480 gallons would yield a CO2e reduction of 4 metric tons.
Purchase Copiers and Printers that are Capable of Default Duplexing: The cost savings and emissions reductions associated with this measure are based on a Department of Energy analysis that found annual energy use for a duplexing machine is 144 kWh compared to 370 kWh for a standard model. This represents nearly a 65 percent decrease in energy use, for an approximately annual savings of $40 per unit at current electricity rates. An emissions savings for this measure was not quantified because printer replacement and networking of printers’ means this measure is unlikely to result on one-for-one swaps of equipment.
Revolving Energy Fund: There was no quantification done for this measure, as there were either too many variables or insufficient data to provide an accurate analysis.
Purchase Hybrid School Buses: There was no quantification done for this measure, as there were either too many variables or insufficient data to provide an accurate analysis. √ Develop a Sustainable Parks Policy: There was no quantification done for this measure, as there were either too many variables or insufficient data to provide an accurate analysis. √ Hold Vehicle Maintenance Clinics for Township Employees to Improve Vehicle Efficiency and Provide Driver Education. Reward Drivers Whose Vehicle Efficiency Improves: The costs savings and emissions reduction associated with this measure assume a 5 percent increase in vehicle fleet fuel efficiency as a result of the training. The Township spent $157,796 on 93,476 gallons of gasoline in 2005, and $157,892 on 80,970 gallons of diesel fuel. Total fuel expenditures in 2005 were $315,688. A 5 percent reduction in 2005 costs would yield a savings of approximately $16,000. Due to the wide variety of vehicles in use, it was not possible to accurately calculate savings at current fuel prices, although a doubling of costs savings would not be unreasonable. ICLEI’s CACP software was used to determine that the impact of a 5 percent reduction in fuel consumption across the Township vehicle fleet would result in an emissions reduction of 80 metric tons CO2e annually.

Haverford Township Climate Action Plan Page 81 of 96
√ Create a Green Fleets Program: The costs savings and emissions reduction associated with this measure assume a 25 percent increase in the fuel efficiency of gasoline-powered vehicles in the fleet once the program is fully implemented. In 2005, the Township spent $157,796 on 93,476 gallons of gasoline. The Township’s approximately 75 gasoline-powered vehicles emitted an estimated 914 metric tons of CO2e in 2005. A 25 percent increase in fuel efficiency would cut CO2e emissions by approximately 230 metric tons and fuel expenses by $39,000. Given current fuel prices, savings could be as much as twice the stated figure.
Join Smart Power: There was no quantification done for this measure, as there were either too many variables or insufficient data to provide an accurate analysis. √ Businesses/Homeowners Can Register Improvements w/ Township to Receive Recognition: There was no quantification done for this measure, as there were either too many variables or insufficient data to provide an accurate analysis.
Use HUD Money for Efficiency Programs: The cost savings and emissions reductions associated with this measure assume a 50 percent savings in energy use in 10 low-income households, or 41.5 MMBtu per household based on Township averages. An overall savings of 415 MMBtu would result. ICLEI’s CACP software was used to determine the impact of an energy savings of 415 MMBtu. At current electricity and natural gas prices, cutting by 415 MMBtu would result in a cost savings of $13,700 and an emissions reduction of 52 metric tons CO2e annually.
Establish Carpooling Program for Township Employees: The cost savings and emissions reductions associated with this measure assumes that 20 Township employees will carpool 12 times per month, 12 months a year, thereby avoiding a 10 mile round trip commute. This would equate to a VMT reduction of 28,800 miles. ICLEI’s CACP software was used to determine the impact of a VMT reduction of 28,800 against a residential VMT total of 236,111,114, assuming a gasoline-powered passenger vehicle that gets 19 mpg and a fuel cost of $4 per gallon. Given these criteria, cost savings would be $6,000 per year with a 13-ton reduction in CO2e.
Establish Telecommute Option for Township Employees who could Work From Home: The cost savings and emissions reductions associated with this measure assumes that 20 Township employees will telecommute 1 time per month, 12 months a year, thereby avoiding a 10 mile round trip commute. This would equate to a VMT reduction of 2,400 miles. ICLEI’s CACP software was used to determine the impact of a VMT reduction of 2,400 against a residential VMT total of 236,111,114, assuming a gasoline-powered passenger vehicle that gets 19 mpg and a fuel cost of $4 per gallon. Given these criteria, cost savings would be $500 per year with a 1-ton reduction in CO2e. Community Measures: Buildings: √ Utilize Programmable Thermostats: The cost savings and emissions reductions associated with this measure assume a 10 percent drop in heating and cooling costs in 10 percent of Township households. According to the 2007 DOE Buildings Energy Data Book, heating accounts for 34 percent of residential energy use and cooling accounts for 12 percent, for a total of 46 percent. Overall, the residential sector used approximately 1,224,530 MMBtu of energy in 2005, of which 563,284 MMBtu can be attributed to heating and cooling. Cutting this figure by 10 percent would result in a savings of 5,633 MMBtu. ICLEI’s CACP software was used to determine the impact of a 10 percent reduction in heating and cooling energy use residential emissions. Cutting energy use by 5,633 MMBtu would result in an emissions reduction of 411 metric tons CO2e.

Haverford Township Climate Action Plan Page 82 of 96
√ Unplug Appliances and Power Strips: The cost savings and emissions reductions associated with this measure assume a 30 percent drop in electronics (computers and consumer electronics) costs in 10 percent of Township households. According to the 2007 DOE Buildings Energy Data Book, electronics account for 8 percent of residential energy use. Overall, the residential sector used approximately 1,224,530 MMBtu of energy in 2005, of which 97,962 MMBtu can be attributed to electronics. Cutting this figure by 30 percent in 10 percent of households would result in a savings of 2,939 MMBtu. ICLEI’s CACP software was used to determine the impact of 10 percent of households reducing their electronics usage by 30 percent. Cutting energy use by 2,939 MMBtu would result in an emissions reduction of 503 metric tons CO2e. √ Building Enveloping: The cost savings and emissions reductions associated with this measure assume a 20 percent drop in heating and cooling costs in 10 percent of Township households. According to the 2007 DOE Buildings Energy Data Book, heating accounts for 34 percent of residential energy use and cooling accounts for 12 percent, for a total of 46 percent. Overall, the residential sector used approximately 1,224,530 MMBtu of energy in 2005, of which 563,284 MMBtu can be attributed to heating and cooling. Cutting this figure by 10 percent would result in a savings of 11,266 MMBtu. ICLEI’s CACP software was used to determine the impact of a 10 percent reduction in heating and cooling energy use residential emissions. Cutting energy use by 11,266 MMBtu would result in an emissions reduction of 905 metric tons CO2e.
Encourage 10% of Residents to Perform a Home Energy Audit : There was no quantification done for this measure, as there were either too many variables or insufficient data to provide an accurate analysis. √ Purchase Energy Efficient Home Appliances: The cost savings and emissions reductions associated with this measure assume a 30 percent drop in electronic device energy consumption in 10 percent of Township households. According to the 2007 DOE Buildings Energy Data Book, electronic devices (consumer electronics, refrigerators, washers/dryers, computers, etc) account for 26 percent of residential energy use. Overall, the residential sector used approximately 1,224,530 MMBtu of energy in 2005, of which 318,378 MMBtu can be attributed to electronic devices. Cutting this figure by 30 percent in 10 percent of households would result in a savings of 9,551 MMBtu. ICLEI’s CACP software was used to determine the impact of 10 percent of households reducing their electronic devices usage by 30 percent. Cutting energy use by 9,551 MMBtu would result in an emissions reduction of 1,081 metric tons CO2e.
Purchase Energy Star Heating and Cooling Systems: The cost savings and emissions reductions associated with this measure assume a 20 percent drop in heating and cooling costs in 10 percent of Township households. According to the 2007 DOE Buildings Energy Data Book, heating accounts for 34 percent of residential energy use and cooling accounts for 12 percent, for a total of 46 percent. Overall, the residential sector used approximately 1,224,530 MMBtu of energy in 2005, of which 563,284 MMBtu can be attributed to heating and cooling. Cutting this figure by 10 percent would result in a savings of 11,266 MMBtu. ICLEI’s CACP software was used to determine the impact of a 20 percent reduction in heating and cooling energy use residential emissions. Cutting energy use by 11,266 MMBtu would result in an emissions reduction of 905 metric tons CO2e.
Encourage State Incentives for Energy-Efficient Home Retrofits: There was no quantification done for this measure, as there were either too many variables or insufficient data to provide an accurate analysis. √ CFL Replacement: The cost savings and emissions reductions associated with this measure assume a 75 percent drop in lighting costs in 10 percent of Township households. According to the 2007 DOE Buildings Energy Data Book,

Haverford Township Climate Action Plan Page 83 of 96
lighting heating accounts for 11 percent of residential energy use. Overall, the residential sector used approximately 1,224,530 MMBtu of energy in 2005, of which 134,698 MMBtu can be attributed to lighting. Cutting this figure by 75 percent would result in a savings of 101,024 MMBtu, and if 10 percent of households did the measure a reduction of 10,102 MMbtu would result. ICLEI’s CACP software was used to determine the impact of 10 percent of households reducing their lighting usage by 75 percent. Cutting energy use by 10,102 MMBtu would result in an emissions reduction of 1,143 metric tons CO2e. √ Encourage 10% of Residents to Participate in PECO Wind: The cost savings and emissions reductions associated with this measure assume a 100 percent drop in electricity emissions in 10 percent of Township households. According to ICLEI’s CACP software a 100 percent drop in electricity emissions in 10 percent of Township households would result in a CO2e reduction of 8,430 metric tons.
Research the Impact of Requiring Homes be brought up to Current Energy Code When Significant Renovations are Performed: There was no quantification done for this measure, as there were either too many variables or insufficient data to provide an accurate analysis.
Require Energy Usage Report at Point of Sale for Homes: There was no quantification done for this measure, as there were either too many variables or insufficient data to provide an accurate analysis.
Discounted Permitting Fee for Energy Efficient Construction: The cost savings and emissions reductions associated with this measure assume a 50 percent drop in energy costs in 50 Township households. Overall, the residential sector used approximately 1,224,530 MMBtu of energy in 2005, which averages out to approximately 68 MMBtu per household. Cutting this figure by 50 percent for 50 households would result in a savings of 1,700 MMBtu. ICLEI’s CACP software was used to determine the impact of 50 households reducing their energy usage by 50 percent. Cutting energy use by 1,700 MMBtu would result in an emissions reduction of 256 metric tons CO2e.
Create Zoning that Encourages Compact, Walkable, Mixed-Use Development: There was no quantification done for this measure, as there were either too many variables or insufficient data to provide an accurate analysis. √ Private Sector Awards/Recognition Program – Haverford Township Day: There was no quantification done for this measure, as there were either too many variables or insufficient data to provide an accurate analysis.
Residential Awards/Recognition Program – Haverford Township Day: There was no quantification done for this measure, as there were either too many variables or insufficient data to provide an accurate analysis.
Energy Bond - Home/Business Lien Program: There was no quantification done for this measure, as there were either too many variables or insufficient data to provide an accurate analysis.
Explore Opportunities for Promoting ‘Green-Collar’ J obs: There was no quantification done for this measure, as there were either too many variables or insufficient data to provide an accurate analysis. √ General Outreach/Educational Campaign:

Haverford Township Climate Action Plan Page 84 of 96
There was no quantification done for this measure, as there were either too many variables or insufficient data to provide an accurate analysis. √ Energy Information Included in Commissioner’s Newsletters: There was no quantification done for this measure, as there were either too many variables or insufficient data to provide an accurate analysis. √ Public Information on Energy Saving Measures on Township TV Channel: There was no quantification done for this measure, as there were either too many variables or insufficient data to provide an accurate analysis. √ Energy Savings Success Stories on Township TV Channel: There was no quantification done for this measure, as there were either too many variables or insufficient data to provide an accurate analysis. √ Tours of Energy Efficient Homes/Demonstration Projects: There was no quantification done for this measure, as there were either too many variables or insufficient data to provide an accurate analysis.
Provide Education on Alternative Heating Fuels – Such as Biodiesel: There was no quantification done for this measure, as there were either too many variables or insufficient data to provide an accurate analysis.
Efficiency Competitions Between Wards: There was no quantification done for this measure, as there were either too many variables or insufficient data to provide an accurate analysis. √ Include Climate/Energy Component in School District Curriculum: There was no quantification done for this measure, as there were either too many variables or insufficient data to provide an accurate analysis.
Hold Township Energy Fair: There was no quantification done for this measure, as there were either too many variables or insufficient data to provide an accurate analysis. √ Work with Schools to have Service Projects where Students Analyze Their Home or Neighborhood Energy Use and Implement Emissions Reduction Measures: The cost savings and emissions reductions associated with this measure conservatively assume that 5 percent of high school seniors (23 students) will do a service project that will cut the energy usage of a single household by 5 percent. Overall, the residential sector used approximately 1,224,530 MMBtu of energy in 2005, and Haverford contains 18,061 households. Therefore, energy use averaged approximately 68 MMBtu per household. A 5 percent savings per household (approximately 3.4 MMBtu) across 23 households would result in a total savings of 78 MMBtu. ICLEI’s CACP software was used to determine the impact of an energy savings of 78 MMBtu. Cutting energy use by 78 MMBtu would result in an emissions reduction of 2 metric tons CO2e. √ Organize a LEED Education Program for Local Business Owners and Contractors: There was no quantification done for this measure, as there were either too many variables or insufficient data to provide an accurate analysis.
Work with PECO to Utilize all Available Efficiency Programs:

Haverford Township Climate Action Plan Page 85 of 96
There was no quantification done for this measure, as there were either too many variables or insufficient data to provide an accurate analysis. Community Transportation: √ Install Bike Racks at Key Destinations: There was no quantification done for this measure, as there were either too many variables or insufficient data to provide an accurate analysis.
Create a Map - Bike Racks, Routes, Transit Stops, etc: There was no quantification done for this measure, as there were either too many variables or insufficient data to provide an accurate analysis.
Create a Bike-Sharing Program: The cost savings and emissions reductions associated with this measure assumes that 500 people will ride 2 miles, 12 times per month, 9 months a year, which equates to a reduction of 108,000 miles. ICLEI’s CACP software was used to determine the impact of a VMT reduction of 108,000 against a residential VMT total of 236,111,114, assuming a gasoline-powered passenger vehicle that gets 19 mpg and a fuel cost of $4 per gallon. Given these criteria, cost savings would be $22,700 per year with a 56-ton reduction in CO2e.
Undertake Traffic Calming to Enhance Safety: There was no quantification done for this measure, as there were either too many variables or insufficient data to provide an accurate analysis. √ Enhance Pedestrian Safety and Access to Sidewalks and Bike Paths, and Review Existing Ordinances to Identify Barriers for Bike and Pedestrian Users: The cost savings and emissions reductions associated with this measure assume that 200 residents walk or bike 2 miles, twice a week, nine months out of the year. This would equate to a VMT reduction of 28,000 miles. ICLEI’s CACP software was used to determine the impact of a VMT reduction of 28,000 against a residential VMT total of 236,111,114, assuming a gasoline-powered passenger vehicle that gets 19 mpg and a fuel cost of $4 per gallon. Given these criteria, cost savings would be $6,000 per year with a 15-ton reduction in CO2e.
Create a Walking School Bus Program: The cost savings and emissions reductions associated with this measure assume that 200 students who would otherwise be driven to school walk or bike 1 mile to school 120 days a year. This would equate to a VMT reduction of 24,000 miles. ICLEI’s CACP software was used to determine the impact of a VMT reduction of 24,000 against a residential VMT total of 236,111,114, assuming a gasoline-powered passenger vehicle that gets 19 mpg and a fuel cost of $4 per gallon. Given these criteria, cost savings would be $5,000 per year with a 13-ton reduction in CO2e. √ Create a Safe Routes to School Program: The cost savings and emissions reductions associated with this measure assume that 500 students who would otherwise be driven to school walk or bike 1 mile to school 120 days a year. This would equate to a VMT reduction of 60,000 miles. ICLEI’s CACP software was used to determine the impact of a VMT reduction of 60,000 against a residential VMT total of 236,111,114, assuming a gasoline-powered passenger vehicle that gets 19 mpg and a fuel cost of $4 per gallon. Given these criteria, cost savings would be $12,500 per year with a 31-ton reduction in CO2e. √ Promote Transit-Chek to Transit-Accessible Employers: The cost savings and emissions reductions associated with this measure assume that 100 households (.0055% of households) will participate in a TransitChek program. This would mean a VMT reduction of 1,307,300

Haverford Township Climate Action Plan Page 86 of 96
miles. ICLEI’s CACP software was used to determine the impact of a VMT reduction of 1,307,300 against a residential VMT total of 236,111,114, assuming a gasoline-powered passenger vehicle that gets 19 mpg and a fuel cost of $4 per gallon. Given these criteria, cost savings would be $275,000 per year with a 672-ton reduction in CO2e.
Promote Haverford as a Transit-Friendly Township, Provide Education about Transit Options and Incentives for Transit Usage: There was no quantification done for this measure, as there were either too many variables or insufficient data to provide an accurate analysis.
Establish Philly Car Share Pods in Township: The cost savings and emissions reductions associated with this measure assume that 50 cars will be removed from the road as a result of Philly Car Share. Average vehicle use in Haverford Township is estimated at 13,073 miles per year. This would equate to a VMT reduction of 653,650 miles. ICLEI’s CACP software was used to determine the impact of a VMT reduction of 653,500 against a residential VMT total of 236,111,114, assuming a gasoline-powered passenger vehicle that gets 19 mpg and a fuel cost of $4 per gallon. Given these criteria, cost savings would be $137,000 per year with a 338-ton reduction in CO2e. √ Promote Existing Regional Carpooling Tools Such as DVRPC Share A Ride: The cost savings and emissions reductions associated with this measure assume that 50 people will participate in Share A Ride. Furthermore, it is assumed these 50 people would carpool with each other 3 times a week, 12 months a year, and have a round trip of 20 miles. This would equate to a VMT reduction of 144,000 miles. ICLEI’s CACP software was used to determine the impact of a VMT reduction of 144,000 against a residential VMT total of 236,111,114, assuming a gasoline-powered passenger vehicle that gets 19 mpg and a fuel cost of $4 per gallon. Given these criteria, cost savings would be $30,000 per year with an 74-ton reduction in CO2e. √ Work with Area Businesses to Promote Telecommuting: The cost savings and emissions reductions associated with this measure assumes that 5 businesses, for a total of 100 employees, will telecommute 1 time per month, thereby avoiding a 20 mile round trip commute. This would equate to a VMT reduction of 24,000 miles. ICLEI’s CACP software was used to determine the impact of a VMT reduction of 24,000 against a residential VMT total of 236,111,114, assuming a gasoline-powered passenger vehicle that gets 19 mpg and a fuel cost of $4 per gallon. Given these criteria, cost savings would be $5,000 per year with a 13-ton reduction in CO2e. √ Implement a Coordinated Traffic Signal Program: The cost savings and emissions reductions associated with this measure assumes a reduction in fuel consumption of 6 percent, which is the minimum savings the Institute of Transportation Engineers attributes to a signal coordination program. ICLEI’s CACP software was used to determine the impact of a 6 percent reduction in fuel consumption against a residential VMT total of 236,111,114, assuming a gasoline-powered passenger vehicle that gets 19 mpg and a fuel cost of $4 per gallon. Given these criteria, cost savings would be $3,116,510 per year with an 8,402-ton reduction in CO2e. 7,622 metric tons of CO2e is 5.3 percent of the total residential vehicle emissions of 159,708 metric tons.
Implement and Enforce Anti-Idling Campaign: There was no quantification done for this measure, as there were either too many variables or insufficient data to provide an accurate analysis. Encourage Residents to Purchase More Efficient Vehicles: The cost savings and emissions reductions associated with this measure assume that 100 drivers will switch from vehicles that get 20 mpg to ones that get 30 mpg. Average vehicle use in Haverford Township is estimated at 13,073 miles per year. Assuming a fuel cost of $4 a gallon, this switch would yield a savings of

Haverford Township Climate Action Plan Page 87 of 96
$873 and 218 gallons of gasoline per vehicle, or $87,293 and 21,823 gallons for 100 drivers. Using ICLEI’s CACP software it was determined that reducing gasoline consumption by 21,823 gallons would yield a CO2e reduction of 216 metric tons.
Study the Potential to Provide Access to Fuels with Reduced Carbon Content: There was no quantification done for this measure, as there were either too many variables or insufficient data to provide an accurate analysis.
Encourage Residents, Government and Fleet Users to Consider Alternative Fuel Vehicles: There was no quantification done for this measure, as there were either too many variables or insufficient data to provide an accurate analysis. Community Waste & Recycling: √ Publicize that Delaware County Includes Fluorescent Lighting in the Household Hazardous Waste Collection Program: There was no quantification done for this measure, as there were either too many variables or insufficient data to provide an accurate analysis. √ Expand Recycling Programs in Municipal Facilities: The emission reduction associated with this measure assumes that 5 percent of the waste stream generated in Township facilities would be diverted to recycling. Total estimated residential waste collected in 2005 was 26,018 metric tons, which includes Township facilities. Incinerating this trash produced 5,792 metric tons of CO2e. The Township has 325 employees, which represents .007 percent of the Township population. Based on this, 182 tons of trash was produced in Township facilities in 2005, producing 38 metric tons of CO2e. If 5 percent of this trash were diverted to recycling, it could cut waste by 9 tons and CO2e emissions by 2 metric tons. √ Expand Recycling Programs in School Facilities: The emission reduction associated with this measure assumes that the 5,600 students in the Haverford Township School District would divert 10 percent of their waste stream to recycling. Total estimated residential waste collected in 2005 was 26,018 metric tons, and incinerating this trash produced 5,792 metric tons of CO2e. Using this figure as a basis, it was determined that the students produced approximately 2,900 tons of trash and 603 metric tons of CO2e. If 10 percent of this trash were diverted to recycling, it could cut waste by 290 tons and CO2e emissions by 61 metric tons. √ Increase the Number of Recycling Containers in Public Areas Around the Township: The emission reduction associated with this measure assumes that 2 percent of the population (approximately 1,000 people) would divert 10 percent of their waste stream to recycling. Total estimated residential waste collected in 2005 was 26,018 tons, and incinerating this trash produced 5,792 metric tons of CO2e. Two percent of this waste stream is equal to 520 tons of trash and 108 metric tons of CO2e. If 10 percent of this trash were diverted to recycling, it could cut waste by 52 tons and CO2e emissions by 11 metric tons. √ Encourage Home Composting of Food and Yard Waste to Reduce Curbside Pickup: The emission reduction associated with this measure assumes that 5 percent of food waste and 25 percent of yard waste would be diverted from the waste stream into composting piles. Total estimated residential waste collected in 2005 was 26,018 tons, and incinerating this trash produced 5,792 metric tons of CO2e. According to EPA statistics, 12.4 percent of residential waste is food waste, and 12.9 percent is yard waste. In Haverford, this equates to 3,226 tons of food waste, generating 668 metric tons of CO2e, and 3,356 tons of yard waste, generating 695 metric tons of CO2e. For food waste, a 5 percent reduction would reduce emissions by 34 metric tons, and for yard waste, a 25 percent reduction would be 139 metric tons CO2e. Total emissions reduction would be 172 metric tons CO2e.
Haverford Township Climate Action Plan Page 88 of 96
Explore Establishing Composting Programs at Schools:
There was no quantification done for this measure, as there were either too many variables or insufficient data to provide an accurate analysis.
Establish Program to Require Reuse or Recycling of Construction and Demolition Materials: There was no quantification done for this measure, as there were either too many variables or insufficient data to provide an accurate analysis.
Research Appropriateness of Pay as You Throw Trash Collection Program: There was no quantification done for this measure, as there were either too many variables or insufficient data to provide an accurate analysis.
Encourage Residents and Business Owners to Buy Recycled and/or Re-Usable Goods: There was no quantification done for this measure, as there were either too many variables or insufficient data to provide an accurate analysis.
Work With Retailers to Provide Reusable Bags for Things Such as Groceries: Total estimated residential waste collected Haverford in 2005 was 26,018 metric tons, and incinerating this trash produced 5,792 metric tons of CO2e. Plastic bags represent approximately 0.5 percent of the waste stream. Removing plastic bags from Haverford’s waste stream would eliminate approximately 130 tons of trash. Total emissions reduction would be 27 metric tons CO2e.
Offer Free Collection of Old Appliances When Being Replaced with Energy STAR Products: There was no quantification done for this measure, as there were either too many variables or insufficient data to provide an accurate analysis.
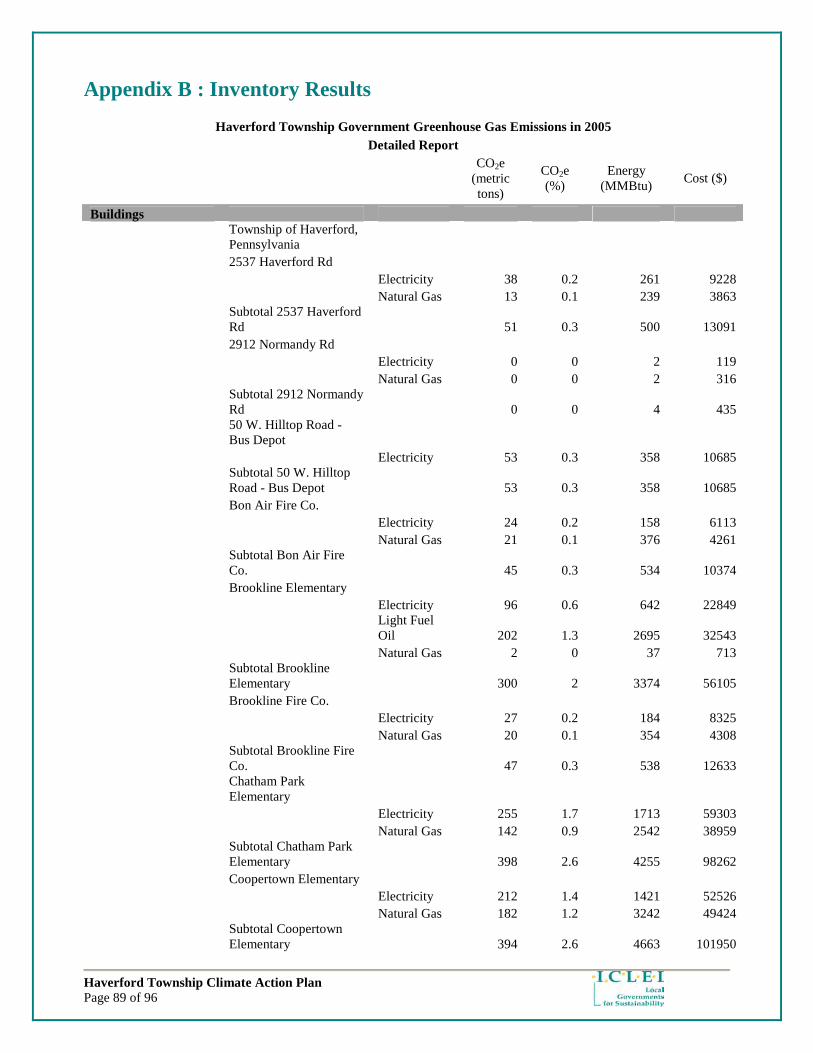
Haverford Township Climate Action Plan Page 89 of 96
Appendix B : Inventory Results
Haverford Township Government Greenhouse Gas Emissions in 2005 Detailed Report
CO2e (metric tons)
CO2e (%)
Energy (MMBtu)
Cost ($)
Buildings
Township of Haverford, Pennsylvania
2537 Haverford Rd Electricity 38 0.2 261 9228 Natural Gas 13 0.1 239 3863
Subtotal 2537 Haverford Rd 51 0.3 500 13091
2912 Normandy Rd Electricity 0 0 2 119 Natural Gas 0 0 2 316
Subtotal 2912 Normandy Rd 0 0 4 435
50 W. Hilltop Road - Bus Depot
Electricity 53 0.3 358 10685
Subtotal 50 W. Hilltop Road - Bus Depot 53 0.3 358 10685
Bon Air Fire Co. Electricity 24 0.2 158 6113 Natural Gas 21 0.1 376 4261
Subtotal Bon Air Fire Co. 45 0.3 534 10374
Brookline Elementary Electricity 96 0.6 642 22849
Light Fuel Oil 202 1.3 2695 32543
Natural Gas 2 0 37 713
Subtotal Brookline Elementary 300 2 3374 56105
Brookline Fire Co. Electricity 27 0.2 184 8325 Natural Gas 20 0.1 354 4308
Subtotal Brookline Fire Co. 47 0.3 538 12633
Chatham Park Elementary
Electricity 255 1.7 1713 59303 Natural Gas 142 0.9 2542 38959
Subtotal Chatham Park Elementary 398 2.6 4255 98262
Coopertown Elementary Electricity 212 1.4 1421 52526 Natural Gas 182 1.2 3242 49424
Subtotal Coopertown Elementary 394 2.6 4663 101950

Haverford Township Climate Action Plan Page 90 of 96
Federal School - Darby Rd
Electricity 0 0 3 287
Subtotal Federal School - Darby Rd 0 0 3 287
Garage - 1010 Darby Rd Electricity 4 0 25 1199
Subtotal Garage - 1010 Darby Rd 4 0 25 1199
Grange Carriage House Electricity 13 0.1 88 3257
Subtotal Grange Carriage House 13 0.1 88 3257
Grange Estate Electricity 18 0.1 122 4865
Light Fuel Oil 11 0.1 140 1529
Natural Gas 14 0.1 242 2849 Subtotal Grange Estate 42 0.3 504 9243 Grange Long Barn Electricity 0 0 1 149
Subtotal Grange Long Barn 0 0 1 149
Haverford High School Electricity 4096 26.7 27482 884135
Light Fuel Oil 396 2.6 5287 55907
Subtotal Haverford High School 4492 29.3 32769 940042
Haverford Middle School
Electricity 1938 12.7 13000 401240
Light Fuel Oil 394 2.6 5257 55116
Subtotal Haverford Middle School 2332 15.2 18257 456356
Library Electricity 228 1.5 1529 57603
Light Fuel Oil 48 0.3 638 7077
Subtotal Library 276 1.8 2167 64680 Llanerch Fire Co. Electricity 57 0.4 381 14695
Light Fuel Oil 2 0 31 390
Natural Gas 23 0.1 407 4607
Subtotal Llanerch Fire Co. 82 0.5 819 19692
Lynnewood Elementary Electricity 196 1.3 1318 43241 Natural Gas 151 1 2690 40067 Subtotal Lynnewood 347 2.3 4008 83308
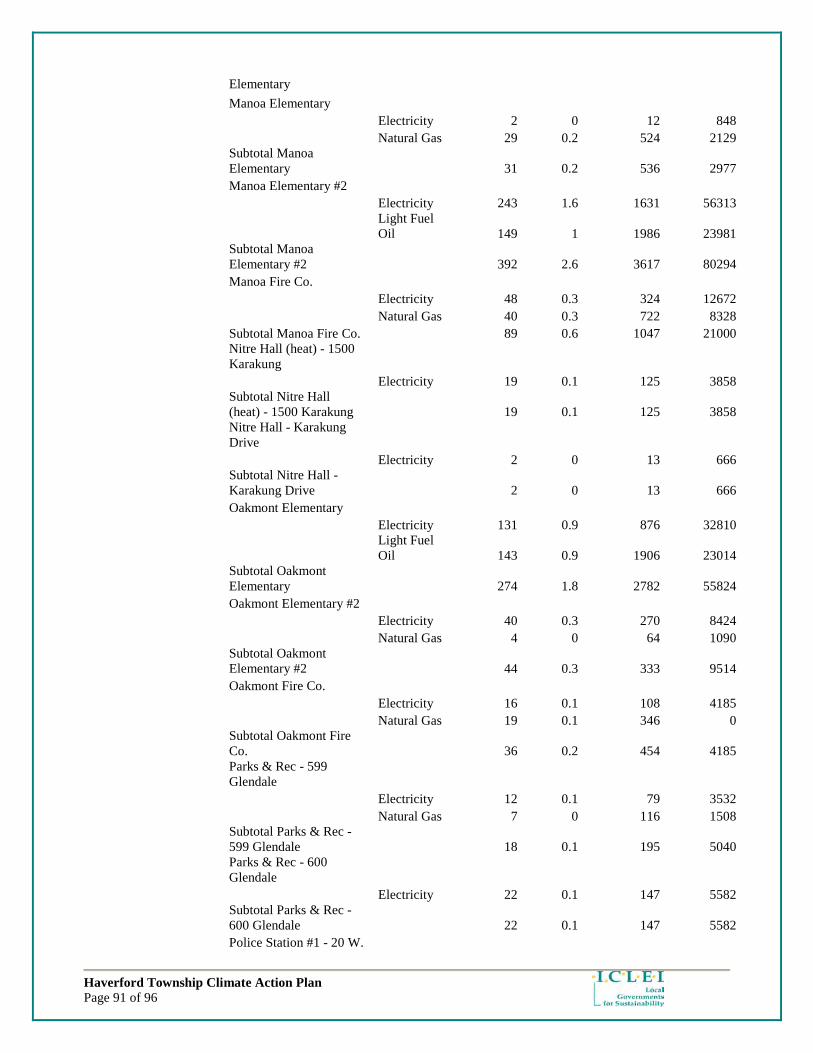
Haverford Township Climate Action Plan Page 91 of 96
Elementary
Manoa Elementary Electricity 2 0 12 848 Natural Gas 29 0.2 524 2129
Subtotal Manoa Elementary 31 0.2 536 2977
Manoa Elementary #2 Electricity 243 1.6 1631 56313
Light Fuel Oil 149 1 1986 23981
Subtotal Manoa Elementary #2 392 2.6 3617 80294
Manoa Fire Co. Electricity 48 0.3 324 12672 Natural Gas 40 0.3 722 8328 Subtotal Manoa Fire Co. 89 0.6 1047 21000
Nitre Hall (heat) - 1500 Karakung
Electricity 19 0.1 125 3858
Subtotal Nitre Hall (heat) - 1500 Karakung 19 0.1 125 3858
Nitre Hall - Karakung Drive
Electricity 2 0 13 666
Subtotal Nitre Hall - Karakung Drive 2 0 13 666
Oakmont Elementary Electricity 131 0.9 876 32810
Light Fuel Oil 143 0.9 1906 23014
Subtotal Oakmont Elementary 274 1.8 2782 55824
Oakmont Elementary #2 Electricity 40 0.3 270 8424 Natural Gas 4 0 64 1090
Subtotal Oakmont Elementary #2 44 0.3 333 9514
Oakmont Fire Co. Electricity 16 0.1 108 4185 Natural Gas 19 0.1 346 0
Subtotal Oakmont Fire Co. 36 0.2 454 4185
Parks & Rec - 599 Glendale
Electricity 12 0.1 79 3532 Natural Gas 7 0 116 1508
Subtotal Parks & Rec - 599 Glendale 18 0.1 195 5040
Parks & Rec - 600 Glendale
Electricity 22 0.1 147 5582
Subtotal Parks & Rec - 600 Glendale 22 0.1 147 5582
Police Station #1 - 20 W.
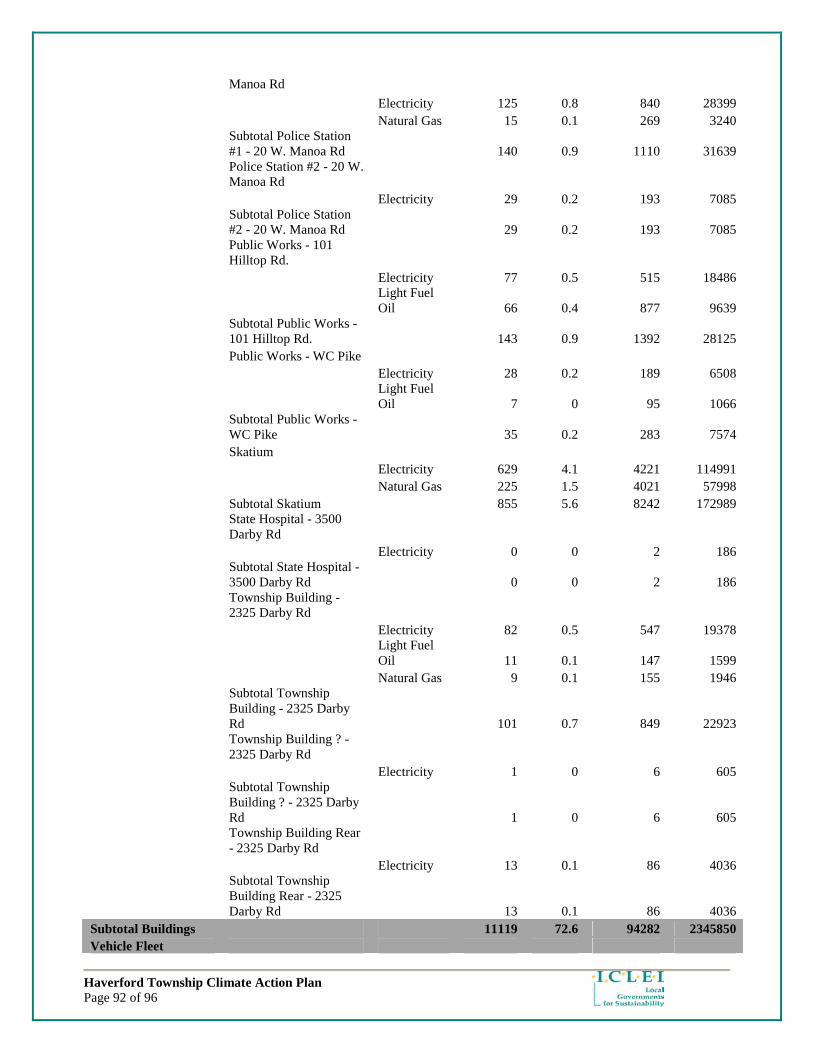
Haverford Township Climate Action Plan Page 92 of 96
Manoa Rd
Electricity 125 0.8 840 28399 Natural Gas 15 0.1 269 3240
Subtotal Police Station #1 - 20 W. Manoa Rd 140 0.9 1110 31639
Police Station #2 - 20 W. Manoa Rd
Electricity 29 0.2 193 7085
Subtotal Police Station #2 - 20 W. Manoa Rd 29 0.2 193 7085
Public Works - 101 Hilltop Rd.
Electricity 77 0.5 515 18486
Light Fuel Oil 66 0.4 877 9639
Subtotal Public Works - 101 Hilltop Rd. 143 0.9 1392 28125
Public Works - WC Pike Electricity 28 0.2 189 6508
Light Fuel Oil 7 0 95 1066
Subtotal Public Works - WC Pike 35 0.2 283 7574
Skatium Electricity 629 4.1 4221 114991 Natural Gas 225 1.5 4021 57998 Subtotal Skatium 855 5.6 8242 172989
State Hospital - 3500 Darby Rd
Electricity 0 0 2 186
Subtotal State Hospital - 3500 Darby Rd 0 0 2 186
Township Building - 2325 Darby Rd
Electricity 82 0.5 547 19378
Light Fuel Oil 11 0.1 147 1599
Natural Gas 9 0.1 155 1946
Subtotal Township Building - 2325 Darby Rd 101 0.7 849 22923
Township Building ? - 2325 Darby Rd
Electricity 1 0 6 605
Subtotal Township Building ? - 2325 Darby Rd 1 0 6 605
Township Building Rear - 2325 Darby Rd
Electricity 13 0.1 86 4036
Subtotal Township Building Rear - 2325 Darby Rd 13 0.1 86 4036
Subtotal Buildings 11119 72.6 94282 2345850 Vehicle Fleet

Haverford Township Climate Action Plan Page 93 of 96
Township of Haverford, Pennsylvania
School District - Gasoline
Gasoline 60 0.4 770 11362
Subtotal School District - Gasoline 60 0.4 770 11362
School District Diesel - Buses
Diesel 1068 7 13574 216936
Subtotal School District Diesel - Buses 1068 7 13574 216936
School District Diesel - Maintenance
Diesel 71 0.5 896 14324
Subtotal School District Diesel - Maintenance 71 0.5 896 14324
Township Diesel - Ambulance
Diesel 41 0.3 520 8304
Subtotal Township Diesel - Ambulance 41 0.3 520 8304
Township Diesel - Fire Diesel 22 0.1 281 4495
Subtotal Township Diesel - Fire 22 0.1 281 4495
Township Diesel - Public Works
Diesel 714 4.7 9079 145093
Subtotal Township Diesel - Public Works 714 4.7 9079 145093
Township Gasoline Gasoline 912 6 11741 157796
Subtotal Township Gasoline 912 6 11741 157796
Subtotal Vehicle Fleet 2888 18.9 36861 558310 Streetlights
Township of Haverford, Pennsylvania
672 Ardmore Ave. - Ellwell Field
Electricity 3 0 20 1003
Subtotal 672 Ardmore Ave. - Ellwell Field 3 0 20 1003
Genthart Field - Lights Electricity 4 0 26 1216
Subtotal Genthart Field - Lights 4 0 26 1216
Nitre Hall - Field Lights - 1500 Karakung
Electricity 0 0 3 248
Subtotal Nitre Hall - Field Lights - 1500 Karakung 0 0 3 248

Haverford Township Climate Action Plan Page 94 of 96
Parking Lot - Brookline Blvd.
Electricity 8 0.1 55 2089
Subtotal Parking Lot - Brookline Blvd. 8 0.1 55 2089
Streetlights #1 Electricity 989 6.5 6638 368367 Subtotal Streetlights #1 989 6.5 6638 368367 Streetlights #2 Electricity 67 0.4 448 24885 Subtotal Streetlights #2 67 0.4 448 24885 Traffic Signals Electricity 137 0.9 916 31790 Subtotal Traffic Signals 137 0.9 916 31790
Unmetered - 311 Highland - Highland Farms Park
Electricity 1 0 5 348
Subtotal Unmetered - 311 Highland - Highland Farms Park 1 0 5 348
Unmetered - 521 Hillside Ave - Hilltop Park
Electricity 1 0 9 468
Subtotal Unmetered - 521 Hillside Ave - Hilltop Park 1 0 9 468
Unmetered - Grasslyn Ave. s/o Ralston - Paddock Farms Park
Electricity 0 0 2 132
Subtotal Unmetered - Grasslyn Ave. s/o Ralston - Paddock Farms Park 0 0 2 132
Unmetered - Grove Rd - Grange
Electricity 0 0 3 276
Subtotal Unmetered - Grove Rd - Grange 0 0 3 276
Unmetered - Manoa & Darby - Veterans Field - Lights
Electricity 0 0 3 276
Subtotal Unmetered - Manoa & Darby - Veterans Field - Lights 0 0 3 276
Unmetered - Preston Ave. & Railroad - Preston Park
Electricity 1 0 5 348
Subtotal Unmetered - Preston Ave. & Railroad - Preston Park 1 0 5 348

Haverford Township Climate Action Plan Page 95 of 96
Unmetered - Rose Tree Ln - Westgate Hills
Electricity 0 0 3 276
Subtotal Unmetered - Rose Tree Ln - Westgate Hills 0 0 3 276
Unmetered - Washington Ave & Manoa - Bailey Park
Electricity 3 0 22 888
Subtotal Unmetered - Washington Ave & Manoa - Bailey Park 3 0 22 888
Unmetered - Washington Ave - Bailey Park
Electricity 2 0 11 528
Subtotal Unmetered - Washington Ave - Bailey Park 2 0 11 528
Untitled Electricity 4 0 24 1068 Subtotal Untitled 4 0 24 1068 Veterans Field - Lights Electricity 2 0 11 739
Subtotal Veterans Field - Lights 2 0 11 739
Subtotal Streetlights 1223 8 8203 434945 Water/Sewage
Township of Haverford, Pennsylvania
DELCORA Electricity 48 0.3 323 11925 Subtotal DELCORA 48 0.3 323 11925
Sewer - 325 Richland Ave.
Electricity 34 0.2 227 7902
Subtotal Sewer - 325 Richland Ave. 34 0.2 227 7902
Sewer - Lawrence Rd w/o Darby Creek Rd
Electricity 0 0 0 144
Subtotal Sewer - Lawrence Rd w/o Darby Creek Rd 0 0 0 144
Sewer - Warrior Rd. @ Burmont Rd.
Electricity 1 0 4 380
Subtotal Sewer - Warrior Rd. @ Burmont Rd. 1 0 4 380
Subtotal Water/Sewage 83 0.5 555 20351 Total 15313 100 139901 3359456 This report has been generated for the Township of Haverford using STAPPA/ALAPCO and ICLEI's Clean Air and Climate Protection Software developed by Torrie Smith Associates Inc.
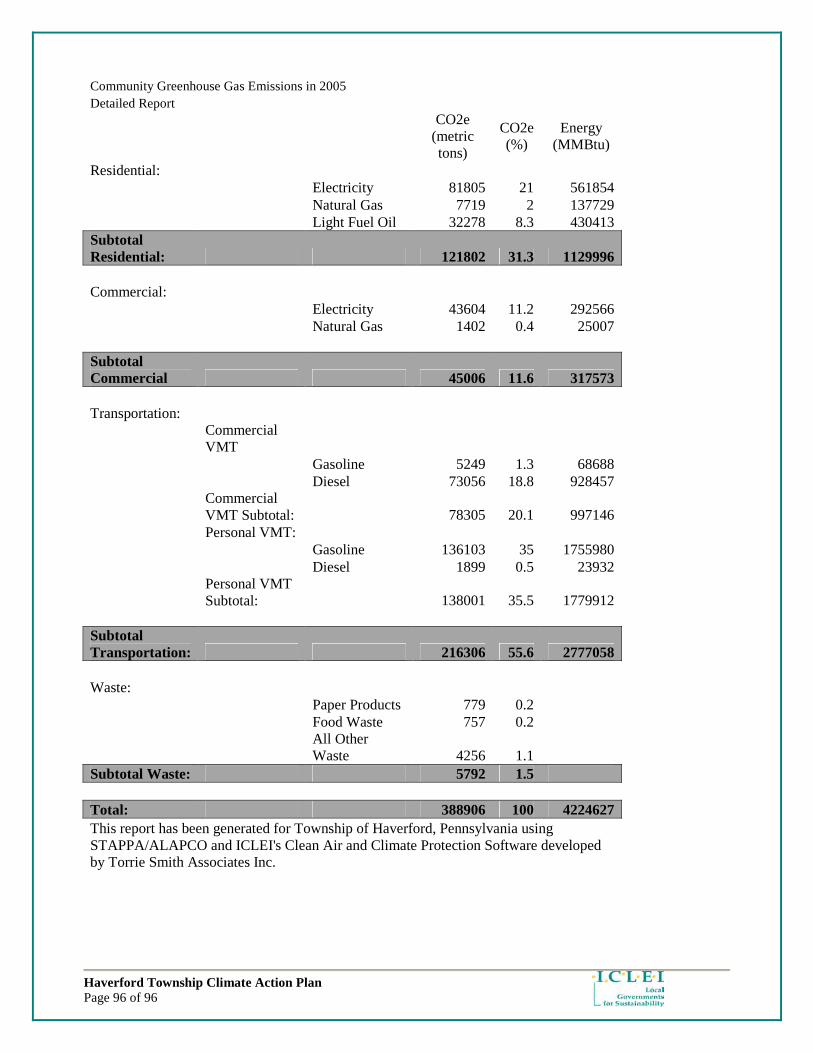
Haverford Township Climate Action Plan Page 96 of 96
Community Greenhouse Gas Emissions in 2005 Detailed Report
CO2e (metric tons)
CO2e (%)
Energy (MMBtu)
Residential: Electricity 81805 21 561854 Natural Gas 7719 2 137729 Light Fuel Oil 32278 8.3 430413 Subtotal Residential: 121802 31.3 1129996 Commercial: Electricity 43604 11.2 292566 Natural Gas 1402 0.4 25007 Subtotal Commercial 45006 11.6 317573 Transportation:
Commercial VMT
Gasoline 5249 1.3 68688 Diesel 73056 18.8 928457
Commercial VMT Subtotal: 78305 20.1 997146
Personal VMT: Gasoline 136103 35 1755980 Diesel 1899 0.5 23932
Personal VMT Subtotal: 138001 35.5 1779912
Subtotal Transportation: 216306 55.6 2777058 Waste: Paper Products 779 0.2 Food Waste 757 0.2
All Other Waste 4256 1.1
Subtotal Waste: 5792 1.5 Total: 388906 100 4224627 This report has been generated for Township of Haverford, Pennsylvania using STAPPA/ALAPCO and ICLEI's Clean Air and Climate Protection Software developed by Torrie Smith Associates Inc.