TOWARDS THE DEVELOPMENT OF A METHOD FOR GENERATING ... · This paper presents the first steps...
12
1 TOWARDS THE DEVELOPMENT OF A METHOD FOR GENERATING ANALYTICAL TSUNAMI FRAGILITY FUNCTIONS Joshua MACABUAG 1 , Tristan LLOYD 2 , Tiziana ROSSETTO 3 ABSTRACT The onshore flow of a tsunami can generate significant loading on buildings and infrastructure leading to various levels of damage or failure. Analytical tsunami fragility functions are derived from structural analyses and relate damage (via an Engineering Demand Parameter, EDP) to a tsunami Intensity Measure (IM). They allow for quantification of risk, even in the absence of empirical building damage data, and so are vital for land-use and emergency planning, human and financial loss estimation and Performance Based Tsunami Engineering. This paper presents the first steps towards defining a framework for generating analytical tsunami fragility functions, using iterative structural analyses. A simple case study is presented and a set of rudimentary fragility functions are produced in order to illustrate the proposed process. Inter-storey drift is selected as the EDP to enable the use of a seismic damage scale definition. Inundation depth is selected as the IM to enable comparison with empirical fragility functions. It is shown that the seismic damage scale selected does not capture an adequate range of structural behaviour under tsunami loading, and so a preliminary tsunami damage scale is proposed. The generated fragility functions are order-of-magnitude comparable with empirical functions derived from damage data from the 2011 Japan Tsunami. NOMENCLATURE h = inundation depth, u = flow velocity, z = building elevation above sea-level, ρ = density, R = maximum tsunami run-up (max height above sea level that tsunami reaches on-land), q(y) = design tsunami wave pressure at height y above ground, g = acceleration due to gravity, k = constant (indicating proportionality), C d = drag coefficient, m = mass of debris, Δt = debris impact duration, V void = volume of trapped air voids below the inundation depth, V water = volume of trapped water on suspended floors, 1 EngD Student Researcher, EPICentre, Department of Civil Environmental and Geomatic Engineering, University College London, Gower Street, London, United Kingdom, WC1E 6BT 2 PhD Student Researcher, EPICentre, University College London, United Kingdom, WC1E 6BT 3 Professor, EPICentre, University College London, United Kingdom, WC1E 6BT
Transcript of TOWARDS THE DEVELOPMENT OF A METHOD FOR GENERATING ... · This paper presents the first steps...

1
TOWARDS THE DEVELOPMENT OF A METHOD FORGENERATING ANALYTICAL TSUNAMI FRAGILITY FUNCTIONS
Joshua MACABUAG1, Tristan LLOYD2, Tiziana ROSSETTO3
ABSTRACT
The onshore flow of a tsunami can generate significant loading on buildings and infrastructure leadingto various levels of damage or failure. Analytical tsunami fragility functions are derived fromstructural analyses and relate damage (via an Engineering Demand Parameter, EDP) to a tsunamiIntensity Measure (IM). They allow for quantification of risk, even in the absence of empiricalbuilding damage data, and so are vital for land-use and emergency planning, human and financial lossestimation and Performance Based Tsunami Engineering.
This paper presents the first steps towards defining a framework for generating analytical tsunamifragility functions, using iterative structural analyses. A simple case study is presented and a set ofrudimentary fragility functions are produced in order to illustrate the proposed process. Inter-storeydrift is selected as the EDP to enable the use of a seismic damage scale definition. Inundation depth isselected as the IM to enable comparison with empirical fragility functions.
It is shown that the seismic damage scale selected does not capture an adequate range of structuralbehaviour under tsunami loading, and so a preliminary tsunami damage scale is proposed. Thegenerated fragility functions are order-of-magnitude comparable with empirical functions derivedfrom damage data from the 2011 Japan Tsunami.
NOMENCLATURE
h = inundation depth, u = flow velocity, z = building elevation above sea-level, ρ = density,R = maximum tsunami run-up (max height above sea level that tsunami reaches on-land),q(y) = design tsunami wave pressure at height y above ground, g = acceleration due to gravity,k = constant (indicating proportionality), Cd = drag coefficient, m = mass of debris,Δt = debris impact duration, Vvoid = volume of trapped air voids below the inundation depth,Vwater = volume of trapped water on suspended floors,
1 EngD Student Researcher, EPICentre, Department of Civil Environmental and GeomaticEngineering,University College London, Gower Street, London, United Kingdom, WC1E 6BT2 PhD Student Researcher, EPICentre, University College London, United Kingdom, WC1E 6BT3 Professor, EPICentre, University College London, United Kingdom, WC1E 6BT

2
INTRODUCTION
Compared to seismic studies, few fragility functions for buildings affected by tsunami exist, and the vastmajority have all been based solely on empirical data (post-tsunami building damage surveys). However,the applicability of empirical tsunami fragility functions for buildings is limited by the availability andquality of data from past events. Similar construction types from different countries or regions canperform very differently under the same tsunami conditions (A. Suppasri et al. 2013), and so the correctapplication of empirical fragility functions is therefore very specific to the locations from where damagedata was taken. Analytical techniques are required to generate tsunami fragility functions for the majorityof at-risk locations around the world where tsunami damage data is not available.
Analytical fragility functions are based on damage data generated from structural analysis. The use ofseismic analytical fragility functions is well established (Baker 2013; Meslem and Ayala 2012;Tiziana Rossetto and Elnashai 2005), but to date no analytical tsunami fragility functions have beenpublished. Analytical fragility functions provide a probabilistic link between a tsunami IntensityMeasure (IM) and the structural response, represented by an Engineering Demand Parameter (EDP).Multiple damage data points are formed by repeating structural analysis for a range of IMs and a rangeof building configurations within the constraints of the building type being considered. Statisticalregression methods are then applied to this damage data set to generate fragility functions.
PROPOSED METHOD OF GENERATING ANALYTICAL FRAGILITYFUNCTIONS
Fragility functions are specific to a particular building type and location. After selecting a location andbuilding type, damage data points (also referred to as performance points: the simulated damage stateof a structure for a given local tsunami intensity {ds, IM}) can be obtained. This is achieved byestimating the intensity of the hazard (IM) for the given location, calculating the forces on a structurerepresentative of the building type being considered, and analysing the structural response to obtainthe expected damage state for the given hazard intensity. Multiple data points (i.e. a dataset) are thenformed by repeating this procedure for a range of hazard intensities and a range of buildingconfigurations within the constraints of the building type being considered. Statistical regressionmethods are then applied to this damage dataset to generate fragility functions.
This paper presents work being conducted at University College London towards the development of amethod for constructing analytical fragility functions based on structural analyses. The proposedprocedure comprises the iterative process shown in Figure 1.
Figure 1: Proposed procedure for deriving analytical tsunami fragility functions.

J. Macabuag and T. Rossetto 3
ANALTICAL MODEL
Analytical structural models are required in order to model the population of buildings for whichfragility functions are to be derived. Fragility functions are generally derived by building type, wherebuildings should be classified according to their structural properties, as this will govern theirperformance under tsunami loading. Empirical tsunami fragility functions exist for several buildingtypes, including RC, steel, wood and masonry (A. Suppasri et al. 2013). Fragility functions are alsospecific to a particular location as similar construction types from two different countries or evenregions can perform very differently under the same tsunami conditions (EERI and IAEE n.d.; A.Suppasri et al. 2012a). Therefore, the analytical model is required to represent a particular buildingtype in a particular part of the world (step 1 in Figure 1).
Within a building type (e.g. RC frame structures), there is variation of structural and materialparameters (e.g. geometry, material strength, etc.). The range of analytical models used must representthis variability in the building population.
Example Application: Structural ModelFor the purposes of this preliminary investigation structural variability will not be considered, only thestructural model shown in Figure 2 will be analysed, variability will still be considered in the loading. The RCframed structure analysed is the four-story, 2D bare frame shown in Figure 2. This 2D framerepresents the central bay of a typical building constructed in Southern Europe in the 1950’s and 60’s.Non-linear analysis of the structure is carried out via the fibre-plasticity approach, using the analysispackage Seismotruct. Details of the model and the analysis method are given in Macabuag, Rossetto,and LLoyd (2014).
Note that this structure has been selected as it is one of the structures used by Rossetto and Elnashai(2003) to derive the seismic damage state threshold definitions that will be used in this tsunamifragility function investigation (Table 2). Using the same building under a different loading regime(i.e. tsunami loading) will allow investigation of the appropriateness of using seismic damage scaledefinitions for tsunami fragility function derivation.
Figure 2: Structural elevation (left. Source: (Carvalho et Al 1999)) and FE model (right) withequivalent nodal forces for a tsunami rising above the 2nd floor. Not that for this analysis, openings are
ignored and the structure is considered impermeable (Macabuag, Rossetto, and LLoyd 2014a).
TSUNAMI LOADING REGIME
Current tsunami guidelines and recent studies provide equations for the estimation of maximumtsunami loads on buildings from knowledge of the local building inundation. Tsunami loadingrelationships recommended in design-guidance documents are discussed in Macabuag, Rossetto, andLLoyd (2014a) and time-history tsunami loadings are presented in Lloyd and Rossetto (2012).However, there is a great deal of uncertainty in the spatial and temporal distribution of loads imposedby tsunami on buildings, as well as the magnitude of these loads. This variability in the loading thatmay be experienced by a building population must also be captured in the analytical models used forfragility function derivation (the inner loop in Figure 1).

4
Tsunami-induced building damage can arise due to hydrostatic forces (including buoyancy), hydrodynamiceffects (drag and bore impact) and debris (impact and damming). There are several methods for groupingbuilding damage (Chock et al. 2013; Fukuyama, Kato, and Ishihara 2013) considering global lateraldeflection (Figure 3), out-of-plane failure of walls, disproportionate collapse (from the failure of load-bearing elements) and foundation effects (e.g. scour, sliding and overturning) (EEFIT 2013).
Figure 3: Global lateral deflection/failure due to lateralfluid load (hydrostatic and hydrodynamic) (EEFIT 2011).
Figure 4: Structural model underlateral fluid loading.
Example Application: Input LoadsGiven the complexity of the full tsunami loading regime, this preliminary investigation will look toexamine a simplified case whereby only lateral hydrodynamic fluid loads will be considered. I.e.debris, buoyancy and net hydrostatic effects will not be considered.
To represent uncertainty in the tsunami loading, for this preliminary investigation, the structure will beanalysed under loading from several tsunami design guidance documents. The results from allanalyses will then be combined in order to create fragility functions which represent a range ofpossible loading regimes which can be experienced within the population of buildings. It is noted thatthis is not proposed as an accurate method for capturing loading variability (the inner loop shown inFigure 1), but the variation in design-code loading will be used in this example application todemonstrate how fragility functions may be formed.
Figure 5 shows the input loads calculated for all load cases given in Table 1. For further discussion onthe forces, codes and load cases chosen see Macabuag, Rossetto, and LLoyd (2014).
TsunamiPO Curve
Ref
DesignStandards
Description of Loading
1 MLIT 2570 Equivalent hydrostatic pressure. No shelter from the incoming wave.
2 MLIT 2570 Equivalent hydrostatic pressure. >500m from the water source with shelter fromthe incoming wave.
3 MLIT 2570 Equivalent hydrostatic pressure. <500m from the water source with shelter fromthe incoming wave.
4 FEMA 646 Impulse loading based on the maximum momentum flux at each inundation depth.Uniform vertical distribution. Runup taken as that of the maximum credibletsunami at the site, assumed as 10m for the purpose of this investigation.
5 FEMA 646 Impulse loading based on the minimum momentum flux at each inundation depth.Uniform vertical distribution.
6 ASCE 7-16 Simplified pseudo-static approach. Hydrostatic pressure distribution with densitymultiplied by 3.
7 ASCE 7-16 Hydrostatic drag (no bore impact).
8 ASCE 7-16 Bore impact over standing water.At each step of inundation depth (hi), bore height = 50% of inundation depth andstanding water is assumed to a depth of 15% of the bore height.
9 ASCE 7-16 Bore impact over a dry bed.At each step of inundation depth (hi), bore height = 50% of inundation depth.
Table 1: Load cases used to generate tsunami push-over curves. Based on current and upcoming design standards(Chock 2013; FEMA 2012; MLIT 2011; Robertson and Riggs 2011).

J. Macabuag and T. Rossetto 5
Figure 5: Comparison of input loads. See Macabuag, Rossetto, and LLoyd (2014) for discussion on the variousloading scenarios described by these different loadcases.
STRUCTURAL ANALYSIS
Tsunami pushover analysis is carried out in order to rapidly assess structural performance over a rangeof tsunami intensities (the inner loop shown in Figure 1). Tsunami pushover analysis is a novelmethodology whereby a structural model is loaded by tsunamis of various heights in order to generatetsunami pushover curves characterizing the structural performance under tsunami loading. SeeMacabuag, Rossetto, and LLoyd (2014b) for a discussion of the method and its relation toconventional seismic pushover analysis.
Example Application: Results of Tsunami Pushover AnalysesA series of analyses were carried out of the structure shown in Figure 2 loaded by tsunamis of variousheights. In order to best illustrate the tsunami pushover procedure this preliminary study focuses onthe simple lateral deflection failure mechanism shown in Figure 3. This is in order to generatepreliminary tsunami pushover curves characterizing the structural performance under tsunami loading.The loading procedure and analysis of structural performance and failure mechanisms is discussed inMacabuag, Rossetto, and LLoyd (2014a). The resulting capacity curves for the analysed structureunder the various loading profiles are shown in Figure 6 below.
Figure 6: Applied load vs top drift. Note that cases 1, 2, and 3 all lie on the same curve, as do cases 7,8 and 9. See Macabuag, Rossetto, and LLoyd (2014) for discussion on this result.
0
50
100
150
200
250
300
0 1 2 3 4 5 6 7 8
Bas
eSh
ear
(kN
)
Inundation Depth (m)
1. MLIT 2570 (a=3)2. MLIT 2570 (a=2)3. MLIT 2570 (a=1.5)4. FEMA 646 (max, R=10m)5. FEMA 646 (min, R=10m)6. ASCE - Drag (R=10m)7. ASCE - Pseudo-Static8. ASCE - Bore (dry, 50%)9. ASCE - Bore (wet, 15%)
0
50
100
150
200
250
300
350
0 10 20 30 40 50 60 70
Bas
eSh
ear
(kN
)
Top Drift (mm)
1. MLIT 2570 (a=3)2. MLIT 2570 (a=2)3. MLIT 2570 (a=1.5)4. FEMA 646 (max, R=10m)5. FEMA 646 (min, R=10m)6. ASCE - Drag (R=10m)7. ASCE - Pseudo-Static8. ASCE - Bore (dry, 50%)9. ASCE - Bore (wet, 15%)

6
FRAGILITY FUNCTION DERIVATION
Using the results of structural analysis, analytical fragility functions can then be derived (Figure 7). Inorder to do this it is necessary to relate the structural response, represented by an Engineering DemandParameter (EDP) to a tsunami Intensity Measure (IM).
Figure 7: Procedure for deriving analytical fragility functions from structural analysis data.
Current empirical tsunami fragility functions generally use one of two IMs: flow depth and flowvelocity. Tsunami flow depth is the most commonly used IM to build empirical tsunami fragilitycurves as it is relatively straightforward to measure in the field. Flow velocities are not usually takeninto account as they are hard to determine from observations (EEFIT 2006), although numericalinundation modelling is beginning to allow for the development of empirical fragility functions whichuse velocity as their IM (Gokon, Koshimura, and Matsuoka 2010; a. Suppasri, Koshimura, andImamura 2011; A. Suppasri, Koshimura, and Imamura 2009).
Very few analytical tsunami fragility functions have been published and so a suitable EDP has not yetbeen established in literature. It will therefore be necessary to select an EDP for the purposes of thisstudy. Damage is then to be assessed based on the EDP values. An EDP-based damage scale is thereforerequired to rank the data into damage classes according to the degree of non-structural and structuraldamage to the analysed buildings. However, tsunami damage state definitions as a function of EDP havealso not yet been developed, and so a suitable damage scale will need to be developed for this study.
Once structural performance has been transformed into damage data, fragility curves can then be fit tothat data. Statistical model fitting to derive fragility functions assumes that the probability of damageexceeding a given damage state is a function of intensity (e.g. P(ds>DS|IM) = f(IM)) and calculates thenature of that function based on sample damage data (i.e. curve-fitting). Two statistical models that arecommonly used in the literature are linear models (e.g. utilizing linear least squares regression (A.Suppasri et al. 2012b)) and the generalized linear model (e.g. utilizing logistic regression (Reese et al.,2011)). Linear models rely on a number of assumptions that can often not be met in practice and theGeneralized Linear Model is becoming considered more appropriate for fragility function derivation(D’Ayala et al. 2013).
Example Application: Structural ModelThe pushover curves shown in Figure 6 represent structural behaviour under tsunami loading. Thisstructural response data must be transformed into EDP-IM space (Figure 8). Tsunami loading definedby current Japanese design codes, is defined entirely by inundation depth (Macabuag, Rossetto, andLLoyd 2014a), therefore depth will be used as the IM in this case. This will also allow for easiercomparison with empirical tsunami fragility functions, the majority of which are also based oninundation depth. A common EDP for seismic analytical fragility functions is inter-story drift ratio(ISDR), which will also be adopted here.
Figure 8: Maximum Inter-Story Drift Ratio vs inundation depth (i.e. EDP vs IM). Each curve ends atthe point at which numerical instability of the analysis model occurred.
0.0%
0.2%
0.4%
0.6%
0.8%
1.0%
1.2%
0 2 4 6 8
EDP
-IS
Dm
ax%
IM - Inundation Depth (m)
1. MLIT 2570 (a=3)2. MLIT 2570 (a=2)3. MLIT 2570 (a=1.5)4. FEMA 646 (max, R=10m)5. FEMA 646 (min, R=10m)6. ASCE - Drag (R=10m)7. ASCE - Pseudo-Static8. ASCE - Bore (dry, 50%)

J. Macabuag and T. Rossetto 7
Tsunami damage state definitions as a function of ISDR have also not yet been developed, and so aseismic damage scale will initially be adopted. The selected damage scale (Table 2) was developed bycalibration against several full-scale structural seismic experiments, including the structure used in thistsunami pushover investigation (T. Rossetto and Elnashai 2003).
Figure 10 shows fragility functions for the damage states and damage scale defined in Table 2. Theprocedure for deriving the fragility functions was to define several statistical models and then select amodel based on the Akaike Information Criterion (AIC) relative goodness-of-fit test, which isappropriate for comparing non-nested models as outlined in T Rossetto et al. (2014). The statisticalmodels tested considered transformed (ln|h|) and non-transformed IMs, ordered and partially-orderedmodels, and compared logit, probit, chauchit, loglog and complimentary loglog link functions. This isaccording to the procedure set out in Charvet et al. (2014). The chosen statistical model is a partially-ordered model regressed on the logarithm of the inundation depths using a probit link function (Figure10, Equation (1), where Φ-1 denotes the inverse cumulative normal distribution).
Damage State Inter-Storey Drift (ISD) RangeNone 0 – 0.32%Slight 0.04 – 0.43%Light 0.5% – 1.02%
Moderate 1.02% – 2.41%Extensive 2.41% – 4.27%
Partial Collapse 4.27% – 5.68%Collapse > 5.68%
Table 2: Seismic Analytical Damage Scale: ISDmax% limit state threshold values for moment-resistingRC frames designed to pre-seismic codes (T. Rossetto and Elnashai 2003).
Φିଵ⌈ܲ(ܵܦ≥ ⌈(|ℎݏ݀ = +ߙ |ln|ℎߚ (1)
Figure 9: IM vs EDP. Performance pointsfrom structural analyses. Horizontal lines
represent the thresholds defined in Table 2.
Figure 10: Fragility functions based on seismic damagestate definitions.
Note that although seven damage states (including “no damage”) are defined in Table 2, only twocurves are shown in Figure 10. This is because only three damage state thresholds are crossed inFigure 9, and the third threshold (moderate damage) only has one point beyond it, which is not enoughdata to sensibly form a fragility function.
Figure 9 and Figure 10 show that according to the seismic analytical damage scale used, inter-storydrift ratios indicating only light or moderate damage can be achieved before instability of the analysismodel occurs. This is because for seismic deflection-based damage scales higher damage statesdefined are often defined on the post-peak softening branch of the seismic pushover curve. Thetsunami pushover procedure does not generate a post-peak softening branch (Macabuag, Rossetto, andLLoyd 2014b) and so seismic EDP-based damage scales are not appropriate for defining tsunamidamage states as they do not pick up higher damage states induced by tsunami loading. Therefore, thedefinition of a new EDP-based damage scale for the specific case of tsunamis must be investigated.
0
0.2
0.4
0.6
0.8
1
0 2 4 6 8
Dam
age
Exce
ed
ance
Pro
bab
ility
Inundation Depth (m)
"DS1" Slight
"DS2" Light

8
TOWARDS DEFINING AN ANALYTICAL TSUNAMI DAMAGE SCALE
Using seismic EDP and damage state definitions may not be appropriate for the definition of analyticaltsunami fragility functions. Therefore, new damage state thresholds will be estimated. The samedamage definitions will be used as for an empirical damage scale utilized in Japan following the 2011Great East Japan Earthquake and Tsunami, so that analytical and empirical curves can be compared.The analytical damage state definitions will be correlated with the empirical damage states via thecriteria shown in Table 3. The criteria used to define yielding, spalling and crushing of columns in theanalytical model are shown in Table 4. Only structural damage states will be compared, and so minorand moderate damage will be ignored as they define damage to non-structural elements. It is noted thatthe selected criteria are only a first estimate and further calibration will be required.
Table 5 shows the interstorey drift ratios for each loadcase at which the criteria given in Table 4 arereached. The mean of these values is then taken as an estimate for the new damage state threshold,with the exception of damage state 6, whereby the lowest ISDmax% at which numerical instability of theanalysis model occurs is taken as the estimate, so that all loadcases will have at least one instancewhere they reach damage state 6. The fragility functions derived from these estimated tsunami damagestate thresholds are shown in Figure 12.
DamageState
Classification Description ConditionFE ModelDefinition
ModelImage
DS1 Minor damageNo significant structural
or non-structural damage,only minor flooding.
Possible to use afterminor floor and wall
clean up. Not currently considered inanalytical model.
DS2Moderatedamage
Slight damage to non-structural components.
Possible to use aftermoderate reparation.
DS3 Major damageHeavy damage to somewalls but no damage in
columns.
Possible to use aftermajor reparations.
1st Yield
DS4Completedamage
Heavy damage to severalwalls and some columns.
Possible to use aftercomplete reparation and
retrofitting.1st Spall
DS5 Collapse
Destructive damage towalls (more than half ofwall density) and several
columns (bent ordestroyed).
Loss of functionality(system collapse). Non-repairable or great cost
for retrofitting.
1st Crush
DS6 Washed awayWashed away, only
foundations remained,total overturn.
Non-repairable, requirestotal reconstruction.
NumericalInstability
Table 3: Damage state classification table. Analytical damage state definitions are correlated with anempirical scale used by the Japanese Ministry of Land, Transport and Infrastructure (MLIT) after the
2011 Japan tsunami. The criteria for yielding, spalling and crushing are shown in Table 4.
PerformanceCriteria Description
Material MonitoredStrain
CriteriaColour
Yielding Steel reinforcing bars ε > 0.0013 YellowSpalling Concrete cover ε > -0.0025 OrangeCrushing Core concrete (contained within rebar) ε > -0.0031 Red
Table 4: Performance criteria indicated by coloured members in Table 3.
J. Macabuag and T. Rossetto 9
DamageState
(survey)
Definitionin FEModel
ISDmax% at DS Criteria
1 2 3 4 5 6 7 8 9EstimatedThresholds
DS1Not currently considered in analytical model.
DS2DS3 1st Yield 0.21% 0.23% 0.23% 0.23% 0.24% 0.24% 0.21% 0.21% 0.23% 0.22%DS4 1st Spall 0.36% 0.36% 0.36% 0.40% 0.38% 0.43% 0.37% 0.37% 0.37% 0.38%DS5 1st Crush 0.46% 0.46% 0.46% 0.52% 0.51% 0.50% 0.48% 0.46% 0.48% 0.48%
DS6NumericalInstability
0.60% 0.65% 0.60% 0.73% 0.70% 1.09% 0.64% 0.63% 0.59% 0.59%
Table 5: ISD values, by load case, at which the criteria given in Table 4 are reached.
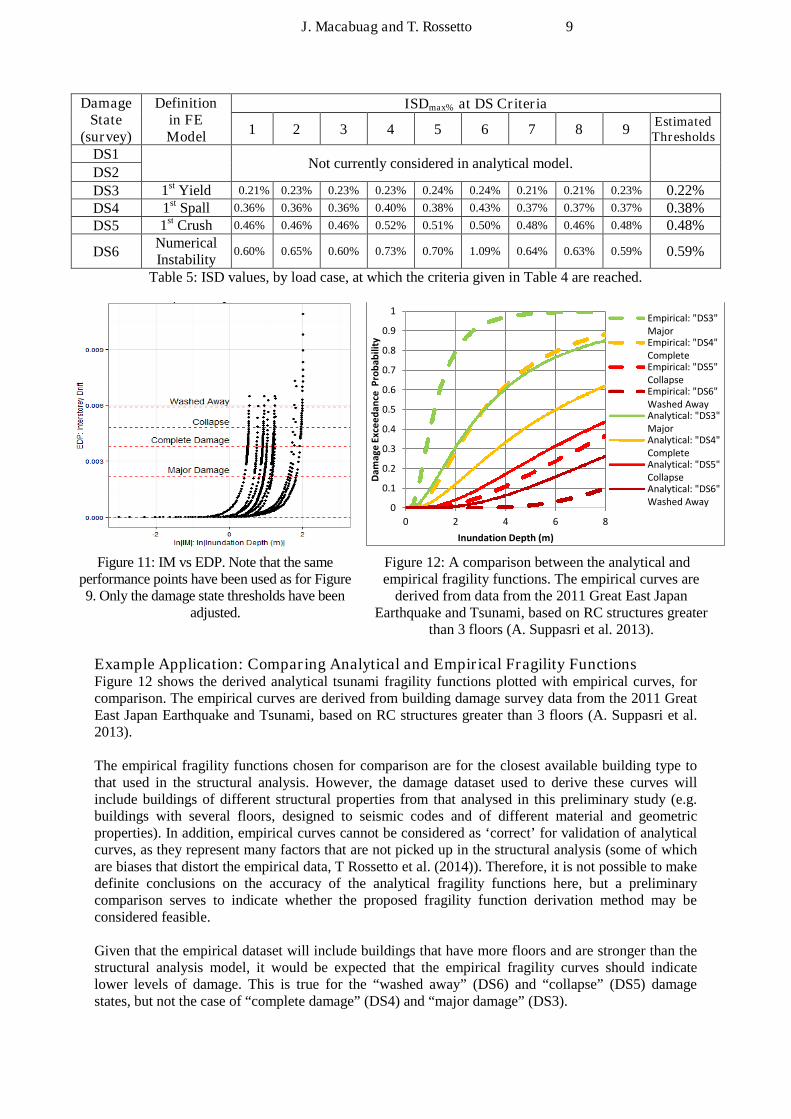
Figure 11: IM vs EDP. Note that the sameperformance points have been used as for Figure9. Only the damage state thresholds have been
adjusted.
Figure 12: A comparison between the analytical andempirical fragility functions. The empirical curves are
derived from data from the 2011 Great East JapanEarthquake and Tsunami, based on RC structures greater
than 3 floors (A. Suppasri et al. 2013).
Example Application: Comparing Analytical and Empirical Fragility FunctionsFigure 12 shows the derived analytical tsunami fragility functions plotted with empirical curves, forcomparison. The empirical curves are derived from building damage survey data from the 2011 GreatEast Japan Earthquake and Tsunami, based on RC structures greater than 3 floors (A. Suppasri et al.2013).
The empirical fragility functions chosen for comparison are for the closest available building type tothat used in the structural analysis. However, the damage dataset used to derive these curves willinclude buildings of different structural properties from that analysed in this preliminary study (e.g.buildings with several floors, designed to seismic codes and of different material and geometricproperties). In addition, empirical curves cannot be considered as ‘correct’ for validation of analyticalcurves, as they represent many factors that are not picked up in the structural analysis (some of whichare biases that distort the empirical data, T Rossetto et al. (2014)). Therefore, it is not possible to makedefinite conclusions on the accuracy of the analytical fragility functions here, but a preliminarycomparison serves to indicate whether the proposed fragility function derivation method may beconsidered feasible.
Given that the empirical dataset will include buildings that have more floors and are stronger than thestructural analysis model, it would be expected that the empirical fragility curves should indicatelower levels of damage. This is true for the “washed away” (DS6) and “collapse” (DS5) damagestates, but not the case of “complete damage” (DS4) and “major damage” (DS3).
0
0.1
0.2
0.3
0.4
0.5
0.6
0.7
0.8
0.9
1
0 2 4 6 8
Dam
age
Exce
ed
ance
Pro
bab
ility
Inundation Depth (m)
Empirical: "DS3"MajorEmpirical: "DS4"CompleteEmpirical: "DS5"CollapseEmpirical: "DS6"Washed AwayAnalytical: "DS3"MajorAnalytical: "DS4"CompleteAnalytical: "DS5"CollapseAnalytical: "DS6"Washed Away

10
The empirical curves appear to be spread over a wider range, so that the “major damage” curve (DS3)is higher and the “washed away” curve (DS6) is lower than the analytical curves. The analytical“major damage” curve (DS3) appears to be more closely correlated with the empirical “completedamage” curve (DS4) suggesting that the analytical criteria of yield first appearing in the loadbearingelements of the structure may be a more suitable definition for DS4, than the currently assigned DS3(Table 3). The analytical “collapse” curve (DS5) lies close to the empirical “collapse” curve indicatingthat column crush may be an adequate indicator of collapse, if also accounting for vertical loadredistribution (i.e. the capacity of the structure to survive losing loadbearing elements). The “washedaway” curves (DS6) do not show good correlation, possibly indicating that numerical instability islikely not a reliable criteria, as this can be indicative of a number of features of the analysis and can beaffected by altering the calculation parameters so is subjective to the analysis package used.
NEXT STEPS FOR ANALYTICAL FRAGILITY FUCTION DERIVATION
Structural ModellingIt will be necessary to extend the analysis to a series of structural models which represent thepopulation of buildings for which the fragility functions are being produced (the outer loop in Figure1). There will be material and geometric variability within the building population and whengenerating analytical models it may be possible to represent this variability by considering the buildingas a series of parameters defined as random variables of defined distribution, mean and standarddeviation (Tiziana Rossetto and Elnashai 2005). Each time an analytical model is generated (i.e. foreach step in the outer loop shown in Figure 1) the building can be generated by taking a randomsample of each of the parameters that define the structure.
In addition to inter-story heights, slab and beam dimensions, reinforcement details and materialstrengths, there are several additional factors which will affect a building’s response to tsunamiloading, and so must be captured in the analytical model. The following factors are often considered inseismic fragility function derivation: the redundancy of vertical load paths, the presence of deep orshallow foundations, the building age and the design standards followed. The following factors are notconsidered in seismic fragility function derivation and so are new considerations for tsunami fragilityfunction derivation: building permeability (e.g. considering the presence of openings and break-awaywalls), the presence of shelter in the seaward direction, and the orientation of the structure.
The range of tsunami-induced failure mechanisms will need to be incorporated in the analytical model,and the significance of conducting more detailed 3D structural analysis (and simplified single-degree-of-freedom system analysis) on fragility function accuracy will be examined in future studies.
Tsunami LoadingThe differences in the IM-EDP relationships shown in Figure 8 highlight that the resultant damagepredictions (i.e. the implementation of the derived fragility functions) will be different, depending onthe loading regime used. This highlights that structural analysis for accurate damage predictionsrequires the loading applied to be as realistic as possible (in terms of both magnitude and distribution)for each inundation depth, and so simplified and conservative loading defined for design purposes maynot provide the required accuracy. To ascertain the validity of using design standard forces for fragilityfunction derivation it will be necessary to compare results with those using more detailed time-historyforces from physical experiments (Robertson and Riggs 2011; Tiziana Rossetto et al. 2011).
The distribution of loading parameter variables for a given IM (e.g. range and probability distributionof loads for a given inundation depth) will also need to be examined in order to perform the inner loopiterations shown in Figure 1.

J. Macabuag and T. Rossetto 11
Intensity Measure (IM)Relying on inundation depth as a single parameter to characterise tsunami hazard when other factorsare also at play in a tsunami-building interaction scenario is likely to be inaccurate, as shown by(Charvet et al. 2014). Flow velocity is another major factor, which has the potential to be incorporatedin analytical fragility functions. Further considerations which may affect tsunami intensity are:duration of immersion and the total number of waves, the likelihood of debris impacts, and the level ofpreceding seismic damage.
Engineering Demand Parameter (EDP) and Damage State DefinitionThe preliminary ISD threshold estimates given in Table 5 are based on analysis of only one building,and so this analysis would have to be extended to populations of buildings to improve accuracy, andprovide EDP-based damage scales for multiple building types. However, it should be noted that it isdifficult to correlate and validate the resulting damage state thresholds as very limited physical andexperimental data exists.
In addition, ISD has been assumed as the EDP in this preliminary study, due to its propensity inseismic analytical fragility function derivation. However, this assumption will need to be examined asalternative EDPs may be more appropriate for tsunami damage prediction, or it may prove moreaccurate to define damage states based directly on element performance, such as the criteria shown inTable 4.
Statistical ModellingWhilst the use of the generalized linear model in this preliminary study avoids the discussed pitfalls oflinear regression, rigorous statistical modelling will require the use of model diagnostic tools (e.g.absolute goodness-of-fit tests) and quantification of uncertainty (e.g. through confidence intervals, TRossetto et al. (2014)).
CONCLUSION
This paper has presented a proposed method for deriving analytical tsunami fragility functions,demonstrated by a simple example for an RC frame structure using design standard tsunami loadings.The main conclusions are as follows:
The analytical fragility functions produced are order-of-magnitude comparable to empiricalfragility functions derived from the 2011 Great East Japan Earthquake and Tsunami. Analysismust be carried out for populations of buildings, and considering more realistic forces andfailure mechanisms, to build confidence in the fragility functions produced. However, thecomparison serves to demonstrate the validity of the proposed method for generatinganalytical fragility functions.
The selection of the tsunami Intensity Measure (IM), Engineering Demand Parameter (EDP),damage state definition and building type poses a number of considerations that are separatefrom those for seismic fragility function derivation. Therefore, each parameter must be closelyexamined for the unique case of tsunamis, in order to develop accurate analytical tsunamifragility functions.
The tsunami pushover curve of a structure is very sensitive to the load distribution applied.Similarly, the definition of load as a function of the tsunami intensity measure (e.g. depth) hasa large effect on the resultant damage prediction. Therefore the loading applied must be asrealistic as possible for each inundation depth, and conservative design guidance loadings maygive inaccurate damage prediction results.

12
REFERENCES
Baker, Jack W. 2013. “Efficient Analytical Fragility Function Fitting Using Dynamic Structural Analysis.”Carvalho et Al. 1999. Preparation of the Full-Scale Tests on Reinforced Concrete Frames – Definition of the Specimens, Loads and Testing
Conditions – ICONS Topic 2.Charvet, I., I. Ioannou, T. Rossetto, a. Suppasri, and F. Imamura. 2014. “Empirical Fragility Assessment of Buildings Affected by the 2011
Great East Japan Tsunami Using Improved Statistical Models.” Natural Hazards. http://link.springer.com/10.1007/s11069-014-1118-3 (April 3, 2014).
Chock, Gary Y.K. 2013. “Development of Tsunami Structural Design Provisions for the USA.” In 10th International Conference on UrbanEarthquake Engineering,.
Chock, Gary Y.K., Ian N Robertson, DL Kriebel, Mathew Francis, and Ioan Nistor. 2013. Tohoku, Japan, Earthquake and Japan of 2011:Performance of Structures under Tsunami Loads. ASCE.
D’Ayala, D, A Meslem, D Vamvatsikos, K Porter, Tiziana Rossetto, Helen Crowley, and V Silva. 2013. Guidelines for AnalyticalVulnerability Assessment. http://www.nexus.globalquakemodel.org/gem-vulnerability/posts/guidelines-for-analytical-vulnerability-assessment.
EEFIT. 2006. 44 The Indian Ocean Tsunami of 26 December 2004 : Mission Findings in Sri Lanka and Thailand.http://www.istructe.org/webtest/files/74/74b66946-020a-430d-a684-0f71ff0d2a23.pdf.
———. 2011. “Field Report: Earthquake and Tsunami of 11th March 2011.” (March).———. 2013. Field Report (Return Mission): Earthquake and Tsunami of 11th March 2011.EERI, and IAEE. “World Housing Encyclopedia.” http://www.world-housing.net/ (September 12, 2013).FEMA. 2012. “FEMA 646: Guidelines for Design of Structures for Vertical Evacuation from Tsunamis.” (April).Fukuyama, Hiroshi, Hiroto Kato, and Tadashi Ishihara. 2013. “Categorization of Damage to Buildings Caused by the 3.11 Tsunami.” In 14th
U.S.-Japan Workshop on the Improvement of Structural Design and Construction Practices, , 1–8.https://www.atcouncil.org/files/ATC-15-13/Papers/03_FUKUYAMApaper.pdf.
Gokon, H, S Koshimura, and M. Matsuoka. 2010. “Developing Tsunami Fragility Curves for Structural Destruction in American Samoa.” In8th International Workshop on Remote Sensing for Disaster Response,.
Lloyd, T O, and T Rossetto. 2012. “A Comparison between Existing Tsunami Load Guidance and Large-Scale Experiments with Long-Waves .” In 15 World Conference on Earthquake Engineering,.
Macabuag, Joshua, Tiziana Rossetto, and Tristan LLoyd. 2014a. “SENSITIVITY ANALYSES OF A FRAMED STRUCTURE UNDERSEVERAL TSUNAMI DESIGN-GUIDANCE LOADING REGIMES.” In 2nd European Conference on Earthquake Engineeringand Seismology,.
———. 2014b. “STRUCTURAL ANALYSIS FOR THE GENERATION OF ANALYTICAL TSUNAMI FRAGILITY FUNCTIONS.” In10th International Conference on Urban Earthquake Engineering,.
Meslem, A, and D D Ayala. 2012. “Toward Worldwide Guidelines for the Development of Analytical Vulnerability Functions andFragility.” In 15 World Conference on Earthquake Engineering,.
MLIT. 2011. Further Information Concerning the Design Method of Safe Buildings That Are Structurally Resistant to Tsunamis - TechnicalAdvice No. 2570.pdf.
Reese, Stefan, Brendon a. Bradley, Jochen Bind, Graeme Smart, William Power, and James Sturman. 2011. “Empirical Building Fragilitiesfrom Observed Damage in the 2009 South Pacific Tsunami.” Earth-Science Reviews 107(1-2): 156–73.http://linkinghub.elsevier.com/retrieve/pii/S0012825211000183 (November 20, 2012).
Robertson, Ian N, and H. Ronald Riggs. 2011. “OMAE2011-49487 Tsunami Bore Forces on Walls.” In Proceedings of the ASTM 2011 30thInternal Conference on Ocean, Offshore and Arctic Engineering,.
Rossetto, T, I Ioannou, D N Grant, and T Maqsood. 2014. Guidelines for Empirical Vulnerability Assessment Report Produced in theContext of the Vulnerability Global Component Project. http://www.nexus.globalquakemodel.org/gem-vulnerability/posts/guidelines-for-empirical-vulnerability-assessment.
Rossetto, T., and a. Elnashai. 2003. “Derivation of Vulnerability Functions for European-Type RC Structures Based on Observational Data.”Engineering Structures 25(10): 1241–63. http://linkinghub.elsevier.com/retrieve/pii/S0141029603000609 (December 19, 2012).
Rossetto, Tiziana, William Allsop, Ingrid Charvet, and David I. Robinson. 2011. “Physical Modelling of Tsunami Using a New PneumaticWave Generator.” Coastal Engineering 58(6): 517–27. http://linkinghub.elsevier.com/retrieve/pii/S0378383911000135 (November25, 2012).
Rossetto, Tiziana, and Amr Elnashai. 2005. “A New Analytical Procedure for the Derivation of Displacement-Based Vulnerability Curvesfor Populations of RC Structures.” Engineering Structures 27(3): 397–409.http://linkinghub.elsevier.com/retrieve/pii/S0141029604003499 (January 22, 2013).
Suppasri, a., S. Koshimura, and F. Imamura. 2011. “Developing Tsunami Fragility Curves Based on the Satellite Remote Sensing and theNumerical Modeling of the 2004 Indian Ocean Tsunami in Thailand.” Natural Hazards and Earth System Science 11(1): 173–89.http://www.nat-hazards-earth-syst-sci.net/11/173/2011/ (January 10, 2013).
Suppasri, Anawat, Shunichi Koshimura, and Fumihiko Imamura. 2009. “Tsunami Fragility Curves and Structural Performance of Buildingalong the Thailand Coast.” (2008): 3–8.
Suppasri, Anawat, Erick Mas, Ingrid Charvet, Rashmin Gunasekera, Kentaro Imai, Yo Fukutani, Yoshi Abe, and Fumihiko Imamura. 2013.“Building Damage Characteristics Based on Surveyed Data and Fragility Curves of the 2011 Great East Japan Tsunami.” NaturalHazards 66(2): 319–41. http://www.springerlink.com/index/10.1007/s11069-012-0487-8 (February 11, 2013).
Suppasri, Anawat, Erick Mas, Shunichi Koshimura, Kentaro Imai, Kenji Harada, and Fumihiko Imamura. 2012a. “Developing TsunamiFragility Curves From the Surveyed Data of the 2011 Great East Japan Tsunami in Sendai and Ishinomaki Plains.” CoastalEngineering Journal 54(01): 1250008–1. http://www.worldscinet.com/cej/54/5401/S0578563412500088.html (January 10, 2013).
———. 2012b. “Developing Tsunami Fragility Curves From the Surveyed Data of the 2011 Great East Japan Tsunami in Sendai andIshinomaki Plains.” Coastal Engineering Journal 54(01): 1250008–1.http://www.worldscinet.com/cej/54/5401/S0578563412500088.html (January 10, 2013).