5.1.4 List of Programmes and Number of students benefitted ...

...towards global sustainable development


Green Growth and Sustainable Development
in India
...towards global sustainable development

DisclaimerThe Global Green Growth Institute does not make any warranty, either express or implied, or assumes any legal liability or responsibility for the accuracy, completeness, or any third party’s use or the results of such use of any information, apparatus, product, or process disclosed of the information contained herein or represents that its use would not infringe privately owned rights. The views and opinions of the authors expressed herein do not necessarily state or reflect those of the Global Green Growth Institute.
While every effort has been made to ensure the correctness of data/information used in this report, neither the authors nor Institutes accept any legal liability for the accuracy or inferences drawn from the material contained therein or for any consequences arising from the use of this material.
© The Energy and Resources Institute and Global Green Growth Institute
ISBN: 978-81-7993-584-2
Suggested CitationGGSDI (2015). Green Growth and Sustainable Development in India. Implemented by The Energy and Resources Institute (TERI) and Global Green Growth Institute (GGGI).
Published by
The Energy and Resources Institute (TERI)
TERI Press Tel. 2468 2100 or 4150 4900
Darbari Seth Block Fax 2468 2144 or 2468 2145
IHC Complex, Lodhi Road India +91 • Delhi (0)11
New Delhi – 110 003 E-mail [email protected]
India Website www.teriin.org
Bookstore https://bookstore.teri.res.in


PreludeThe Ministry of Environment, Forest and Climate Change recognizes ‘poverty eradication along with green growth’ as central to India’s sustainable development narrative. This vision also embodies the cogent definition of ‘green growth’ by the Thirteenth Finance Commission of India as a narrative that enables rethinking growth strategies with regard to their impact(s) on environmental sustainability and inclusiveness. The concept of green growth assumes centrality of socio-economic inclusivity to sustainable development in India.
About the ProjectThe project, Initiative on Green Growth and Development in India, aims to evaluate options by which the Indian economy can move towards an inclusive green growth paradigm of development. The evaluation aims to combine the rigorous scientific and economic studies done at the national and state levels (Punjab and Himachal Pradesh). The collaborative research project implemented by The Energy and Resources Institute with support from the Global Green Growth Institute, uses an integrated systems modelling framework that robustly identified the opportunities for green growth in terms of efficient use of natural resources, the adoption of new technologies, the minimization of environmental impacts, and the reduction of risks associated with natural hazards and commodity scarcities. A rich mix of quantitative analysis and stakeholder engagement was used to inform interventions and policy recommendations. The project has benefitted richly from a very effective project management architecture that comprised of a national steering committee, supported by the project management committee. At the state level, the team received strategic and technical inputs from the nodal departments; the Department of Science, Technology, Environment and Non-conventional Energy, Government of Punjab along with the Punjab State Council for Science & Technology is the nodal agency of the project for Punjab while the Department of Environment, Science and Technology, Government of Himachal Pradesh is the nodal agency in Himachal Pradesh.
ApproachThe study uses evidence-based analytical methods for developing policy choices and green growth opportunities. The analytical insights produced are validated against case studies from field visits, extensive government-stakeholder consultation, and a comprehensive policy landscape analysis of sector-wise interventions in Himachal Pradesh and Punjab. The illustration below indicates the suite of analytical tools deployed by the team.
Outcomes In order to understand linkages between development outcomes and green interventions, two sets of models are considered. On one side, the energy supply and demand has been analysed through an energy system model, TERI-MARKAL (MARKet Allocation MARKAL). On theeconomy side, a simulation-based dynamic, recursive computable general equilibrium (CGE) model is used. The study has been able to generate, unique high resolution, actionable climate and spatial information for policy making in the two states. In addition to the model outputs (SWAT, PRECIS), the study has also looked at field-based case studies for specific challenges faced by the state governments in Punjab and Himachal Pradesh.
Initiative on Green Growth and Development in India


MentorsR K Pachauri, Director-General, TERIProdipto Ghosh, Distinguished Fellow, TERISiddarthan Balasubramanian, Country Head-India, GGGISuneel Pandey, Senior Fellow, TERI
AdvisorsMili Majumdar, Senior Fellow, TERIShri Prakash, Distinguished Fellow, TERIShirish S Garud, Senior Fellow, TERISuruchi Bhadwal, Fellow, TERIJ V Sharma, Senior Fellow, TERIS Vijay Kumar, Distinguished Fellow, TERIPrakashkiran S Pawar, Fellow, TERISumit Sharma, Fellow, TERIProsanto Pal, Senior Fellow, TERIKaushik Ranjan Bandyopadhyay, Associate Professor, TERI University K Ramanathan, Distinguished Fellow, TERINitya Nanda, Fellow, TERINeha Pahuja, Fellow, TERIPia Sethi, Fellow, TERI
ReviewersSanjib Pohit, Senior Principal Scientist, National Institute of Science, Technology and Development Studies Ritu Mathur, Senior Fellow, TERI
Lead AuthorsShailly Kedia, Fellow, TERI (Principal Investigator)Anandajit Goswami, Fellow, TERI (Modelling Lead)Atul Kumar, Fellow, TERI (Modelling Co-lead)Ajith Radhakrishnan, Senior Technical Advisor, GGGIPrasoon Agarwal, Senior Technical Advisor, GGGI Aparna Vashisht, Research Associate, TERIRinki Jain, Associate Fellow, TERISaswata Chaudhury, Fellow, TERIIlika Mohan, Associate Fellow, TERIAshutosh Senger, Research Associate, TERINishant Jain, Research Associate, TERIShyamasis Das, Associate Fellow, TERISarbojit Pal, Fellow, TERI
Team

viii Green Growth and Sustainable Development in India
Saptarshi Das, Research Associate, TERIAastha Sharma, Research Associate, TERI
Contributing AuthorsSaahil Parekh, Research Associate, TERI Siddharth Singh, Research Associate, TERIHina Zia, Fellow, TERI Charu Sharma, Research Associate, TERIJai Kishan Malik, Research Associate, TERIShilpanjali Sarma, Fellow, TERIGirija K Bharat, Fellow, TERIJonathan Donald Syiemlieh, Associate Fellow, TERISwati Mitchelle DSouza, Research Associate, TERI Chinmay Kinjavdekar, Associate Fellow, TERIAshish Aggarwal, Fellow, TERI Yogesh Gokhale, Fellow, TERISuresh Chauhan, Fellow, TERISandhya Sundararagavan, Research Associate, TERIAkshima Tejas Ghate, Fellow, TERI Seema Singh, Research Associate, TERIRicha Mahtta, Research Associate, TERIUpinder Singh Dhingra, Associate Fellow, TERIKarnika Palwa, Research Associate, TERIKanwal Nayan Singh, Research Associate, TERISwati Agarwal, Associate Fellow, TERIDivya Mohan, Associate Fellow, TERIAshish John George, Research Associate, TERI
Project AssociateM K Bineesan, Project Associate, TERI
Executive SupportP D Tiwari, Senior Secretary, TERI Karthik Gopavarapu, Administrative Officer, GGGI
TERI PressAnushree Tiwari SharmaSpandana ChatterjeeRajiv SharmaMansi GuptaR K JoshiShilpa MohanAman Sachdeva
B K Chaturvedi, Former Member, Planning Commission; Former Cabinet Secretary, Government of India (Chair)
R K Pachauri, Director General, The Energy and Resources Institute
P Mitra, Chief Secretary, Government of Himachal Pradesh
Deepak Sanan, Additional Chief Secretary, Department of Environment, Science, and Technology
Sarvesh Kaushal, Chief Secretary, Government of Punjab
G Vajralingam, Principal Secretary, Department of Science, Technology, and Environment, Government of Punjab
Per Bertilsson, Assistant Director-General, Global Green Growth Institute
Onno Ruhl, India Country Director, World Bank
United Nations Resident Coordinator, India (Ex-Officio)
Naina Lal Kidwai, Country Head, HSBC India; Director HSBC Asia Pacific
R V Verma, Chairman and Managing Director, National Housing Bank
Prabir Sengupta, Distinguished Fellow, TERI; Former Secretary, Ministry of Commerce and Industry
Prodipto Ghosh, Distinguished Fellow, TERI; Former Secretary, Ministry of Environment and Forests
Shri Prakash, Distinguished Fellow, TERI; Former Member, Ministry of Railways
S Vijay Kumar, Distinguished Fellow, TERI; Former Secretary, Ministry of Rural Development
Steering Committee


1. Green Growth and Policy Imperatives 1
2. Environmental Performance in India 11
3. Energy and Development 23
4. Development and Macro-economic Implications of Green Growth 35
5. The Road Ahead 43
6. Conclusion 67
7. Annexures 69
8. References 75
Contents


AIBP Accelerated Irrigation Benefits Program
AITD Asian Institute of Transport Development
APC Advanced Process Control
APCE Air Pollution Control Equipment
BATs Best Available Technologies
BCM Billion Cubic Meters
BIS Bureau of Indian Standards
CAGR Compound Annual Growth Rate
CAMPA Compensatory Afforestation Management and Planning Authority
CBD Convention on Biological Diversity
CERC Central Electricity Regulatory Commission
CGE Computable General Equilibrium
CITEs Convention on International Trade in Endangered Species of Wild Fauna and Flora
CMS Conservation of Migratory Species
CO2 Carbon dioxide
DCS Distributed Control System
ECC Energy Coordination Committee
EESL Energy Efficiency Services Limited
EETs Energy Efficient Technologies
EIA Environmental Impact Assessment
EKC Environmental Kuznets’s Curve
EnMS Energy Management System
EPI Environmental Performance Index
ERP Enterprise Resource Planning
ESI Environmental Sustainability Index
FDA Forest Development Agencies
FFC Fourteenth Finance Commission
FIs Financial Institutions
FIT Feed-in Tariff
GBD Global Burden Disease Study
GC/GMEF Governing Council/Global Ministerial Environment Forum
GEI Green Economy Initiative
Abbreviations

xiv Green Growth and Sustainable Development in India
GGGI Global Green Growth Institute
GHG Greenhouse Gas
GIS Gas Insulated Substations
HDI Human Development Index
HSIL High Surge Impedance Loading
IC Improved Chullahs
ICT Information and Communication Technology
IHR Indian Himalayan Region
INDC Intended Nationally Determined Contribution
ISO International Standards Organization
IUCN International Union for Conservation of Nature
IWC International Whaling Commission
JFMCs Joint Forest Management Committees
LCIG Low Carbon strategies for Inclusive Growth
LPG Liquid Petroleum Gas
LSPs Local Service Providers
MCED Ministerial Conference on Environment and Development
MDGs Millennium Development Goals
MEAs Multi-lateral Environment Agreements
MEPS Minimum Energy Performance Standards
MIS Micro-irrigation Systems
MLD Million Litres per Day
MMI Major and Medium Irrigation
MNREGS Mahatma Gandhi National Rural Employment Guarantee Scheme
MoEF Ministry of Environment and Forests
MoEFCC Ministry of Environment, Forest and Climate Change
MNRE Ministry of New and Renewable Energy
MUDRA Micro Units Development Refinance Agency
NAAQM National Ambient Air Quality Monitoring
NAMP National Air Monitoring Programme
NEERI National Environmental Engineering Research Institute
NSDP Net State Domestic Product
NTFP Non-Timber Forest Products
OECD Organization for Economic Co-operation and Development
OPC Ordinary Portland Cement
PA Protected Areas

xvGreen Growth and Sustainable Development in India
PAT Perform-Achieve-Trade
PAYT Pay-As-You-Throw
PIM Participatory Irrigation Management
PPP Public-Private Partnership
PRIs Panchayati Raj Institutions
PSC Portland Slag Cement
PUC Pollution under Control
R-APDRP Restructured Accelerated Power Development and Reforms Programme
RDD&D Research, Development, Demonstration and Deployment
REC Renewable Energy Certificates
RITES Rail India Technical and Economic Service
RoK Republic of Korea
RPOs Renewable Purchase Obligations
RSPM Respirable Suspended Particulate Matter
SAPCC State Action Plan on Climate Change
SCADA Supervisory Control and Data Acquisition
SEC Specific Energy Consumption
SMEs Small-scale Manufacturing Enterprises
SUDS Sustainable Urban Drainage Systems
TCSC Thyristor Controlled Series Compensation
TDM Travel Demand Management
TFC Thirteenth Finance Commission
ULBs Urban Local Bodies
UNESCAP United Nations Economic and Social Commission for Asia and the Pacific
UNESCO-WHC United Nations Educational, Scientific and Cultural Organization-World Heritage Committee
WHO World Health Organization
WHPG Waste Heat Power Generation
WUAs Water Users Associations


The 2030 Sustainable Development Agenda with 17 sustainable development goals and 169 targets that were adopted in September 2015 demonstrate the scale and ambition of member states in the new universal agenda.The Constitution of India contains specific provisions for the protection and improvement of environmental quality. Article 48-A of the constitution says that “the state shall endeavour to protect and improve the environment and to safeguard the forests and wild life of the country.” Article 51-A (g) says that “It shall be duty of every citizen of India to protect and improve the natural environment including forests, lakes, rivers and wild life and to have compassion for living creatures.” These provisions highlight the national conscience on the importance of environment protection. The National Environment Policy of the Ministry of Environment, Forests, and Climate Change highlights important principles around sustainable development such as social justice, polluter pays, and entities of incomparable value. The National Action Plan on Climate Change (NAPCC) along with the State Action Plan on Climate Change are important milestones for mainstreaming climate in development processes at the national and state levels. NAPCC has eight national missions that outline priorities for both mitigation and adaptation to combat climate change. The current eight missions are on the areas of solar energy, energy efficiency, sustainable habitat, sustainable agriculture, Green India, water, Himalayan ecosystem, and strategic knowledge. The government is proposing to set up new missions on wind energy, health, waste-to-energy, coastal areas, and also redesigning the National Water Mission and National Mission on Sustainable Agriculture. Under the Copenhagen Accord, India communicated its domestic mitigation action as an endeavour to reduce the emissions intensity of its GDP by 20–25% by 2020 in comparison to the 2005 level. More recently in its Intended Nationally Determined Contributions (INDCs), India has announced to reduce the emissions intensity of its GDP by 33–35% by 2030 in comparison to the 2005 level. Box A depicts India’s eight-point INDCs.
Executive Summary
Box A: India’s Eight-Point Intended Nationally Determined Contribution
1. To put forward and further propagate a healthy and sustainable way of living based on traditions and values of conservation and moderation.
2. To adopt a climate friendly and a cleaner path than the one followed hitherto by others at corresponding level of economic development.
3. To reduce the emissions intensity of its GDP by 33–35 per cent by 2030 from 2005 level.4. To achieve about 40 per cent cumulative electric power installed capacity from non- fossil fuel–based
energy resources by 2030 with the help of transfer of technology and low cost international finance including from Green Climate Fund (GCF).
5. To create an additional carbon sink of 2.5–3 billion tonnes of CO2 equivalent through additional forest and
tree cover by 2030.6. To better adapt to climate change by enhancing investments in development programmes in sectors
vulnerable to climate change, particularly agriculture, water resources, Himalayan region, coastal regions, health, and disaster management.
7. To mobilize domestic and new and additional funds from developed countries to implement the above mitigation and adaptation actions in view of the resource required and the resource gap.
8. To build capacities, create domestic framework and international architecture for quick diffusion of cutting edge climate technology in India and for joint collaborative research and development for such future technologies.
Source: Intended Nationally Determined Contribution submitted by Government of India

xviii Green Growth and Sustainable Development in India
The concept of Green Growth spans much beyond climate mitigation and adaptation and aims at achieving economic growth that is socially inclusive and environmentally sustainable. The Ministry of Environment, Forests, and Climate Change recognized green growth in its vision, wherein ‘poverty eradication’ along with green growth is seen to be central. The Finance Commission of India articulated green growth as involving “rethinking growth strategies with regard to their impact(s) on environmental sustainability and the environmental resources available to poor and vulnerable groups.” It is clear—from the articulation by the Finance Commission as well as the Ministry of Environment, Forests, and Climate Change—that inclusivity is central to green growth in India. The Fourteenth Finance Commission has introduced a forward-looking incentive-based grant rewarding the states with quality forest cover measured by moderate and very dense forest cover. The Government of India has an ambitious renewable capacity target of 175 GW by 2022. In the last 15 months, the government quadrupled the coal cess from `50 per tonne to `200 per tonne, the proceeds of which will go towards the National Clean Energy Fund. The Smart Cities Mission of the Government of India aims to promote cities that provide not just infrastructure but also give a good quality of life to its citizens, a clean and sustainable environment through application of ‘smart’ solutions.
India’s Green Growth ChallengesIndia is emerging as the one of the fastest growing economies in the world and is currently Asia’s third largest economy by GDP.1 India’s gross national income for 2014–15 was `105.27 trillion with an annual growth rate of 7.4% (Economic Survey 2014–15).2 The share of services sector is the largest in total GDP of India at 57% (in 2013), followed by industrial sector at 25%, and balance 18% being contributed by the agriculture sector.3 In 2014, India’s total population stood at 1.29 billion and its share in the world population was around 17.84%. Globally, economic growth seemed to have picked up in the last one year and it is expected to further improve in 2015–16. Key development indicators for India and select countries are listed in Table 1. For India to achieve development objectives, its economy should continue to grow. But for a country like India, where development is an imperative, environmental consequences can be substantial as it will place serious constraints on natural resources such as land, water, minerals, and fossil fuels, driving up energy and commodity prices. The extent to which its economy will “grow green” will depend on its ability to reduce the quantity of resources required over time to support economic growth that leads to enhancement of social equity and job creation. Green growth could play an important role in balancing these priorities. However, managing fiscal deficits and public debts are two key challenges for national policy making, which could make technological change required for green growth more difficult. Fiscal considerations and trade balance will also continue to be important drivers for shaping India’s macro-economic policy. Hence, it becomes essential to understand and maximize the development benefits, such as on such as income, energy access, and trade, of green growth interventions across all key sectors. It is observed that countries with higher human development have a higher ecological footprint (Figure 1). Therefore, as India accelerates its development journey to lift the millions of people out of poverty, the challenge before it is to provide
What is Green Growth?
Green growth involves rethinking growth strategies with regard to their impact(s) on environmental sustainability and the environmental resources available to poor and vulnerable groups.
(Para 3.15, Thirteenth Finance Commission Report)
The Ministry of Environment, Forests, and Climate Change recognizes green growth and poverty eradication to contribute to the vision of sustainable development.
1 World Bank Development Indicators. Details available at <data.worldbank.org>.2 New Series, Advanced Estimates.3 Source: World Bank Development indicators.

xixGreen Growth and Sustainable Development in India
improved quality of life to their citizens within the ecological space and constraints—and the fault lines on key green growth indicators are already visible, as described below.
Air and Water Pollution
Concentration of the pollutants monitored show that respirable suspended particulate matter concentrations violate the National Ambient Air Quality Standards for most cities. According to Central Pollution Control Board, class I cities and class II towns in the country generate around 38,254 million litres per day (MLD) of sewage of which only 11,787 MLD (31%) is treated and balance is discharged untreated.
Forests
According to the Forest Survey of India, forest and tree cover spreads across 78.92 million hectares and constitutes 24.01% of the geographical area of the country. There has been an increase in forest cover by 5,871 sq. km compared to 2011 assessment by Forest Survey of India; but there has been slight decline in moderately dense, and increase in open forest category. There has been a decline in growing stock of the country by 389 cu. m between 2011 and 2013, which suggests a decline in quality of forest despite the increase in overall increase in forest and tree cover.
Bio-Diversity
India is a mega-diverse country with only 2.4% of the world’s land area and harbours a significant proportion of recorded species. Of the 34 global biodiversity hotspots, four are present in India, that is, the Himalayas, the Western Ghats, the Northeast, and the Andaman and Nicobar Islands. According to International Union for Conservation of Nature Red List, in 2015, 1,039 species were categorized as threatened species for India.
Table 1: Key development indicators for India and select countries
GDP in billion
(constant 2005 US$)a
GDP per capita
(constant 2005 US$)a
CO2 emissions
(MT)b
CO2
emissions (metric tons per capita)b
Energy use (kilograms of oil equivalent per capita)c
International Trade
Balance in Goodsa
Cash surplus/deficit (% of
GDP)c
Brazil 1206 5853 439.41 2.19 1391.90 –4.13 –1.84
China 5274 3866 9019.52 6.71 2142.81 370.02 _
European Union
15372 30241 3574.10 7.07 3253.82 134.78 –3.63
India 1600 1235 2074.34 1.66 623.72 –139.88 –3.81
Japan 4780 37595 1187.66 9.29 3545.60 –120.64 –7.97
Russian Federation
1000 6844 1808.07 12.65 5283.41 188.04 2.67
United States
14797 46405 5305.57 17.02 6814.82 –727.15 –7.56
South Africa
329 6086 477.24 9.26 2674.82 –18.1 –4.47
World 58055 7996 34649.483 4.94 1897.95 _ –4.94
Note: Data for various years: a2014, b2011, c2012Source: World Development Indicators (data.worldbank.org); Column on International Trade from OECD.stat
Figure 1: Ecological footprint and human development

xx Green Growth and Sustainable Development in India
Water
India is moving towards perennial water shortage. The National Institute of Hydrology estimates water availability for India to be 938 cubic metre per capita per year. A country with less than 1,700 cubic metre per capita per year is considered as water stressed. Irrigation is the heaviest user of surface and ground water presently and is projected to be so even in 2025 and 2050. Additional water demand will come from the domestic and industrial sectors. There is an urgent need for water efficiency measures in all sectors but especially irrigation.
Climate Change
Past observations indicate that the annual mean temperature of India has showed significant warming trend of 0.51°C per 100 year, during the period 1901–2007 with increased warming during 1971–2007 (Kothawale et al. 2010; INCCA 2010). Projections for 2030 also indicate a warming trend for the Indian sub-continent. The ecological impacts anticipated with even 2°C of warming are quite intense in itself and the situation could be much worse at higher temperature rise.
Energy
Energy supply in India is heavily dependent on fossil fuels with coal and petroleum products together accounting for about 88% of the total primary energy supply. Most of the oil consumed in the country is imported, posing serious challenges for long-term energy security. According to International Energy Agency, in 2012, India had more than 300 million people who were deprived of electricity and more than 800 million people were dependent on solid biomass as fuel for cooking. According to Census 2011, 43% of rural households used kerosene as primary energy source for lighting. Since energy access has strong development implications, this is a serious challenge that the government is currently trying to address.
Urbanization
Cities contribute to almost two-thirds of India’s Gross Domestic Product (MoUD, undated)4 and will assume even greater role as India embarks on higher economic growth. At the same time, Indian cities face severe challenges related to quality and availability of infrastructure, such as power, telecom, roads, water supply, and mass transportation, which could pose serious constraints to economic growth if left unaddressed.
Green growth Interventions and Their ImpactThe objective of this integrated techno-economic analysis is to understand the impact of energy-related green growth interventions on future energy demand, emissions, energy access, energy security, and development indicators. In order to understand these inter-linkages, an integrated modelling framework has been used, combining a bottom-up energy systems model (TERI-MARKAL) along with a top-down simulation-based dynamic, recursive computable general equilibrium model. This integrated modelling framework was used to conduct scenario analysis around the following green growth interventions:• Energy efficiency and conservation measures in energy demand sectors (agriculture, transport, industry sector, commercial
building, and residential sector)• Enhancement of modern energy access• Promotion of clean energy supply through renewables and cleaner fossil-fuel–based energy generation technology, and • Resource (soil and water) conservation in the agriculture sector. For understanding the implications of these green growth interventions on energy and development indicators, four scenarios were considered—varying in the type and range of interventions considered. These scenarios are (a) Reference (REF), (b) Policy (POL), (c) Ambitious-1 (AMB-1), and (d) Ambitious-2 (AMB-2). The REF Scenario is in line with a business-as-usual scenario. POL Scenario assumes effective implementation of existing policies. The Ambitious Scenarios comprises of measures that includes implementation action over and above what is considered in the POL Scenario.
4 Available from: http://jnnurm.nic.in/wp-content/uploads/2011/01/PMSpeechOverviewE.pdf; last accessed October 18, 2015.

xxiGreen Growth and Sustainable Development in India
Figure 2 depicts the fuel-wise primary energy supply across the four scenarios. Under the REF scenario, primary energy supply grows by more than double, from 869 Mtoe in 2015 to 2,017 Mtoe in 2031. Coal is projected to remain the mainstay of Indian energy system, although its share reduces considerably during the projection period. By 2031, in the POL scenario, primary energy supply from coal drops to 818 Mtoe, while under the AMB-1 and AMB-2 scenarios, it further drops to 609 Mtoe and 590 Mtoe, respectively. Correspondingly, the share of renewables in the primary energy supply mix increases by 2031 in the POL and Ambitious scenarios. Share of traditional biomass in primary energy supply reduces from 20% in 2015 to about 10% in 2031 (across scenarios) owing to better access to clean energy (such as improved cook-stoves) and improved quality in rural areas. In the long run (by 2031), natural gas also takes an important place in the Indian energy mix, especially under the Ambitious scenarios.
Figure 3 depicts the power generation capacity mix across the four scenarios. Although the share of coal-based installed capacity decreases substantially by 2031, it continues to be the single largest source of electricity generation. Amongst renewables, solar-based installed capacity increases substantially by 2031, from 12 GW in 2015 to 215 GW under POL scenario, and 220 and 310 GW under AMB-1 and AMB-2 scenarios, respectively. Overall, the share of non-fossil power generation sources increases from about 32% in 2015, to about 46% under POL scenario, and 47% and 52% under AMB-1 and AMB-2 scenarios, respectively.
Figure 4 shows final energy demand under the four scenarios. The three major energy-consuming sectors, namely industry, residential, and transport, continue their dominance of the final energy demand, contributing about 90% over the modelling horizon under REF scenario. Transport sector energy demand witnesses a noticeable increase, growing by almost three times, from 125 Mtoe in 2015 to about 360 Mtoe in 2013 (under the REF scenario). Under the POL and AMB scenarios, the final energy demand is somewhat reduced, owing to the demand side management measures in various end use sectors.
Figure 2: Scenario-wise primary energy supply (Mtoe)Source: TERI MARKAL Model Results
Figure 3: Scenario-wise power generation capacity (GW)Source: TERI MARKAL Model results
Figure 4: Scenario-wise final energy demand (Mtoe)Source: TERI MARKAL Model results
xxii Green Growth and Sustainable Development in India
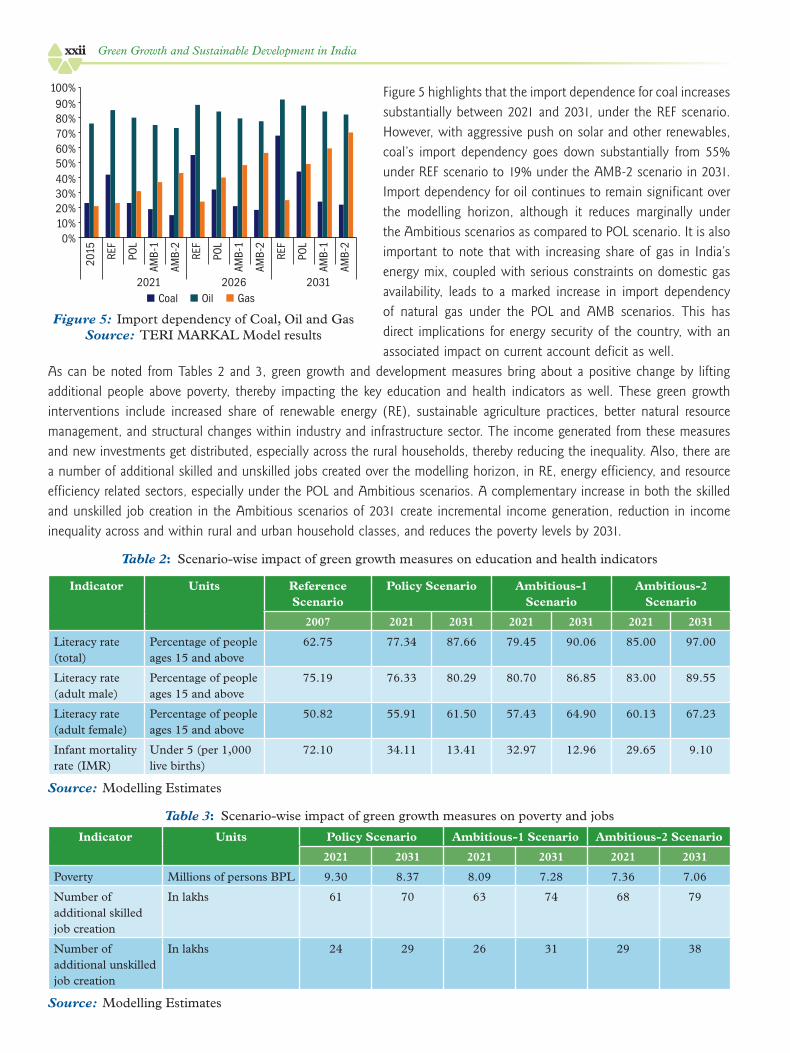
Figure 5 highlights that the import dependence for coal increases substantially between 2021 and 2031, under the REF scenario. However, with aggressive push on solar and other renewables, coal’s import dependency goes down substantially from 55% under REF scenario to 19% under the AMB-2 scenario in 2031. Import dependency for oil continues to remain significant over the modelling horizon, although it reduces marginally under the Ambitious scenarios as compared to POL scenario. It is also important to note that with increasing share of gas in India’s energy mix, coupled with serious constraints on domestic gas availability, leads to a marked increase in import dependency of natural gas under the POL and AMB scenarios. This has direct implications for energy security of the country, with an associated impact on current account deficit as well.
As can be noted from Tables 2 and 3, green growth and development measures bring about a positive change by lifting additional people above poverty, thereby impacting the key education and health indicators as well. These green growth interventions include increased share of renewable energy (RE), sustainable agriculture practices, better natural resource management, and structural changes within industry and infrastructure sector. The income generated from these measures and new investments get distributed, especially across the rural households, thereby reducing the inequality. Also, there are a number of additional skilled and unskilled jobs created over the modelling horizon, in RE, energy efficiency, and resource efficiency related sectors, especially under the POL and Ambitious scenarios. A complementary increase in both the skilled and unskilled job creation in the Ambitious scenarios of 2031 create incremental income generation, reduction in income inequality across and within rural and urban household classes, and reduces the poverty levels by 2031.
Figure 5: Import dependency of Coal, Oil and Gas Source: TERI MARKAL Model results
Table 2: Scenario-wise impact of green growth measures on education and health indicators
Indicator Units Reference Scenario
Policy Scenario Ambitious-1 Scenario
Ambitious-2 Scenario
2007 2021 2031 2021 2031 2021 2031
Literacy rate (total)
Percentage of people ages 15 and above
62.75 77.34 87.66 79.45 90.06 85.00 97.00
Literacy rate (adult male)
Percentage of people ages 15 and above
75.19 76.33 80.29 80.70 86.85 83.00 89.55
Literacy rate (adult female)
Percentage of people ages 15 and above
50.82 55.91 61.50 57.43 64.90 60.13 67.23
Infant mortality rate (IMR)
Under 5 (per 1,000 live births)
72.10 34.11 13.41 32.97 12.96 29.65 9.10
Source: Modelling Estimates
Table 3: Scenario-wise impact of green growth measures on poverty and jobs
Indicator Units Policy Scenario Ambitious-1 Scenario Ambitious-2 Scenario
2021 2031 2021 2031 2021 2031
Poverty Millions of persons BPL 9.30 8.37 8.09 7.28 7.36 7.06
Number of additional skilled job creation
In lakhs 61 70 63 74 68 79
Number of additional unskilled job creation
In lakhs 24 29 26 31 29 38
Source: Modelling Estimates

xxiiiGreen Growth and Sustainable Development in India
Policy Implications
Coal
As seen in the modelling exercise, coal will remain the major source of energy until 2030. Thermal plants that use coal also need to undergo massive technological changes if they are to remain sustainable. Technological change will need regulatory interventions since the capital costs of setting up plants with up-to-date technologies are far higher as compared to subcritical plants. Renovation and modernization measures need a major boost. Research and development (R&D) for clean coal technology needs a time-bound roadmap.
Oil & Gas
For this sector, disclosure of energy usage and process-related carbon emissions should be encouraged, to start with voluntary and progressively to be made mandatory. This would lead to greater clarity and public awareness, which can further facilitate policy action in the future. Exploration and production contracts should include incentives for energy saving in operations; fiscal arrangements in the form of tax incentives can encourage the reduction of associated gas flaring. In the midstream oil and gas segment, a roadmap that plans an integrated fuel transport policy must be created. In the refining segment, Solomon Energy Efficiency Index can be applied as a measuring standard that would help policymakers set reasonable energy use reduction goals in the medium and long run. To begin with, reporting efficiency according to the guidelines of such an index may be promoted. On the consumption side, a Green Gas Quadrilateral must be created by setting up natural gas pumps along the Golden Quadrilateral highways in order to promote the use of gas as a transport fuel.
Renewables
India targets an installed RE capacity of 175 GW by 2022, of which 100 GW will come from solar power, 60 GW from wind energy, 10 GW from small hydro power, and 5 GW from biomass-based power projects. Renewable energy forecasting is required for grid security. However, due to lack of quality data and insufficiently developed forecasting tools, accurate RE forecasting is difficult. Significant amount of generation integration will depend on the accuracy of the forecast. To achieve low-cost manufacturing and therefore lower capital costs and to capitalize on its inherent advantages in the solar sector, India needs strengthening and upgrading its solar R&D and manufacturing capabilities.
Transmission Grid
Inadequate grid infrastructure is a key issue that needs to be addressed urgently. Across most of the states with significant RE potential, the grid does not have sufficient spare capacity to be able to evacuate increasing quantum of RE electricity. A comprehensive programme to introduce smart grid will realize lots of benefits including better forecasting of demand and supply through centralized as well as decentralized power sources (renewables) with better grid stability. Public–Private Partnership (PPP) and engineering, procurement, and construction models can boost infrastructural development. Higher deployment of advanced technologies, such as the Thyristor Controlled Series Compensation, High Surge Impedance Loading lines, high temperature, high capacity conductors, multi-circuit towers, and mono pole towers are essential to enhance the power transfer capability of existing and new transmission lines. There is a need for increase in the transmission system at higher voltage levels and sub-station capacities to support transmission network to carry bulk power over longer distances. Moreover, there is a need to optimize right of way, minimize losses, and improve grid reliability.
Power Distribution
Since the financial viability of the power sector as a whole depends on the revenues collected at the distribution end, it is vital that the distribution system is made financially viable. This can be made possible by improving the operational performance by achieving 100% metering to achieve 100% billing/collection efficiency and to reduce the commercial losses.

xxiv Green Growth and Sustainable Development in India
Nuclear
Financial, administrative, and, most importantly, statutory independence is absolutely essential for the power regulator, which can be achieved by the ‘Nuclear Safety Regulatory Authority Act’ draft legislation that was tabled in the Parliament in September 2011. A public communications strategy that involves local and regional people, local businesses, and organizations in the decision-making process is essential. There are good examples of public engagement best practices and strategies followed in different countries. For instance, Finland follows a pre-defined timetable based on step-wise decision-making process for establishing a nuclear power plant.
Hydropower
On the national level, the hydropower sector is governed by the National Hydropower Policy of 2008. Various state governments have put in place such policies like the Hydro Power Policy, 2006 of Himachal Pradesh; Policy for Harnessing Renewable Sources in Uttrakhand with Private Sector/Community Participation, 2008; the Hydro Electric Power Policy of Arunachal Pradesh; among others. These policies have framed laws that govern land acquisition, law and order, impact on the environment via environmental impact assessments and impact on the people via social impact assessments. It is important to look at measures to iron out the issues in the current policy framework. Creating policy and institutional mechanisms to favour alternative designs to increase dam life as also to reduce the divergence, the designed and actual dam life must be taken into account.
Transport
Greening of the transport sector in India would seek a holistic strategy that involves planned interventions in order to make a decisive shift to green transport, interventions, and massive investments are required in the coming decades in the form of modal shifts actions, specific infrastructure development and upgradation works, fuel and system efficiency improvements, and mobility management. An integrated data management system and centre for regular monitoring of transport data can be set up. The spatial arrangement of the various land uses or activities across the city is a very important factor in determining the intra-city travel demand. Therefore, any efforts towards integrated land-use and transport planning can significantly help in reducing the need to travel and lead to reduction in associated costs. Upgradation in terms of fuel quality and fuel efficiency can promote cleaner fuel by reducing sulphur content and can lead to significant reduction in emissions.
Electric Mobility
Electric vehicles as a green growth intervention yield multiple co-benefits, including energy security, job creation (through technology innovation and local manufacturing), and reduced local air pollution. Government of India recently announced the Faster Adoption and Manufacture of Electric Vehicles in India Scheme, which is a step in the right direction. However, in order to accelerate the uptake of this green technology, it is recommended that the scheme be further augmented with substantial additional funding and provisions made for granting 100% capital subsidy to state governments that are keen to adopt electric buses in public transportation.
Financing
Financing models for green energy need to be customized to the specific financing needs of technologies in different stages of innovation. Public finance through the government and low-cost finance from bilateral/multilateral agencies has a crucial role in supporting R&D and innovation of new technological solutions that are in pre-commercial stage currently. Bank finance is important for developing the market for commercially available technologies.
Buildings
New stock needs to be built on the principles of green buildings to accrue social, environmental, and economic benefits. Retrofit measures to make the existing building stock energy efficient and water efficient need to be undertaken. There is a

xxvGreen Growth and Sustainable Development in India
need to ensure all new construction for commercial buildings (as defined by the Energy Conservation Building Code—ECBC) to be ECBC compliant. Greening of rooftops and public spaces in all urban areas to prevent urban heat island effect can be explored. Alternate building materials that perform equal or better than the conventional ones should be encouraged to bring in environmental sustainability.
Agriculture
Technical options for improving energy efficiency in irrigation include facilitating upgradation of inefficient pumpsets to energy-efficient pumpsets through the AgDSM programme that seeks to establish viable models for PPP. Promotion and effective adoption of solar pumping systems is necessary as it could facilitate a reduction in diesel consumption in irrigation and therefore savings of a non-renewable fossil fuel.
Clean Fuel
Considering the fast growth in the vehicular sector, more stringent steps should be taken. Instead of following chronological order for the norms, BS-V fuels should be considered by enabling the Indian refineries to leapfrog from BS-II to BS-V and BS-VI. Old vehicles should be gradually phased out with proper scrapping mechanism in place. There is need for enhanced and faster penetration of cleaner fuels like LPG. There is also need for increased penetration of improved biomass-based chullahs with higher efficiencies and lower emissions.
Air Quality
Instalment of air pollution control equipment (APCE) should be made mandatory for all the industries. Efficiency of installed APCE’s should be checked at regular levels. Electrostatic precipitators are installed in power plants but inspection and maintenance systems should be enforced at regular time intervals by the government. The recently announced National Air Quality Index, which considers eight pollutants (PM10, PM2.5, NO2, SO2, CO, O3, NH3, and Pb), could be expanded to more cities for better monitoring of air quality in these emerging economic centres.
Water
Integrated water resource management needs to be explored for water conservation using rainwater harvesting and groundwater recharge as well as rejuvenation of lakes and ponds in the river basin catchment. Water use efficiency can be enhanced in irrigated agriculture by increasing the output per unit of water, reducing loss of water to unusable sinks, reducing water degradation, and reallocating water to higher priority uses. Developing water quality database and management using real-time monitoring, linking billing with water supply network designs using Supervisory Control and Data Acquisition, and cloud computing systems. Institutional capacity building is of utmost importance in order to ensure that the mechanism of overall framework ensures efficiency in treating water as a finite but renewable resource to be carefully managed and judiciously utilized.
Forests
Linkages need to be established between research institutions, state forest departments, and private sector to produce good quality planting material. As envisaged in Twelfth Five Year Plan model, nurseries can be established in selected forest divisions. Joint Forest Management institutions need to be strengthened through establishing strong linkages with gram panchayats and allocation of green funds. Village-level green volunteers can be trained for conservation of natural resources. Claims to individual and community rights should be completed. Livelihoods of the right holders should be strengthened through training them in modern agriculture, animal husbandry, and forest management.
Bio-diversity
It is important to dovetail the national efforts for biodiversity conservation with the international goals and processes such as

xxvi Green Growth and Sustainable Development in India
Aichi Biodiversity Target and Nagoya Protocol. The national targets are cross-cutting in terms of issues as well as respective jurisdictions of ministries of central government and state governments. However, there is a limitation in terms of funds available for achieving the national targets for biodiversity conservation.
Waste
Instead of following the usual end-of-pipe approach, waste management must be looked at holistically and preference must be given to reduction of waste at the source. There should be efforts to institutionalize informal sector and modernization of recycling technologies. Informal waste recyclers can be trained to collect the waste from households, do decentralized waste processing (composting or biogas), and trade recyclable waste. The current mechanisms to raise funds for waste management must be improvised. Spending on segments—other than collection—of the waste management chain such as appropriate treatment, recovery, and disposal technologies and facilities is generally rather low. Increased investment in basic collection services, the transport of waste, and cleaning up dumpsites is a starting point for greening the sector. Investment can be targeted, for example, at techniques such as route optimization and transfer stations, which can bring down the capital and operational costs of providing waste services. Economic incentives and disincentives serve to motivate consumers and businesses to reduce waste generation and dispose of waste responsibly, thereby contributing to increased demand for greening the waste sector.
Irrigation
Promotion of micro-irrigation systems amongst farmers and in command areas will have significant implications on agricultural energy demand. Appropriate encouragement, incentives, and subsidies for farmers to adopt these systems are necessary, along with awareness and training on deployment and use of these systems.
The Way ForwardFigure 6 shows an overview of progress of key aspects related to environment and energy.
Figure 6: Overview of Progress on aspects related to environment and energy
The study provides a review of long-term sustainability challenges in India and concludes that implementation of green growth strategies yields multiple development benefits but requires concerted policy action and interventions. Following key interventions are recommended to foster green growth and development in India:
Mainstreaming in decision-making processes
Climate-resilient green growth strategies need to be looked at as a cross-cutting issue that requires policy coherence and inter-departmental coordination. For further mainstreaming of environmental sustainability in decision-making processes, the government can adopt green budgeting for India wherein all departments can prepare environmental budget statements highlighting key ‘green’ activities undertaken in their respective departments.

xxviiGreen Growth and Sustainable Development in India
Addressing data gaps
Collecting and synthesizing existing and new data is needed to facilitate preparation of strategies as well as evaluation of existing policy initiatives. Data for other parameters can be collected using existing management information systems.
Mobilizing finance
Financing is critical to the implementation of climate-resilient green growth interventions. In addition to public finance, private sector, banking institutions, and development agencies also becomes important.
Commissioning pilots and technology demonstration
Pilots need to be commissioned in opportunity areas. Technology demonstration should be encouraged in areas of RE, waste management, RE for cold storage applications, and natural resource management. This will help in up-scaling of technologies.
Capacity building
Enhancing financial, technical, and institutional capacities of government as well as the voluntary sector is essential for the implementation of climate-resilient green growth strategies. A detailed assessment of capacity building needs sector by sector becomes essential. A greater engagement between government, research and academia, non-profit organizations, and the private sector is needed to support implementation.
Understanding emerging issues
There is a need to better understand and plan for impending socio-economic transitions, such as urbanization and changes in the structure of the economy (such as increase in manufacturing). Skill development and vocational education need priority action to create opportunities in key green growth related sectors, especially RE, buildings, and industry.
ReferencesIndian Network for Climate Change Assessment (INCCA). 2010. Climate change and India: A 4 × 4 assessment. A sectoral and regional
analysis for 2030s. Government of IndiaKothawale, D. R., A. A. Munot, K. Krishna Kumar. 2010. Surface air temperature variability over India during 1901-2007, and its
association with ENSO. Climate Research 42: 89- 104; doi:10.3354/cr00857.


1
The New Agenda of the outcome document of the intergovernmental negotiations of the Post-2015 development agenda, introduces the Sustainable Development Goals. The 17 Sustainable Development Goals and 169 targets which were adopted in September 2015 demonstrate the scale and ambition of member states in the new universal Agenda. It is the first time in the global development discourse that member states have placed such an importance to environmental issues and have emphasized on the three pillars of sustainable development. The 17 goals that find place in the Outcome Document of the intergovernmental negotiations on Post-2015 Development Agenda are listed in Table1.
Table 1: Sustainable Development Goals
No Goal
Goal 1 End poverty in all its forms everywhere
Goal 2 End hunger, achieve food security and improved nutrition and promote sustainable agriculture
Goal 3 Ensure healthy lives and promote well-being for all at all ages
Goal 4 Ensure inclusive and equitable quality education and promote lifelong learning opportunities for all
Goal 5 Achieve gender equality and empower all women and girls
Goal 6 Ensure availability and sustainable management of water and sanitation for all
Goal 7 Ensure access to affordable, reliable, sustainable and modern energy for all
Goal 8 Promote sustained, inclusive and sustainable economic growth, full and productive employment and decent work for all
Goal 9 Build resilient infrastructure, promote inclusive and sustainable industrialization and foster innovation
Goal 10 Reduce inequality within and among countries
Goal 11 Make cities and human settlements inclusive, safe, resilient and sustainable
Goal 12 Ensure sustainable consumption and production patterns
Goal 13 Take urgent action to combat climate change and its impacts*
Goal 14 Conserve and sustainably use the oceans, seas and marine resources for sustainable development
Goal 15 Protect, restore and promote sustainable use of terrestrial ecosystems, sustainably manage forests, combat desertification, and halt and reverse land degradation and halt biodiversity loss
Goal 16 Promote peaceful and inclusive societies for sustainable development, provide access to justice for all and build effective, accountable and inclusive institutions at all levels
Goal 17 Strengthen the means of implementation and revitalize the global partnership for sustainable development
* Acknowledging that the United Nations Framework Convention on Climate Change is the primary international, intergovernmental forum for negotiating the global response to climate change.
Source: Transforming Our World: The 2030 Agenda for Sustainable Development (Finalised text for adoption, 1 August)
Green Growth and Policy Imperatives

2 Green Growth and Sustainable Development in India
World leaders and other major groups have also deliberated to further the agenda of cooperative climate action by the international community to keep the global average temperature rise below 2°C, the internationally-agreed defence line against the worst impacts of climate change. These developments indicate the importance accorded to local and global environment issues worldwide. It this becomes an imperative that environmental sustainability is integrated in national economic and development policies. Pearce et al (1989) in an early thesis titled, “Blueprint for a green economy” argued that the basis for a green economy lies in understanding the interdependencies between the economy and environment. The way the economy is managed impacts the environment, and environmental quality in turn impacts the performance of the economy and human well-being. In the context of international sustainable development discourse, essentially green economy is the interface between the economy and the environment. The concept of ‘green growth’ in the policy discourse has its origins in the Asia and Pacific Region where it was adopted by 52 governments and other stakeholders at the Ministerial Conference on Environment and Development in Asia and the Pacific (MCED)
held in 2005. Globally, the term ‘green economy’ was revived by the United Nations Environmental Programme (UNEP) along with the idea of ‘green stimulus packages’, which identified specific areas where large-scale public investment could kick-start a green economy. In October 2008, UNEP launched its Green Economy Initiative (GEI)
with an objective to provide analysis and policy support for investment in green sectors and for greening environmentally unsustainable sectors. The Nusa Dua Declaration, which was adopted by Ministers of Environment and Heads of Delegations at the eleventh special session of the UNEP Governing Council/Global Ministerial Environment Forum (GC/GMEF) acknowledged that the advancement of the concept of a green economy in the context of sustainable development and poverty eradication can significantly address current challenges and deliver economic development opportunities and multiple benefits for all nations. “The Future We Want” highlights that green economy can be used as a tool to achieve sustainable development and calls for a wide range of actions such as taking steps to go beyond gross domestic product to assess the well-being of a country and developing a strategy for sustainable development financing. According to OECD (2012), green growth is recognized to have the potential to reinforce the agenda to promote inclusive development while at the same time ensuring economic growth and environmental resilience of societies. It makes sense to have inclusive green growth. The goal of inclusive green growth is to reduce poverty, promote equity, and create opportunities without irreparably harming the environment. Green growth can be seen as a tool to achieve sustainable development and not as a competing paradigm. In different global and international settings, green growth has been defined differently; though the central emphasis on environment sustainability and economic growth can be viewed as common. United Nations Economic and Social Commission for Asia and the Pacific (UNESCAP) defines green growth as, “growth that emphasizes environmentally sustainable economic progress to foster low-carbon, socially inclusive development”. To be able to move to a global green economy, there is a need to create a system change and build on country initiatives to gather regional and international cooperation. The World Bank asserts that green growth is “growth that is efficient in use of natural resources, that minimizes pollution and environmental impacts and that is climate resilient”. The Organization for Economic Co-operation and Development (OECD) defines green growth as “promoting economic growth while reducing pollution and greenhouse gas emissions, minimizing waste and inefficient use of natural resources, and maintaining biodiversity”. The OECD Ministerial Council Meeting got the organization in an important role in this discourse in 2009 after which the organization has supported various green growth efforts across the globe. As a result of the increasing global discourse on green growth, in 2012—the Global Green Growth Institute (GGGI) was established as an intergovernmental organization with a vision of integration of environmental sustainability and economic growth. Governments in countries, including Japan and Korea, have shown political commitment and have been proactive in taking action towards low carbon green growth.

3Green Growth and Policy Imperatives
In 2008, partly in response to the global financial crisis, the Republic of Korea (RoK) adopted ‘low carbon green growth’ as the country’s new development vision. The National Strategy for Green Growth and Five-Year Plan for Green Growth followed shortly after this in 2009 in the state. This was accompanied by the enactment of a Framework Act on Low Carbon Green Growth. Transition to a green economy is seen to catalyse economic progress with reduced risk of crisis increasingly inherent in the current economic model. Countries such as United States of America and majority of the members of EU28
have attained high levels of human development, but at the expense of larger ecological footprint as indicated inFigure1. The challenge before developing countries is to reduce their per capita ecological footprint without compromising the quality of life. The challenge before developing countries like India is to provide improved quality of life to their citizens within the ecological space. Among key challenges for national policy making are fiscal deficits and public debts which could make technological change required for green growth more difficult as governments would tend to focus on financial health. This might also make it difficult to direct the efforts in directions of equitable and sustainable economy which would need public expenditure on social and environmental interventions. There are some pertinent systematic issues relating to green growth as is often debated that at a time when the world is moving towards a capitalist system, which cannot operate without high growth and profits—adopting a complete renewable energy pathway would seem to be difficult (Hoffmann 2011). Also, there are contrasting views that point out that trade-offs from green growth are bound to exist, which increases the social costs associated with green growth. In such a case, green growth may prove to be regressive for the poor population and thus it should be ensured that the poor are not asked to pay the price for sustaining growth in a green economy (Dercon 2012). Green growth has also been critiqued and referred to as a ‘reductionist approach’ – which might not be capable of dealing with complexities of climate change. As pointed out by Sood and Banerjee (2012), the effectiveness of the sustainable development or the “green” approaches is often compromised because of their mainstream and neoliberal orientation, which is largely conceptualized within a techno-bureaucratic policy framework. Empirical evidence has been cited in literature to highlight that there are limits to resource productivity and efficiency gains. In the context of developing countries, it is believed that the international community can play a crucial role by supporting the partner countries in helping then achieve specific green growth goals. As argued by Sood and Banerjee (2012), ecology cannot be understood in isolation with political economy. Their study suggests that it is extremely important for the policy makers to understand the relationship between growth strategies, unemployment, displacement, social exclusion, conflicts, livelihoods, food security, and other inter-related issues. Political leadership is thus considered essential for moving in the direction of green growth and to formulate sector-specific policies. The allocation of financial resources towards the greening of the economy also largely gets determined by the political commitment (Ekins 2001). Experts have also discussed green growth in terms of its potential for a developing country like India with a vibrant and resurgent economy. Two patterns of economic growth become essentially relevant in the context of green growth process in India—these are patterns of production and pattern of consumption. Being a large exporter of services and importer of manufactured goods, India’s economy is green in many ways however, greening of consumption is required. By leapfrogging on the consumption front, the country might gradually transit to becoming green. The Constitution of India contains specific provisions for the protection and improvement of environmental quality. Article 48-A of the Constitution says that “the state shall endeavour to protect and improve the environment and to
Figure 1: Ecological Footprint of Consumption versus HDI in 2013
Source: Global Footprint Network < www.footprintnetwork.org/en/ > and Human Development Index <
https://data.undp.org/dataset/Table-1-Human-Development-Index-and-its-
components/wxub-qc5k > last accessed on September 23, 2014.
4 Green Growth and Sustainable Development in India
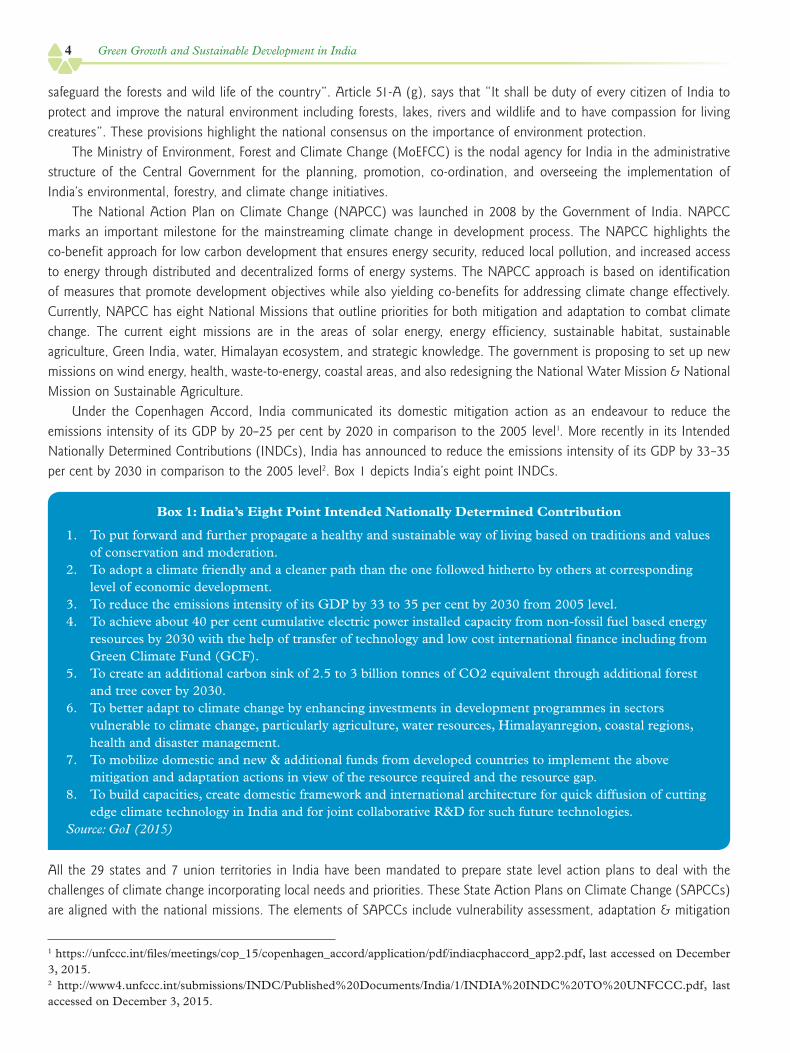
safeguard the forests and wild life of the country”. Article 51-A (g), says that “It shall be duty of every citizen of India to protect and improve the natural environment including forests, lakes, rivers and wildlife and to have compassion for living creatures”. These provisions highlight the national consensus on the importance of environment protection. The Ministry of Environment, Forest and Climate Change (MoEFCC) is the nodal agency for India in the administrative structure of the Central Government for the planning, promotion, co-ordination, and overseeing the implementation of India’s environmental, forestry, and climate change initiatives. The National Action Plan on Climate Change (NAPCC) was launched in 2008 by the Government of India. NAPCC marks an important milestone for the mainstreaming climate change in development process. The NAPCC highlights the co-benefit approach for low carbon development that ensures energy security, reduced local pollution, and increased access to energy through distributed and decentralized forms of energy systems. The NAPCC approach is based on identification of measures that promote development objectives while also yielding co-benefits for addressing climate change effectively. Currently, NAPCC has eight National Missions that outline priorities for both mitigation and adaptation to combat climate change. The current eight missions are in the areas of solar energy, energy efficiency, sustainable habitat, sustainable agriculture, Green India, water, Himalayan ecosystem, and strategic knowledge. The government is proposing to set up new missions on wind energy, health, waste-to-energy, coastal areas, and also redesigning the National Water Mission & National Mission on Sustainable Agriculture. Under the Copenhagen Accord, India communicated its domestic mitigation action as an endeavour to reduce the emissions intensity of its GDP by 20–25 per cent by 2020 in comparison to the 2005 level1. More recently in its Intended Nationally Determined Contributions (INDCs), India has announced to reduce the emissions intensity of its GDP by 33–35 per cent by 2030 in comparison to the 2005 level2. Box 1 depicts India’s eight point INDCs.
All the 29 states and 7 union territories in India have been mandated to prepare state level action plans to deal with the challenges of climate change incorporating local needs and priorities. These State Action Plans on Climate Change (SAPCCs) are aligned with the national missions. The elements of SAPCCs include vulnerability assessment, adaptation & mitigation
Box 1: India’s Eight Point Intended Nationally Determined Contribution
1. To put forward and further propagate a healthy and sustainable way of living based on traditions and values of conservation and moderation.
2. To adopt a climate friendly and a cleaner path than the one followed hitherto by others at corresponding level of economic development.
3. To reduce the emissions intensity of its GDP by 33 to 35 per cent by 2030 from 2005 level.4. To achieve about 40 per cent cumulative electric power installed capacity from non-fossil fuel based energy
resources by 2030 with the help of transfer of technology and low cost international finance including from Green Climate Fund (GCF).
5. To create an additional carbon sink of 2.5 to 3 billion tonnes of CO2 equivalent through additional forest and tree cover by 2030.
6. To better adapt to climate change by enhancing investments in development programmes in sectors vulnerable to climate change, particularly agriculture, water resources, Himalayanregion, coastal regions, health and disaster management.
7. To mobilize domestic and new & additional funds from developed countries to implement the above mitigation and adaptation actions in view of the resource required and the resource gap.
8. To build capacities, create domestic framework and international architecture for quick diffusion of cutting edge climate technology in India and for joint collaborative R&D for such future technologies.
Source: GoI (2015)
1 https://unfccc.int/files/meetings/cop_15/copenhagen_accord/application/pdf/indiacphaccord_app2.pdf, last accessed on December 3, 2015.2 http://www4.unfccc.int/submissions/INDC/Published%20Documents/India/1/INDIA%20INDC%20TO%20UNFCCC.pdf, last accessed on December 3, 2015.

5Green Growth and Policy Imperatives
options, and financing & capacity building needs to implement the identified interventions. Currently, 19 SAPCCs3 have been endorsed by the National Steering Committee on Climate Change. Three SAPCCs4 have been considered by Expert Committee on Climate Change. A predictable, sufficient, and secure fiscal base would also be necessary to secure local public goods for green growth, with state grants linked to their environmental performance. In India, it would be important to strengthen the third tier of the government, which are rural-local bodies (panchayats) and urban-local bodies (municipalities). Once the funds are transferred to the local level, functions will greatly follow. Therefore, availability of resources at the local level becomes the driver of the change towards green growth and sustainability (Kelkar 2012). In context of India’s policy discourse, the Thirteenth Finance Commission, Government of India. discussed the concept of green growth for the first time (see Box 2).
The Thirteenth Finance Commission also quotes international experience which shows that fiscal measures in many countries had green components for which it recommended strategies to incentivize fiscal policies to promote measures for energy conservation, renewable energy use, soil conservation, afforestation, and more effective and affordable access to clean water at different levels of government. Giving a larger fiscal base at all levels of government could encourage innovations, especially such that the local bodies could ensure delivery of services such as better access to clean water, better solid waste management, and green infrastructure. The Ministry of Environment, Forest and Climate Change in India recognized green growth in its vision (Box 3). Poverty eradication along with green growth is seen to be central to the realization of green growth objectives.
It is clear from the articulation by the Thirteenth Finance Commission as well as the Ministry of Environment, Forest and Climate Change that inclusivity is central to green growth in India. The Fourteenth Finance Commission (FFC) which submitted its report (FFC 2015) this year emphasized on the need for a new institutional arrangement that should become
3 Andaman and Nicobar, Andhra Pradesh, Arunachal Pradesh, Chhattisgarh, Himachal Pradesh, Jammu & Kashmir, Lakshadweep, Madhya Pradesh, Manipur, Meghalaya, Mizoram, Nagaland, Odisha, Puducherry, Punjab, Rajasthan, Sikkim, Tripura, and West Bengal.4 Haryana, Jharkhand, and Karnataka.
Box 2: ‘Green Growth’ as articulated in the Thirteenth Finance Commission (TFC) Report
Green growth involves rethinking growth strategies with regard to their impact(s) on environmental sustainability and the environmental resources available to poor and vulnerable groups (para 3.15, Thirteenth Finance Commission)
Thus, it can be seen that in Indian policy context green growth is primarily discussed around the concept of ‘environment sustainability’ and ‘poor and vulnerable groups’. TFC Report specifies that the overall approach
of the Commission is to foster ‘inclusive and green growth’ to promote fiscal federalism and stronger local institutions. And this has been the underlying vision behind the Commission’s recommendations on inter-
governmental fiscal arrangements and recommendations (TFC 2009).
Box 3: ‘Green Growth’ as recognized by the Ministry of Environment, Forest and Climate Change (MoEFCC), Government of India
The Ministry of Environment, Forest and Climate Change has recognized ‘green growth’ in the Ministry’s vision. The four aspects that covers the Ministry’s vision include:
• Our vision is to have Sustainable Development• Our vision is to have Growth and Environment Protection
• Our vision is Development without Destruction• Our vision is Poverty Eradication and Green Growth
Source: Based on MoEFCC (2015), emphasis added

6 Green Growth and Sustainable Development in India
the forum for integrating economic and environmental concerns in decision-making. The FFC also recommends that states, irrespective of whether water regulatory authorities are in place or not, consider full volumetric measurement of the use of irrigation water. The Commission introduced a forward-looking incentive-based grant, rewarding the States with quality forest cover (measured by Moderate and Very Dense forest cover) for which FFC in its devolution formula enables the states to consider forest protection. Figure 2 shows the framework for green growth and sustainable development, based on which the discussion in this report will follow.
India Development Profile In 2014, India’s total population stood at 1.29 billion and its share in the world population was around 17.84per cent (World Bank Development Indicators). Globally, economic growth seemed to have picked up and it is expected to further improve in 2015–16. Global growth in 2014 was a modest 3.4 per cent (IMF 2015). It is projected that world growth will be around 3.5 per cent in 2015 and 3.8 per cent in 2016. The International Monetary Fund in its report, World Economic Outlook, mentions that downside risks persist in advanced economies where output gaps had been large. Key development indicators for India and select countries are listed in Table 2. It is seen that in per capita income and energy use per capita, India is below the world average. In terms of CO2 per capita, the carbon footprint of India is lower than the world average.
Table 2: Key development indicators for India and select countries
GDP in billion
(constant 2005 US$)a
GDP per capita
(constant 2005 US$)a
CO2 emissions
(MT)b
CO2
emissions (metric tons per capita)b
Energy use (kg of oil
equivalent per capita)c
International Trade Balance
in Goodsa
Cash surplus/
deficit (% of GDP)c
Brazil 1206 5853 439.41 2.19 1391.90 -4.13 -1.84
China 5274 3866 9019.52 6.71 2142.81 370.02 _
European Union
15372 30241 3574.10 7.07 3253.82 134.78 -3.63
India 1600 1235 2074.34 1.66 623.72 -139.88 -3.81
Japan 4780 37595 1187.66 9.29 3545.60 -120.64 -7.97
Russian Federation
1000 6844 1808.07 12.65 5283.41 188.04 2.67
United States 14797 46405 5305.57 17.02 6814.82 -727.15 -7.56
South Africa 329 6086 477.24 9.26 2674.82 -18.1 -4.47
World 58055 7996 34649.483 4.94 1897.95 _ -4.94
Note: Data for various years: a2014, b2011, c2012 Source: World Development Indicators (data.worldbank.org); Column on international trade from OECD.stat
Fiscal considerations and trade balance will also continue to be important drivers for shaping India’s macro-economic policy. In terms of green growth and development, it becomes essential to understand the development benefits of energy-related interventions such as income, energy access, and trade.
Figure 2: Framework for green growth and sustainable development

7Green Growth and Policy Imperatives
India’s gross national income for 2014–15 was `105.27 trillion with an annual growth rate of 7.4 per cent (Economic Survey 2014–2015).5 India is emerging as the one of the fastest growing economies and is currently Asia’s third largest economy by GDP.6 The International Monetary Fund has projected that in 2015 and 2016, India’s growth rate will be 7.5 per cent. Figure 3shows the sectoral share of Gross Domestic Product (GDP) for various sectors in India. The industry and service sector have been growing ever since they set the pace in the 1990s. In India, the share of industrial sector in total GDP is 25 per cent. The share of services sector is the largest in total GDP of India and was 57 per cent in 2013 while agriculture accounted for just 18 per cent.7
Not only is the share of agriculture less in India’s GDP, but also its annual growth rate has reduced from the past. The industrial and service sectors have triggered India’s economic growth rate while the growth rate in the agriculture sector has decelerated which is visible in the sectoral contribution to GDP—that of industry and service sector has risen, while the share of primary sector (agriculture, forestry & fishing, mining, and quarrying) has declined. Even though the composition of GDP has declined in the primary sector, a majority of the workforce in India—an estimated 47 per cent in 20128—is employed in the agriculture sector. Creating enough non-farm employment opportunities to absorb the labour surplus in rural areas still remains a challenge. In terms of macro fiscal indicators, the fiscal deficit of the country is currently 4.1 per cent (Figure 4). This is the lowest since 2008–09, the year which coincided with the 2008 financial crises when a stimulus was injected in the Indian economy.
Figure 3: Sectoral share of GDP for various sectors in IndiaSource: Economic Survey of India (various years)
Note: 3R: Third revised estimates; a: New series estimates; b: Advance estimates; for the year 2011-12 and onwards, data is for Gross Value Added at basic prices is being considered at the new series of ‘2011–12’
5 New Series, Advanced Estimates6 World Bank Development Indicators. Details available at <data.worldbank.org>7 Source: World Bank Development indicators8 World Development Indicators based on International Labour Organization. Available from <data.worldbank.org>, last accessed on September 23, 2015.
Figure 4: Fiscal deficit of India as % of GDPSource: Economic Survey 2014–15

8 Green Growth and Sustainable Development in India
For India to achieve development objectives, its economy should continue to grow. But for a country like India, where development is an imperative, environmental consequences can be substantial as it will place serious constraints on natural resources such as land, water, minerals, and fossil fuels, and driving up energy and commodity prices. The extent to which its economy will “grow green” will depend on its ability to reduce the quantity of resources required over time to support economic activity. To accomplish this, investments in built environments, including housing, transportation networks, energy and water supplies, must focus on maximizing long-term savings in resources, while meeting the needs of people. Even though India’s Human Development Index (HDI) has improved over the last decade, the country still lags behind in achieving its Millennium Development Goals (MDGs). For instance, under MDG ‘Goal 7: Ensure environmental sustainability’, India had decided to halve the number of people without access to safe drinking water and basic sanitation. Even though the percentage of population with improved sanitation has doubled between 1990 and 2006, a more than 100 per cent increase is still required to achieve the 2015 target of India. India’s economic growth in the past few decades has been impressivehowever, the population growth still remains a concern. Not only is the population of India increasing, the proportion of urban dwellers is also increasing. Figure 5 depicts population growth— both rural and urban over the period of 1901 and 2011. Figure 5 depicts the population pyramid in terms of the percentage distribution of population by age for India in 2006 and makes predictions for 2026. As can be seen, in 2006, nearly 32.5 per cent of India’s population was in the age group of 0–14 years and 62.4 per cent in the working age group of 15–64 years. It is anticipated that in 2026, 23.4 per cent will be the composition of people in the age group of 0–14 years and 68.4 per cent in the age group of 15–64 years (Figure 6). This age structure will give India a competitive advantage in terms of workforce in the next decade. It is estimated that India’s proportion of working class will increase from 58 per cent in 2001 to more than 64 per cent by 2021 (GoI 2013). This demographic revolution will add approximately 63.5 million new entrants to the working age group between 2011 and 2026 with the majority being in the age group of 20–35 years. Given that, it is one of the youngest nations in the world, it has to appreciate and acknowledge the importance of green economy in enhancement of social equity and job creation. Green economy can help India build social safety nets for facing such eventualities, which affect the weak and vulnerable the most, and wipe out the fruits of growth for years. By 2011, the share of urban areas in India’s Gross Domestic Product was reported to be about 62-63 per cent (Planning Commission, 2013). Higher productivity in any city’s economy is influenced greatly by the quality and availability of infrastructure, such as power, telecom, roads, water supply, and mass transportation. Provisioning of infrastructure and basic services is a growing challenge for the new urban centres in India. According to UN-Habitat, countrywide, an estimated 44 per cent of all urban households are classified as slums, which have inadequate civic infrastructure such as sanitation and solid waste management. A key step for green growth interventions would be to make delivery of urban services in a city more sustainable. As a city’s population is dependent on services like water, sanitation, power, transport, and buildings for its survival, it is important that these services be planned, delivered, managed, regulated, and monitored in a proper way to ensure adequacy, equity, quality, and protection of the natural environment. Financial and governance issues in urban local bodies need urgent attention. India is a growing economy with huge disparity in incomes and lifestyles. Increasing incomes and population is one of the major drivers for increase in electricity consumption of India which grew from 43,724 GWh during 1970–71 to 772,603 GWh during 2011–12, at a compound annual growth rate (CAGR) of 7.08 per cent.
Figure 5: Population growth of rural population and urban population
Source: Census (2011)
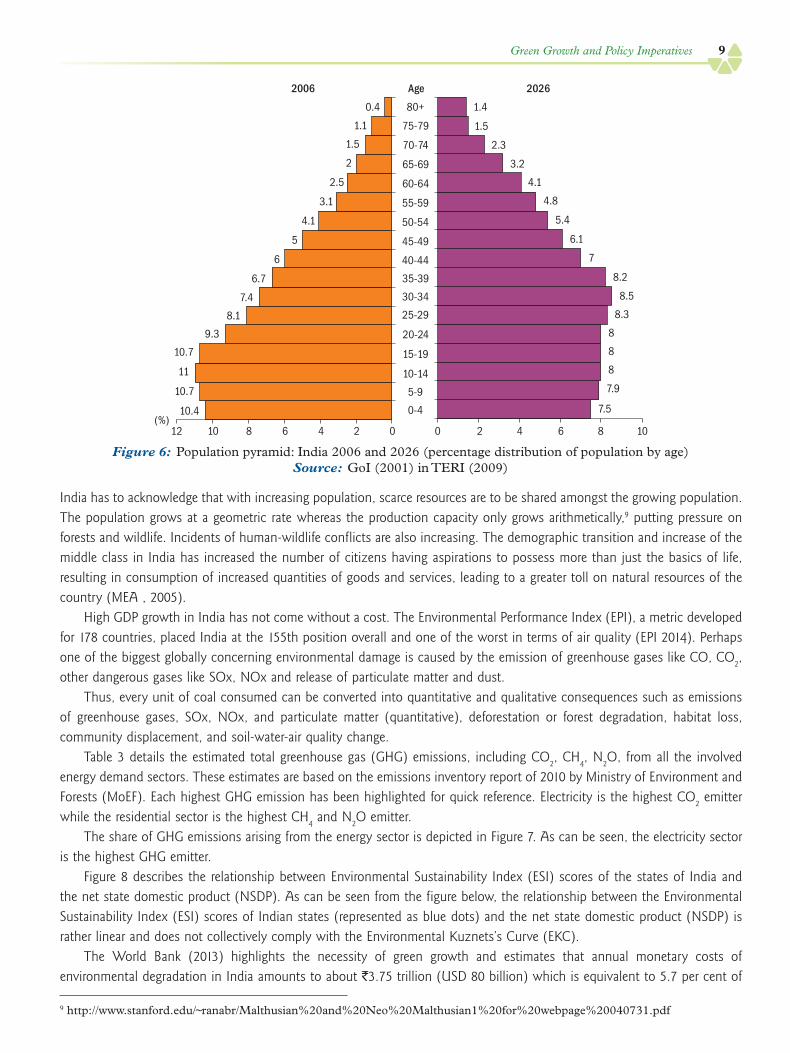
9Green Growth and Policy Imperatives
India has to acknowledge that with increasing population, scarce resources are to be shared amongst the growing population. The population grows at a geometric rate whereas the production capacity only grows arithmetically,9 putting pressure on forests and wildlife. Incidents of human-wildlife conflicts are also increasing. The demographic transition and increase of the middle class in India has increased the number of citizens having aspirations to possess more than just the basics of life, resulting in consumption of increased quantities of goods and services, leading to a greater toll on natural resources of the country (MEA , 2005). High GDP growth in India has not come without a cost. The Environmental Performance Index (EPI), a metric developed for 178 countries, placed India at the 155th position overall and one of the worst in terms of air quality (EPI 2014). Perhaps one of the biggest globally concerning environmental damage is caused by the emission of greenhouse gases like CO, CO2, other dangerous gases like SOx, NOx and release of particulate matter and dust. Thus, every unit of coal consumed can be converted into quantitative and qualitative consequences such as emissions of greenhouse gases, SOx, NOx, and particulate matter (quantitative), deforestation or forest degradation, habitat loss, community displacement, and soil-water-air quality change. Table 3 details the estimated total greenhouse gas (GHG) emissions, including CO2, CH4, N2O, from all the involved energy demand sectors. These estimates are based on the emissions inventory report of 2010 by Ministry of Environment and Forests (MoEF). Each highest GHG emission has been highlighted for quick reference. Electricity is the highest CO2 emitter while the residential sector is the highest CH4 and N2O emitter. The share of GHG emissions arising from the energy sector is depicted in Figure 7. As can be seen, the electricity sector is the highest GHG emitter. Figure 8 describes the relationship between Environmental Sustainability Index (ESI) scores of the states of India and the net state domestic product (NSDP). As can be seen from the figure below, the relationship between the Environmental Sustainability Index (ESI) scores of Indian states (represented as blue dots) and the net state domestic product (NSDP) is rather linear and does not collectively comply with the Environmental Kuznets’s Curve (EKC). The World Bank (2013) highlights the necessity of green growth and estimates that annual monetary costs of environmental degradation in India amounts to about `3.75 trillion (USD 80 billion) which is equivalent to 5.7 per cent of
Figure 6: Population pyramid: India 2006 and 2026 (percentage distribution of population by age)Source: GoI (2001) in TERI (2009)
9 http://www.stanford.edu/~ranabr/Malthusian%20and%20Neo%20Malthusian1%20for%20webpage%20040731.pdf

10 Green Growth and Sustainable Development in India
Table 3: GHG emission trends in India by gases (million tons of CO2 equivalents)
National estimates IEA estimates
Gases Process NATCOM 2000 INCCA 2007 IEA 2000 IEA 2010
CO2
Fuel Combustion 952 992 978.1 1749.3
Fugitive 2 - 7.7 32.7
Industrial Processes 72 405 42.0 120.1
Other 236 98 57.3 36.1
Total 1027 1497.0 1085.1 1938.3
CH4
Energy 8 4.3 82.1 116.1
Agriculture 14 13.77 376.0 377.6
Waste - 2.5 101.1 125.3
Other 2.8 .90 2.4 2.5
Total 19.9 20.5 561.6 621.5
N2O Energy .038 .056 23.4 28.8
Industrial Process .012 .020 1.6 0.3
Agriculture .192 .146 149.9 170.6
Other .013 .015 24.6 34.5
Total .264 .239 199.5 234.1
HFC Industrial Processes Negligible - 8.1 13.4
PFC Industrial Processes Negligible - 2.0 1.7
SF6 Industrial Processes Negligible - 3.4 5.8
Total 1301.2 1727.77 1859.7 2814.9
Note: NATCOM – India’s National Communication to United Nations Framework Convention on Climate Change; INCCA – Indian Network for Climate Change Assessment; IEA – International Energy Agency; bunkers are not
added to the total emissions from the energy sector or to the national totals.Source: Compiled from MoEF (2010), MoEF (2012), IEA (2014a)
Figure 7: CO2 emissions within energy
sub-sector in India for 2012Source: IEA (2014b)
Figure 8: Relationship between ESI scores (Y-axis) of Indian states and NSDP (X-axis) in 2011
Source: Compiled from Economic Survey 2012-13, IFMR (2011)
India’s GDP. The report also estimates that particle pollution (PM10) from the burning of fossil fuels amounts to up to 3 per cent of India’s GDP along with losses due to lack of access to clean water supply, sanitation and hygiene, and natural resources depletion. Model simulations also suggest that policy interventions such as environmental taxes could lead to carbon dioxide reduction and the health benefits that could be greater than the loss of GDP in the “Green Growth Scenario” and “Green Growth Plus Scenario” (Muthukumara et al 2012). The study suggests instruments for achieving the end of green growth and these include endogenous energy efficiency, end of pipe technology improvements, environmental taxes, and cleaner production processes.

2
Issues around local environment including air pollution, water quality, and inadequate waste management affect a large proportion of country’s population. Also there are environmental pressures on natural resources like forests and biodiversity. The TERI’s Environmental Survey 2014 has brought some important revelations about people’s perceptions on climate change and on the status of other significant environment parameters in India. Results of this survey has come up with statistics that show that 90 per cent of the respondents regard climate change as real and happening with 80 per cent observing increase in air temperatures and 63 per cent of the opinion that rainfall is declining. There still is a huge gap, one, in the required understanding about climate change amongst the masses of India and second, in a relevant translation into efforts and initiatives to make a rectifying change in the situation. At an institutional and government level, it is also important to pay attention to allocate more resources into climate change research in order to make relevant, timely and quality information on climate change available for citizens to use.
Air QualityIndia has laws such as The Air (Prevention and Control of Pollution) Act, 1981, The Air (Prevention and Control of Pollution) (Union Territories) Rules, 1983 and The Air (Prevention and Control of Pollution) Rules, 1982. In India, air quality monitoring was started in 1967 by National Environmental Engineering Research Institute (NEERI). The next initiative was from Central Pollution Control Board (CPCB) by starting the National Ambient Air Quality Monitoring (NAAQM) programme in the year 1984 with seven stations at Agra and Anpara. The numbers of monitoring stations kept on increasing with each passing year. Later, the programme was renamed as National Air Monitoring Programme (NAMP). Gradually, the network of air monitoring stations in India gotstrengthened from 28 to 456 stations during 1985 to 2011. The National Air Quality Index (AQI) was launched to disseminate information about air quality. The AQI has six categories of air quality—Good, Satisfactory, Moderately polluted, Poor, Very Poor, and Severe with a distinct colour scheme. AQI considers eightpollutants (PM10, PM2.5, NO2, SO2, CO, O3, NH3 and Pb) for which short-term (upto 24-hourly averaging period) National Ambient Air Quality Standards are prescribed. Currently, air quality data for 10 cities are connected to the AQI system. Concentration of the pollutants in cities with million plus population of India is shown in Figures 9a, 9b, and 9c. It is seen from Figure 9(a) that respirable suspended particulate matter (RSPM) concentrations in 2012 violates the National Ambient Air Quality Standards set by the Central Pollution Control Board; the standard for RSPM is 60 μg/m3. Figure 9(b) show that SO2 is within the prescribed standards of 50 μg/m3. In terms of NOx concentrations, Delhi, Jaipur, Pune, and Kolkata perform poorly in terms of the prescribed standards of 40 μg/m3. A recent emission assessment study (TERI 2015a) shows sector-wise emissions for India (Figure 10). Industrial combustion contributes 49 per cent of the PM10 emissions followed by residential sector (31 per cent) and open burning. Nearly 31 per cent of NOx emissions are contributed by transport sector in the country, followed by power sector and industries.
Environmental Performance in India

12 Green Growth and Sustainable Development in India
Air pollution has been identified as the fifth leading cause of death in India by Global Burden Disease Study (GBD 2012). Air quality is not just an environmental issue but also a public health issue. According to the World Health Organization (WHO), outdoor air pollution was responsible for the deaths of some 3.7 million people under the age of 60 in 2012. Air pollutants pose a serious threat to human health. Apart from the ambient air pollution, there is the issue of indoor pollution. Concentration of suspended particulate matter during a cooking session, using biomass as a fuel, ranges between 3–6 mg/m3 and that of CO is 5–50 parts per million. In India, indoor air pollution leads to 400–550 thousand premature deaths (Dey et al., 2012; Smith, 2000).
Figure 9a: RSPM concentrations in key million plus cities of India (μg/m3)
Source: CPCB (2014)
Figure 9b: SO2 concentrations in key million plus cities
of India (μg/m3)Source: CPCB (2014)
Figure 9c: NOx concentrations in key million plus cities of India (μg/m3)
Source: CPCB (2014)
Figure 10: Sector-wise emissions (in Kt/yr) for criteria pollutants from different sources in India in 2010
Source: TERI (2015a)

13Environmental Performance in India
Waste ManagementAccording to CPCB estimates, Class I1 cities and Class II2 towns in the country generate around 38,254 MLD (Million Litres per Day) of sewage of which only 11,787 MLD (31 per cent) is treated and balance is discharged untreated. The key issue regarding sewage collection treatment and disposal at the national as well as state level is inadequate provision of sewage treatment facilities which is one of the major causes of pollution of water bodies in the country. As per the estimates of CPCB, annually around 7.66 million Metric Ton (MT) of hazardous waste is generated from 40,000 industries in the country, of which the landfillable waste is 3.39 million MT (44.26 per cent), incinerable 0.65 million MT (8.50 per cent), and recyclable hazardous waste is 3.61 million MT (47.13 per cent) (CPCB, 2012). The rate of municipal waste generation in India in 2011 was 127458.1 T/day. This was divided by the then urban population to get the per capita waste generation rate of 0.356 kg/day. The amount of waste generated per capita is estimated to increase at the rate of 1–1.33 per cent annually (Pappu et al., 2007). Using the urban population projections3 in the year 2011, 2021, 2031, and 2041, the total amount of waste generated in India can be calculated as shown in Table 4. As is clear from the table, the daily waste generation in urban areas is expected to rise by almost 146 per cent by 2051.
Table 4: Projections of waste production in India
Per capita waste generated (Kg/day) Urban Population (x 1000) Waste generated (T/day)
2011 0.356 358308.6 127458.1
2021 0.406 436690 17728107
2031 0.463 516372 239240
2041 0.529 593548.7 313839.7
Source: Based on Pappu et al (2007) and Population Foundation of India
The status of solid waste management is considered as a development indicator as it has direct link to issues like sanitation and public health. Thus, management of solid waste generated in a country must be one of the priorities while forming policies at national level. India has many policies related to waste management – some include The Hazardous Waste (Management & Handling) Rules, Bio-medical Waste Handling Rules of 1998, Municipal Solid Waste (Management & Handling) Rules of 2000, National Urban Sanitation Policy, Plastic Waste Rules, 2011 & E-waste Rules of 2011, Draft Municipal Solid Waste Rules of 2013, Swachh Bharat Mission and Atal Mission for Rejuvenation and Urban Transformation. More recently the Swachh Bharat Mission aims to achieve scientific solid waste management in 4041 cities/towns for 30.6 crore persons. TheAtal Mission for Rejuvenation and Urban Transformation has an aim to ensure that every household has access to tap water and sewerage.
ForestsForest and tree cover 78.92 million hectares (mha) constituting 24.01 per cent of the geographical area of the country (FSI 2013). In percentage terms, forest and tree cover constitute 21.23 per cent and 2.78 per cent of this area, respectively. Based on the canopy cover, forest cover has been classified into open (10 per cent to 40 per cent), moderately dense (40 per cent to 70 per cent), and very dense (above 70 per cent) in the country. If we analyse the density class distribution, very dense, moderately dense, and open forests constitute 12 per cent, 46 per cent, and 42 per cent of forest cover, respectively (Table 5). It suggests that 42 per cent of the forest cover of the country is in open forest category, much of which is degraded and either have no or inadequate regeneration (FSI 2013). There has been an increase in forest cover by 5871 sq. km compared to 2011 assessment by Forest Survey of India; but there has been slight decline in the moderately dense and increase in open forest category. There has been a decline in
1 Class I: Population 100,000 and above2 Class II: Population 50,000 to 99,9993 Population projections used are from Population Foundation of India, Scenario B.

14 Green Growth and Sustainable Development in India
growing stock of the country by 389 m cu. m between 2011 and 2013, which suggests a decline in the quality of forest, despite the increase in overall increase in forest and tree cover (FSI 2013). Government owns around 97 per cent of the forest area and rest 3 per cent is owned by private entities and communities in India (MoEF 2006a). However, out of the government-claimed forest area, 18% per cent is un-classed land on which claims of the communities and individuals are yet to be settled. Majority of this un-classed area lies in the north-eastern states of India. The ownership claims are contested in many other parts of the country. Though ownership of forests is largely with the government, there has been an increasing involvement of communities in the management of forests over the years. It is reported that 28 per cent of the forest area is managed in collaboration with communities under the joint forest management (JFM) programme. Similarly, there have been efforts by companies and individual farmers to manage vegetative cover mainly outside forest area. After the 1980 Forest Conservation Act, which substantially reduced the supply of raw material from state forest lands to wood-based industries, the government has been promoting plantation of trees under various agroforestry and social forestry plantation schemes. There is a substantial demand and supply gap in major forest products across India (Table 6). This leads to a vicious circle where the unsustainable exploitation of forests contributes to their degradation, which in turn reduces the supply of products and services.
Table 6: Demand and supply gap of various forest products across India
Demand ( MT) Sustainable supply (MT) Gap/ unsustainable harvest (MT)
Fuel wood 228 128 100
Fodder (green and dry) 1594 741 853
Timber 54.94 40.70 14.74
Source: Aggarwal et al (2009)
Even though India’s forest area is increasing at a much higher rate than the change in forest area at a global level, India’s non-timber forest products (NTFPs) sector has remained neglected since the pre-independence period. It is one of India’s largest unorganized sectors with a population of about 275 million dependent on it and abusiness turnover of more than `6000 crores per annum (Planning Commission 2011). Although NTFP accounts for about 68 per cent of the export in the forestry sector, its development has always remained secondary as against timber. Forest dwellers who are mostly disadvantageous and landless communities with a dominant population of tribals generate about 20 per cent to 40 per cent of the annual income from NTFPs (Planning Commission 2011). By increasing investment in the NTFP sector and other natural assets that are used by poor to earn livelihood, the shift towards green economy will enhance livelihoods in many low-income areas.
Table 5: Density class distribution of forest cover
S.No. Category Forest cover (sq. km) In percentage terms
1 Very dense forest 83502 12
2 Moderately dense Forest 318745 46
3 Open Forest 295651 42
Total 697898 100
Source: FSI (2013)
Figure 11: Change in forest cover across different density classes over the years
Sources: FSI (2009, 2011, 2013)

15Environmental Performance in India
There are several forest-related interventions in India. The Indian Forest Act, 1927, was the first comprehensive act governing the forest sector, and it serves till date as the basis for forest administration in the country. Many of the provisions of the Act do not address contemporary issues related to forestry management in the country, for e.g. people’s participation. It does not reflect progressive changes in the forest policy of the country. The Forest (Conservation) Act, 1980, was enacted to control the diversion of forestland for non-forestry purposes and to slow down deforestation. Under this legislation, the approval of the central government is required for diversion of forestland above 1 ha for non-forestry purposes. The user agency has to pay for compensatory afforestation as well as an amount equal to the Net Present Value of the forests diverted. It has substantially brought down diversion of forests for non-forestry purposes. The National Forest Policy of 1988 marked a paradigm shift in forest management from regulatory to participatory. It implied a shift from the earlier revenue-oriented forest management to the current conservation-oriented management. It places emphasis on meeting peoples’ needs and involving them in management of forests. Meeting the subsistence needs of the local communities, maintenance of environmental stability, and restoration of ecological balance have been identified as the major objectives of forest management under the NFP. This policy laid the foundation of involvement of local communities in management of forests in the country. Participatory initiatives like Joint Forest Management were initiated due to the people-oriented approach of the policy. In the recent past, the National Environment Policy (2006) recognized that forest laws and formal institutions have undermined traditional community rights and disempowered communities, and ‘such disempowerment has led to the forests becoming open access in nature, leading to their gradual degradation in a classic sense of “Tragedy of Commons” (MoEF 2006b)’. The Policy advocates recognition of traditional rights of communities to ‘remedy a serious historical injustice’. The Forest Rights Act,althoughenacted in the year 2006, but its implementation started in the year 2008 after elaboration of the implementation guidelines and rules. The Act recognises a range of individual and communal rights on forest resources, including ownership and management of forest land, which have been neglected since colonial times. It not only aims to undo the ‘historical injustice’ to scheduled tribes and other traditional forest dwelling communities but also targets to empower the communities for the ‘responsibilities and authority for sustainable use, conservation of biodiversity and maintenance of ecological balance’ (MoLJ, 2007:2). However, there is a long history of political struggle before the FRA came into existence (Bose 2010). This contestation dates back to the colonial era when rights of people were systematically usurped and they started protesting against the government (Gadgil and Guha 1993). India adopted a comprehensive National Action Plan for Climate Change (NAPCC) to address issues related to climate change in 2008. It has eight missions, which cover a range of sectors and issues important for the country. The National Mission for a Green India, one of the missions, addresses forestry sector issues in this plan (NAPCC 2008). The GIM aims to treat an additional forest and non-forest area of 10 million ha over a period of next 10 years spread over two national plans starting from the TwelfthFive Year Plan in 2012 (MoEF 2010). It aims to increase the forest or tree cover over 5 million ha of area and improve the quality of cover over another 5 million ha. The GIM aims to undertake ‘holistic view of “greening”’ by focusing on ecosystem restoration and biodiversity conservation rather than merely focusing on plantations (MoEF 2010). An autonomous and decentralised governance structure has been proposed to implement and manage the mission. The ‘revamped’ Joint Forest Management Committees (JFMCs) under gram sabhas have been conceived as the institutions at grassroots level (MOEF 2010). Similarly, forest development agencies (FDA) have been made as nodal institutions at the district and state level. But GIM has made little progress so far. The MoEFCC has issued implementation guidelines in November 2014 with a proposed budget of `13,000 crores for the next five years (MoEF 2014a). These guidelines detail on the selection of landscapes, institutional structure, monitoring and evaluation and financial outlay for the programme (Ibid). Much of the proposed budget is drawn through convergence with programmes like Compensatory Afforestation and Management (CAMPA) and Mahatma Gandhi National Rural Employment Guarantee Scheme (MNREGS). The effectiveness of this approach remains to be seen.

16 Green Growth and Sustainable Development in India
WaterIndia has 1,123 billion cubic meters (BCM) of utilizable water resources available to itself every year, out of which 690 BCM comes from surface water and 433 BCM comes from ground water (Central Water Commission, 2014). India is moving towards perennial water shortage. Internationally, a country with less than 1,700 cubic meter per capita per year is considered as water stressed. The NIH estimates that this demand will have to be met by harnessing 700 km3 of surface water and 350 km3 of ground water (NIH 2014). Table 7 shows the decreasing levels of per capita water availability from 1951 to 2010 and its projected values for 2025 and 2050. India has been ranked 133 (out of total of 182 countries) in terms of total renewable per capita water resources.
Table 7: Per capita availability of water in India
Year 1951 1991 2010 2025 2050
Population (106) 361 846.3 1,157 1,333 1,581
Average Water Resources (m3/person/year) 3,008 1100 938 814 687
Source: National Institute of Hydrology,http://www.nih.ernet.in/rbis/India_Information/ Water%C2%A0Budget.htm, last accessed on June 5, 2014.
A major part of the additional water demand will come from the domestic and industrial sectors. The water demands of the domestic and industrial sectors will account for 8 per cent and 11 per cent of the total water demand by 2025. There is also a huge disparity in water supply in urban and rural areas. Unless a strong policy initiative is taken up at the national as well as state levels, the water sector scenario is expected to worsen. Table 8 indicates some parameters that serve as an illustration of the annual availability of water resources in India through a 50 year period (1958–2012).
Table 8: Parameters indicating annual water availability in India observed on a decadal scale
Parameters 1958–1962 1968–1972 1978–1982 1988–1992 1998–2002 2003–2007 2008–2012
National Rainfall Index (NRI) (mm/yr)
1643 1590 1640 1502
Surface water produced internally (10^9 m3/yr)
1404 1404 1404 1404 1404 1404 1404
Groundwater produced internally (10^9 m3/yr)
432 432 432 432 432 432 432
Overlap between surface water and groundwater (10^9 m3/yr)
390 390 390 390 390 390 390
Total internal renewable water resources (IRWR) (10^9 m3/yr)
1446 1446 1446 1446 1446 1446 1446
Total internal renewable water resources per capita (m3/inhab/yr)
3101 2494 1972 1589 1328 1232 1149
Water resources: total external renewable (natural) (10^9 m3/yr)
635.2 635.2 635.2 635.2 635.2 635.2 635.2
Water resources: total external renewable (actual) (10^9 m3/yr)
464.9 464.9 464.9 464.9 464.9 464.9 464.9
Total renewable water resources (natural) (10^9 m3/yr)
2081 2081 2081 2081 2081 2081 2081
Total renewable water resources (actual) (10^9 m3/yr)
1911 1911 1911 1911 1911 1911 1911
Total renewable water resources per capita (actual) (m3/inhab/yr)
4098 3296 2607 2100 1755 1628 1519
Total exploitable water resources (10^9 m3/yr)
1089
Source: AQUASTAT Database,<www.fao.org/nr/water/aquastat/data/query/>,last accessed on June 5, 2014.

17Environmental Performance in India
Table 9 illustrates the annual surface water and ground water requirements in various sectors in India considering low and high demand scenarios and making projections for 2025 and 2050, keeping the value for 1998 as baseline. Note that according to Table 9, irrigation is the heaviest user of surface and ground water presently, and is projected to be so even in 2025 and 2050. The share of the irrigation sector in the overall surface water usage is expected to decrease in 2050 as compared to 2025, while the sector’s share of the ground water usage remaining the same. In the year 2025, irrigation is expected to be using somewhat less than half of the surface water.
Table 9: Annual water requirement in India (in km3)
Uses Year 1997–1998
Year 2025 Year 2050
Low High % Low High %
Surface Water
Irrigation 318 325 366 43 375 463 39
Domestic 17 30 36 5 48 65 6
Industries 21 47 47 6 57 57 5
Power 7 25 26 3 50 56 5
Inland Navigation 10 10 1 15 15 1
Flood Control - - 0 - - 0
Environment(1) Afforestation
- - 0 - - 0
Environment(2) Ecology
10 10 1 20 20 2
Evaporation Losses 36 50 50 6 76 76 6
Total 399 497 545 65 641 752 64
Ground Water
Irrigation 206 236 245 29 253 344 29
Domestic 13 25 26 3 42 46 4
Industries 9 20 20 2 24 24 2
Power 2 6 7 1 13 14 1
Total 230 287 298 35 332 428 36
Total Water Use
Irrigation 524 561 611 72 628 807 68
Domestic 30 55 62 7 90 111 9
Industries 30 67 67 8 81 81 7
Power 9 31 33 4 63 70 6
Inland Navigation 0 10 10 1 15 15 1
Flood Control 0 0 0 0 0 0 0
Environment (1) Afforestation
0 0 0 0 0 0 0
Environment(2) Ecology
0 10 10 1 20 20 2
Evaporation Losses 36 50 50 6 76 76 7
Total 629 784 843 100 973 1,180 100
Source: National Institute of Hydrology,<http://www.nih.ernet.in/rbis/india_information/ AnnualWaterRequirements.htm>, last accessed on June 5, 2014.

18 Green Growth and Sustainable Development in India
BiodiversityIndia is a mega-diverse country with only 2.4 per cent of the world’s land area, and harbours a significant proportion of recorded species (Table 10). Of the 34 global biodiversity hotspots, four are present in India, i.e. the Himalayas, the Western Ghats, the North-east, and the Andaman and Nicobar Islands. From a network of 54 national parks covering 21,003 km² and 373 sanctuaries, covering 88,649 km², giving a combined coverage of 1,09,652 km²or 3.34 per cent of the country’s geographical area in 1988, the network has grown steadily, and as of 2014 there are 690 Protected Areas (PA) comprising of 102 National Parks, 527 Wildlife Sanctuaries, 572 Conservation Reserves, and 4 Community Reserves) covering 1, 66,851 km² or 5.07 per cent of the country’s geographical area. The country has 23 marine Protected Areas (PAs) in peninsular India and 106 in the islands (Fifth National Report to CBD, 2014).
Table 10: Recorded data of flora and fauna for India and the World
India World Share of India in world total (%)
Mammals 350 4,629 7.6
Birds 1,224 9,702 12.6
Reptiles 408 6,550 6.2
Amphibians 197 4,522 4.4
Fish 2,546 21,730 11.7
Invertebrates 71,389 11,68,623 6.1
Flora 15,000 250,000 6.0
Source: World Conservation Monitoring Centre (WCMC) and ENVIS Centre on Wildlife and Protected Areas
The degradation of ecosystems and habitats primarily due to anthropogenic pressures is increasingly becoming evident. There has been a continuous increase in area under the open forest category (as evidenced in the reports of Forest Survey of India). With regards to biodiversity, the data relating to the threatened species under the International Union for Conservation of Nature (IUCN) red data list is indicative of the existing risk to biodiversity and surrounding ecosystems. According to IUCN Red List (IUCN 2015), 1,039 species were categorized as threatened species for India (Table 11).
Table 11: Threatened Species in India: by Taxonomic groups
Mammals Birds Reptiles Amphibians Fishes Molluscs Other Inverts Plants Total
2008 96 76 25 65 40 2 109 246 659
2015 96 82 53 75 214 7 128 384 1,039
Source: IUCN Red List, 2015
Traditionally, India holds a reputation for being home to a culture that is hugely inspired from nature and builds on lessons learnt from it. Biodiversity in India, at ecosystem to genetic levels, demonstrates its importance from local to global levels. At the genetic level one of the eight centres of domestication of food crops such as rice, higher levels of species endemism (one of the main criteria for Biodiversity Hotspot) and presence of important ecosystems like tropical evergreen forests are indicative of the uniqueness of biodiversity in India. The rich heritage of traditional knowledge associated with the biodiversity provides an extremely important component from local to global levels. The country has a rich stock of genetic resources and associated traditional knowledge. To recognize and emphasize the local and global values of biodiversity in India, the country has signed and ratified several international Conventions and Protocols. India is party to a number of Multi-lateral Environment Agreements (MEAs), and is obliged to fulfil the provisions of the MEAs. India is a party to five major international conventions related to wildlife conservation, i.e., Convention on International Trade in Endangered Species of Wild Fauna and Flora (CITES), International Union for Conservation of Nature and Natural Resources (IUCN), International Whaling Commission (IWC), United Nations Educational, Scientific and Cultural Organization-World Heritage Committee (UNESCO-WHC), and the Convention

19Environmental Performance in India
on Migratory Species (CMS). Apart from this, India is also a member of the World Heritage Convention, Convention on Conservation of Migratory Species (CMS) or Bonn Convention, Ramsar Convention, and Convention on Biological Diversity (CBD).
Climate ChangeAccording to IPCC (2013), ‘Climate change is now a scientifically established fact’. Anthropogenic climate change is seen as one of the greatest challenges that the humanity of this era faces; with the future generations and the world’s poorest being the biggest payers of its implications. Implications of climate change are not limited to the biophysical sphere of Earth, but it also has its effects on socioeconomic statures, gender equality, food and water security, and resilience towards extreme weather or economic disturbances. The atmospheric carbon dioxide (CO2) levels seem to be increasing at an unstoppable rate. Its levels are recorded at 400 parts per million (ppm) at the Mauna Loa Observatory. The possibility of limiting the global average temperature rise below 2°C as was pledged in the 2009 Copenhagen Accord now seems nearly unachievable. The ecological impacts anticipated with even 2°C of warming are quite intense itself and would be higher with more warming. Past observations indicate that the annual mean temperature of India has showed a significant warming trend of 0.51°C per 100 years and during the period 1901–2007 with increased warming during 1971-2007 (Kothawale et al. 2010; INCCA 2010). This warming is mainly contributed by the winter and post-monsoon seasons, which have increased by 0.80°C and 0.82°C in the last hundred years, respectively. The pre-monsoon and monsoon temperatures also indicate a warming trend (INCCA 2010). Projections for 2030 also indicate a warming trend for the Indian sub-continent. India, being a diverse country in terms of climate, topography, social and economic factors, is also facing a number of challenges with respect to climate change. Being heavily dependent on climate sensitive sectors and resources for livelihoods and economy, India faces an urgent need of adapting to the risks faced by climate variability. Key natural resources including water, land, forests, and biodiversity are already facing impacts of climate change. Agriculture, which supports the livelihoods of millions of people in India, contributes nearly 17.1 per cent of GDP of the country. Climate variability and extreme climate events adversely affect agricultural production and the livelihoods of the farmers. Past observations have indicated a decline in crop production due to temperature increase and extreme events in India. Without adaptation, there might be a loss of 10-40% in crop production in India by 2080-2100, inspite of benefits from increased level of CO2 (INCCA, 2010). Ecosystems are also very sensitive to climate variability and some of the impacts are already visible in case of India. Shift in the arrival of monsoon, long winter dry spells (5–6 months as experienced in 2008–09), increased frequency of forest fires during winter, the early flowering/fruiting of native trees, such as Rhododendron, have been observed in
Figure 12: Spatial patterns of linear trends of maximum and minimum temperature
(Key: Red- warming trend at 5%; yellow- warming; Green- cooling trend; Blue- Cooling trend at 5%)
Source: INCCA (2010)31
Key: Red- warming trend at 5%; Blue- Cooling trend at 5%; Green- cooling trend; yellow- warming
Figure 3.2: Spatial patterns of linear trends of annual mean, maximum and minimum temperature. Upper panel: Mean annual temperatures; Middle panel: Trends in maximum temperatures; Lower panel: Trends in minimum temperatures

20 Green Growth and Sustainable Development in India
the Indian Himalayan Region (IHR) (INCCA, 2010). Water which is a critical resource is likely to be adversely impacted in terms of effect on water balance due to change in pattern of precipitation and evapotranspiration. Increased frequency of heavy rainfall events may result in higher runoff. Urban areas and cities of India which are rapidly developing are also vulnerable to the impacts of climate change due to inadequate infrastructure and high population density. Climate change may also cause health impacts, including direct impacts such as heatstroke or increased mortality due to droughts or floods as well as indirect impacts such as increased risk of vector-borne diseases. These impacts will also have financial implications for the country. A study by ADB (2014) estimated that by 2050, annual GDP losses for India under the business-as-usual (BAU) scenario are projected to be about 1.8 per cent. The adaptation cost estimated for India for 2030s is USD 7,797.8 million and for 2050s is USD 21,456 million (ADB, 2014). It has been observed in recent years that the characteristics of daily rainfall have been undergoing changes in a way that the frequency and intensity of heavy to very heavy rainfall events are increasing, while the events with low rainfall are showing a decline in their frequency, particularly over the central parts of India (Goswami et al, 2006). It has been emphasized that differences in vulnerability and exposure arise from non-climatic factors and from multidimensional inequalities often produced by uneven development processes (IPCC 2014). These differences shape differential risks from climate change. The IPCC has emphasized that adaptation planning and implementation can be enhanced through complementary actions across levels, from individuals to governments (ibid). Due to rapid development, India is already facing a number of non-climatic stressors and the risks due to climate variability will aggravate the vulnerability of the country. However, in this context, India has already started taking initiatives to address these climate risks. According to the second National Communication to United Nations Framework Convention on Climate Change (UNFCCC) on climate change (NATCOM 2012) the development plans of the country have been designed with balanced emphasis on economic development and environment, guided by the principles of sustainable development. This also highlights the potential to integrate and implement adaptation in the development pathway of the country. As a corollary to the National Action Plan on Climate Change, in August 2009, all the states were directed to formulate their respective State Action Plan on Climate Change (SAPCC), guided by and consistent with the structure and strategies of the NAPCC.4 The individual SAPCCs should lay down sector-specific as well as cross-sector time-bound priority actions in the light of state-specific risks, impacts, and opportunities, besides prioritizing areas for research and policy action in response to current and future vulnerabilities and projected impacts. The SAPCCs should also list indicative budgetary requirements, supplemented with details of the necessary institutional and policy infrastructure to support the operationalization of actions. By the end of 2014, all Indian states had prepared at least a draft of the action plan. As of June 2015, the National Steering Committee on Climate Change (NSCCC) at the Ministry of Environment, Forest and Climate Change has endorsed 19 state action plans including Andaman and Nicobar, Andhra Pradesh, Arunachal Pradesh, Chhattisgarh, Himachal Pradesh, Jammu and Kashmir, Lakshadweep, Madhya Pradesh, Manipur, Meghalaya, Mizoram, Nagaland, Odisha, Puducherry, Punjab,
Figure 13: Trends in annual extreme rainfall (Note: Dark green colour indicates increasing trends)
Source: INCCA (2010)
34
Khaladekar et al., 2009, report a study of extreme rainfall pattern in the Indian region with a data series spanning the period 1960-2003. Total 165 stations well spread across the region with the data availability of at least 50 years up to 1980 are considered (Source: Climatological Tables of Observatories in India: 1951-1980, IMD, 1999). Only the cases with the minimum
rainfall of 10 cm/day are taken into account to give weightage to the high rainfall values. The rainfall data after 1980 are compiled from different IMD publications. The instances of extreme precipitation events at the stations are classifi ed chronologically according to the decades. The high rainfall events that occurred at the stations after 1980 are compared
Table 3.2 : Comparison of magnitudes of Extreme Precipitation Rainfall Event (EPRE) in cms, before and after 1980 in selected regions
Station Region Max EPRE upto 1980 Max EPRE recorded between 1980 and 2010
Himalayas
Ambala Punjab 23 (Aug 10, 1896) 34 (Aug 03, 2004
Leh Jammu and Kashmir - 250 mm/hr (Aug 6, 2010)
Coastal Region
Amini devi Lakshwadeep 25 (Nov21, 1977) 170 (May 06, 2004)
Santacruz Mumbai 38 (July 05, 1974) 94 (July 27, 2005)
Male gaon Mumbai 16 (July 26, 1896) 29 (Oct 11, 2001)
Bhira Konkan & Goa 43 (June 29, 1967) 71 (July 24, 1984)
Sand heads Anadaman 37 (July 14, 1972) 51 (June 12, 1981)
Sagar West bengal 38 (July 30, 1973) 48 (April 07, 2005)
North East
Cherrapunji Assam 19 (Sept 13, 1974) 156 (June 16, 1995)
Silchar Assam 29 (My 30, 1893) 47 (July 7, 1991)
Jalpaiguri North Bengal 39 (July 8, 1892) 47 (July 10, 1989)
Malda North Bengal 24 (Oct 1, 1971) 57 (Sept 28, 1995)
North West
Jaipur Rajasthan 19 (August 16, 1959) 22 (July 19 (1981)
Figure 3.5 : Highest recorded rainfall (cm) during 1951-2004 (a) and trends in annual extreme rainfall (b). Dark green color indicates signifi cant increasing trend
a b
a b
4 PM’s address at the National Conference of the Ministers of Environment and Forests, August 18, 2009, PIB: Government of India, Online. Available at : http://pib.nic.in/newsite/erelease.aspx?relid=51926

21Environmental Performance in India
Rajasthan, Sikkim, Tripura, and West Bengal. Three SAPCCs (Haryana, Jharkhand, and Karnataka) have been considered by the Expert Committee. The climate change agenda for India gained thrust and importance when the legally binding framework was agreed upon by the different governments of the world, including India in 1992, to confront the challenge of climate change through adoption of the United Nations Framework Convention on Climate Change (UNFCCC). At that time, India was a strong advocate of Article 4.7 of UNFCCC which recognizes poverty eradication and socio-economic development as an ‘overriding priority of developing countries’ and of Article 3.1 recognizing the ‘principles of equity and of common but differentiated responsibilities’ among nations. India is also party to the key environmental agreements of the world, beginning with the Stockholm Declaration in 1972 to the ratification of Kyoto Protocol in 2002. Keeping its positive and constructive approach for contribution to the global climate change agenda, in the 13th Conference of Parties in 2007, India publically stated its ambition to not exceed its per-capita emissions at any point beyond those of developed country parties (India’s views available in paragraph 1(a) of Bali Action Plan). At Copenhagen, in 2009, India demonstrated its seriousness and willingness to take on global leadership, to the extent its capacity permits. It announced its endeavour to voluntarily reduce the emissions intensity of its GDP, by 20-25%, by 2020 in comparison to the 2005 levels (emissions from agriculture sector will not be part of the assessments of emissions intensity under the Pledge). By March 2014, India recorded the second highest number of CDM projects, by any country, reinforcing its strong willingness to fight against climate change (1,493 out of a total of 7,472 projects (1/6th) registered by the CDM Executive Board from India). Domestically, India introduced legislation and policies to integrate environment protection into development planning over its Twelfth and Thirteenth Five Year Plan periods. Strongly guided by the principle of CBDR, India will address all key elements of mitigation, adaptation, finance, technology development and transfer, capacity building and transparency of actions in a balanced manner, in its Intended Nationally Determined Contributions (INDCs) for the new agreement for post-2020 mitigation goals. India expressed that a balance in climate actions will not only be a political parity with mitigation but a total parity regarding financial flows, binding status, technology transfers or a sense of urgency and commitments. The comprehensive INDC would also project Clean Energy Goal Targets for the country as well as the requirement of support in terms of finance and technology transfers. It would cover all the national missions and other initiatives under National Action Plan on Climate Change as well as State Action Plan on Climate Change.

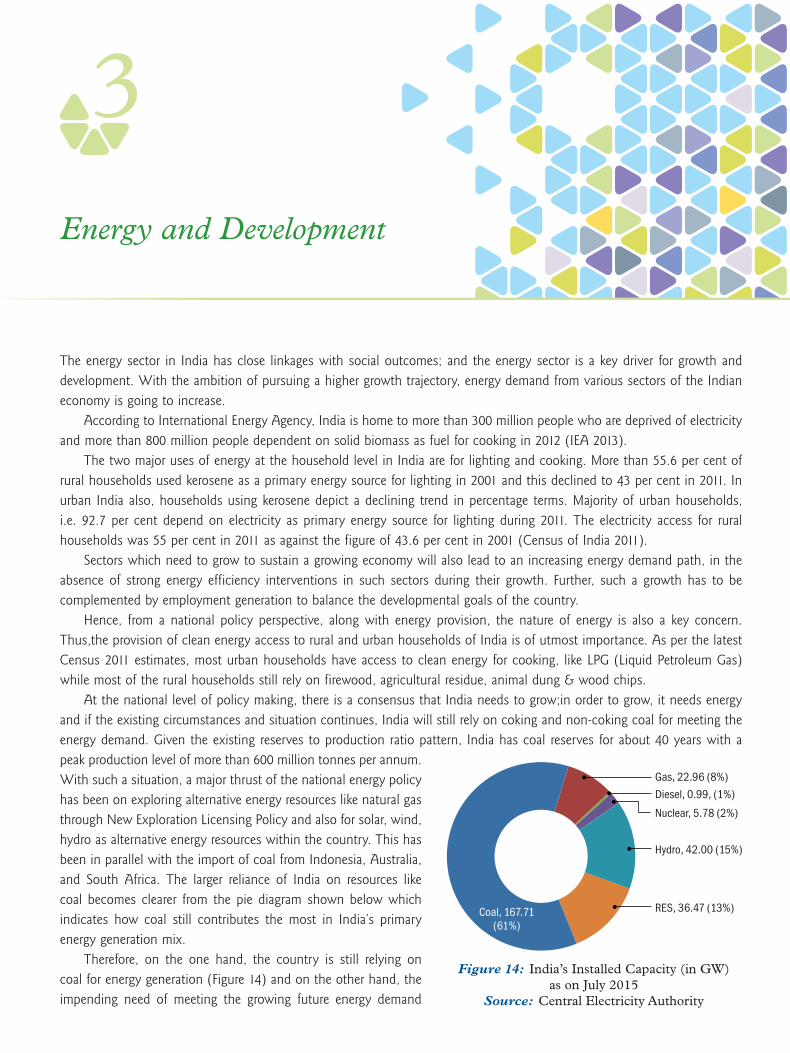
3
The energy sector in India has close linkages with social outcomes; and the energy sector is a key driver for growth and development. With the ambition of pursuing a higher growth trajectory, energy demand from various sectors of the Indian economy is going to increase. According to International Energy Agency, India is home to more than 300 million people who are deprived of electricity and more than 800 million people dependent on solid biomass as fuel for cooking in 2012 (IEA 2013). The two major uses of energy at the household level in India are for lighting and cooking. More than 55.6 per cent of rural households used kerosene as a primary energy source for lighting in 2001 and this declined to 43 per cent in 2011. In urban India also, households using kerosene depict a declining trend in percentage terms. Majority of urban households, i.e. 92.7 per cent depend on electricity as primary energy source for lighting during 2011. The electricity access for rural households was 55 per cent in 2011 as against the figure of 43.6 per cent in 2001 (Census of India 2011). Sectors which need to grow to sustain a growing economy will also lead to an increasing energy demand path, in the absence of strong energy efficiency interventions in such sectors during their growth. Further, such a growth has to be complemented by employment generation to balance the developmental goals of the country. Hence, from a national policy perspective, along with energy provision, the nature of energy is also a key concern. Thus,the provision of clean energy access to rural and urban households of India is of utmost importance. As per the latest Census 2011 estimates, most urban households have access to clean energy for cooking, like LPG (Liquid Petroleum Gas) while most of the rural households still rely on firewood, agricultural residue, animal dung & wood chips. At the national level of policy making, there is a consensus that India needs to grow;in order to grow, it needs energy and if the existing circumstances and situation continues, India will still rely on coking and non-coking coal for meeting the energy demand. Given the existing reserves to production ratio pattern, India has coal reserves for about 40 years with a peak production level of more than 600 million tonnes per annum. With such a situation, a major thrust of the national energy policy has been on exploring alternative energy resources like natural gas through New Exploration Licensing Policy and also for solar, wind, hydro as alternative energy resources within the country. This has been in parallel with the import of coal from Indonesia, Australia, and South Africa. The larger reliance of India on resources like coal becomes clearer from the pie diagram shown below which indicates how coal still contributes the most in India’s primary energy generation mix. Therefore, on the one hand, the country is still relying on coal for energy generation (Figure 14) and on the other hand, the impending need of meeting the growing future energy demand
Energy and Development
Figure 14: India’s Installed Capacity (in GW) as on July 2015
Source: Central Electricity Authority

24 Green Growth and Sustainable Development in India
triggered by higher economic growth is also felt within the country. Renewableenergy interventions have been brought in recognizing energy security as well as the need to reduce domestic carbon emissions. At the national level, to move towards a green growth and development path by means of energy related interventions, India has initiated several interventions around renewable energy. India’s growth will lead to a rise in energy demand which could enhance the existing energy deficit situation where at the national level the energy demand broadly exceeds the energy supply by more than 10 per cent. To move towards a growth path which is green and environment friendly, renewable energy is therefore an option for the country. However, owing to certain infrastructural and sector specific constraints, it might take some time to meet those targets. Hence, in the intermediary stage, a focus on energy efficiency measures can be considered as a low hanging fruit. This will be more important in terms of addressing a growth path of the country that is sustainable and sensitive to the needs of the environment. As depicted by the Sankey diagram in Figure 15, commercial energy supply in India is heavily dependent on fossil fuels. Coal and petroleum products together accounted for about 88 per cent of the total primary energy supply – this is based on the commercial energy flows calculated from various government sources in India for 2011/12 (TERI 2015b). Approximately 60 per cent of the coal produced goes for electricity consumption, about 39 per cent of the coal is consumed in the industry sector, and the rest is used in other sectors of the economy. The share of nuclear, renewable, and hydro in the total energy supply remains less; and given our limited and unevenly distributed supply of non-renewable energy sources – it is becoming extremely challenging to meet India’s growing energy demand by relying on fossil fuels alone.
Approach for Techno-economic AnalysisIt becomes important to understand the inter-linkages between economy, energy supply, energy demand, and development indicators for India. The objective of the integrated techno-economic analysis is to understand the impact of energy-related green growth interventions on future energy demand, emissions, energy access, energy security and development. In order
Figure 15: Sankey diagram showing commercial energy flow in India for 2011/12Source: TERI (2015)

25Energy and Development
to understand these interlinkages, two sets of models are considered. On one side, the energy supply and demand has been analysed through an energy system model TERI-MARKAL (MARKet Allocation MARKAL). On the economy side, a simulation-based dynamic, recursive computable general equilibrium (CGE) model is used. A simulation structure is set up which feeds back the output of the CGE model into the energy system model and loops back the output of the energy system model to the CGE model. In this integrated framework, the CGE model broadly captures the macroeconomic and socioeconomic aspects within the boundaries of a national economic system. The energy system model on the other hand, captures the changes in energy demand and supply of the economy. Hence, the integrated CGE-MARKAL assessment gives insights into the larger picture of the changes in the socioeconomic, macroeconomic, energy supply and demand in an economy. As a part of the scenario analysis, within the modelling framework, the following green growth and development interventions are considered. It includes, a) energy efficiency and conservation measures in energy demand sectors (agriculture, transport , industry sector, commercial building, and residential sector) along with enhancement of modern energy access; b) promotion of clean energy supply through renewables and cleaner fossil-fuel based-energy generation technology; and c) resource (soil and water) conservation in the agriculture sector. For understanding the implications of these three categories of green growth measures on energy and development indicators, four scenarios have been considered. These scenarios are a) Reference, b) Policy, and c) Ambitious-1, and d) Ambitious-2. The Reference Scenario is in line with a business-as-usual scenario. The Policy Scenario assumes effective implementation of existing policies. The Ambitious Scenarios comprises of measures that includes implementation action over and above what is considered in the Policy Scenario. The energy system model also projects the optimum energy supply mix that satisfies the aforesaid energy demand after considering the different technological options. The scenario specific energy demand and optimum energy supply mix projections are estimated on the basis of a cost minimization exercise. As part of the modelling process, the time series values of fixed and variable costs and investments for different technological options are considered as inputs into the model. Discount factor for each cost is incorporated into the model, based on stakeholder consultations. Based on these inputs, the model optimizes life cycle costs and projects energy demand of different sectors of the economy for three different scenarios. As an outcome of this exercise, the model projects how energy demand, primary energy supply mix, and carbon dioxide emissions will change in future. Outputs of the model are mainly the scenario specific energy demand, primary energy supply mix, carbon dioxide emissions, and investments. Further, on the macro-economy side, a simulation-based dynamic, recursive CGE model is constructed. The CGE model predicts various levels of relative prices, sectoral economic outputs, GDP (gross domestic product) at factor costs, household class specific income distribution, and investment requirements for each sector of the economy. This simulation model represents the entire economy in an ideal set up where through simulation, demand and supply sides of the entire economy reach an equilibrium at every point in future. The macroeconomic analysis creates this equilibrium condition through the savings and investments within the economy under different scenarios. As an output of the model, household class-wise income generation is projected. As income distribution across household classes impacts the inequality and welfare level, the income levels of each household class is considered as an exogenous input into a welfare function. Moreover, literacy, infant mortality, and poverty rates are made dependent on the exogenous inputs such as income level of household classes of the economy. With variation in the projected income levels of households, literacy, infant mortality, and poverty rates also vary. Figure 16 shows a schematic figure of CGE-MARKAL Integration undertaken in this initiative.
Energy ModelThe MARKAL energy system model includes: a) Primary energy supply (for instance, mining of natural resources, fossil fuel extraction, and corresponding petroleum product formation); b) Processing and conversion (refineries, power plants, etc.); and c) Demand for end use energy (residential, space heating, automobiles, etc.). The major energy consuming end use sectors of the economy are—agriculture, commercial, industry, residential, and transport. On the supply side of the model, conventional energy sources, such as coal, oil, natural gas, hydro and nuclear as well as the renewable energy sources, such

26 Green Growth and Sustainable Development in India
as wind, solar, hydro have been considered. Domestic availability of these sources of energy are considered as constraints within the model. Sectoral demands are driven by their share in the GDP, population, and energy prices. Some of the underlying assumptions considered in the energy model regarding these parameters for three considered scenarios are outlined in Table 12.
Table 12: Macroeconomic and scenario-wise assumptions for MARKAL
Theme Gross Domestic Product Population Energy Prices
Macroeconomic Parameters
• Grows at a CAGR of 8% between 2001– 2031
• Share of agriculture falls from 26% in 2001 to 11% in 2031
• Industry sector share in GDP rises from 23% in 2001 to 30% in 2031 TERI. (2014)
• Service sector share rises to 58% by 2031
• population rises from 1.03 billion in 2001 to 1.52 billion in 2031 according to Population Foundation of India (B Scenario)
• Crude Oil price rises from 118.4 USD/barrel in 2015 to 141 USD/barrel in 2030 (IEA 2013)
• Natural Gas price rises from 15.30 USD/MBtu in 2015 to 15.60 USD/Mbtu in 2030
• Coal Prices rise from 110 USD/tonne in 2010 to 122.5 USD/tonne in 2030
• Price projections of World Energy Outlook have been considered
Assumptions
Reference Energy Scenario
• The past trends as indicated in CEA (2012) are considered to create future projections• Existing policy commitments and the ones which are announced are implemented• Production of non-coking coal will reach a maximum of about 700 MT by 2021–22 {CCO (Coal
Controller’s Organization). 2012}
Figure 16: CGE-MARKAL Integrated Modelling

27Energy and Development
• Metallurgical coal will continue and the production will reach a maximum of 19 MT by 2021–22 and stay at that level thereafter
• Production of non-metallurgical coal will peak at nearly 50 MT by 2021–22• Lignite coal production reaches 63 MT by 2021–22• OIL’s onshore crude production stays at around 4.5 MT. Private/JV onshore crude output increases
steadily up to 10 MT in 2015–16 and offshore crude output by private/JV companies continues to decline as has been the case over 2000–01 to 2011–12
{MoPNG (Ministry of Petroleum and Natural Gas). 2012)}• In the short term, Reliance’s KG-D6 gas output continues to fall steadily • Ultra-supercritical technology would be available at commercial scale only by 2031• The capacity realizations of large hydroelectric plants to a moderate level of around 94 GW by 2031–32
is predicted• Nuclear energy in the Reference Scenario is projected to rise from an installed capacity of 5 GW in
2011–12 to 28 GW in 2031–32. • The capacity addition plan considered for different grid interactive renewable energy sources are also
outlined below – - Biomass Power—2,100 MW (XIIth plan), 2,000 MW (XIIIth plan) - Small Hydro Power—1,600 MW(XIIth plan), 1,500 MW (XIIIth plan) - Solar Power—10,000 MW (XIIth plan), 16,000 MW (XIIIth plan) - Waste to Energy—500 MW (XIIth plan) - Tidal Power—7 MW - Geothermal—3.18 MW - Total—29,214 MW (XIIth plan), 34,500 MW (XIIIth plan)• Share of efficient electric pump sets in irrigation is assumed to rise from negligible levels in 2011 to
about 18% in 2031• No improvement in the EPI (energy performance index) of all the categories of commercial buildings
and limited building energy efficiency standard penetration in the new buildings (from 1% in 2011, 3% by 2021, and 6% by 2031).
• Share of efficient air conditioners, fans, coolers, and refrigerators is taken to rise in both the rural and urban households from about 9% in 2011 to 27% in 2031. An efficiency improvement in air conditioners and fans takes place at the rate of 1% per annum and 0.4% per annum respectively
• Share of LPG in rural cooking rises from 12% in 2011 to 23% in 2031 and urban cooking is taken to increase from 60% in 2011 to 72% in 2031 and share of improved cookstoves rises to 5% from negligible levels in 2011 by 2031 in the RES
• Efficiency improvement is considered as per the past trend and in line with commercially available technological options in the industry sector
• Large scale industries, such as cement, iron and steel, petrochemicals and other chemicals assumed to improve their energy efficiency levels by adoption of state-of-the-art technologies. Small-scale Manufacturing Enterprises (SMEs) adopt energy efficient technologies at a slower rate.
Policy (ESM- Energy Security Moderate) Scenario
• Total production of coal reaches 990 MT by 2021–22 and about 1,220 MT by 2031–32• ONGC’s offshore crude oil production is assumed to increase to 18 MT by 2015–16 and finally to
25 MT by 2021–22. ONGC is able to keep its onshore production constant at the level reached in 2012–13 (7.2 MT) till 2021–22
• Total private/JV onshore production is assumed to reach 10 MT by 2015–16 and increase to 13 MT by 2020–21 and 2021–22
• Overall private/JV production will increase to 17 BCM by 2016–17 and go up to 20 BCM by 2021–22• Significant increase in non-conventional gas (especially coal bed methane) production assists in taking
domestic production up to 80 BCM by 2031–32.• Large hydroelectric plants generate a little over 105 GW by 2031–32.• Installed capacity of nuclear will grow from 5 GW in 2011–12 to 41 GW in 2031–32• Renewable Purchase Obligations (RPOs) are extended beyond the mandate of 15% by 2021–22 and
reaches 18% by 2031–32.• For the agriculture sector, the share of efficient tractors in land preparation will rise to 25%, as
compared to the RES assumption of 10%• Energy efficient building standard penetration increases from 1% in 2011, 13% in 2021, and 26%
in 2031 is considered and a 5% reduction in EPI after every 5 years is considered in the commercial buildings

28 Green Growth and Sustainable Development in India
• Share of efficient public lighting, public water works, and sewage pumping increases to 43% by 2031 compared to negligible levels in 2011
• Share of efficient air conditioners, fans, coolers, and refrigerators to rise up to 50% by 2031. Also, by 2031 it is assumed that 54% of the lighting demand in both the urban and rural sectors is met by efficient CFLs, 40% by LEDs
• By 2031 the penetration level of improved cookstoves in rural areas would be 20% • In the industry sector, adoption of energy-efficient technologies as well as uses of waste material such
as higher share of blended cement in total cement production happens in comparison to the Reference System viz. Enhanced recycling of materials such as scrap based steel, use of fly ash and slag in cement production process, reduction in share of OPC (ordinary Portland cement) cement from 24% in 2011 to 17% in 2050 in policy scenario and 24% in 2011 to 7% in ambitious scenario and increase in PSC (Portland slag cement) cement share to 69% in 2051 from 11% in 2011 in the ambitious scenario.
• SMEs will also have significant efficiency improvement over the time by means of removal of institutional barriers, availability of finance, capacity building and cluster level intervention. etc.
Ambitious-1 (ESA – Energy Security Ambitious) Scenario
• Key mitigation options like Widening and deepening of the Perform-Achieve-Trade (PAT) scheme , Focusing on energy efficiency improvement in the MSME sectors, Enhanced recycling of materials such as scrap based steel, use of fly ash and slag in cement production etc are fully implemented in the industry sector
• Total production of coal reaches about 988 MT by 2021–22 and about 1,200 MT by 2031–32. Natural gas production reaches 80 BCM by 2031, which is similar to the Policy Scenario. Oil production rises to 68 MT by 2031
• Faster implementation of efficiency measures, rapid penetration of new technologies, and increased electrification of the economy happens to reduce energy imports by 2031
• Power generation by large hydroelectric power plants goes over 105 GW by 2031-32• Nuclear power capacity is assumed to grow from 5 GW in 2011 to 41 GW in 2031• Renewable energy (RE) generation capacity based on solar PV reaches at least 200 GW by 2031, while
that of wind grows to 110 GW by 2031• The share of efficient tractors in land preparation within agriculture sector will rise to 50%, as
compared to the RES assumption of 10% and 25% in Policy Scenario• All new commercial buildings that come up follow energy efficiency standards• Share of efficient public lighting, public water works, and sewage pumping is taken to be 60% by 2031
compared to negligible levels in 2011• By 2031, 18% of the lighting demand in both the urban and rural sectors is met by efficient CFLs, 80%
by LEDs• By 2031, the penetration level of improved cookstoves in rural areas would be 20%
Ambitious-2 (ESA – Energy Security Ambitious plus) Scenario
• Renewable energy (RE) generation capacity based on solar PV reaches 100 GW in 2022 and 300 GW by 2032, while that of wind grows to 60 GW in 2022 and 126 GW by 2032, biomass reaches 10 GW in 2022 and 25 GW in 2032, SHP reached 5 GW in 2022 and 7.65 GW in 2032.
• All other assumptions are in line with Ambitious-1 scenario with some adjustments due to the more ambitious targets set by renewable energy policies.
Based on the above scenario contexts, the future projections of the energy demand under reference, policy, and ambitious scenarios are given below. As stated, many of the sectoral interventions which happen in the policy and ambitious scenarios are central elements of green growth and development measures as it encompasses mitigation measures as well as measures of enhancing energy access which can enhance the levels of development in the country. Future projections from these scenarios are discussed below.
Primary Energy SupplyFigure 17depicts the fuel-wise primary energy supply across the four scenarios. In the REF scenario, primary energy supply grows from 869 Mtoe in 2015 to 2017 Mtoe in 2031. Share of biomass in primary energy supply reduces from 20 per cent in 2015 to 10 per cent in 2031 across scenarios owing to better energy access and quality of life improvement of the rural people through a larger access to improved cookstoves. In the POL scenario by 2031, primary energy supply from coal increases to 818 Mtoe from 375 Mtoe in 2015 while in the AMB-1 and AMB-2 scenarios of 2031, primary energy from coal in 2031 further drops to 609 Mtoe and 590 Mtoe, respectively.

29Energy and Development
Coal stays the dominant source of primary energy supply although in the policy and ambitious scenarios, the share of oil and natural gas increases. Coal in the REF scenario stays the dominant fuel and its share in the primary energy supply increases to 1023 Mtoe in 2031. The primary energy supply from oil increases from 217 Mtoe in 2015 to 537 Mtoe in 2031. In the REF scenario of 2031, primary energy supply from nuclear, experiences an increase to 28Mtoe in 2031 from 16 Mtoe in 2015. In the REF scenario, by 2031, 83 per cent of the major commercial energy comes from coal, oil, and gas. However, 10 per cent of the share comes from traditional biomass, whereas 2.5 per cent comes from nuclear energy and 4.5 per cent of primary energy supply comes from renewables and hydro in the REF scenario. The share of energy from fossil fuels falls to 80 per cent in POL scenario. Moreover, the share of wind and solar increases in the POL scenario and this raises the share of renewables in primary energy supply to around 5 per cent by 2031. Share of energy from fossil fuels falls to 77 per cent in AMB-1 scenario. The share of renewables in primary energy supply is increased to 6.4 per cent by 2031. Share of energy from fossil fuels falls to 75 per cent in AMB-2 scenario. The share of renewables in primary energy supply is increased to 8.5 per cent by 2031. Figure 18 depicts the power generation capacity mix across the four scenarios. In 2015, power generation capacity was 350 GW. Share of fossil fuel based power generation capacity was 68 per cent. Nuclear and hydro power capacity contributed 9 and 51 GW, respectively, to the total power generating capacity. Amongst the renewables sector, solar and wind-basedinstalled capacity was12 and32 GW, respectively. In the REF scenario, power generation capacity grows to 930 GW in 2031. Share of fossil fuel based power generation capacity is 68 per cent in 2021 and 69 per cent in 2031 in the REF scenario. Nuclear generation capacity increases to 28 GW in 2031 and hydro power capacity grows to 89 GW in 2031. Solar based generation is 22 GW in 2021 and 75 GW in 2031. Wind energy increased from 37 GW in 2021 to 75 GW in 2031. In the POL scenario, power generation capacity grows to 1027 GW in 2031. Share of fossil fuel based power generation capacity is 57.8 per cent in 2021 and 53.7 per cent in 2031 in the POL scenario. Solar based generation is 53 GW in 2021 and 214 GW in 2031. Wind energy increased from 49 GW in 2021 to 105 GW in 2031. In the AMB-1 scenario, power generation capacity grows to 1050 GW in 2031. Share of fossil fuel based power generation capacity is 56 per cent in 2021 and 53 per cent in 2031 in the AMB-1 scenario. Solar based generation is 60 GW in 2021 and 219 GW in 2031. Wind energy increased from 59 GW in 2021 to 110 GW in 2031. In the AMB-2 scenario, power generation capacity grows to 1181 GW in 2031. Share of fossil fuel based power generation capacity is 52 per cent in 2021 and 48 per cent in 2031 in the AMB-2 scenario. Solar based generation is 105 GW in 2021 and 309 GW in 2031. Wind energy increased from 60 GW in 2021 to 126 GW in 2031.
Figure 17: Scenario-wise primary energy supply (Mtoe)
Source: TERI MARKAL Model Results
Figure 18: Scenario-wise Power generation capacity (GW)
Source: TERI MARKAL Model Results

30 Green Growth and Sustainable Development in India
Final Energy DemandFigure19shows final energy demand under the four scenarios. The three major energy-consuming sectors, namely industry, residential, and transport, continue their dominance of the final energy demand, contributing about 90 per cent over the modelling horizon under REF scenario. Transport sector energy demand witnesses a noticeable increase, growing by almost three times, from 125 Mtoe in 2015 to about 360 Mtoe in 2031 (under the reference scenario). Under the POL and AMB scenarios, the final energy demand is somewhat reduced, owing to the demand side management measures in various end use sectors. The final energy demand in the industry, transport and residential sector goes down substantially in the ambitious scenarios in comparison to the reference scenario.
IndustryFigure 20 shows final energy demand in industry for the four scenarios. The demand for coal is the maximum across all the four scenarios while biomass is reduced in all the scenarios. The share of coal is dropping in the AMB scenarios as compared the REF scenarios; the reduction in AMB-2 scenario drops by 10.7 per cent as compared to the REF scenario. Demand for oil is also decreasing across all the four scenarios with the decrease being more in the AMB-2 scenario. In the REF scenario, energy demand of the industry sector grows at a CAGR of 6.4 per cent between 2021 and 2031.
The energy demand of coal in industry is 210 Mtoe in 2021 and 415 Mtoe in 2031. In the POL scenario, energy demand of the industry sector grows at a CAGR of 5.6 per cent between 2021 and 2031. The energy demand of coal in industry is 209Mtoe in 2021 and 397 Mtoe in 2031. In the AMB-1 scenario, energy demand of the industry sector grows at a CAGR of 5.6 per cent between 2021 and 2031. The energy demand of coal in industry is 206 Mtoe in 2021 and 381 Mtoe in 2031. In the AMB-2 scenario, energy demand of the industry sector grows at a CAGR of more than 4.9% between 2021 and 2031. The energy demand of coal in industry is 200 Mtoe in 2021 and 371 Mtoe in 2031. Energy demand for coal, natural gas, petroleum products, electricity and biomass goes down progressively in the industry sector owing to a transition from the reference to the ambitious scenarios.
Residential SectorFigure 21shows final energy demand in residential sector for the four scenarios. The share of traditional biomass is decreasing and of grid electricity is increasing in the POL and AMB scenarios as compared to the REF scenarios between 2021 and 2031. The share of traditional biomass decreases from 64 per cent in the REF scenario to 58 per cent in the AMB-2 scenario in 2031. The share of grid electricity increases from 25 per cent in the REF scenario to 31 per cent in the AMB-2 scenario in 2031.
Figure 19: Final energy demand, across scenarios (Mtoe)
Source: TERI MARKAL Model Results
Figure 20: Final energy demand in the industry sector, across scenarios (Mtoe)
Source: TERI MARKAL Model Results

31Energy and Development
In 2015, the total energy demand was 221 Mtoe in 2015 of which more than 80 per cent of the share was constituted by traditional biomass. In the REF scenario, energy demand of the residential sector grows at a CAGR of 1.3 per cent from 233 Mtoe to 266 Mtoe between 2021 and 2031. The energy demand of traditional biomass is 178 Mtoe in 2021 and 172 Mtoe in 2031. In the POL scenario, energy demand of the residential sector grows at a CAGR of 1.3 per cent from 232 Mtoe to 264 Mtoe between 2021 and 2031. The energy demand of traditional biomass is 175 Mtoe in 2021 and 159 Mtoe in 2031. In the AMB-1 scenario, energy demand of the residential sector grows at a CAGR of 1.2 per cent from 230 Mtoe to 259 Mtoe between 2021 and 2031. The energy demand of traditional biomass is 174 Mtoe in 2021 and 155 Mtoe in 2031. In the AMB-2 scenario, energy demand of the residential sector grows at a CAGR of 1.2 per cent from 230 Mtoe to 258 Mtoe between 2021 and 2031. The energy demand of traditional biomass is 173 Mtoe in 2021 and 151 Mtoe in 2031. The final energy demand of electricity and natural gas increases in the residential sector whereas the final energy demand from traditional biomass reduces gradually as a transition happens from the reference to the ambitious scenarios.
Commercial SectorFigure 22 shows final energy demand in commercial sector for the four scenarios. The share of petroleum products is dropping and of natural gas is increasing in the POL and AMB scenarios as compared the REF scenarios between 2021 and 2031. The share of petroleum products decreases from 27 per cent in the REF scenario to 23 per cent in the AMB-2 scenario in 2031. The share of natural gas increases from 2.9% in the REF scenario to 8.8% in the AMB-2 scenario in 2031. In 2015, total energy demand was 22Mtoe and almost 70 per cent of it was coming from electricity. In the REF scenario, energy demand of the commercial sector grows at a CAGR of 8.5 per cent from 38 Mtoe to 86 Mtoe between 2021 and 2031. The energy demand of petroleum products is 11 Mtoe in 2021 and 23 Mtoe in 2031. In the POL scenario, energy demand of the commercial sector grows at a CAGR of 8.6 per centfrom 37 Mtoe to 84
Mtoe between 2021 and 2031. The energy demand of petroleum products is 10 Mtoe in 2021 and 22 Mtoe in 2031. In the AMB-1 scenario, energy demand of the commercial sector grows at a CAGR of 8.4 per cent from 37 Mtoe to 82 Mtoe between 2021 and 2031. The energy demand of petroleum products is 10 Mtoe in 2021 and 20 Mtoe in 2031. In the AMB-2 scenario, energy demand of the commercial sector grows at a CAGR of 8.1 per cent from 37 Mtoe to 81 Mtoe between 2021 and 2031. The energy demand of petroleum products is 10 Mtoe in 2021 and 18 Mtoe in 2031. Within the commercial sector, the demand for electricity and petroleum products reduces as one transits from reference to the ambitious scenarios. The demand for natural gas increases in the commercial sector owing to a transition from the reference to the ambitious scenarios.
Figure 21: Final energy demand by the residential sector, across scenarios (Mtoe)Source: TERI MARKAL Model Results
Figure 22: Energy demand of the commercial sector, across scenarios (Mtoe)
Source: TERI MARKAL Model Results

32 Green Growth and Sustainable Development in India
AgricultureFigure 23 depicts the final energy demand of the agriculture sector by fuel, and across scenarios. The share of petroleum products is dropping and of electricity is increasing in the POL and AMB scenarios as compared to the REF scenarios between 2021 and 2031. The share of petroleum products decreases from 37 per cent in the REF scenario to 29 per cent in the AMB-2 scenario in 2031. The share of electricity increases from 63 per cent in the REF scenario to 71 per cent in the AMB-2 scenario in 2031. In 2015, total energy demand was 31 Mtoe of which 58 per centwas coming from electricity and rest 42 per cent was from petroleum products. In the REF scenario, energy demand of the agriculture sector grows at a CAGR of 3.4 per cent from 42 Mtoe to 60 Mtoe between 2021 and 2031. The energy demand of petroleum products is 17 Mtoe in 2021 and 22 Mtoe in 2031. In the POL scenario, energy demand of the agriculture sector grows at a CAGR of 1.8 per cent from 41 Mtoe to 49 Mtoe between 2021 and 2031. The energy demand of petroleum products is 16.5 Mtoe in 2021 and 15 Mtoe in 2031. In the AMB-1 scenario, energy demand of the agriculture sector grows at a CAGR of 1.5 per cent from 39 Mtoe to 46 Mtoe between 2021 and 2031. The energy demand of petroleum products is 15 Mtoe in 2021 and 13 Mtoe in 2031. In the AMB-2 scenario, energy demand of the agriculture sector grows at a CAGR of 1.2 per cent from 38 Mtoe to 42.5 Mtoe between 2021 and 2031. The energy demand of petroleum products is 14 Mtoe in 2021 and 12 Mtoe in 2031. This happens due to greater deployment of fuel efficient tractors. It also happens owing to replacement of more and more diesel pump sets by efficient electric pump sets over the years. All the above sectoral interventions in the reference, policy, and two ambitious scenarios also bring about a change in the CO2 emissions in the country. Pattern of the change in import dependence and emission intensities across the scenarios is indicated below in the next section.
Energy Import DependenceImport dependence of coal, oil, and gas, in 2015, was 23 per cent, 76 per cent, and 21 per cent,respectively(Figure 24). Import dependence of coal goes down from 42 per cent in the REF scenario to 23per cent in POL scenario, 19 per cent in AMB-1 and to 15 per cent in the AMB-2 scenario in 2021. In 2031, import dependence of coal goes down from 68 per cent
in the REF scenario to 44 per cent in POL scenario, 24 per cent in AMB-1 and to 22 per cent in the AMB-2 scenario (Figure 24). Import dependence of oil goes down from 85 per cent in the REF scenario to 80 per cent in POL scenario, 75 per cent in AMB-1 and to 73 per cent in the AMB-2 scenario in 2021. In 2031, import dependence of oil goes down from 92 per cent in the REF scenario to 88 per cent in POL scenario, 84 per cent in AMB-1 and to 82 per cent in the AMB-2 scenario (Figure 24). Import dependence of gas increases from 23 per cent in the REF scenario to 31 per cent in POL scenario, 37 per cent in AMB-1 and to 43 per cent in the AMB-2 scenario in 2021. In 2031, import dependence of gas increases from 25 per cent in the REF scenario to 49 per cent in POL scenario, 60 per cent in AMB-1 and to 70 per cent in the AMB-2 scenario (Figure 24).
Figure 23: Energy demand of the agriculture sector, across scenarios (Mtoe)
Source: TERI MARKAL Model Results
Figure 24: Import dependence of coal, oil and gas across scenarios
Source: TERI MARKAL Model Results

33Energy and Development
Therefore, change in import dependency creates an impact for the energy security scenario of the country and the corresponding foreign exchange earnings and fiscal deficit of the country (Celine, Hallegatte, Crassous2013). Therefore broadly, the import dependence of gas increases whereas import dependence of coal and oil goes down as there is a transition from reference to ambitious scenarios.
Energy-Related CO2 EmissionsAs indicated in Figure 25, energy-related CO2 emissions increase from 2.1 billion tonnes in 2013 to 4.9 billion tonnes in the REF scenarioof 2031. In 2031, the energy-related CO2 emissions drop from 4.9 billion tonnesin the REF scenario to 3.7 billion tonnes in the AMB-2 scenario in 2031.
Figure 25: Scenario-wise energy related CO2
emissions (Million Tonnes)Source: TERI MARKAL Model Results


4
A variety of green growth and development related intervention measures as part of the policy discourse at a broader national level in India will be implemented through a series of schemes. Some of these schemes will be linked to the industry, agriculture, and services sector. The schemes which are related to autonomous energy efficiency improvement in the industry sector can have an impact on the net energy intensity of the demand side (as mentioned in Table 12earlier). Measures related to natural resource management can improve agricultural productivity—initiatives and actions for promoting the SME sector economic output can lead to skilled and unskilled job creation in SME and other sectors of the economy, including services segment can have a positive impact on the developmental indicators like poverty rate. Within the agriculture sector, green growth and development measures could be implemented through interventions that promote soil and water conservation measures. For the industry sector, it can entail promotion of renewable energy usage and penetration of green buildings within construction segment of the service sector as the economy grows. Broadly, therefore, it will enable the creation of a green infrastructure while the country grows in its long-term economic growth path. Hence, with this precursor, the next section highlights on the narrative of green infrastructure and thereafter moves onto the detailed findings of the modelling analysis. Through initiatives like the Mudra Bank, the government is already giving thrust to the SME sector as the latter has the potential to generate more jobs (close to 12 crore people with an investment of `20,000 crores) and skill creation. Growth of the SMEs and the informal economy as an integral component of the green growth and development-related intervention measures can therefore enhance the income of the marginalized sections of the society and reduce inequality through job and skill development. This can therefore reduce the poverty rate of the economy. Easy access of credit to these people of the informal economy [as also evident in the government’s latest declaration in the Micro Units Development Refinance Agency (MUDRA) scheme] along with the green growth and development interventions will reduce the inequality levels further and make the green growth and development process more inclusive. The macro-level analysis included a social accounting matrix based dynamic recursive CGE (Computable General Equilibrium) model comprising of sectors like agriculture, horticulture, renewables, industry, green building, services, etc. Structural changes within the economy through several green growth and development oriented scheme-wise intervention measures have been captured through the national level dynamic CGE model. The econometric elasticity estimates of these interventions have been included as scenarios in the dynamic national level CGE model. This further indicated the future predicted pathways for each of the sectors. Hence, through the national level dynamic CGE modelling that includes the econometric estimates of the schemes as scenario multipliers, predicted, ideal planned monetary allocations, for each of the schemes, for the years 2021, 2031, 2041, and 2051 have been estimated. Moreover, at the national level, impact of structural changes in key energy consuming sectors like industry and transport on economic, developmental, and energy security domains of the country is carried out. Impact of green growth interventions on income inequality levels of rural and urban households affects the level of
Development and Macro-economic Implications of Green Growth
36 Green Growth and Sustainable Development in India
literacy rates amongst them and hence impacts their future quality of life. Therefore, the impact of national level green growth and developmental intervention measures on the inequality level has been analysed. The inequality level has been measured by “Foster–Greer–Thorbecke Function” (which is parameterized with a welfare parameter) index which assesses income distribution across household classes and hints about the developmental, welfare implications of green growth and developmental interventions on rural and urban household classes. In order to come up with predictions of these intervention measures on the future, a Social Accounting Matrix (SAM)-based recursive dynamic CGE model has been developed at the national level (applying an updated social accounting matrix consisting of sectors like agriculture, horticulture, renewables, green buildings, services, etc., by using the 2007–08 input output matrix of Ministry of Statistics and Programme Implementation). The social accounting matrix comprises of sub-sectors in agriculture like paddy, wheat, horticultural crops, etc., and it also comprises of total ten household classes, viz., five rural and five urban household classes. In the national level dynamic CGE model, for considering some of the structural changes of the industry, transport sector, and for including sustainable natural resource management measures (which includes measures pertaining to the schemes dealing with soil, water conservation, crop diversification, resource and material efficiency, better irrigation practices, etc.) within the agriculture sector, the following set of assumptions have been taken:
ApproachNatural resource management intervention scenario has been included for the agricultural sector of the SAM. The SAM which has been used in the national level recursive dynamic CGE model comprises of paddy, wheat, horticulture, forestry, and logging segments of the Indian economy from the agriculture sector. Four national level scenarios have been considered which included, base line (REF), Policy (POL), Ambitious 1 (AMB-1), and Ambitious 2 (AMB-2). Such sector-specific scenarios assist in guiding the nature of the future energy demand and developmental domains for different levels of structural changes. The assumptions are summarized in Table 13.
Table 13: Scenario matrix of CGE model
Theme Gross Domestic Product at factor
cost
Sectoral Growth Rate
Population growth rate Inequality index (Foster Greer Thorbecke Index)
Macroeconomic parameters
• The average economic growth stays within 5% - 7% between 2015 - 2050
• This matches with the latest IMF predictions of an average economic growth of India at 5.7% between now and till 2050
• Average growth rate of agriculture stays around is around 3% - 4% between 2015 – 2050 considering the historical time series based business cycle of the developing country economies
• Industry sector share on an average stays within 25% - 33% in a reference situation till 2050
• Service sector share on an average stays at more than 52% till 2050 in Reference scenario
• Annual population growth rate of 1.2% till 2050 is considered to exist. It is validated with the World Bank Population projection growth rate which indicates a stabilization of population growth rate from 1.6% to 1.2%. The UN population growth indicates that the Indian Population will reach around 1.6 billion by 2050 and then it will drop and stabilize. The population projection assumption considered and incorporated in the CGE model is validated with World Bank and UN Population numbers and do not vary by more than 1% of neither World Bank or UN Population numbers.
• In creating the five rural and five urban income class inequalities, class specific population growth rate has been considered after downscaling it from the national level population projections
• The population projections are incorporated from outside in the national level recursive dynamic CGE model to understand how rural and urban inequality across classes changes with new income generation while the national population and the rural, urban income class specific population also grows in future

37Development and Macro-economic Implications of Green Growth
• For constructing the inequality index, the Foster Greer Thorbecke index method is used which captures changes in the distribution of the income from the mean income of a household class indexed by a welfare parameter
Assumptions
Reference Scenario
• Current trends in energy supply and demand sectors and soil & water conservation. • Earlier declared policies in the domain of natural resource management measures, resource efficiency
measures, renewable energy interventions, energy efficiency, conservation measures in the demand sectors like transport and industry, building sector are existing and implemented but the targets are partially achieved
• Development measures for improving the literacy rate, infant mortality rate, poverty alleviation follow the existing and earlier policy discourse and the targets of these measures are partially achieved
Policy Scenario • Declared policies and schemes related Current trends in energy supply and demand sectors and soil & water conservation are achieved.
• This includes an improvement in water usage in irrigation methods, larger switchover to less water intensive crops, introduction of fuel efficiency measures in the transport sector, enhanced railway infrastructure, larger access to electricity by rural population and improved energy efficiency and conservation measures in the industry, commercial and residential buildings through a complete achievement of the targeted goals of the declared policies
• Improvement of 1.25% in Autonomous Energy Efficiency in Industries and 1.25% improvement in the Autonomous Material Efficiency of the sectors of the economy in comparison to the REF Scenario
• Development measures for improving the literacy rate, infant mortality rate, poverty alleviation follow the existing and earlier policy discourse and the targets of these measures are completely achieved
• Achievement of these policies also brings a trade off in terms of an increase of fiscal expenditure by more than 5%
Ambitious Scenario (1 & 2)
• Measures over and above the declared policies and schemes related to energy supply and demand sectors and soil & water conservation are achieved.
• 1.5% improvement in Autonomous Energy Efficiency and Autonomous Material Efficiency in the AMB-1 scenario in comparison to the REF Scenario
• 1.75% improvement in Autonomous Energy Efficiency and Autonomous Material Efficiency in the AMB-2 scenario in comparison to the REF Scenario
• This includes an improvement in water usage in irrigation methods, larger switchover to less water intensive crops, introduction of fuel efficiency measures in the transport sector, enhanced railway infrastructure, larger access to electricity by rural population and improved energy efficiency and conservation measures in the industry, commercial and residential buildings through a complete achievement of the targeted goals over and above the declared policies and schemes
• Development measures for improving the literacy rate, infant mortality rate, poverty alleviation follow the existing and earlier policy discourse and the targets of these measures are completely achieved and it includes additional measures after completely achieving the targets of declared policies and schemes
• Achievement of these policies also brings a trade off in terms of increase of fiscal expenditure by more than 8%
Though the latest economic survey mentions of a double digit overall economic growth in the coming year, from a macro-business cycle perspective of a developing country economy, in certain years the economic growth will be within 5–8 per cent and on an average within the business cycle, that average growth rate will be less than 7 per cent in a long-term horizon (beyond 2030s). An average less than 7 per cent economic growth will mean an agricultural growth rate of around 3 per cent which emerges from historical perspective of economic growth path of different developing countries which are still agrarian and aspiring to transcend to the path of industrialization, complemented by high service sector growth rate. Therefore, on

38 Green Growth and Sustainable Development in India
an average, GDP growth rate of a little more than 6 per cent has been taken for the next two 12-year periods in the policy and ambitious scenarios. A scenario was constructed using the baseline run of the dynamic CGE model. Future predictions of GDP have been estimated through application of the baseline run of the dynamic CGE model. Further, the predictions have been validated by applying historical real data from 1985–86 to 2013–14. The data was calibrated and future GDP (in trillion USD) was predicted through calibrated time series analysis along with the data validation. Based on these set of assumptions, scenario (REF, POL, AMB-1, AMB-2) specific Indian GDP have been predicted. For each of the scenarios different FGT (Foster–Greer–Thorbecke) indices (separately for rural and urban areas) have been computed. FGT index shows the inequality in income distribution across rural and urban household classes indexed by a welfare parameter. This guides to measure the level of inequality, welfare among different classes in the society at a particular point of time. Predicted projections of the FGT index has also been estimated for three scenarios.
Implications for InequalityThis analysis shows how the household welfare behaves over a definite period of time, owing to a certain set of green growth and development paths, based intervention measures related to resource efficiency and efficient natural resource management. Involvements related to natural resource management, resource efficiency impacts productivity of the agricultural (e.g., paddy, wheat) and secondary sectors (e.g., industry) of the Indian economy. For every enhancement in productivity, output generation will increase. It has been explored whether a rise in the output along with income brings positive income distribution changes across household classes. Figures 26 and 27 show the projected trend of FGT indices under the three scenarios.
As shown in Figures 26 and 27, in the short term, there are certain adjustments that happen within the economy, owing to the structural changes emerging from the ambitious/aggressive measures due to which in the short term, inequality can go up for ambitious scenario vis-à-vis the policy scenario. However, both for policy and ambitious scenario, the inequality levels go down from the REF scenario level. In the long term, however, inequality levels go down in the ambitious scenario in comparison to the policy scenario. Rural FGT index goes down from 0.19 in the Reference Scenario of 2031 to 0.08 in the Ambitious 2 Scenario of 2031. The Urban FGT Index drops from 0.34 in the Reference Scenario of 2031 to 0.30 in the Ambitious 2 Scenario of 2031. In order to understand the pattern in the movement of the rural and urban FGT indices over the time frame, the rural and urban population growth has been considered too. After incorporating the rise in the rural and urban population value over the time frame, average daily income per person for different rural and urban household income classes have been worked out for the REF, POL, AMB 1, AMB 2 scenarios.
Figure 26: Scenario-wise impact of green growth and development measures on rural inequality
Source: TERI CGE Modelling Estimates
Figure 27: Scenario-wise impact of green growth and development measures on urban inequality
Source: TERI CGE Modelling Estimates

39Development and Macro-economic Implications of Green Growth
This has been done to identify the relative position of the individual in each class (within rural and urban income classes) from the poverty line. It will also help us to measure whether an individual in a particular class will be able to cross the poverty line in future (if not already). If yes, then this analysis will help us to identify the exact time period by when this crossing over can happen after considering an average per day per capita income as a benchmark of rural and urban poverty line in India (which itself is debated for different normative reasons). Some of the key steps that have been followed as a part of this analysis are highlighted below in Box 4.
As per the modelling analysis, in the POL, AMB-1, and AMB-2 scenarios owing to natural resource management related green growth and development measures, the FGT index value goes down. Natural resource management and resource efficiency measures augment the productivity, enhance the output and income, and get distributed to the rural and urban household income classes owing to which the inequality measure of FGT index goes down. However, it also hints to a macro-planner, that to achieve this reduction in the inequality across household classes, the planner has to work with the implementor of the intervention measures on distribution measures of income within the rural and urban household classes of India. Therefore, this pertains more to the inter-household equity issues (Champernowne1974) of a country. If those distribution measures do not work, then this predicted ideal reduction (as emerging from the SAM-based dynamic CGE model) in inequality might not be realized. Long-term impacts of these policies on development are larger than the short-term measures as the trickling down of these measures takes time. Moreover, the large impact is realized in the long run as most of these measures create a tangible change in welfare and inequality through bringing a structural change which takes a long time to happen, owing to the institutional, infrastructure, and investment bottlenecks in the Indian economy. One of the illustrations of this bottleneck is evident in the fact that at a macro-level, public sector investment as a percentage of GDP has shrunk in the country post-2008 which calls for large public sector investments in the short run complemented by private sector investments in the long term beyond 2025. These impacts of the green growth and development intervention measures will only be realized when these investment, institutional, and infrastructure bottlenecks are reduced within the Indian macro-economy. However, the question is that if these bottlenecks are removed, does that mean that owing to some of these measures, can certain sections of the population cross the poverty line? An exploration to seek clarity to this question is attempted in the next section.
Implications for Development ParametersThe nature and degree of this impact on developmental indicators for different time frames (2007, 2021, 2031) is explained in Table 14. Further, the nature and degree of these impacts on the developmental indicators is compared with the findings of the expert group on Low Carbon strategies for Inclusive Growth (LCIG).
Box 4: Summary of Methodology
1. The study SAM provides us the base level (2011–12) total income for each of five classes in both rural and urban areas.
2. Based on the assumption that household income will grow at the same rate as GDP is growing, total income of a particular class was predicted assuming that the GDP growth will trickle down to the household.
3. It was assumed that each class will have income growth rate equal to growth rate of projected total population (as projected by The World Bank and validated matched with Indian Census Data).
4. Based on predicted GDP and population, per person average annual income has been calculated for each selected class.
5. From the above figures, daily average per person income was calculated for the selected class.6. Similar exercise was done for each of 5 income classes for both rural and urban areas. 7. An average per day per capita income has been chosen as the rural and urban poverty line after considering
the existing secondary literature.

40 Green Growth and Sustainable Development in India
As indicated in Table 14, green growth and development measures through agriculture and natural resource management techniques, structural changes within industry and infrastructure sector bring about a change in poverty by uplifting people currently below the poverty line. This happens because the income generated from these measures and new investments get distributed across the rural households. Inequality within the rural households goes down owing to that.
Table 14: Scenario-wise impact of green growth measures on developmental indicators
Indicator Units Baseline Reference Scenario
Policy Scenario
Ambitious-1 Scenario
Ambitious-2 Scenario
2011 2021 2031 2021 2031 2021 2031 2021 2031
Literacy rate (total) % of people ages 15 and above
69.30 71.25 79.61 77.34 80.29 79.45 86.85 85.00 89.55
Literacy rate (adult male)
% of people ages 15 and above
70.87 72.95 80.63 76.33 87.66 80.70 90.06 83.00 97.00
Literacy rate (adult female)
% of people ages 15 and above
50.27 53.09 60.55 55.91 61.50 57.43 64.90 60.13 67.23
Infant Mortality Rate (IMR)
under 5 (per 1000 live births)
47.70 35.60 14.90 34.11 13.41 32.97 12.96 29.65 9.10
Poverty millions of persons BPL
- 33.8 25.7 9.30 8.37 8.09 7.28 7.36 7.06
LCIG Report Poverty millions of persons BPL
- - 8 - 8 - -
LCIG Report IMR under 5 (per 1000 live births)
- - - - 14.8 - 14.8 - -
Number of additional skilled job creation
In lakhs - 27 35 61 70 63 74 68 79
Number of additional unskilled job creation
In lakhs - 14 19 24 29 26 31 29 38
Source: Modelling Estimates
A reduction in the inequality raises the aspirations of these people and they start striving for better education which gets reflected in the improved literacy rates for male and female for different scenarios over the time frame of 2021 and 2031 (Table 14).
Energy Demand and OutputHaving outlined this broad national level narrative on future energy security, demand, access, and developmental indicators from three scenarios (reference, policy, and ambitious) based green growth and development interventions, it is important to understand how a change in the energy demand impacts the broader macroeconomic outputs and how it further affects the sectoral energy demand in future. In order to do so,a feedback loop between National Level Dynamic CGE model and TERI MARKAL model has been established. Summary of the MARKAL CGE Integration exercise indicates in Table 15 that by 2030, there will be a scope of significant energy reduction (more than 30 per cent) in the major industrial sectors like petrochemicals, iron and steel, cement, brick, owing to an energy efficiency improvement of 5 per cent in these sectors in the AMB-2 scenario of 2031. This energy reduction potential of 2030 is with respect to the base level of 2007–08. In the residential segment of the energy demand, such scope of reduction lies mostly in the residential ACs and residential coolers. With the achievement of a higher renewable energy target, the energy reduction in these sectors increases. In addition to the industry and residential sector, the major scope of reduction also lies in the surface transport sector segment. If the energy efficiency improvements in industry sector are brought in without compromising on economic

41Development and Macro-economic Implications of Green Growth
outputs and employment creation, it can lead to large economic gains in terms of enhanced outputs for the country as well by 2030 (Table 16).
Table 15: Fall in Energy Demand in Major Energy Consuming Sectors in comparison to the base year 2007–08
2015 2021 2031
REF POL AMB-1 AMB-2 REF POL AMB-1 AMB-2
Industry 7.24% 9.25% 11.25% 13.26% 17.27% 15.89% 20.91% 25.93% 31.14%
Petrochemicals 7.20% 9.19% 11.19% 13.18% 16.17% 16.99% 21.46% 25.94% 30.42%
Soda Ash 1.98% 2.53% 3.08% 3.63% 4.88% 3.18% 4.91% 6.65% 8.38%
Aluminium 2.01% 2.55% 3.11% 3.66% 4.91% 4.77% 5.99% 7.22% 8.44%
Iron Steel 8.24% 9.25% 11.25% 13.26% 16.17% 17.27% 21.72% 26.16% 30.60%
Cement 7.22% 9.22% 11.22% 13.22% 16.22% 17.22% 21.65% 26.09% 30.52%
Brick 4.79% 6.12% 7.44% 8.77% 10.30% 11.64% 14.51% 17.38% 20.25%
Res AC 7.25% 9.26% 11.26% 13.27% 15.38% 18.12% 22.29% 26.47% 30.64%
Res Coolers 7.26% 9.27% 11.27% 13.28% 15.79% 14.19% 19.75% 25.21% 30.67%
Res Fans 7.14% 9.12% 11.09% 13.07% 16.05% 17.02% 20.72% 24.41% 28.11%
Surface Transport
7.22% 9.22% 11.22% 13.22% 15.22% 17.30% 21.71% 26.12% 34.53%
Agriculture 0.85% 1.28% 1.34% 1.40% 1.70% 1.84% 2.20% 2.26% 2.32%
Commercial 0.59% 0.61% 0.82% 0.87% 1.02% 0.68% 0.99% 1.35% 1.56%
Source: Modelling Estimates
Table 16: Increase in Output of the Sectors in comparison to the base year 2007–08
2015 2021 2031
REF POL AMB-1 AMB-2 REF POL AMB-1 AMB-2
Industry 8.24% 11.81% 14.28% 16.74% 19.20% 19.03% 26.86% 34.68% 42.51%
Petrochemicals 14.24% 19.66% 22.47% 25.27% 28.07% 34.06% 45.39% 56.71% 68.04%
Soda Ash 9.87% 12.85% 15.55% 18.24% 20.93% 20.25% 28.89% 37.54% 46.19%
Aluminium 9.43% 15.72% 16.72% 17.87% 20.01% 25.45% 32.22% 39.00% 45.77%
Iron Steel 7.48% 12.72% 13.72% 14.64% 16.56% 19.86% 25.83% 31.80% 37.77%
Cement 8.93% 13.75% 14.75% 16.14% 18.52% 20.64% 29.42% 38.20% 46.98%
Brick 8.61% 13.69% 14.69% 16.07% 18.44% 21.03% 27.62% 34.21% 40.80%
Res AC 4.35% 5.33% 5.83% 6.18% 7.03% 9.46% 11.90% 14.33% 16.76%
Res Coolers 17.33% 26.67% 27.67% 30.68% 34.68% 39.58% 44.49% 49.39% 54.29%
Res Fans 16.63% 26.83% 27.83% 30.85% 34.87% 40.97% 47.06% 53.16% 59.25%
Surface Transport
7.20% 9.40% 11.00% 12.61% 14.21% 17.53% 22.17% 26.82% 31.47%
Agriculture 2.65% 6.95% 6.96% 7.12% 7.29% 7.47% 7.65% 7.83% 8.02%
Commercial 1.94% 3.78% 3.78% 3.87% 3.96% 4.06% 4.16% 4.26% 4.36%
Source: Modelling Estimates
Implications of Carbon TaxGiven that carbon dioxide emissions will go down, owing to energy efficiency improvements in the industry sector, can a carbon tax be thought to be implemented as an alternative measure? Imposition of carbon tax can reduce the output

42 Green Growth and Sustainable Development in India
too though it can reduce the emission levels of the economy. Therefore, the impact of such a carbon tax on GDP also needs to be envisaged vis-à-vis its impact on emissions. In an ideal CGE-based prediction for an imposition of a USD 1 carbon tax, the GDP goes down. If a GDP path starts from a little more than USD 0.5 trillion in 2007, USD 2.1 trillion in 2015 to USD 2.92 trillion by 2021 in REF Scenario, then owing to an imposition of a USD 1 per tonne of CO2. the GDP value can reach close to USD 2.5 trillion in the AMB-2 scenario of 2021 and from USD 3.7 trillion in REF scenario of 2031 to USD 3.37 trillion in the AMB-2 scenario of 2031(Figure 28). As it emerges, a carbon tax implementation can reduce the GDP. However, a carbon tax may supplement public revenues that can then be directed towards environmental activities. From a developmental perspective, implementing this measure on a large scale will need a more detailed examination.
Investment RequirementsOnce all the supply and demand side green growth and development interventions in the domain of natural resource management, energy efficiency, and renewable energy resource supply are undertaken, it can lead to a rise in the gross investments as a percentage of GDP at factor cost from 3.28 per cent in the REF scenario of 2021 to 4.67 per cent in the REF scenario of 2031. In the POL scenario of 2031, this can rise up to 7.95 per cent and further in the AMB-1 and AMB-2 scenarios, it can increase to 11.23 per cent and 14.52 per cent, respectively (Figure 29).
Autonomous Energy Efficiency ImprovementThrough an improvement in the autonomous energy efficiency in the industry sector, the energy consumption of the industry sector can go down. An increase in the autonomous energy efficiency can reduce the total energy consumption in from 699.71 Mtoe (in the REF scenario of 2031) to 629.93 Mtoe in the 1.25 per cent AEI improvement scenario of 2031. In 1.5 per centand 1.75 per cent AEI improvement of 2031, it can further reduce to 560.15 Mtoe and 490.37 Mtoe (Figure 30).
Figure 28: GDP pathway (USD trillion) in case of a carbon tax for key emission
intensive industriesSource: Modelling Estimates
Figure 29: Cumulative investment projections for green growth interventions (% of GDP)
Source: TERI CGE Model Results
Figure 30: Scenario-wise industrial sector energy consumption (Mtoe)
Source: TERI CGE Model Results

5
CoalFrom the above modelling exercise, there is no denying that coal will remain as the major source of energy. It is clear that India is and will remain dependent on thermal, and mainly coal, power plants for the foreseeable future. Coal demand by power sector and coal imports, both are expected to increase in the near future. The domestic coal production would therefore require keeping pace with the power sector, or otherwise there will be higher coal imports and its adverse impact on the economy.• The thermal plants which use coal also need to undergo massive technological changes if they are to remain sustainable.
Technological change will need a regulatory push since the capital costs of setting up plants with up-to-date technologies are far higher as compared to a subcritical plant. Therefore, the government needs to look into options such as providing tax holiday to plants with newer technologies, jointly funded exercises via PPP, putting in place regulations that pass on the costs to the consumer in the medium term, among others. This kind of exercise (especially the last option) will be unpalatable politically, but precedence has already been set in countries such as Germany and India, which could look to adopt similar measures. Adopting clean coal technologies will be an expensive proposition (especially IGCC) right now, but in the long run capital costs are expected to fall as scale economies are achieved. A clean coal technology roadmap is shown in Annexure 2.
• An important aspect would be to slowly retire older subcritical plants rather than expediting renovation and modernisation (R&M) measures. It is also necessary to increase the number of coal washeries. Coal washing helps removal of ash, sulphur, and other impurities and also results in lowering the carbon footprint. Moreover, mining technology in India needs to undergo a shift since pollution from opencast mining is a lot more vis-à-vis underground mining. This will need a regulatory push as opencast mining is more cost efficient for coal companies.
• Another area where energy efficiency can be improved would be transportation. Coal supply via railways continues to remain the cheapest mode of transportation. However, freight transportation is not very efficient in India as compared to other countries. For example, Indian wagons have a net gross ratio of 73 per cent which is significantly lower than the world’s best of 85 per cent (NTDPC 2013).
• In India, though research & development for clean coal technology started quite some time back, efforts remain sporadic, lacked focus, and had no time bound roadmap for the sector. Due to this, the developments in India have been much slower than the global efforts. The implementation of a comprehensive roadmap for technology pathways those are relevant to India is now essential for streamlining research efforts and prioritizing technologies considering the limited financial resources. The successful implementation of technology roadmap needs development of coherent policies and strong inter-linkages between industry, academia, and government bodies. It is also important to note that there is no clear technology winner, as of now, for clean power generation and separate approaches need to be adopted for short-, medium-term goals, and long-term targets. But at the same time, global technology developments need to be monitored closely with international linkages and technology collaborations.
The Road Ahead

44 Green Growth and Sustainable Development in India
Oil and GasMeasures that directly aim to reduce emissions and lead to better resource management in the oil and gas sector become important.• In the short run, firstly, the disclosure of energy usage and carbon emissions should be made mandatory across the
sector. This would lead to greater clarity and public awareness of the issue, which can further facilitate policy action in the future. Secondly, E&P contracts should include incentives for energy saving in operations. In particular, there ought to be fiscal arrangements in the form of tax incentives to encourage the reduction of associated gas flaring. Thirdly, in the midstream segment, a roadmap which plans an integrated fuel transport policy must be created. This document should, in particular, focus on a pipeline network where viable, and lay out a roadmap for the implementation of such a network in the medium run. Fourthly, natural gas imports should be streamlined to ensure affordable and consistent LNG supplies to the industry and power gas-based power plants. Fifthly, in the refining segment, Solomon Energy Efficiency Index can be applied as a measuring standard that would help policymakers set reasonable energy use reduction goals in the medium and long run. To begin with, reporting efficiency according to the guidelines of such an index may be promoted. Finally, in order to promote biofuel usage, pricing, and taxation related bottlenecks must be addressed.
• In the medium run, firstly, when it comes to associated gas flaring, the government can go one step further, by mandating mandatory cuts in associated gas flaring, in line with the World Bank Global Gas Flaring Partnership recommendations. Secondly, oil and gas companies may be encouraged to invest in the renewables sector through CDM projects. The goal could be to ensure at least as much renewable energy production as the sector consumes itself in the extraction and processing of hydrocarbons. Thirdly, to facilitate energy efficient fuel transport, the railway freight corridor network currently being constructed between the metro cities may be expanded as and where capacity permits. Fourthly, in the downstream segment, refineries must be mandated to cut emissions, as measured by the efficiency indicators. Fifthly, on the consumption side, a Green Gas Quadrilateral must be created by setting up natural gas pumps along the Golden Quadrilateral highways in order to promote the use of gas as a transport fuel. Sixthly, universal rural electrification must be pursued to reduce kerosene use for lighting purposes. Finally, necessary infrastructure to ensure the uptake of electric vehicles must be pursued.
• In the long run, firstly, necessary physical and technical infrastructure should be created to commercialise associated natural gas that would otherwise be flared. Secondly, as and where viable, secure transnational pipelines may be pursued to ensure energy efficient import of natural gas. Thirdly, the Green Gas highway network should be expanded to inter-state highways, where capacity permits. Finally, LPG subsidies may be reduced and rationalised, and electricity as a cooking fuel may be promoted.
• Such policy measures could create a framework that would lead to greater energy efficiency within the oil and gas sector. Annexure 3 depicts a roadmap for the oil and gas sector.
Renewable energy• India targets an installed renewable energy capacity of 175 GW by 2022. Around 100 GW of this is to come from solar
power, 60 GW from wind energy, 10 GW from small hydro power, and 5 GW from biomass-based power projects. • For wind energy, there needs to be development of high efficiency wind turbines that can produce higher amounts of
electricity in low wind regime (this is mostly the case for Indian wind potential sites). For solar plants, efforts need to focus on increasing the level of efficiency, inverter quality, lowering costs, addressing non-surety of crystalline vs. thin film, etc. There needs to be a focus on developing appropriate energy storage solutions. Energy storage helps to accommodate large scale renewable energy injection by addressing issues such as uncertainty of output and variability. It can utilize excess renewable energy produced during off peak demand period and can provide this energy during peak hours.
• To achieve low cost manufacturing and therefore lower capital costs, and to capitalize on its inherent advantages in the solar sector, India needs to consider revamping and upgrading its solar R&D and manufacturing capabilities. In

45The Road Ahead
this regard, the government may consider promoting a core company to produce wafer and silicon that will enable substantial reduction in the costs of solar technologies.
• The government must formulate a comprehensive policy or action plan for all-round development of the sector, encompassing all the key aspects. An action plan must be prepared in consultation with state governments. It is understood that the Energy Coordination Committee (ECC) has approved the preparation of an umbrella renewable energy law to provide a comprehensive legislative framework for all types of renewable energy technologies, their usage, and promotion. However, the government has fixed no timeframe for the formulation and enactment of such a law and thus it must expedite this task and ensure that the desired law be enacted quickly.
• While setting state-wise RPOs, there must be a standardised RPO target formulation; with a standard procedure applied across states to determine the targets. The underlying principles and approach in breaking down the national RPO target into state-wise RPOs can consider factors, such as GDP or financial health, renewable resource potential, and consumer profile of the state, etc. These targets should then be made mandatory and enforced. SERCs should be responsible for monitoring annual compliance with RPO targets by state distribution utilities; penalty mechanisms should be introduced as a deterrent for non-compliance.
• A number of states do not allow the procurement of renewable energy-based power from outside the state. This is an artificial barrier in the way of renewable based power generation and investment across the country. Instead, regulators can identify ways and means of selling this power to neighbouring states that are short on renewable energy resources or through RPOs at a mutually agreed upon rate.
• Renewable energy forecasting is required for grid security. However, due to lack of quality data and insufficiently developed forecasting tools, accurate renewable energy forecasting is difficult. Renewable energy forecasting for wind and solar power is critical for large scale grid-integration of renewable energy. Currently, scheduling is required for wind power projects but developers are opposing this due to possible penalties that may be imposed due to deviations from schedule. The Government must look into removing penalties in the initial stages, until forecasting tools become sufficiently advanced. Significant amount of generation integration will depend on the accuracy of the forecast.
• Investments must be made to support infrastructure and renewable energy evacuation should be accorded high priority. Grid connectivity to renewable energy generation should be provided by state transmission utilities. Transmission system plans prepared by STUs should cover evacuation and transmission infrastructure requirements for renewables.
• There is a greater need for co-ordination and consultation between the state transmission utility and the nodal agency, responsible for development of renewables at the state level, for the development of transmission infrastructure for renewable energy projects that are in the process of being allotted or developed or are likely to be bid out in the near future.
• To absorb higher renewable energy, short-distance intra-state transmission network as well as Renewable Energy Certificates (REC) mechanism needs to be strengthened. There should also be a focus on setting up long inter-regional corridors in RE rich states as better integration of high renewable energy penetration would require balancing at the regional and national levels.
• There is an urgent need for technical assistance programmes designed to increase the planning skills and understanding of renewable energy technologies by electricity utilities, regulators, local and municipal administrations, and other institutions involved. Information specific to viable technology options needs to be made easily accessible, both to increase general awareness and acceptability as well as to aid potential investors and sponsors of such projects.
• A common policy direction at the Central and State levels needs to be strengthened. Some issues regarding realization of FIT (feed-in tariff) related revenue by the independent power producers can also be noticed in certain States. Thus, if the renewable energy sector has to be promoted as a part of the national level green growth and development strategy in the country, then these issues have to be sorted out immediately.
• There is a need to fast track the renewable energy sector investments in India as they are currently miniscule in comparison to the global investments in the renewable energy sector. A stable, consistent policy framing (going beyond the political cycles of the economy) is required to attract substantial investments within the renewable energy sector.

46 Green Growth and Sustainable Development in India
• Inadequate grid infrastructure is a key issue that needs to be addressed urgently. Across most of the states with significant RE potential, the grid does not have sufficient spare capacity to be able to evacuate increasing quantum of RE electricity. A comprehensive programme to introduce smart grid will realize lots of benefits, including better forecasting of demand and supply through centralized as well as decentralized power sources (renewables) with better grid stability. Public-Private Partnership (PPP) model can be the cornerstone of infrastructural development where there will be a sufficient cushion to large scale private investment.
• Regulatory support is key for promotion of the renewable energy sector as a part of the green growth and development strategy of the country. CERC (Central Electricity Regulatory Commission) issues guidelines for determining the feed-in-tariff for renewable energy based power generation and these are applicable to central government power generating stations and those who transmit power in the inter-state corridor. However, this is applicable to a very small number of power producers and the vast majority is still covered by the tariff determined by the SERCs.
• The power tariff determined by the SERCs may or may not be equivalent to that of CERC tariffs. Also, tariffs remain fixed for a longer control period (even when the risks of project development in terms of cost escalations have gone up); this could impact the returns for new projects commissioned under this tariff regime and negatively impact new project development activity. In FY 2011–12, some of the state utilities delayed FIT (feed in tariff) payments to wind power generators by over a year. This can adversely affect investor confidence in the sector. Hence, a uniform regulatory framework and better incentive structures and execution mechanisms can promote the renewable energy sector and facilitate the green growth and development path in the country.
Power• Power sector utilities that have been allocated captive blocks should be advised to enhance their production through
some incentive oriented strategy and surplus production after meeting their own requirement may be supplied to power stations. In order to ensure the availability of coal to the power plants, the Ministry of Power has undertaken some measures. However, there still exists a strong need to develop a sustainable strategy to ensure coal supply to power plants in the long term. There is also an urgent need to strengthen the logistics for coal movement and transmission infrastructure for gas to ensure reliable fuel supply to thermal power plants.
• The designing of the standard bidding documents should account for factors, such as fuel price hikes, providing sufficient security on project assets to the lenders and clearance delays that are beyond the control of developers. In view of the increasing requirement of capacity addition to meet the demand, the capacity for manufacture of main plant equipment has to be increased with the formation of several JVs for manufacture of main plant equipment in India.
• Higher deployment of advanced technologies, such as the Thyristor Controlled Series Compensation (TCSC), High Surge Impedance Loading (HSIL) lines, High temperature high capacity conductors, multi-circuit towers, mono pole towers etc. is essential to optimize rights-of-way (RoW) and enhance the power transfer capability of existing and new transmission lines.
• With scarce land availability there is a growing need for reduction of land area used for setting up of transmission systems. The PGCIL has established state-of-the art Gas Insulated Substations (GIS) which requires less space (about 80 per cent reduction) i.e., 5–6 acres as compared to conventional substation which generally requires 30–40 acres areas.
• Increase in the transmission system at higher voltage levels and sub-station capacities to support transmission network to carry bulk power over longer distances and at the same time optimize right of way, minimize losses, and improve grid reliability.
• There is an urgent need to have a strong transmission and distribution system, to cope with the dynamic requirement. Therefore, strengthening of inter-state and inter-regional transmission capacity for optimum utilization of available power is necessary. It is essential to encourage the use of modern project management tools, followed by timely monitoring and corrective actions to avoid delays and the consequential losses.
• Transmission development should be done in a phased manner to avoid the bottling up of power. It is, therefore, imperative to establish sound project management principles for the sector to help ensure timely completion of projects commensurate with generation/load growth.

47The Road Ahead
• To enable the turnaround of the State DISCOMS and ensure their long-term viability, a scheme for financial restructuring of state-owned DISCOMS has been notified by the Government of India. The scheme contains measures to be taken by the state-owned DISCOMS, lender banks, and state governments for achieving financial turnaround by restructuring their debt with support through a Transitional Finance Mechanism by the Central Government. However, the proposal to restructure debt of state-owned DISCOMS will only be a short-term solution and for the restructuring package to yield results. It has to be supported with regular tariff hikes, timely and adequate financial support by the state governments, and better regulatory process and disclosures.
• In order to enable a unified approach by Financial Institutions (FIs)/banks for funding state distribution utilities, the Ministry of Power (MoP) has developed an integrated rating methodology for state distribution utilities. The overall objective of the integrated rating methodology is to devise a mechanism for incentivizing/ disincentivizing the distribution utilities so as to improve their operational and financial performance, enable regulatory compliance, and influence respective state governments to fulfill commitments on subsidy, equity support, including transition funding support to achieve self-sustaining operations.
• The long-term measures, such as elimination of the gap between revenues and cost of electricity supplied, reduction in distribution losses, and automatic pass-through of fuel costs will enhance the profitability of operating in the sector.
• Since the financial viability of the power sector as a whole depends on the revenues collected at the distribution end, it is vital that the distribution system is made financially viable. This can be made possible by improving the operational performance by achieving 100 per cent metering (metering of feeders, distribution transformers and consumers), to achieve 100 per cent billing/collection efficiency and to reduce the commercial losses. The Government of India approved Restructured Accelerated Power Development and Reforms Programme (R-APDRP) in 2008 with the focus on a positive performance in terms of AT&C loss reduction recognized the critical need for distribution reforms. This includes preparation and validation of base-line data, establishment of IT applications for energy accounting and auditing and strengthening of distribution and transmission systems. The Indian government has proposed to continue the R-APDRP during the Twelfth Five YearPlan and the completion period for Part A extended by another two years for all states for conversion of loan into grant.
• The Act and the policies require the Regulatory Commissions to ensure that the tariff progressively reflects the cost of supply. High level of cross subsidy is not desirable as it discourages competition and efficiency in operation. Therefore, it is essential to rationalize the tariff in a time bound manner.
• SERCs should mandatorily consider appropriate tariff interventions (like Time of Day tariff, incentive for energy efficient buildings/appliances, etc.) to support DSM. This should also be supported by institutionalizing energy efficiency in the organizational structure of distribution utilities and providing special measures for promoting energy efficiency in pumping groundwater for agricultural use since DSM and energy conservation are as important as capacity addition to tide over shortage.
• It is essential to have a reasonable cross-subsidy surcharge and additional surcharge for the open access as the new capacities are being set up in different states. Although the introduction of open access has been mandated in the Electricity Act 2003, there has been reluctance in the states to give freedom to the customers, having requirement of 1 MVA and above, to choose their own sources of supply. This should be expedited so that power markets are broadened and developed.
• Competition in the distribution sector needs to be enhanced by issuing parallel distribution licensees in select areas and implementing open-access regulations.
• Rise in demand, fuel price volatility, and high levels of carbon emissions underline the need to manage demand in different consumer categories in the power sector. Introducing demand side management (DSM) programmes for market transformation through effective and lucrative price incentive schemes; conducting behavioural studies to understand consumption patterns of consumers; and organizing awareness campaigns for all stakeholder categories, would be useful for power sector development.
48 Green Growth and Sustainable Development in India
Nuclear• For a fuel constrained nation like India, every option for energy needs to be exploited. For strategic reasons as well, it is
difficult to assume a complete withdrawal from nuclear power. However, social costs should also be taken into account. • Financial, administrative, and, most importantly, statutory independence is absolutely essential for the regulator. To
some extent, this will be achieved by the ‘Nuclear Safety Regulatory Authority Act’ draft legislation that was tabled in the Parliament in September 2011. This will help with statutory independence. However, the respective debate and decision need to be expedited. Specific and published timelines should be set up to look into and implement the CAG recommendations. Regular reviews like the one conducted by the CAG as well as the international peer review and appraisal by the IAEA (also recommended by the CAG) should also be undertaken. A transparent and efficient regulator, which is also perceived as one, will help build greater confidence about the establishment and perhaps about the technology as well.
• A distinction has been made between the civil and defence use of nuclear energy. However, this distinction needs to permeate in the activities as well. One of the widely talked points in the nuclear sector recently has been the lack of transparency. A detailed engagement and clause by clause clarification of the liability laws should also be done to dispel any apprehensions both domestically and internationally as well as to make the government’s position more clear.
• A public communications strategy that involves local and regional people and local businesses and organizations in the decision-making process is essential. There are good examples of public engagement best practices and strategies followed in different countries. For instance, Finland follows a pre-defined timetable based on step-wise decision making process for establishing a nuclear power plant. More significantly, the decision making process takes into account local views and gives the municipality, where a power plant could be located, a veto power as well. The Environmental Impact Assessment (EIA) forms a critical part of the process which aims to take into account both positive and negative opinions of the stakeholders.
• The Indian nuclear industry has been functioning under enforced isolation for many years. Opening up of this sector will require simultaneous reforms and strengthening of laws governing and affecting related industries as well. This should be done not only to promote investments but also to protect domestic interests. Strengthening this sector is especially important in the light of the specificities of India’s position in the world nuclear industry.
• For instance, in case of the insurance industry, the capacity of domestic insurance companies to insure a nuclear power plant; the requirement for independent inspection of such a plant by insurance companies and the possible conflict therein, etc., should be taken into account and laws to facilitate them should be expedited.
• The government needs to undertake a social cost-benefit analysis and evaluate the extent of damage possible in the worst-case scenario taking into account the seismicity of a region, propensity to natural disasters, and unforeseen incidents. This forms a part of the design-basis of a plant but the possible impact of multiple systems failure on the people around also needs to be considered. The methodologies and assumptions and the results of such an assessment, should be made public (Srinivasan, Rethinaraj, & Sethi, 2012). Each fuel source has risks associated with it but a comparative assessment helps understand the choices. Such an assessment should be mandated for other fuels as well, but it becomes particularly important in the case of nuclear energy.
Hydropower• On a national level, the sector is governed by the National Hydropower Policy of 2008. But since water is a state subject,
policies of different states are based on the national framework, but tailor-made according to their individual needs. • This is because the development of hydropower projects has been hampered by a number of factors, including longer
gestation period (8–12 years to complete from survey to commissioning); land acquisition problems; R&R troubles, inaccessible potential sites; environment and forest clearances, law & order, and geological surprises.
• Various state governments have put in place policies such as the Hydro Power Policy, 2006 of Himachal Pradesh; Policy for Harnessing Renewable Sources in Uttarakhand with Private Sector/Community Participation, 2008; the Hydro Electric

49The Road Ahead
Power Policy of Arunachal Pradesh, among others. These policies have framed laws that govern land acquisition, law & order, impact on the environment via EIAs and impact on the people via SIAs. In the short term, one must look at measures to iron out the issues in the current policy framework.
• Hydro project developers must conduct EIAs and SIAs while acquiring land for the construction of the dam. The EIAs are supposed to measure the impact of the dam on the surrounding topography, soil, ecology and the biodiversity of the catchment area. The SIAs must conduct an assessment on the impact of the dams on the livelihood of the people in the catchment area.
• While compensation clauses in hydropower policies tend to favour the oustees, in reality, the compensation received by many is insufficient or the benefits of the compensation are awarded just one member of the family, principally the oldest sibling and his descendants. This policy is unfavourable to other members of the family who also earn subsistence from the same land. Moreover, R&R policies discount landless labourers or those who earn a living by depending on the land in the area and are similarly affected by loss of livelihood.
• These negative externalities must be pre-empted via explicit policy, legislation, social planning, and targeted financing. Creation of a comprehensive database of land banks and the specimens of the flora and fauna in each area will help the government agencies ensure compliance during the process of EIA.
• Moreover, the governments could look at a more integrated approach towards benefit-sharing of resources from hydropower generation as well as CDM as compared to the earlier approach that sought ‘reimbursement’ for project-specific participants. The revenue could be used to foster local industries such as tourism and fisheries that would benefit the state as a whole.
• A lot of the states are already looking at facilitating small and mini hydro power capacity. In comparison to large dams, small and mini hydel power stations are much more environmentally benign. Moreover, various state policies look at different subsidies in a bid to attract private participation in small and mini hydel power stations. However, this part of the hydro power policy needs work especially in the area of tariff regulation and grid integration.
• Creating policy and institutional mechanisms to favour alternative designs to increase the dam life as also to reduce the divergence of the designed and actual dam life must be taken into account.
TransportGreening of the overall transport sector in India would seek a holistic strategy that involves planned interventions that promote low carbon growth, resource efficiency, and inclusive development in the long run. This would require a combination of interventions promoting integrated green growth of the overall sector along with specific measures promoting green growth in each of the subsectors. To make a decisive shift to green transport, interventions and massive investments are required in the coming decades in the form of modal shifts actions, specific infrastructure development and upgradation works, fuel and system efficiency improvements, and mobility management.
Develop integrated multi modal transport systems
• The present approach wherein each of the transport sub sectors i.e. roads, railways, aviation, ports, and others are developing in silos have resulted in extensive costs to the economy, society as well as the environment. As also recommended by the Twelfth Five Year Plan and the NTDPC Report, the integrated approach must look at achieving a more balanced modal mix which leads to safe, reliable, efficient, sustainable, economical, and environment friendly transportation systems.
• A strategic plan must be developed that clearly identifies and assesses the existing gaps, development priorities, and investments required to achieve integrated multi modal systems. The roadmap should essentially be backed by a multi-level investment plan with required investments over time and the potential sources of finance.
• As also recommended by the NTDPC Report, the strategic plan should aim to achieve a desirable modal mix taking into consideration the lifecycle energy costs of different modes. It should also reflect the full resource costs of each transport mode for each type of commodity transported over various distances and terrains.

50 Green Growth and Sustainable Development in India
• Adequate institutional capacities and systems must be ensured to facilitate the development of integrated multi modal systems:
Set up a unified Ministry of Transport that overlooks all the transport sub-sectors and makes collective decisions for the entire transport sector.
Set up an integrated data management system and centre for regular monitoring of transport data.
Promote shift to more energy efficient and environment friendly modes
• Any shift in traffic from road to these modes would result in substantial savings in energy consumption as well as reduced social costs. Studies by Asian Institute of Transport Development (AITD) and Rail India Technical and Economic Service (RITES) assessed the environmental and social costs of various modes of transport and recommended an increase in railway shares from the current 36 per cent to 50 per cent by 2030.
• Given the higher economic and environmental benefits related to water transportation in comparison to other modes, India must look at enhancing the sector and increasing the shares of coastal shipping and inland waterways in the coming decades. A strategic roadmap must be developed to promote coastal shipping and inland waterways in the country. The plan must clearly set targets to increase national tonnage over the years in a phased manner and identify strategies to do so.
• In view of the need to reduce energy demand for cities, increased attention must be given to promoting and incentivizing a shift from personalized modes to more sustainable modes, i.e.,public transport and non-motorized modes. The share of public transport on the average should be aimed at 60 per cent of motorized trips and 35 per cent of total trips including walk (Working Group on Urban Transport, National Transport Development Policy Committee, 2012).
Improve energy efficiency of the existing vehicle fleet
• The vehicle fleet in India has increased dramatically and is further expected to rise; and so are the resulting emissions. It is critical that more energy efficient fuels and vehicle fleet/technologies are introduced to reduce the emission load and achieve better air quality levels.
• Upgradation of fuel quality can promote cleaner fuel by reducing sulphur content which can lead to a significant reduction in emissions. The government should mandate BS-IV or low sulphur fuel (50 ppm) in the country without any further delay. BS-V fuel or the ultra-low sulphur fuels (10 ppm) should be mandated in the country by 2020. This would seek substantial investments for technology upgradation of the refineries for production of cleaner fuels.
• Tightening vehicle emission standards is important to reduce the emission of pollutants from vehicle engines. As suggested by Auto Fuel Policy 2025, the whole country should move to BS-IV norms by 2017 and target to reach BS-VI by 2020.
• Introducing fuel consumption standards for improved fuel efficiency can be taken up the fuel consumption standards for LDVs have already been set but are yet to be operationalized. These standards should be notified immediately. Standards should also be developed for HDVs and two and three wheelers on priority basis so as to improve their fuel efficiency.
• The government should run a programme to incentivize the elimination of older vehicles from road transportation. • The government should look at replacement of existing Pollution under Control (PUC) centres with a smaller number of
modernized and automated centres that can be effectively monitored by the state governments. Provisions should also be made to allow fuel testing at retail outlets. Apart from the above, stricter enforcement must be ensured.
Plan a transition to cleaner fuels
• Energy use in the transport sector will rise in the coming decades with increase in vehicle fleet. In view of the rising emissions from the current fuels, feasibility of more cleaner and greener fuels should be explored. The use of electric and hybrid vehicles is a cleaner transport alternative with zero emissions (provided electricity is produced by renewables or natural gas) and can reduce dependency on petroleum products (ICAMP, 2014). A proper roadmap should be developed, highlighting the costs and benefits of switching to a particular fuel and pre requisites to enable and facilitate that shift.

51The Road Ahead
Adequate research and funding should be made available to explore the feasibility of different fuels followed by adequate regulations and incentives to facilitate penetration of newer fuel and technologies. The recently launched FAME scheme of the Government of India is in line with the objective of promoting electric and hybrid vehicles sales in the phased manner over a time period of six months.
Integrated land use and transport planning
• The spatial arrangement of the various land uses or activities across the city is a very important factor in determining the intra-city travel demand. Therefore, any efforts towards integrated land-use and transport planning can significantly help in reducing the need to travel and lead to reduction in associated costs.
Travel demand management (TDM)
• TDM would include interventions (excluding provision of major infrastructure) to modify travel decisions so that more desirable transport objectives of social, economic and/or environmental sustainability can be achieved, and the negative externalities of travel can be reduced. Information and Communications Technology (ICT) is increasingly seen as a possible means to complement and/or improve the efficiency of physical mobility.
• Several measures like high fuel prices, vehicle related taxes, vehicle quota scheme, registration tax, annual vehicle license fees, and linking vehicle purchase with parking availability can help in discouraging vehicle ownership to a great extent.
• Controlling vehicle usage becomes important as vehicle ownership controls do not help once the vehicles are on the road. Measures to control usage of private vehicles on road include increasing the cost of usage of private modes, road pricing/ congestion pricing, and parking management.
• Encourage ride sharing/carpooling to reduce number of trips.
Improve safety conditions
• Poor safety conditions particularly in the road sector needs immediate attention. Improvements in road safety conditions should assume priority. These include interventions related to road design, awareness, and stricter enforcement of traffic rules.
Industry
Promote energy audits
• A successful energy management programme begins with a thorough energy audit. In order to improve the energy efficiency of an industry, it is necessary first to examine the existing industrial process and identify the patterns of energy use in various stages – this exercise is known as energy audit. It helps identify the areas where energy saving measures might be taken. Energy audits provide the basis on which energy-efficient technological options can be developed for the industry concerned.
Benchmarking
• Benchmarking of specific energy consumption (SEC) is an important tool to access and compare the present status of performance, technologies, and processes in selected industrial sectors with those of others, to industry average and to best technologies and practices worldwide. This can help industries to compare with their peers and determine the potential of energy efficiency improvement within their plant.
• BEE has launched a voluntary star labelling of pump sets in India. The scheme covers electric mono set pumps, submersible pump sets, and open well submersible pump sets. No such ratings have yet been developed for boilers or compressors. However, even the existing pump ratings are only applicable for 3-phase pump sets from 1.1 kW (1.5 HP) to 15 kW (or 20 HP). Furthermore, these values are mainly to guide consumers on energy savings but do not provide

52 Green Growth and Sustainable Development in India
any specific industry benchmarks. The PAT scheme has shown that benchmarking is an effective tool to set energy reduction targets for designated consumers.
Support financing of EE technologies
• Energy efficiency financing models need to be customized to the specific financing needs of technologies in different stages of innovation. Public finance through the government and low cost finance from bilateral /multilateral agencies has a crucial role in supporting research and development (R&D) and innovation of new technological solutions for pre-commercial technologies, especially in the MSME sector in the context of climate change. Bank finance is important for developing the market for commercially available technologies.
Adoption of best operating practices (BOPs)
• Emphasis needs to be placed on BOPs as such practices improve energy efficiency without major investments. Such practices are also relatively easier to adopt and they can be implemented without major investments. Low-cost capital measures (combustion efficiency optimization, recovery and use of exhaust gases, use of correctly sized, high efficiency electric motors, and insulation) show energy savings of 20–30%. More emphasis needs to be placed on documentation and promotion of BOPs through benchmarking and capacity building programmes.
• Reduction of rejections in industries could lead to significant material and energy savings. Recycling of used materials like aluminium and paper is less energy-intensive than processing the primary raw materials. Recycling of steel in electric arc furnaces accounts about a third of world production and typically uses 60–70% less energy (De Beer, Worrell and Blok 1998). In the cement sector, it is further possible to increase the use of blended cements.
• A large share of the energy efficiency benefit is lost when such auxiliaries and practices are ignored. Hence, it is important to also focus on the practice of system optimization amongst industries. Experience shows that while efficient energy components, such as pump, steam, and compressed air systems, can raise average efficiency in the range of 2–5 per cent, whereas system optimization measures can yield 20–30 per cent gains– with a payback period of less than two years.
• Application of ICT tools in critical processes and equipment of industries would help in its optimization and also maintain the operating parameters close to the design level. Close control of various operating parameters in production processes may be achieved through advanced control, metering, and feedback information. A cross-cutting example of ICT includes the Enterprise Resource Planning (ERP) systems. Another example of use of ICT in pulp and paper industry is adoption of Advanced Process Control (APC) technology in conjunction with the existing Distributed Control System (DCS). The technology allows varying of the multiple parameters to achieve the desired outputs of increased productivity and enhanced energy efficiency.
Creating an enabling environment
• The Indian government needs to play a crucial role in setting the cross-sectoral framework for energy efficiency. This includes implementing enabling policies to cost-effectively increase energy efficiency by establishing market signals to motivate effective action to accelerate the introduction of new technologies. According to the International Energy Agency, to achieve energy savings in the industrial sector, the national governments need to (a) support industry adoption of energy management protocols; (b) mandate minimum energy performance standards (MEPS) for electric motors; implement a package of measures to promote energy efficiency in MSMEs. The Indian government will have to take aggressive steps to stimulate investment in energy efficiency and accelerate implementation through synergies with national level energy efficiency plans.
• Additionally, the government needs to put in place complementary financial policies that promote energy-efficient investment. This could be done by:
Reducing energy subsidies and internalizing the external costs of energy through policies.

53The Road Ahead
Encourage investment in energy efficient technologies (EETs) and processes by putting in place targeted financial incentives such as tax incentives for adopting EETs.
Foster private finance of energy efficiency upgrades in industry through risk-sharing or loan guarantees with private financial institutions and enabling the market for energy performance contracting.
Fuel switch options
• Switch over from coal to low carbon fuels like natural gas and biomass offers one of the best opportunities in terms of moving towards a low carbon economy. Waste materials (tyres, plastics, used oils and solvents and sewerage sludge) are being used by a number of industries.
• In case of certain applications like cement manufacturing, the plants can use municipal solid waste as well as other fuels like used tyres to replace fossil fuels. Industries with low temperature water requirements (around 100•C) such as dairy, textiles, and pharmaceuticals also use solar thermal systems. Rational pricing of cleaner fuels like natural gas at the national level will help in encouraging industries to explore switchover to cleaner fuels in a big way.
Adoption of cross-cutting best available technologies (BATs)
• Cross-cutting technological options have the potential to conserve energy across a variety of industrial segments, irrespective of the type of manufacturing process. It has been estimated that, in general, in the industries, approximately 50 per cent of the industrial energy use is consumed in cross-cutting areas such as boilers, air compressors, motors, pumps, blowers, and so on.
• Co-generation involves using energy losses in power production to generate heat for industrial processes and district heating, providing significantly higher system efficiencies. Co-generation is common in many pulp and paper, sugar, and chemical industries in India. Conservative estimates suggest a huge potential of over 20,000 MW from cogeneration units in India. As per the Integrated Energy Policy Report, 2006, prepared by an expert committee constituted by the Planning Commission, renewable sources may contribute to nearly 6 per cent of India’s energy mix by 2032. Studies sponsored by the Ministry of New and Renewable Agency (MNRE) have estimated surplus biomass availability at about 120–150 MMT per annum, covering agricultural and forestry residues corresponding to a potential of about 18,000 MW. About 5000 MW additional power could be generated through bagasse-based cogeneration in the country’s 550 sugar mills, if these sugar mills were to adopt technically and economically optimal levels of cogeneration for extracting power from the bagasse produced by them.
• Use of energy efficient equipments such as pumps, motors, and air compressors provide an opportunity forindustries save energy. Motors and motor driven systems account for a major share of electricity used by industries in India for operating various machines, fans, pumps, conveyors, and compressors. These machines find applications in various types of industries like pharmaceuticals, sugar, pulp & paper, and cement manufacturing. The electric motor is the main element in a motor-driven system that offers the potential for savings. Replacement of inefficient motors with EE ones such as IE1, IE2, and IE3 can yield a savings of 10–15 per cent with quick payback period and cost-effectiveness.
• Replacing incandescent and mercury vapour lamps with energy efficient lamps such as CFLs and low pressure sodium lamps could effectively reduce the energy consumption in lighting systems. These lamps would require proper ballasts to operate effectively. However, while replacing the lamps in industry, their suitability in specific areas will have to be seen in view of their colour rendering index. In general, the electricity savings for switching over to energy-efficient lamps can be of the order of 35–45% from the existing level. According to an Energy Efficiency Services Limited (EESL) study, replacement of a 60W incandescent lamp with 10W LED will result in energy savings of over 80 per cent. Lighting controls and voltage stabilization systems would also offer substantial energy savings as well as enhance the life of the lighting systems.

54 Green Growth and Sustainable Development in India
Implementation of ISO 50001 energy management standard
• Using energy efficiently helps organizations save money as well as helpsto conserve resources and tackle climate change. The International Standards Organization (ISO) has developed ISO 50001—a standard focusing exclusively on energy management. ISO 50001 supports organizations in all sectors to use energy more efficiently, through the development of an energy management system (EnMS). The Bureau of Indian Standards (BIS), Government of India, has accepted this standard and introduced its own version for the Indian market. ISO 50001 is based on the management system model of continual improvement also used for other well-known standards such as ISO 9001 or ISO 14001. This makes it easier for organizations to integrate energy management into their overall efforts to improve quality and environmental management.
Adoption of sector specific cleaner technological options
• Sector-specific energy efficient technologies can lead to significant energy savings, sometimes as high as 25–50 per cent.
Cement sector• Utilization of industrial wastes: Blended cement can be manufactured from industrial wastes such as slag and fly ash.
Other industrial wastes like biomass, petroleum coke, and waste tyres) can also be utilized beneficially during the clinker burning process. Various substitute fuels need to be explored, depending on their availability locally.
• Raw material grinding: The use of vertical roller mill can make a significant contribution to the reduction of power consumption in the raw material grinding process. To dry and grind at the same time makes a large volume of gas through the system, increasing the power consumed by the fan. Therefore, the difference of the facility power of the mill itself is not related to the reduction of electric power but, as compared to the existing process with the ball mill, reduces the power consumption by 10–15 per cent. More reduction can be expected by reducing the volume of gas passing through or circulating in the process.
• Co-generation by utilizing waste heat: Sources of waste heat in the cement industry include flue gases, vapour streams, convective and radiant heat loss, and so on. On an average, the Indian cement industry is losing almost 35 per cent of its energy through flue gases and hot air streams.It has been observed that losses through kiln exhaust gases (20 per cent) and hot air from coolers (12.8 per cent) are prominent, and provides the potential areas for the waste heat recovery. Co-generation or waste heat power generation (WHPG) system will utilize the waste heat and produce electricity, thereby reducing the overall energy cost of cement plants. A co-generation system utilizing the waste heat can deliver up to 20 per cent of total electrical energy required for the process.
Textile sector Textile industry is highly energy intensive. Wet processing or dyeing operation consumes almost 50 per cent of the energy in a composite mill. Thermal energy (steam and hot water) is primarily used to process, dye, print and dry the cloth during wet processing. There is a large scope to save energy in the boilers, steam distribution, and drying operation in a textile mill. Some examples of energy conservation measures in a textile mill are the following: • Energy efficiency improvement in a humidification plant• Conversion of thermic fluid heating system to direct gas firing system in stenters and dryers• Temperature control system in processing machines• Recovery of condensate in wet processing plants• Energy efficiency improvement in cylinder dryer• Waste heat recovery in stenters, merceriser machines, and bleaching system• Replacing electric heating with thermic fluid heating in polymeriser machine• Installation of photocells for speed frames

55The Road Ahead
Pulp and paper industryProcess optimization, waste heat recovery, and cogeneration systems offer significant scope for improving the performance of Indian paper mills. Other energy conservation measures, which require marginal or no investments and would resulting 5–10 per cent energy savings, are listed below:• Excess air control in boilers through ducting design and instrumentation to help in reducing the load on induced draft
(ID)/forced draft (FD) fans.• Proper temperature control in slaking and causticizers to reduce steam consumption.• Better instrumentation loop in agitators.• Cascading system for efficient use of steam in the dryer section of the paper machine.• Vacuum piping with minimum bends in the paper machine section.• Replacement of beaters by double disc refiners in small paper mills.• Adoption of bio methanation.• Use of de-silication technology for silica-rich raw materials such as rice straw, bagasse, and bamboo-based raw materials.
Iron & steel industry• Installation of regenerative burner system • Hot charging of continuous cast billet• Top-and-bottom firing system in reheating furnace• Oxy-fuel combustion system in reheating furnace• Replacement from lump coal to coal producer gas as fuel• Installation of high efficiency recuperator with improved furnace design
Development of new technologies
• Public and private participation is required for RDD&D (Research, Development, Demonstration, and Deployment) for clean technologies that can reduce GHG emissions. Especially in the MSME sector in India, where ready technology solutions are not available, the government and the industry needs to invest in R&D solutions. Adequate support from the government would be required to set up incubation centers, and cluster level fabricators would need to be incentivized to develop low cost technological solutions as per local conditions.
• A collaborative R&D and demonstration approach that combines the know-how of local/national and international experts is needed. Such an approach will lead to building the technical capacities of local actors on manufacturing and trouble shooting of the technology and thus promote dissemination of the new technology at a faster pace. In order to create a delivery system for the developed technology, it is important to identify and develop a network of local service providers (LSPs). The LSPs can be developed as project promoters for providing services such as technical assistance, financial intermediation, and ESCO services.
BuildingsGreening of the building sector offers great economic and environmental opportunities and enormous challenges. EE measures undertaken at a slow rate and integration of various essential green measures is currently missing at the national and sub-national policy levels. There is a need of integrating green measures such as storm water management, wastewater management, rainwater harvesting, low impact development strategies, use of appropriate construction materials and technologies, along with intensive measures targeting energy efficiency and renewable integration (both for thermal applications and generation of electricity) should be the vision as part of green growth strategy.

56 Green Growth and Sustainable Development in India
Technology
• Ensure all new construction for commercial buildings (as defined by the ECBC) to be ECBC compliant.• Target of 50 per cent greening of rooftops and public spaces in all urban areas to prevent urban heat island effect;in the
first phase, important cities (3–4) may be taken for greening.• Retrofit measures to make the existing building stock energy efficient and water wise, to overcome the various
environmental challenges posed by the sector.• New stock to be built on the principles of green buildings to accrue social, environmental, and economic benefits.• Efficient appliances’ penetration of renewable energy with a special focus on building integrated PV as well, in order to
bring in equity (energy access) and reduce the environmental implications and externalities associated with conventional electricity generation.
• Alternate building materials which perform equal or better than the conventional ones to bring in environmental sustainability.
• Setting of materials testing laboratories as per the requirements of green buildings and setting protocol and uniform methodology responding to the needs of the country; national certification system/ body for assessing performance levels of such materials & products and giving certification to prevent the market from falling in a trap of ‘greenwash’.
• A strategy and implementation plan at the national level on promotion of green materials and replacement of high embodied materials with low embodied materials—a must for India given the high construction rate.
• Exclusive substantial financial allocation for R&D on green buildings and new materials; revitalising/strengthening all the buildings centers and facilitating establishment of new institutes as Centres of Excellence; regional presence of such Centres of Excellence in all regions of the country; incentivizing the R&D and innovating initiatives.
Enabling conditions
• Capacity building programme targeting all the stakeholders in line with the changing needs of the market. This includes architects/ services consultants/ building energy auditors/ Sustainable Urban Drainage Systems (SUDS) designers/rain water harvesting designers.
• Focused programme for skilled labour—masons, plumbers, electricians—who can use new materials and construction technologies; this requires institutional reforms at the federal and state levels.
• Attractive financing solutions for developers investing in EE buildings, ESCOs; communicating through various media, the benefits of green buildings at no incremental cost, life cycle costing of the property & potential savings on annual electricity bills to be made available to the buyers along with the property brochure, attractive financing solutions for home buyers investing in EE housing, attractive financial models for affordable housing sector, access to finance by the underprivileged, and to overcome the various financial barriers faced in greening of the sector.
• Incentives for manufacturers to invest in energy efficiency products and mechanisms to promote wider availability of energy efficient products and providing extended support with improved technology.
• Implementation of ECBC and associated institutional mechanisms (monitoring and verification protocol) to deliver the same for better implementation and reap the real benefits of energy efficiency achieved.
• Incorporation of green/ EE features in municipal bye laws and all related documents, followed by central/state governmentswhich is necessary for achieving the environmental benefits associated with greening of the building sector.
• Governments can work towards a vision of near Net Zero (energy, water, and waste) buildings by 2047 (regional priorities to be set as per the existing situation).
Measurement
• There is a need to develop some simple indicators, instead of a long wish list separately for new and existing construction,for monitoring the progress of the targets:
EPI for key building typologies (residential and commercial)

57The Road Ahead
Installed capacity of renewables at building scale Fresh water usage intensity (litres per capita) for key building typologies (residential and commercial) Percentage of buildings managing biodegradable municipal solid waste onsite Percentage of buildings covered by door-to-door collection of segregated waste (at least in two categories—wet and
dry) facility Percentage use of native/naturalised species of plants (to attract biodiversity and other co-benefits) Extent of discharge of untreated sewage from each building/neighbourhood
Agriculture
Improving energy efficiency
• Technical options for improving energy efficiency in irrigation include facilitating up- gradation of inefficient pumpsets to energy efficient pumpsets through the AgDSM programme that seeks to establish viable models for public-private partnership. Programmatic interventions that must be promoted include those that facilitate other DSM measures such as installation of foot valves and/or that of capacitors at motors can also promote energy efficiency at the farmers’ end.
• Replacement of low tension lines with High Voltage Distribution Systems is another option as it results in improved reliability and quality of power reducing losses which in turn may reduce electricity pilferage, incentivize metering of supply and enhance accountability amongst farmers. This initiative has been tried in select regions and could be expanded.
• The aforementioned strategies must be complemented with other programmatic initiatives that facilitate provision of quality and reliable power to farmers prompting metering/optimal tariff realization and mitigation of energy wastage in irrigation practices. One way to achieve this is via separation of feeders to segregate power supply of farm and non-farm uses and provide rationed but better quality as well as dependable power supply at an optimal tariff.
• Promotion and effective adoption of solar pumping systems is necessary as it could facilitate a reduction in diesel consumption in irrigation and therefore savings of a non-renewable fossil fuel. It is estimated that a saving of 9.4 billion litre of diesel is possible over the life of solar pumps in the case of their replacing 10 lakh diesel pumps. Adequate steps must be taken towards ensuring adequate subsidies and easing subsidy disbursement and exploring leasing options; establishing effective finance mechanisms (such as loans for end user and private players) and business models for adoption, creating market assurance and facilitating appropriate regulatory interventions for ease of market promotion and deployment. However, given the increased efficiency of solar pumps, there is a possibility of the unintended consequence that its use could lead to greater ground water exploitation. Hence, its deployment must be taken up alongside installation of drip irrigation systems at the farm level.
• There is a need to promote fuel efficient tractors as a part of the drive for farm mechanization in India. It is essential to encourage and incentivize industry to focus on R&D related to improving fuel efficiency of tractors and designing tractor implements of standard quality. Awareness and training of farmers for use of appropriate power and implements as well as equipment for specific agricultural activities such as harvesting, treshing, and grain separation could also help in fuel saving. Development of standards for fuel consumption for tractors could be envisaged.
Improving water efficiency
• Improving water use efficiency in major and medium irrigation (MMI) systems is vital for reducing water wastage and mitigating excessive ground water exploitation. Strengthening the implementation of schemes such as Accelerated Irrigation Benefits Program (AIBP) and CADWM is essential as is linking CADWM with AIBP to reduce the gap between irrigation potential created and utilized. Modernization of the canal system is also imperative. Alignment of cropping pattern with available irrigation potential for optimal water use is also necessary. Furthermore, adequate technical, financial, and human resources for operation and maintenance of irrigation systems needs to be provided. There is a
58 Green Growth and Sustainable Development in India
clear need for institutional and management reform for satisfactorily addressing the multidimensional issues leading to reduced water use efficiency and deterioration of MMI systems.
• Streamlining participatory irrigation management, especially by enactment of requisite legislation by states, establishment of water user associations (WUAs), ensuring monitoring and evaluation is necessary. Ensuring coordination, partnership and accountability between department officials and WUAs farmers as well as incentivizing and rationalizing the irrigation fee is also crucial. Data collection and research on irrigation management systems must also receive consistent and ample attention.
• Promotion of Micro-Irrigation systems amongst farmers and in command areas is vital. Appropriate encouragement, incentives, and subsidies for farmers to adopt these systems is necessary. Furthermore, awareness and training by extension services to farmers on deployment and use of these systems must be undertaken.
• There is a clear need to re-envision the minimum support price policy and public procurement policy for various crops for incentivizing farmers to assume cropping patterns in accordance with groundwater status of the geographical area. Implementation of the policy to procurement of rice from the north-eastern states and farmer incentives for growing maize and other indigenous commodities would facilitate a decrease in acreage under rice in Punjab and Haryana that is causing serious ground water exploitation and substantial energy expenditure.
Strategies for enhancing soil health and conservation
• Amongst the various management strategies to overcome soil acidity, soil amelioration with the help of Lime has been recognized to be effective as it reduces Aluminum, Iron and Manganese toxicity and increases the base saturation, Molybdenum, and Phosphorus availability of acid soils. Liming the soils also increases Nitrogen mineralization as well as atmospheric Nitrogen fixation in the acid soils. Other strategies to manage soil acidity include selection of crops that are tolerant to the acidity. Use of crops tolerant to soil acidity in areas where liming is not very economical can lead to increased productivity of acid soils.
• One of the various management strategies is that of leaching wherein the root zone salinity is reduced to desired levels through the removal of excess salts. Other management strategies include choice of crop, proper seed placement, method of water application, and method of raising the plant. The use of mulches is another way to tackle the problem of soil salinity. In this method, the upward movement of the salts is reduced by mulching due to decreased evaporation and the addition of organic matter improves physical conditions of soil and more water holding capacity keeps salts in diluted form.
• Management strategies for sodic soils include land levelling and shaping, plant population (increase seed rate and reduce the plant distance), age of seedling, green manuring, continuous cropping, management of drainage and irrigation.
• In general, soil management practices include addition of organic matter in large quantities for a healthier soil, increase in on-farm biodiversity, prevention of soil erosion with help of soil mulching and use of green manure.
• To overcome the soil micronutrient deficiencies, the application of Basal to soil or use of foliar sprays of Zinc, Boron and Molybdenum, and foliar sprays of Iron and Manganese are usually recommended as the most suitable methods for correcting such deficiencies.
Cross-cutting strategies
• Conservation agriculture practices (permanent soil cover, like bed planting, laser levelling and direct seeding as well as techniques such as System of Rice Intensification have been observed to reduce the requirement for water for crop production and improve water use efficiency. Organic farming practices have been observed to conserve water. Furthermore, energy efficiency in crop production is also possible due to absence of/ lowered tillage or reduced irrigation needs in conservation agriculture. Lowered use of pesticides and herbicides and absence of chemical fertilizer use also increases energy efficiency in organic farms. The aforementioned practices are also known to improve soil health and agriculture productivity.
59The Road Ahead
• Mainstreaming sustainable agricultural practices is crucial for resource efficiency and greening of agriculture. The NMSA is a starting point for soil health management and organic agriculture. Promotion of SRI has also been adopted as a strategy for sustainable rice production by the Ministry of Agriculture (MoA). A focus on developing extension services and identifying market linkages to cater to farmers involved in sustainable agri-production is vital as is the expanding community managed sustainable agriculture initiatives and linking agriculture to livelihood opportunities.
• Farmers in rainfed areas, especially small and marginal farmers, operate under resource scarce conditions but hold the key for sustainable agriculture. Strengthening rainfed agriculture and watershed management are vital for ensuring natural resource conservation and sustainability in agriculture. The ineffective implementation of watershed programmes at the grassroots levels, low level of participatory processes, lack of appropriate human resources, and usefulness of the NRAA have been some of the main challenges of the IWMP programme. The Mihir Shah Committee was established to revisit the Common Guidelines for Watershed Development Projects and have recommended various interventions/provisions to strengthen the programme. These include strategies for capacity and institution building, increased duration and resources for the programme, especially to deploy human resources and establishing a Central Nodal Level Agency and redefining role of National Rainfed Area Authority. Other recommendations involve enhanced participation of civil society and convergence of IWMP with allied programmes.
Air QualityIndustrial combustion, transport sector, power plants, and the residential sector are major contributors of deteriorated air quality in India. Nearly all the cities violate the particulate matter standards as prescribed by Central Pollution Control Board. These high pollutant concentrations are posing health impacts to the public. Thus, it is imperative to control pollution levels by mitigating emissions from the respective sources. In the base scenario, the future emissions from these sectors will grow manifold if proper stringent measures are not being taken on time. It is projected that, in 2030, NOx emissions from the road transport sector will increase five times of the current emissions. Also, particulate emissions, especially PM2.5 will increase majorly from brick, open burning, and transport sector. In the base case, in 2047, total emissions for all the pollutants will increase three folds. The following recommendations are provided to curb the air pollution levels in India.
Transport and air quality
• Considering the fast growth in the vehicular sector, more stringent steps should be taken. Instead of following chronological order for the norms, BS-V fuels should be considered by enabling the Indian refineries to leapfrog from BS-II to BS-V.
• An effective inspection and maintenance system should be enforced by the government in the states.• Old vehicles should be gradually phased out with proper scrapping mechanism in place.• A gradual shift from road to rail should be followed in the Indian scenario.• Electric mobility should be promoted.• Government should conduct programmes at the community level to sensitize the public about the growing levels of the
pollution due to vehicles and promote public transport systems.• Industries and air quality• Cleaner fuels should be introduced to curb the emission levels.• Installment of Air pollution Control Equipment (APCE) in all industrial units should be made mandatory for all the
industries.• Efficiency of installed APCE’s should be checked at regular levels.• In order to have more regular control, number of air quality monitoring stations in the country should be increased.• APCE should be enforced for each brick kiln unit and its efficiency should be monitored on regular intervals.

60 Green Growth and Sustainable Development in India
Power and air quality
• ESPs are installed in all the plants but inspection and maintenance systems should be enforced at regular time intervals.• Indian emission standards for SO2 and NOx from thermal power plants in India should be developed and introduced. • As the power sector contributes the most in SO2 emissions from India, FGDs should be installed in more plants as early
as possible.• Capacity of vigilance authorities in the power sector should be strengthened• Government should provide fiscal incentives for compliance
Residential and air quality
• Enhanced and faster penetration of cleaner fuels like LPG • Increased penetration of improved biomass-based chullahs with higher efficiencies and lower emissions
Water
Pricing
• Water is generally not perceived in India as an economic good. This makes the associated features such as the concept of user payments and ‘Water Pricing’ hard to be implemented in many parts of India, thereby adversely affecting the sustainability of water supply.
• A bulk water pricing framework needs to be formally administered and organised—relying purely on market forces to allocate value to water resources does not work. In addition, the direct involvement of a federal agency helped to balance the interests of different groups whilst still allowing each stakeholder to negotiate terms. This central administration involvement can take many forms, but a robust and independent (as perceived by stakeholders) regulator may be the best alternative.
• Bulk water pricing arrangements need to be accompanied by a well-defined water entitlement framework that is flexible enough to adjust rapidly to the changing environmental conditions. In terms of pricing approach, marginal cost pricing (or variants thereof) is generally perceived to be the preferred option. Within this framework, two part pricing methodologies are commonly adopted in an attempt to send appropriate pricing signals and to help maintain the financial integrity of water utilities.
• There is a need for the authorities to take into account, development, management, and O&M charges while fixing tariffs. Additionally, the Water Users Associations (WUAs) or Panchayati Raj Institutions (PRIs) should be given statutory powers to collect (and enforce collection) water charges and retain a portion, manage the volumetric quantum of water allotted to them, and maintain the distribution system in their jurisdiction.
Regulation
• Regulatory action through pricing of water is critical for its economical and efficient use. On similar lines of CGWA, the State Water Regulatory Authority can be statutorily empowered to fix appropriate tariffs, enforce recycling measures, prevent and control pollution, and ensure the preservation and management of water sources.
• Regulatory functions need to extend to proper management of the resource and a specific legislation is required for the proper management of not merely groundwater but for surface water and groundwater as a jointly managed resource.
• The Central Government needs to enact a framework law or develop a Model Law, so that States can enact legislation conforming to a broadly uniform framework. While the regulatory authority can regulate, it is essential to separate the planning function and energize the National Water Board and the National Water Resources Council for the purpose. Similar boards at the state level would need to discharge the state level planning functions, suitably providing for planning role for municipal and panchayat bodies at the regional level.

61The Road Ahead
• The presence of a regulator can strengthen the performance orientation of local bodies and provide an objective basis for tariff setting and targeted subsidies. In doing so, it can help create a more transparent and predictable environment for attracting investment into the sector, including from private sources, and facilitate improved project design and implementation through PPP structures. The introduction of sector regulation, however, needs to be also accompanied by other enablers such as rationalized public funding, tariff frameworks, increased role clarity, and stakeholder participation.
• Water use efficiency needs to be incentivized by proper energy pricing for use in agriculture, both in ground water extraction and lift irrigation. Water audit needs to be made mandatory for specified types of industries and/or identified areas in order to efficiently manage water resources in the industrial sector. In order to locate policy and management gaps, regional water audits with respect to water use in agriculture on sample basis needs to be institutionalized.
Technology
• Water use efficiency (WUE) can be enhanced in irrigated agriculture by increasing the output per unit of water (agronomic, engineering, management, and institutional aspects), reduce losses of water to unusable sinks, reduce water degradation (environmental aspects), and reallocate water to higher priority uses (societal aspects). Specific examples of achieving WUE can be agronomic approaches for crop management by selection of optimum cropping pattern and less water intensive crops. Additionally, it is important to enhance moisture conservation or to reduce water percolation and evaporation, using techniques such as conservation tillage and plant spacing.
• Engineering approaches that help promote WUE involve irrigation systems design by laying hydraulically and geometrically efficient systems to reduce application losses and/or improve distribution uniformity, lining of canals, furrow irrigation, pressurized irrigation, and others. Then, the management approaches like demand-based irrigation scheduling, participatory irrigation management, multiple use of water, also help in attaining WUE. Further, there are institutional approaches like participation in an irrigation district (or scheme) operation and maintenance, appropriate water pricing, and capacity building of farmers’ organizations that are promising in achieving WUE.
• Integrated water resource management for water conservation using rainwater harvesting and groundwater recharge as well as rejuvenation of lakes and ponds in the river basin catchment.
• Enhancing water use efficiency in irrigation, by using efficient irrigation techniques like drip and sprinkler systems and implementing micro-irrigation systems (MIS) through participatory irrigation management (PIM).
• Watershed management by design and construction of watershed structures (farm bund, farm ponds, check dams, contour bunding, and irrigation scheduling).
• Integrated wastewater management by treatment, recycle, and re-use by identifying and designing innovative solutions for domestic and/or industrial sectors with appropriate use of decentralised and/or centralised options. Developing mechanisms and MIS platform with innovative information and communication technology (ICT) tools and technologies for integrated and efficient monitoring, informed systemic responses, and decision making.
• Developing water quality database and management using real time monitoring, linking billing with water supply network designs using Supervisory Control, and Data Acquisition (SCADA) and cloud computing systems.
Capacity Building
• Proper management of water as a resource cannot be ensured by the central government or even by the state governments on their own. Better and more efficient management requires the development of community institutions to help develop and propagate better local practices and apply social pressure to ensure proper regulation, minimize wastage, and enhance efficiency. Panchayati Raj Institutions (PRIs) and urban local bodies (ULBs) are instrumental in achieving sustainable management of water resources for the country, and thus, their capacity-building has to be a matter of prime importance.
• Institutional capacity building is of utmost importance in order to ensure that the mechanism of overall framework ensures efficiency in treating water as a finite but renewable resource to be carefully managed and judiciously utilized.

62 Green Growth and Sustainable Development in India
Training and capacity building of engineers and water supply and sewage staff at all levels is essential to ensure efficiency and reduce waste. Each state should set up a training institution to provide training and develop skills for municipal bodies, panchayats, and outsourced service providers and central government should set up research and development (R&D) institution with regional centres for research on all aspects related to resource use efficiency in the sector. There is a need to identify adequate number of national and state level key resource centres to build the capacity of the staff and officials on efficient management of water resources.
Enabling conditions
• Training and capacity-building activities should be carried out in a sustained manner, with appropriate monitoring mechanism in place, in order to effectively disseminate the learning and implement it onground.
• Clear and comprehensive science-based Water Resource Policy (TERI 2014) at central and state levels for integrated water resource management, which focuses on both supply-side and demand-side dimensions of water use.
• A Water Framework Law at the central level, laying out the architecture for planning and regulation and technical institutional support.
• Effective legislation at the state level (based on the Central Model Law) for regulation of groundwater and surface water, providing an explicit and increasing role for municipal and Panchayati Raj bodies in planning, management, and regulation.
• Restructuring, strengthening, and empowerment of the existing institutions (central, state, and local) involved in different aspects of service delivery so as to improve efficiency in management and sustainability of the resource.
• Major shift in approach in water resource management from purely engineering works to systems that incorporate traditional practices, local materials and are manageable and maintainable by local communities. The Gram Panchayat as well as the local community needs to be involved at all stages of discussion, planning, implementation, management, and maintenance.
Forestry and BiodiversityGreen growth strategies need to address issues of forest degradation, climate change, and rights and livelihoods of local people. Gap in the demand and supply of forest products is one of the major reasons for forest degradation across most of the country.
Institutional linkages
• Linkages need to be established between research institutions, state forest departments and private sector to produce good quality planting material. As envisaged in the Twelfth Five Year Plan, model nurseries can be established in selected forest divisions.
• Joint Forest Management institutions need to be strengthened through establishing strong linkages with Gram panchayats and allocation of green funds. Village level green volunteers can be trained for conservation of natural resources
• Research on the impacts of climate change on forest structure and various functions need to be undertaken and integrated with forest management.
• In the long-term, we need to move from Joint Forest management to Community Forest Management where gram panchayats have complete responsibilities over management of forests under their jurisdiction. The Forest Department can provide the technical support and monitor the implementation of important policies.
Increasing Tree and Forest Cover
• The Forest Policy of 1988 aims to bring 33 per cent of the geographical area under forest cover. It would require additional 29.5 mha of area to be vegetated. There has been an increase of only 5.71 mha in forest cover over last 28

63The Road Ahead
years, i.e., from 1987 to 2013 due to financial, technical, and land availability issues. The government has kept a more realistic target of 5 mha for greening under the Twelfth Five Year Plan to increase the forest and tree cover in the country (Planning Commission 2013).
• In the short-term, treatment of 5 mha of forest and non-forest land can be undertaken during this period. Out of this, the 2 mha could be additional whereas 3 mha of existing degraded area could be treated for quality improvement.
• In the medium term, 15 mha of forest and non-forest area can be treated during this period and 10 mha of existing degraded area can be improved through a mix of plantations and assisted natural regeneration to improve the quality of the forest. Additional 5 mha can be brought under forest and tree cover through plantations on available common lands and private lands through social forestry and agroforestry measures. It would require additional finances resource allocation for the state forest departments.
• In the long-term, 20 mha of country’s forest area can be treated for improving the forest quality in existing open and scrub forests through plantations and natural regeneration. It would require sustained financial support and monitoring to reach such a target. It would require additional finances resource allocation for the state forest departments.
• Legal restrictions on felling and transit of agroforestry species such as eucalyptus, poplar, and other state specific species need to be removed to encourage plantations on private lands.
Addressing demand-supply gaps
• Use of alternative fuels should be increased. Expansion of LPG in rural areas can be expanded from 6 to 10 per cent in the rural areas which can save 1.22 million tonnes (MT) of fuel wood every year. Similarly, there can be extension efforts in collaboration with Ministry of New and Renewable Energy and state agencies to promote use of improved chullahs (IC) in 10 million households. Each IC can save about 400 kg of fuel wood annually.
• Alternative fuels such as liquefied petroleum gas (LPG) can be extended to rural households. Similarly, improved chullahs and devices based on solar energy can be provided. It will drastically reduce the pressure on forests.
Addressing drivers of degradation
• Guidelines can be issued to involve climate change issues in the Forest Working Plans. More awareness about the climate change issues needs to be generated among the forestry staff across all levels. Implementation of climate adaption measures such as checking forest fires and forest fragmentation should be implemented. Plantation of monocultures should be discouraged.
Livelihood strategies
• It has been estimated that ecotourism and other ecological values from JFM areas alone could yield USD 1.7 billion by 2020 in India (World Bank 2006). It could be well above USD 6 billion for all forest areas of the country. Ecotourism has been exploited at a limited scale but has the potential to become a major driver of local economies. The ecotourism programme should be up-scaled gradually by identifying hotspots, creating infrastructure and facilities with the help of the private sector and building the capacity of local communities.
• Legitimate rights of people under FRA should be recognised. Community rights for the management of the forest resources, which have been neglected so far, should be considered. After recognition of legitimate rights, illegal occupations should be vacated with the help of local institutions.
• There are several bottlenecks for forestry enterprises in India. These include government control over profitable forest produce, constraining regulations, lack of credit availability, poor technologies, and low value addition. Requirement of transit permits and felling regulations for nationalized species discourages private enterprise. Forest-based communities should be trained as processing and value addition entrepreneurs.
• Claims to individual and community rights should be completed. Livelihoods of the right holders should be strengthened through training them in modern agriculture, animal husbandry, and forest management.
64 Green Growth and Sustainable Development in India
• Collection and processing of non-timber forest produce tendu leaves, sal seeds, aonla, bamboo need to be promoted in collaboration with private sector. Middlemen can be removed from the system though formation of cooperatives such as in the states of Madhya Pradesh, Chattisgarh, and Andhra Pradesh.
• Small-scale forestry enterprises are linked to state and national markets through digital platforms, which will substantially improve the livelihoods of local people.
Biodiversity
• It is important to dovetail the national efforts for biodiversity conservation with the international goals and processes such as Aichi Biodiversity Target and Nagoya Protocol.
• The national targets are cross-cutting in terms of issues as well as respective jurisdictions of ministries of central government and state governments. However, there is a limitation in terms of funds available for achieving the national targets for biodiversity conservation. There is thus a need to identify new financial mechanisms to support biodiversity conservation in India. The newly formed national Access and Benefit-sharing (ABS) regime is one of the powerful mechanisms to generate funding for biodiversity conservation and equitable benefit sharing.
• The implementation of ABS guidelines is expected to bring about INR 20,000 crores annually as visualized by some of the State Biodiversity Boards in India like Madhya Pradesh State Biodiversity Board.
• India is bestowed with unique biodiversity and associated traditional knowledge. At the national level, India also has a robust policy framework to safeguard biodiversity. This has helped India to commit to strong measures at the international level, under Aichi Biodiversity Targets 2020. Against every national target, indicators and responsible organizations have been identified. However, for a large number of indicators there are issues of defining baselines and availability of state or national level data, leading to inadequate basis for understanding the impacts of conservation efforts.
Waste managementThe situation of solid waste management has certainly improved over the years. However, there is still a long way to go. Instead of following the usual end of pipe approach, waste management must be looked at holistically and preference must be given to reduction of waste at the source. The waste management system is blocked at collection stage, which is inefficient and consumes most of the funds and time. Instead of working against the informal sector, it is important to recognize the importance of informal sector and incorporate it into the formal waste collection system. Waste processing and disposal deserve more strategic and financial importance. There is a need to maximize resource recovery from waste and waste recycling to reduce the land requirement for waste disposal.
Financing
• The urban local bodies (ULBs) in India are running low on funds. The current mechanisms to raise funds for waste management must be improvised. Investing in greening the waste sector requires substantial financial resources for both capital expenditures and operation. Such resources may be found from private investments, international funding, cost recovery from users, and other innovative financing mechanisms.
• Cities in India typically spend more than half of their waste budget in collection alone, (mainly on labour and fuel), although the collection rate remains low and the transport of waste remains inefficient. Spending on other segments of the waste management chain such as appropriate treatment, recovery, and disposal technologies and facilities is generally rather low. Increased investment in basic collection services, the transport of waste and cleaning up dumpsites is a starting point for greening the sector. Investment can be targeted, for example, at techniques such as route optimisation and transfer stations, which can bring down the capital and operational costs of providing waste services.
• The incentives commonly prevalent in the waste sector include taxes and fees; recycling credit and other forms of subsidies; deposit-refund; and standards and performance bond or environmental guarantee fund. Volumetric landfill
65The Road Ahead
taxes can encourage the reduction of waste and are easy to implement. Their effectiveness, however, depends on the tax rate per tonne of waste and on the existence of adequate monitoring and enforcement measures. It is also important to ensure that the tax does not result in increased illegal dumping rather than encouraging 3Rs.
• Pay-as-you-throw (PAYT) is another way of discouraging waste generation. Precaution against illegal waste dumping or misuse of recycling facilities is however needed. Full financing of the waste-management infrastructure has to be assured and sufficient awareness-raising is necessary.
• Economic incentives and disincentives serve to motivate consumers and businesses to reduce waste generation and dispose of waste responsibly, thereby contributing to increased demand for greening the waste sector.
Institutions and Partnerships
• It must be realized that municipalities can no longer ‘provide’ all the waste management services in isolation. The aspects of waste management which the municipalities can handle efficiently must be identified and private players must be given a chance to manage the remaining aspects. The government must alter policies in such a way that private sector is encouraged to invest, establish, and operate facilities in the waste management sector.
• There should be efforts to institutionalize the informal sector and modernization of recycling technologies. Informal waste recyclers can be trained to collect the waste from households, do decentralised waste processing (composting or biogas), and trade recyclable waste.
• It is important to formalise the informal sector enterprises and support them through incentives in order to develop local markets and small and medium formal recycling enterprises. Incentivising formal recycling activities, providing micro-finance and access to the markets could help in shifting the informal sector to formal regime. In addition, raising awareness on the social and health related benefits of formalisation may help in understanding importance of intangible benefits.
Waste reduction
• Waste reduction strategies involve lesser generation of waste at source and using alternative material which generates waste of lesser hazard as compared to traditionally used ones. It is necessary to decouple the waste generation process from the growth of the economy and population.
• MSW in India comprises of around 50 per cent organic or food waste with high moisture content. This waste (food waste, agricultural residues, etc.) can be composted either aerobically or anaerobically. This process not only treats the waste, diverting it from landfill (thus saving on cost of disposal) but also the compost produced can enrich the top soil with organic carbon which is the key to soil fertility. Decentralized, community composting options should be explored wherever feasible (away from residential areas to avoid community conflicts)
• There is need to promote alternative packaging such as use of fabric or jute packaging, instead of traditionally used polythene bags which are difficult to collect and recycle (reviving of jute sector).
• There is need for designing products like cell phones and other electronic goods for longer shelf life so that they enter the waste stream a little later. Products need to be designed for disassembly so that majority of their components can be recycled at the end-of-life. There is also a need for developing re-manufacturable products to increase their life cycle.
• Waste avoidance can also be achieved by assigning a disincentive for items such as plastic bags.
Waste inventory
• In absence of dynamic waste inventory, long term planning for waste management becomes difficult. Each municipality should maintain a complete database for its waste management activities, particularly generation of waste (daily data), characteristics of waste (monthly data), processing facilities actually installed and operated and their performance (monthly data) and final disposal in a sanitary landfill (monthly data).
66 Green Growth and Sustainable Development in India
MSW to energy
• Viability of producing energy from MSW (woody waste, agricultural residues, food waste, waste papers and plastics) and extraction of landfill gas from ‘open but soon to be closed waste dumps’ cannot only treat the waste but also provide renewable source of energy to ‘energy starved’ cities. Technologies like anaerobic digestion (producing power as well as compost), use of refuse derives fuel and landfill gas will be explored for processing such waste. These processes also would be net GHG saver as compared to open dumping of waste which results in uncontrolled emission of methane.
Policy and regulatory measures
• Regulated targets for minimisation, reuse, recycling; and required targets for virgin materials displacement in production inputs can be thought of.
• There could be regulation relevant to the waste management ‘market‘, i.e., permitting/licensing requirements for waste handling, storage, treatment and final disposal; and recycled materials standards; facilities standards, including pollution control technologies.
• Policy interventions related to land-use policies and planning for siting waste processing and disposal infrastructure are needed.

6
The study provides a review of long-term sustainability challenges in India. Implementation of low carbon green growth strategies requires concerted policy action and interventions. Following key interventions areas are recommended to foster green growth and development in India:
Mainstreaming in decision-making processes
Climate resilient green growth strategies need to be looked as a cross-cutting issue, which requires policy coherence and inter-departmental coordination. For further mainstreaming of environmental sustainability in decision-making processes, the government can adopt green budgeting for India wherein all departments can prepare environmental budget statements – such green budgeting processes would encourage proactive mindsets among policy-makers as they would then reflect on activities undertaken in their respective departments.
Addressing data gaps
Collecting and synthesizing existing and new data is needed to facilitate preparation of strategies as well as evaluation of existing policy initiatives. Data for other parameters can be collected using existing management information systems.
Mobilizing finance
Financing is critical to the implementation of climate resilient green growth interventions. In addition to public finance, the role of the private sector and development institutions also becomes important.
Commissioning pilots and technology demonstration
Pilots need to be commissioned in opportunity areas. Technology demonstration should be encouraged in areas of renewable energy, waste management, renewable energy for cold storage applications, and natural resource management. This will help in up-scaling of the technologies.
Capacity building
Enhancing financial, technical, and institutional capacities of government as well as the voluntary sector is essential for the implementation of climate resilient green growth strategies. A detailed assessment of capacity building needs, sector by sector, becomes essential. A greater engagement between government, research & academia, non-profit organizations, and the private sector is needed to support implementation.
Understanding emerging issues
The country needs to better understand and be prepared for growth drivers, including urbanization and change in structural dynamics. According to emerging needs, skill development and vocationalisation of education is urgently needed. This is crucial for sustainable and inclusive development.
Conclusion


7
Annexure 1: Implications of Natural Resource Management on the Economy (SAM multipliers)
10% enhanced productivity change to paddy due to soil and water conservation measures
10% enhanced productivity change to wheat due to soil and water conservation measures
% change % change
Paddy (PDDY) 8.58 Paddy (PDDY) 0.03
Wheat (WHT) 0.25 Wheat (WHT) 7.33
OCER 0.16 OCER 0.17
CAS 0.15 CAS 0.07
ANH 0.69 ANH 0.16
Forestry and logging (FL) 0.04 Forestry and logging (FL) 0.02
Coal (CL) 0.38 Coal (CL) 0.20
Gas (GS) 0.53 Gas (GS) 0.27
Petro (PTRO) 2.83 Petro (PTRO) 1.23
TPL 0.10 TPL 0.05
Kerosene (KRSNE) 0.16 Kerosene (KRSNE) 0.07
Petrol (PTRL) 0.18 Petrol (PTRL) 0.08
Diesel (DIES) 0.16 Diesel (DIES) 0.07
Other Fuel (OTF) 0.16 Other Fuel (OTF) 0.07
Other industry (OTI) 0.28 Other industry (OTI) 0.14
Non Green Construction (NGC) 0.04 Non Green Construction (NGC) 0.02
Green Building (GB) 0.04 Green Building (GB) 0.02
Non-Hydro (NH) 0.39 Non-Hydro (NH) 0.20
Hydro (Hyd) 0.39 Hydro (Hyd) 0.20
Nuclear (Nucl) 0.34 Nuclear (Nucl) 0.17
Wind (Wnd) 0.76 Wind (Wnd) 0.39
Solar (Sol) 0.19 Solar (Sol) 0.10
Biomass (Bmss) 0.28 Biomass (Bmss) 0.14
Small Hydro (SMH) 0.24 Small Hydro (SMH) 0.12
TEM 0.13 TEM 0.06
Services (Ser) 0.06 Services (Ser) 0.03
Annexures

70 Green Growth and Sustainable Development in India
10% enhanced productivity change to paddy due to soil and water conservation measures
10% enhanced productivity change to wheat due to soil and water conservation measures
% change % change
Public administration (PA) 0.57 Public administration (PA) 0.43
Unskilled (Unskll) 0.40 Unskilled (Unskll) 0.16
Skilled (Skl) 0.16 Skilled (Skl) 0.08
Cap 48.40 Cap 36.11
r1 0.22 r1 0.12
r2 0.24 r2 0.13
r3 0.26 r3 0.14
r4 0.28 r4 0.15
r5 0.36 r5 0.19
u1 0.32 u1 0.19
u2 0.41 u2 0.24
u3 0.50 u3 0.29
u4 0.63 u4 0.38
u5 0.97 u5 0.61
Source: Modelling Estimates

71Annexures
Annexure 2: Clean coal technology roadmap for India
S.No. Technology Current status Short term action points
Medium term action points
Long term action points
Remarks
1 Coal beneficiation
• Benefits already demonstrated and proven in India
• Very small quantities currently beneficiated
• Implementation of preliminary technologies for washing and cleaning of coal
• Technology and know-how transfer
• Development and demonstration of indigenous technologies suitable to Indian coal
• Targeting use of considerable proportion of beneficiated coal
• Prioritizing use of beneficiated coal for power generation
• Support and incentive will be required for implementation
• Detailed assessment of complete life cycle of coal is needed Adequate policy
2 Pulverized coal combustion
Sub-critical technology
• Established technology in India, but inefficient operation compared to world standards
• Refurbishment of efficient component/sub-systems in existing plants
• Increased focus on renovation, modernization & Life Extension activities
• Complete phasing out of old plants
- • Very important from short term perspective
Super-critical technology
• Worldwide commercialized, few commercial installations in India as well
• Focus on implementation of UMPPs
• Technology transfer from foreign expertise
• Pilot installations and demonstration of indigenous technologies
• Performance improvements
• Suitability to indian coal and co-firing with other low grade fuels
• Cost-reduction in technology
- • Most preferable option for new capacity generation
• Implementations need to be facilitated with favourable policies
Ultra-supercritical technology
• Technology in development stage, No installations in India
• Closely monitoring global developments
• Pilot installation and demonstration of technology
• Indigenous technology development & demonstration
• Performance improvements
• Suitability to Indian coal and co-firing with other low grade fuels
• Technology is still under development globally. So rigid technology choice need not be done in short term
3 Fluidized Bed Combustion
• This technology is important assuming SO2 emission regulations would come in future

72 Green Growth and Sustainable Development in India
CFBC • Commercialized technology for smaller scale projects. Available in India
• Adaptation of technology for use of washery rejects
• Demonstration of large size plants
• Development of indigenous technology
• Performance improvements (supercritical conditions)
• Cost-reduction in technology
• Deployment of large size SC-CFBC plants
• Flexibility and suitability towards various indigenous fuels is also important
• Suitable to high ash content fuels
PFBC • Commercially available worldwide. No development in India
• Monitoring of global developments
• Feasibility assessment for India
• Pilot plant research and development
- • Leads to very low NO
X and SO
2
emissions• Suitable to high
ash content fuels
4 IGCC
Entrained Bed Gasifier
• Demonstration/commercial plants in U.S., Europe, Japan, China. Most advanced amongst three alternatives
• Monitoring of global developments with assessment for India
• Assessment for poly-generation plant using imported coal
• Demonstration of large size poly-generation plant
• Development of near zero emission plants along with CCS
• suitable to use with imported high-grade coals
Fluidized Bed Gasifier
• Demonstration stage worldwide. Mostly used for chemical production and poly-generation. Preliminary work on-going in India
• Pilot scale installations in India
• Assessment for Poly-generation plants using indigenous coal
• Indigenous technology development for large size poly-generation plants
• Cost-reduction in technology
• Development of other combined cycles
• suitable to use with low grade Indian coals and other fuels
Moving/Fixed Bed
• Emerging technology. Only few pilot installations in world
• Monitoring and collaboration with global expertise
• Pilot plant development
• Large scale demonstration in India
• Development of other combined cycles
5 Carbon capture and storage
• Technology in demonstration stage worldwide
• Detailed assessment of storage mechanisms and feasibility
• Detailed assessment of geological storage capacity
• Monitoring and collaboration with global expertise
• Pilot plant development in India
• Large scale demonstration in India
• Not very suitable for high ash coals

73Annexures
Annexure 3: Roadmap for green growth and the oil & gas
Upstream Midstream Downstream
Short term (~5-10 years)
• Mandatory disclosure of energy usage and carbon emissions in the exploration and production processes
• E&P contracts should include incentives for energy saving in operations
• Fiscal arrangements in the form of tax incentives to encourage reduction of flared gas
• Securing LNG imports for power generation
• Mandatory disclosure of energy usage and carbon emissions in transportation segment
• The creation of a national roadmap of pipeline based fuel transport that could be implemented in the medium and long term
• Mandatory disclosure of energy usage and carbon emissions in the transformation and distribution segment
• Adoption of a standard efficiency indicator, such as the Solomon Index, to promote competition in transformation efficiency
• Streamlining pricing and taxation related bottlenecks to improve ethanol supply to refineries
• Reducing and rationalising kerosene subsidies
Medium term (~15-20 years)
• Gas flaring reduction targets for the E&P industry
• Encouraging E&P companies to invest in the renewable sector through CDM projects
• Expanding the freight corridor network of the country for efficient transport of crude and processed products
• Mandatory efficiency improvement targets, as measured by the standard efficiency indicator
• Creation of a Green Gas Quadrilateral by setting up gas retail outlets to promote use of natural gas as a transport fuel
• Universal rural electrification to reduce kerosene use for lighting
• Creating necessary infrastructure to encourage usage of electric vehicles
Long term (~30-35 years)
• Creation of required technical and physical infrastructure to commercialise associated natural gas that would otherwise be flared
• Pursue viable and secure transnational pipelines to promote energy efficient import of oil and gas
• Expanding the Green Gas network on targeted inter-state highways of the country, where capacity permits
• Rationalising LPG subsidies and the promotion of electricity as a cooking fuel


8
ADB. 2014. Assessing the Costs of Climate Change and Adaptation in South Asia, 163 pp.
Aggarwal A, Paul V, and Das S. 2009. Forest Resources Degradation, Livelihoods and climate Change in Green India: Looking Back to Change Track. New Delhi: The Energy and Resources Institute.
Bose, I. 2010. How did the Indian Forest Rights Act, 2006, emerge? Improving Institutions for Pro-poor Growth [Online]. Department for International Development. Available online at <http://www.ippg.org.uk/papers/dp39.pdf>, last accessed on May 19, 2011.
Celine G, Hallegatte S, Crassous R. 2013. The Resilience of the Indian Economy to Rising Oil Prices as a Validation Test for a Global Energy-Environment-Economy CGE Model. CIRED Working Papers 2008–11.. Available online at <https://halshs.archives-ouvertes.fr/hal-00866431/document>, last accessed on December 12, 2014.
Census of India. 2011. Office of Registrar General and Census Commissioner, New Delhi: Government of India.
Central Pollution Control Board (CPCB). 2012. Status report on municipal solid waste management. New Delhi: CPCB.
Central Pollution Control Board (CPCB). 2014. National Ambient Air Quality Status and Trends 2012. [NAAQMS//2014–15]. New Delhi: CPCB.
Central Water Commission. 2014. Water Info. Available online at <http://www.cwc.nic.in/main/webpages/statistics.html>, last accessed on December 28, 2015.
Champernowne D. 1974. A Comparison of Measures of Inequality of Income Distribution. Economic Journal 84: 787–816.
Climate Technology Centre & Network (CTCN). 2014. Available online at <http://www.unep.org/climatechange/ctcn/>, last accessed on December 28, 2015.
De Beer, J, Worrell, E, and Blok, K. 1998. Long-term energy-efficiency improvements in the paper and board industry. Energy 23(1): 21–42.
Department of Economic & Social Affairs, United Nations. 2015. Transforming our world: The 2030 Agenda for Sustainable Development. Retrieved from Sustainable Development Knowledge Platform. Available online at <https://sustainabledevelopment.un.org/post2015/transformingourworld>, last accessed on December 28, 2015.
Dercon S. 2012. Is Green Growth Good for the Poor? World Bank: Policy Research Working Paper No. 6231, 1–22.
Dey, S, Di Girolamo, L, van Donkelaar, A, Tripathi, S N, Gupta, T, and Mohan, M. 2012. Variability of outdoor fine particulate (PM 2.5) concentration in the Indian Subcontinent: A Remote Sensing Approach. Remote Sensing of Environment, 127: 153–161.
Ekins P. 2001. Economic Growth and Environmental Sustainability: The Prospects for Green Growth. New York: Routledge.
Environmental Performance Index (EPI). 2014. Yale Center for Environmental Law & Policy/ Center for International Earth Science Information Network at Columbia University. Available online at <http://epi.yale.edu/epi>, last accessed on September 21, 2015.
Forest Survey of India (FSI). 2009. Indian State of Forest Report 2009, Forest Survey of India, Government of India, Dehradun.
References

76 Green Growth and Sustainable Development in India
Forest Survey of India (FSI). 2011. Indian State of Forest Report 2011, Forest Survey of India, Government of India, Dehradun.
Forest Survey of India (FSI). 2013. Indian State of Forest Report 2013, Forest Survey of India, Government of India, Dehradun.
Gadgil, M and Guha, R. 1993. This Fissured Land: An Ecological History of India. New Delhi: Oxford University Press.
GBD. 2012. Global Burden of Diseases Study 2010. The Lancet.
Government of India (GoI). 2013. Economic Survey 2012–13. New Delhi: Oxford University Press.
GoI. 2015. Economic Survey 2014–15. New Delhi: Oxford University Press.
GoI. 2001. Census of India. New Delhi: Office of Registrar General and Census Commissioner, GoI.
GoI. 2006. Population projection for India and states 2001–2026. New Delhi.
Goswami, B N, Venugopal, V, Sengupta, D, Madhusoodanan, M S, & Xavier, P K. 2006. Increasing trend of extreme rain events over India in a warming environment. Science, 314(5804): 1442–1445.
Hoffmann, U. 2011. Some reflections on climate change, green growth illusions and development space. United Nations Conference on Trade and Development.
International Energy Agency (IEA). 2013. World Energy Outlook 2013. Paris: IEA.
IEA. 2014a. CO2 Emissions from Fossil Fuel Combustion. Paris: IEA.
IEA. 2014b. World Energy Statistics 2014. Paris: IEA.
Institute for Financial Management and Research (IFMR). 2011. Environmental Sustainability Index for Indian States 2011. Centre for Development Finance. Chennai: Institute for Financial Management and Research.
Indian Network for Climate Change Assessment (INCCA). 2010. Climate Change and India: A 4 × 4 Assessment. A Sectoral and Regional Analysis for 2030s. New Delhi: Government of India.
International Monetary Fund. 2015. World Economic Outlook: Uneven Growth—Short- and Long-Term Factors. Washington (April).
International Union for Conservation of Nature (IUCN). 2015. Table 5: Threatened species in each country (totals by taxonomic group). Retrieved September 23, 2015, from The IUCN Red List of Threatened Species. Available online at <http://cmsdocs.s3.amazonaws.com/summarystats/2015_2_Summary_Stats_Page_Documents/2015_2_RL_Stats_Table_5.pdf>, last accessed on December 28, 2015.
Intergovernmental Panel on Climate Change (IPCC). 2013. Summary for Policymakers. In Climate Change 2013: The Physical Science Basis. Contribution of Working Group I to the Fifth Assessment Report of the Intergovernmental Panel on Climate Change [Stocker, T.F., D. Qin, G.-K. Plattner, M. Tignor, S.K. Allen, J. Boschung, A. Nauels, Y. Xia, V. Bex and P.M. Midgley (eds)]. Cambridge University Press, Cambridge, United Kingdom and New York, NY, USA.
Intergovernmental Panel on Climate Change (IPCC). 2014. Climate Change 2014: Impacts, Adaptation, and Vulnerability. Part A: Global and Sectoral Aspects. Contribution of Working Group II to the Fifth Assessment Report of the Intergovernmental Panel on Climate Change [Field, C.B., V.R. Barros, D.J. Dokken, K J Mach, M D Mastrandrea, T E Bilir, M. Chatterjee, K L Ebi, Y O Estrada, R C Genova, B Girma, E S Kissel, A N Levy, S MacCracken, P R Mastrandrea, and L L White (eds)]. Cambridge, United Kingdom and New York, NY, USA: Cambridge University Press, 1132 pp.
Kedia, S, Singh, R, and Sehjpal, R. 2013. Dr Pronab Sen’s interview on inclusive green growth. Green Growth and Development Quarterly, 1(2).
Kelkar V. 2012. Dr Vijay Kelkar on inclusive green growth. Green Growth and Development Quarterly, Volume 1, Issue 1. (Shailly Kedia, Interviewer). New Delhi: The Energy and Resources Institute (TERI).
Kothawale D R , Munot A A, Krishna Kumar K. 2010. Surface air temperature variability over India during 1901–2007, and its association with ENSO. Climate Research, 42: 89–104, doi:10.3354/cr00857.
Millennium Ecosystem Assessment (MEA). 2005. Ecosystems and Human Well-being. Retrieved June 12, 2014, from Millennium Ecosystem Assessment (MEA). Available online at <http://www.maweb.org/en/Framework.aspx>, last accessed on December 28, 2015.

77References
Ministry of Environment and Forests (MoEF). 2006a. Report of the National Forest Commission, New Delhi, India: Ministry of Environment and Forests, Government of India.
MoEF. 2006b. National Environment Policy 2006, Ministry of Environment and Forests, Government of India.
MoEF. 2010a. India: Greenhouse Gas Emissions 2007. New Delhi: MoEF, Government of India. Available online at <http://moef.nic.in/downloads/public-information/Report_INCCA.pdf>, last accessed on December 28, 2015.
MoEF. 2010b. National Mission for a Green India, (Under the National Action Plan on Climate Change). Draft submitted to Prime Minister’s Council on Climate Change [Online]. Available online at <http://moef.nic.in/downloads/public-information/GIM-Report-PMCCC.pdf>, last accessed on June 15, 2011.
MoEF. 2012. India’s Second National Communication to the United Nations Framework Convention on Climate Change. Available online at <http://unfccc.int/resource/docs/natc/indnc2.pdf>, last accessed on December 28, 2015.
MoEF. 2014a. Implementation Guidelines for National Mission for a Green India (GIM). Available online at < http://www.moef.gov.in/sites/default/files/GIM_Implementation_Guidelines.pdf>, last accessed on December 28, 2015.
MoEF. 2014b. India’s Fifth National Report to the Convention on Biological Diversity. New Delhi: MoEF, Government of India.
Ministry of Environment, Forest and Climate Change (MoEFCC). 2015. Development without destruction A saga of turnaround. Available online at <MoEFCC e-books: http://moefccebooks.in/>, last accessed on December 28, 2015.
Ministry of Law and Justice (MoLJ). 2007. The Scheduled Tribes and Other Traditional Forest Dwellers (Recognition of Forest Rights)Act, 2006, Gazette of India, Ministry of Law and Justice [Online]. Available online at <http://tribal.nic.in/writereaddata/mainlinkFile/File1033.pdf>, last accessed on March 15, 2010.
Ministry of Power (MoP). 2013. Smart Grid Vision and Roadmap for India. New Delhi: Ministry of Power, Government of India.
Ministry of Tribal Affairs (MoTA). 2015. Status report on implementation of the Scheduled Tribes and Other Traditional Forest Dwellers (Recognition of Forest Rights) Act, 2006 [for the period ending 31.01.2015], Ministry of Tribal Affairs, Government of India.
Muthukumara M, Markandya A, Sagar A and Sahin S. 2012. India’s economic growth and environmental sustainability : What are the tradeoffs ? Policy Research working paper no. WPS 6208. Washington DC, The World Bank. Available online at <http://documents.worldbank.org/curated/en/2012/09/16763166/india%C2%92s-economic-growth-environmental-sustainability-tradeoffs>, last accessed on December 28, 2015.
National Action Plan on Climate Change (NAPCC). 2008. National Action Plan on Climate Change. Prime Minister’s Office, Government of India, New Delhi.
NATCOM. 2012. India Second National Communication to the United Nations Framework Convention on Climate Change. Ministry of Environment & Forests, Government of India.
NIH. 2014. Hydrology and Water Resources Information System for India. Available online at <http://www.nih.ernet.in/rbis/india_information/annualWaterRequirements.htm>, last accessed on December 28, 2015.
National Transport Development Policy Committee (NTDPC). 2013. Railways. s.l. : Planning Commission.
Organisation of Economic Co-operation and Development (OECD). 2012. Green Growth and Developing Countries: Consultation Draft. Paris: OECD.
Pappu, A, Saxena, M, and Asolekar, S R. 2007. Solid wastes generation in India and their recycling potential in building materials. Building and Environment, 42(6): 2311–2320.
Pearce, D W, Markandya, A, and Barbier, E. 1989. Blueprint for a green economy (Vol. 1). Earthscan.
Planning Commission EG on NTFP. 2011. Available online at <http://planningcommission.gov.in/aboutus/committee/wrkgrp12/enf/wg_subntfp.pdf>, last accessed on December 28, 2015.
Planning Commission, 2013. Twelfth Five Year Plan (2012–2017): Faster, More Inclusive and Sustainable Growth, Volume I, New Delhi: SAGE.

78 Green Growth and Sustainable Development in India
Smith, K R. 2000. National burden of disease in India from indoor air pollution. Proceedings of the National Academy of Sciences, 97(24): 13286–13293.
Sood A and Banerjee P. 2012. The Political Economy of Green Growth in India. Social Policies for Inclusive and Sustainable Development by United Nations Research Institute for Social Development.
Srinivasan, T N, Rethinaraj, T S, and Sethi, S. 2012. How Fukushima is relevant to Kudankulam. The Hindu, March 9.
The Energy and Resources Institute (TERI). 2009. Looking Back to Change Track. New Delhi: TERI Press.
TERI. 2014a. The Energy & Environment Data Directory and Yearbook (TEDDY) 2013/14. New Delhi: The Energy and Resources Institute (TERI).
TERI, UC San Diego, California Air Resources Board. 2014b. ICAMP (India-California Air Pollution Mitigation Program).
TERI. 2015a. TERI Energy and Environment Data Diary and Yearbook (TEDDY) 2014/15. New Delhi: The Energy and Resources Institute.
TERI. 2015b. Understanding Energy Risks in India: Towards a Safe and Informed Energy Program (For the Atomic Energy Commission).
United Nations Economic and Social Commission for Asia and the Pacific (UNESCAP). 2007. Application of Economic Instruments for Green Growth. Background note for Second Policy Forum of the Seoul Initiative Network on Green Growth, UNESCAP.
National Transport Development Policy Committee (NTDPC). 2012. Working Group on Urban Transport. National Transport Development Policy Committee. New Delhi.
WHO. 2014. Media Centre: Air quality deteriorating in many of the world’s cities, May 7. Retrieved from World Health Organization from <http://www.who.int/mediacentre/news/releases/2014/air-quality/en/>, last accessed on December 28, 2015.
World Bank. 2006. India: Unlocking opportunities for forest dependent people, agriculture and rural development sector unit South Asia region, World Bank.
World Bank. 2013. Press Release: Green Growth is Necessary and Affordable for India, July 17. Retrieved from World Bank from <http://www.worldbank.org/en/news/press-release/2013/07/17/india-green-growth-necessary-and-affordable-for-india-says-new-world-bank-report>, last accessed on December 28, 2015.


The Ministry of Environment, Forest and Climate Change recognizes ‘poverty eradication along with green growth’ as central to India’s sustainable development narrative. This vision also embodies the cogent definition of green growth by the Thirteenth Finance Commission of India as a narrative that enables rethinking growth strategies with regard to their impact(s) on environmental sustainability and inclusiveness. The concept of green growth assumes centrality of socio-economic inclusivity to sustainable development in India. This document reviews the state of environment, energy and development implications. In order to understand linkages between development outcomes and green interventions, energy and macro-economic models are considered. A sectoral outlook informs interventions needed in energy and environment for green growth and development in India.
...towards global sustainable development