Towards equitable transit - McGill...
22
Link to published version: http://www.sciencedirect.com/science/article/pii/S0966692312003067 Foth, N., Manaugh, K., & El-Geneidy, A. (2013). Towards equitable transit: Examining transit accessibility and social need in Toronto, Canada 1996-2006. Journal of Transport Geography 29, 1-10. Towards equitable transit: Examining transit accessibility and social need in Toronto, Canada, 1996-2006 Nicole Foth 1 Kevin Manaugh 2 Ahmed M. El-Geneidy 3 Highlights ► Determines if benefits of Toronto’s public transit are equitably distributed. ► Develops social indicator for transportation studies. ► Measures relationship between social disadvantage and accessibility over time. ► The range in accessibility to jobs and transit travel time narrows over time. ► The most socially disadvantaged census tracts have better accessibility to jobs. ► The most socially disadvantaged census tracts have lower transit travel times. Transportation Research at McGill (TRAM) School of Urban Planning, McGill University, Suite 400, 815 Sherbrooke St. W. Montreal, Quebec, Canada H3A 2K6 1 nicole.foth(at)mail.mcgill.ca 2 kevin.manaugh(at)mail.mcgill.ca 3 ahmed.elgeneidy(at)mcgill.ca
Transcript of Towards equitable transit - McGill...

Link to published version:
http://www.sciencedirect.com/science/article/pii/S0966692312003067
Foth, N., Manaugh, K., & El-Geneidy, A. (2013). Towards equitable transit: Examining
transit accessibility and social need in Toronto, Canada 1996-2006. Journal of
Transport Geography 29, 1-10.
Towards equitable transit: Examining transit accessibility and
social need in Toronto, Canada, 1996-2006
Nicole Foth1 Kevin Manaugh2
Ahmed M. El-Geneidy3
Highlights
► Determines if benefits of Toronto’s public transit are equitably distributed. ► Develops social
indicator for transportation studies. ► Measures relationship between social disadvantage and
accessibility over time. ► The range in accessibility to jobs and transit travel time narrows over time. ►
The most socially disadvantaged census tracts have better accessibility to jobs. ► The most socially
disadvantaged census tracts have lower transit travel times.
Transportation Research at McGill (TRAM)
School of Urban Planning, McGill University, Suite 400, 815 Sherbrooke St. W.
Montreal, Quebec, Canada H3A 2K6
1 nicole.foth(at)mail.mcgill.ca
2 kevin.manaugh(at)mail.mcgill.ca
3 ahmed.elgeneidy(at)mcgill.ca

1
ABSTRACT
The location of transit infrastructure distributes publicly-funded benefits to residents throughout
a region. However, these benefits are not always distributed equally among different population
groups. This research seeks to determine whether the benefits of Toronto’s public transit system
are equitably distributed, and how these benefits change from 1996 to 2006 after the
implementation of several transit projects in the region. We develop a methodology using a
social indicator based on census tract level socio-economic characteristics to measure the
relationship between social disadvantage and accessibility to jobs and transit travel time in the
Toronto region over time. Transit equity is examined at three levels: spatially, temporally, and by
job type. We find the range in accessibility and transit travel time narrows over the 10-year
period. In addition, the most socially disadvantaged census tracts have statistically significantly
better accessibility and lower transit travel times relative to the rest of the region in both 1996
and in 2006. Our findings show that Toronto has a generally equitable transit system that benefits
those in social need, who are likely to gain the most from transit. The methodology proposed
presents a useful way to bring issues of social equity directly into the land use and transportation
planning process.

2
1. INTRODUCTION
Cities are constantly changing. Transportation networks develop, land-use patterns shift,
neighbourhoods transform, and residents relocate. New public transit infrastructure or services
can have profound and long-lasting effects on neighbourhoods. The positive impacts of new
transit infrastructure have been well established: better quality of life (Michalos and Zumbo,
1999), environmental, health, and activity patterns (Wilkinson and Marmot, 2003), and greater
accessibility and social inclusion, particularly for those without a car (Grengs, 2001; Lucas,
2006). But, due to the location of public transit infrastructure, spatial patterns of land use, and the
locations of different population groups, a key question is raised: who benefits from these
changes in land use and transportation? To answer this question, transportation planners must
understand the spatial distribution of new transit service and the populations being served.
In recent years, many researchers have started to examine explicitly the role that public
transport plays in providing mobility and accessibility to those without other options. Hine and
Mitchell find that "transport policy has been shaped by the notion of a universal disembodied
subject which has been aided by the reluctance of transport policy to include a social agenda"
(Hine and Mitchell, 2001 p. 319). Analyzing benefits by stratified socio-economic groups is one
way to address this. Greater attention to transit accessibility for socio-economically
disadvantaged groups may then influence the redistribution of transportation resources in an
urban region. Equity planning, defined by Krumholz and Forrester (1990), is about promoting a
wider variety of choices for people who have fewer ones. It is an important concept in
transportation planning because decision-makers often make choices between maximizing transit
user numbers or improving geographic coverage to less-populated areas (Walker, 2008). Yet,
ridership numbers should not be the only basis for decision-making. Social outcomes are just as
critical because socio-economic isolation intensifies when there are many transit-dependent
residents without decent access to destinations (Garrett and Taylor, 1999).
The benefits of a transportation system can perhaps be best understood through the
concepts of accessibility and mobility. Accessibility is defined as the amount of potential
opportunities for interaction (Hansen, 1959) and focuses on the importance of reaching desired
destinations, such as shopping, school, or work. Mobility, on the other hand, captures the ability
of movement between different places (Morris et al., 1979). This paper posits that transportation
benefits can be intuitively quantified as either a high number of destinations reachable within a
certain threshold, or a short travel time to preferred destinations. In addition to accessibility,
using travel time to real and observed employment locations has the benefit of moving beyond
the abstract sense of regional accessibility. This measure is more valuable to an individual than a
simple count of job opportunities—many of which may be undesirable or unattainable.
To assess equity, researchers in many fields use social indicators in order to identify
socially disadvantaged populations. This study generates a social indicator to compare the level
of accessibility to jobs and differences in transit travel times by social indicator levels in the
region of Toronto, Canada. Using a rich dataset composed of all home-work location pairs (at the

3
census tract level) for commuters in Toronto in 1996 and 2006, this research addresses the
following questions:
• What are the relationships between socio-economic status and accessibility and transit
travel time to jobs?
• How do these relationships change over time between 1996 and 2006?
This paper is organized into four sections. First, a literature review covers transportation
studies on demography, equity, and social indicators. Second, a brief context outlines the
background of Toronto, our study area. This is followed by a description of the methodology and
data used in the paper. Then we present the results for changes in accessibility and travel time by
social-indicator deciles between 1996 and 2006. Finally, the conclusion summarizes our findings
and discusses ideas for future research.
2. LITERATURE REVIEW
The literature review is divided into three sections. The first discusses the relationship between
transportation and population demographics, while the second examines the definitions of equity.
The third section highlights some of the uses of social indicators in research.
2.1 Transportation and demography studies
Researchers have examined the link between transportation and population demographics for
decades. Spatial mismatch theory posits that poor workers in American city centres live far from
and have difficulty accessing job-rich suburbs (Kain, 1968). Most of this work in the U.S.
context contends that areas with lower levels of accessibility relate to low income, black
households near the city centre (Grengs, 2001). However, several studies find this definition too
narrow for many circumstances. Many low-wage workers who live near city centres have high
access to jobs in downtown and its vicinity due to employment density and better transit
networks (Blumenberg and Hess, 2003; Hess, 2005). Glaeser et al. (2006) find that in older
cities, such as New York and Chicago, low-income earners disproportionately live in central
cities due to superior access to public transportation; nevertheless, the poor will relocate to the
suburbs if jobs begin to decentralize. In Toronto's Census Metropolitan Area, senior and middle
managers generally commute from the suburbs, while professionals, clerks, clerical workers,
intermediate service and sales workers tend to commute from areas near the city centre (Moos
and Skaburskis, 2009). Wachs and Kumagai (1973) find differences in accessibility by car to
jobs by income levels; interestingly, middle-income workers have the lowest job accessibility in
their study.
The concept of transportation mismatch may be a better explanation for why
disadvantaged neighbourhoods or populations sometimes have difficulty accessing jobs other
than the physical distance between home and work (Kawabata, 2003; Ong and Miller, 2005).

4
The term modal mismatch has also recently entered the literature (Blumenberg and Manville,
2004; Grengs, 2010). These related concepts refer to the difficulty of reaching desired
destinations without a car. While arguably already implicit in spatial mismatch theory,
transportation and modal mismatch explicitly capture the fact that two areas in a city may not be
separated by a great distance but may not be connected by reliable or viable public transit.
Therefore, those reliant on public transit may not be able to access certain areas easily while car
drivers can. This disparity can have a profound effect on life choices for those who do not own a
car. In his interviews with the working poor, Boshmann (2011) finds that workers select home
locations based on transportation, not job location, because travel dictates their ability to reach
jobs. Interestingly, the interviewees want better transit, not assistance with car ownership. Better
transit accessibility to jobs does in fact increase workers' chances of being employed and
working close to full-time hours (Kawabata, 2003). Not only does better job accessibility by
transit for lower-wage workers address equity concerns, but it aids a regional economy and
labour market by allowing for better worker-job matches across an urban region. Thus, the
studies discussed above show the important role that a public transit system can play in
generating job accessibility for socially disadvantaged workers.
Beginning with Alonso (1964), much work has examined the factors that underlie the
spatial distribution of various socio-economic population groups in a region. Glaeser et al (2006)
examine the role that transport plays in residential sorting of rich and poor residents of large
cities, finding that better public transportation in central cities explains much of this pattern.
However, this study was limited to the US context; cities in Canada and elsewhere may show
different patterns. The predominant pattern in many US cities has wealthier residents living in
the suburbs, while lower-income (and often minority) residents live in central cities. However, in
other countries this pattern can vary greatly—or even be reversed—with higher income residents
concentrated downtown (Bruekner et al., 1999). These patterns are subjected to change over time
due to changes in transportation systems or changes in land-use policies in a region.
Furthermore, few studies have examined changes in transportation networks and residential
patterns simultaneously.
2.2 Definitions of equity
With the importance of transit systems connecting homes to jobs established, planners must then
choose how to define equity. Determining equity is difficult because there is no standard
definition of distributional equity for transportation benefits (Martens et al., 2012).
Transportation benefits include high accessibility to opportunities, short travel time, long service
hours, short wait and transfer times, and routes that reach desired opportunities. Although it is
common to mention equity in transportation planning documents, very few explain how it is
measured or include performance measurements to follow up on this goal (Manaugh and El-
Geneidy, 2011). Even the equity goal itself is often vague (Martens et al., 2012). This is likely
due to debates over the definition of equity and the difficulty associated with implementing it in
practice (Preston, 2009). Nevertheless, there are several ways to approach equity. Horizontal

5
equity distributes benefits evenly to all groups. Some studies use this concept to define equity as
equality in terms of uniform spatial distribution in a geographical region or the same distance
from each resident to public facilities (Chang and Liao, 2011; Tsou et al., 2005). Yet measuring
uniform distribution or distance ignores varying population densities in regions and fails to
assess whether all residents require the same level of access to benefits. Therefore, these
approaches offer very limited insight into equity considerations. Trying to achieve complete
equal distribution of location-based benefits in space is nearly impossible. As cities naturally
develop centres and peripheries, it is unavoidable that residents will have unequal access to
opportunities (Martens, 2012).
To account for regional variation, it is more realistic to employ a range of acceptable
distribution. Martens, et al (2012) suggest measuring transportation equity with two principals,
based on Rawls’ Theory of Justice (1971). First, maximize the average access to transportation
while maintaining a certain minimum for all; second, maximize the average access while
constraining the range. These principles address the difficulty of defining equity as equality for
spatial benefits because it does not require a uniform amount of benefits for each person or group
(Martens et al., 2012). At the same time, aiming for a narrow range could diminish transportation
benefits for some in order to increase the benefits for others. To remedy this, in light of equity
planning, Murray and Davis (2001) emphasize that transit access should be available for
populations with the greatest potential need for subsidized transport. This is commonly called
vertical equity: benefits are intentionally provided for one group, often low income, who cannot
reasonably afford the price of transportation. Thus, we understand that an equitable distribution
of transportation benefits, particularly public transit, first maintains a decent level of benefits for
socially disadvantaged groups, then maximizes the average for all and narrows the range.
A number of studies evaluate transportation systems to determine gaps or find optimal
improvements with particular attention to equity principles or disadvantaged groups (Manaugh
and El-Geneidy, 2012). Evaluation methods include defining the levels of transit service to
evaluate disadvantaged populations’ access to public transit projects (Murray and Davis, 2001).
Another method determines changes in public transport access levels with hypothetical network
changes (Wu and Hine, 2003). A final method amends multi-criteria analysis to include
quantified equity impacts of potential projects (Thomopoulos et al., 2009). While useful, most of
these studies do not use actual home and work location data. To determine if a transit system is
equitable and serves socially disadvantaged populations, it is critical to understand where people
travel to and from in a region in addition to their level of access to public transport. Due to data
availability, actual commuting patterns are less commonly examined, and few studies look at
how regions change over time.
2.3 Social indicators in research
Since socially disadvantaged groups should receive some special attention in transportation
planning, defining these groups is a very important step. A common way to define these groups
is by using a social indicator. Social indicators identify underprivileged groups lacking access to

6
goods and resources compared to the rest of the society at large (Townsend et al., 1988). The use
of social indicators gained prominence in the health field in the 1980s (Bauman et al., 2006;
Jarman, 1983; Townsend et al., 1988). Social indicators have been widely used to measure a
variety of equity issues, including community deprivation (Sànchez-Cantalejo et al., 2008; Social
Disadvantage Research Centre, 2003). Research that uses social indicators uses several different
methods. The cumulative method is common, due to its ease in interpretation and simplicity in
calculations. Some social indicators are derived from sums of variables (Bauman et al., 2006),
while others weight variables equally (Townsend et al., 1988). Meanwhile some studies use the
total of standardized values (Manaugh and El-Geneidy, 2012). More complicated methods assign
various weighting to each variable (Social Disadvantage Research Centre, 2003). There are
different methods used in the literature for the weighting of variables. One weights the variables
by number of survey responses (Jarman, 1983), while another uses factorial analysis to
determine weights (Sànchez-Cantalejo et al., 2008). Choosing variables to be included in the
indicator is perhaps the most important aspect of generating a social indicator. Common
variables include unemployment, household income, elderly, children, and minorities (Church et
al., 2000; Dodson et al., 2006; Jarman, 1983; Manaugh and El-Geneidy, 2012; Stanley, 2012).
Some variables are debated in the literature. For example, car ownership , although quite
common, is considered a poor proxy for household deprivation (Townsend et al., 1988) since
owning a car may be necessary for disadvantaged households if they have poor access to public
transit, although owning a car can be a significant financial burden on some families (Johnson et
al., 2010). Moreover, car ownership may reflect population density more than ability to own a
car (Christie and Fone, 2003). Thus, variables in a social indicator must be selected to reflect the
characteristics the research is trying to reveal.
3. METHODOLOGY AND DATA
To assess the level of transit service being offered by the existing system to both socially
disadvantaged and non-socially disadvantaged groups, this study uses both mobility (travel time)
and accessibility (gravity-based) measures. A combination of both measures is useful since both
temporal and spatial distribution of opportunities is considered by commuters when deciding
mode choice, home location, and employment location (Morris et al., 1979). In this study,
differences between socially disadvantaged groups and the rest of the population, as well as
differences between 1996 and 2006, are measured through a series of paired and unpaired t-tests
conducted with statistical analysis software. Scatterplots and other graphs present, visualize, and
analyze the data. The following sections describe the data sources and methods used to complete
the analysis.
3.1 Social indicator
In order to generate the social indicator, it is first necessary to choose and locate the most
relevant variables. Using census-tract level data, it is important to note that not everyone in a
socially disadvantaged area is deprived, and likewise everyone who is deprived does not

7
necessarily live in a socially disadvantaged area (Townsend et al., 1988). The selection of
variables should be appropriate for the country (Sànchez-Cantalejo et al., 2008) in order to
compare differences in a country's population. For example, in Ireland Wu and Hine (2003)
compare Protestants' and Catholics' access to buses because these groups are spatially separated,
while Sanchez-Cantalejo et al. (2008) uses illiteracy in Spain to identify social disadvantage. For
this study, we use variables that are appropriate for a Canadian context. As this research has a
focus on employment accessibility, variables used in literature that are not directly related to
commuters are excluded from this study. These include seniors, youth, family type, disabled
persons, and health. We use four variables to measure social disadvantage in terms of commuting
to work including the two most common variables from the literature and two country-
appropriate variables (Statistics Canada, 1996a, 2006a):
• median household income,
• percentage of labour force that is unemployed,
• percentage of population that has immigrated within the last five years, and
• percentage of households that spend more than 30 percent of income on housing rent.
Percentages are used in order to compare census tracts with different numbers of residents (Ong
and Miller, 2005). In Canada, recent immigrants represent a significant group in major urban
centres. Almost three quarters of new immigrants settle in Toronto, Montreal, and Vancouver
(Heisz and Schellenberg, 2004). Partly as a result of the rules and regulations of Canada's
immigration system, immigrants have, on average, higher levels of education compared to
Canadian-born residents (Statistics Canada, 2004). Nevertheless, recent immigrants are more
likely to work for lower wages, be employed in lower-skilled jobs, and have higher rates of
unemployment compared to Canadian-born residents (Statistics Canada, 2004). In addition,
immigrants also have a greater propensity to commute to work by public transit. In Toronto, 36%
of immigrants who arrived within 10 years commute by transit compared to 21% of Canadian-
born commuters (Heisz and Schellenberg, 2004). Consequently, recent immigration status is a
relevant variable to include in a Canadian social indicator compared to education level that is
widely used in other countries.
The second country-appropriate variable is households spending more than 30 percent of
income on rent. The national housing agency, Canada Mortgage and Housing Corporation
(2011), defines housing affordability as spending no more than 30 percent of income on shelter
costs. Furthermore, renter households spend noticeably less on basic necessities, such as food,
shelter, and clothing, on average compared to owners (Luffman, 2006). Thus, the variable of
renter households that pay more than 30 percent of income on rent shows the burden of housing
costs relative to other expenses. It provides a more nuanced description of a household’s
economic situation than median income alone.
A correlation matrix is used to verify that the selected variables relate to each other and
describe similar groups. All four variables have a statistically significant Pearson correlation
(above 0.5) for 1996. For 2006, the four variables were significantly correlated as well, or highly

8
correlated (above 0.46). Each of the variables is standardized for comparison purposes, weighted
equally, and summed to create the indicator value. Some census tracts are excluded from the
analysis due to the fact that there is no residential land use, or the data are not reported in the
census. The indicator is grouped by deciles. Each decile contains 10% of the census tracts
included in the data. Grouping the social indicator scores by deciles shows if there are trends in
accessibility and transit travel time by social groups, with particular attention to the most socially
disadvantaged populations (decile 1).
3.2 Measuring job accessibility
Accessibility may be measured in many ways (see Geurs and van Wee (2004) for a thorough
review of accessibility measures). The gravity-based measure of accessibility attempts to model
travellers' perceptions that closer opportunities are more desirable than farther ones. Gravity-
based accessibility is often used in studies to measure accessibility to jobs (El-Geneidy and
Levinson, 2007; Hess, 2005; Manaugh and El-Geneidy, 2012). A negative exponential decay
curve is derived from Toronto area origin-destination survey data. The same travel decay
functions for 1996 and 2006 are used since separate 1996 data are unavailable. Employment
numbers were provided by Statistics Canada (Statistics Canada, 1996b, 2006b). The transit travel
time matrix was obtained from the University of Toronto at the Traffic Analysis Zones (TAZs)
level of analysis. Using a Geographic Information System (GIS), TAZ centroids are matched to
the closest census tract. For census tracts with multiple TAZs, an average of the TAZs’ transit
travel time is used. Analyzing census data from two separate years requires consistent
geographical boundaries. In 1996, there were 679 census tracts in the study area, and 821 in
2006. Census tracts are divided over time to maintain a given population in each. Using GIS, we
pair the 1996 and 2006 census tracts to compare each year.
Accessibility can be calculated for different categories of opportunities. In addition to
measuring accessibility to all jobs, this study analyzes accessibility to two job categories: low
skill jobs and all other jobs. This was accomplished using the ten job categories defined in the
National Occupational Classification matrix 2006 (Human Resources and Skills Development
Canada, 2009). Low-skill jobs are the four job categories that usually do not require university
education and include skills with on-the-job training (these are sales and service; trades,
transport, and equipment operators; primary industry; processing, manufacturing, and utilities).
All other jobs include the remaining five job categories that usually require university education
and do not require skills learned on the job (these are business, finance and administration;
natural and applied sciences; health; social science, education, government service, and religion;
arts, culture, and recreation).
3.3 Measuring transit travel time
In addition to the broad measure of regional accessibility, this study also captures estimated
transit travel time to actual work locations for all workers in the region. A dataset provided by

9
Statistics Canada (1996b, 2006b) contains the home and work locations for all workers in the
Toronto region at the census tract level. Commuters are allocated to one of the Statistics Canada
job categories and rounded to the nearest five (for confidentiality purposes). The modeled
commute times are very detailed. They include walking to and from transit locations, wait time,
time in vehicle, and transfer time. For this study, these times are summed together for a total
door-to-door commute time (see Day et al. (2010) for modeling transit times). Transit travel
times were modeled slightly differently in 1996 and 2006, with one preferring the closest stop,
and the other allowing for longer walking times. Thus, we use standardized values in this study
in order to be able to compare the relative standing of different groups. Commuters sharing the
same origin-destination pairs are given the same commute time, while actual commute times
vary in reality. Intra-census tract commuting is not included in the modeled commute times as it
represents a small portion of total commuters. Other aspects of travel, including trip-chaining,
other required stops, or route diversions, are not accounted for in the modeled journey-to-work
commute times by transit.
For some origin-destination pairs, the model calculated transit as an unfeasible mode.
This includes instances in which a trip would be “unnecessary” (that is, people are unlikely to
take a bus for 30 seconds and are more likely to walk instead) and a trip where access time
would be too long, making the trip unfeasible. To include these census tracts in the analysis for
year-to-year comparisons, we added walking time to the closest centroid with feasible transit
time in addition to the estimated travel time of this closest centroid. This was calculated using a
street network in GIS and using 5.47 km/hour walking speed (Krizek et al., 2012). It is important
to note that the transit travel time is the time it would take if a commuter took transit: this does
not imply that all commuters actually took transit. In this way we measure the potential transit
benefit that the current system offers to residents based on the locations of their home and work,
regardless of their actual selected mode. In this way we measure the potential benefit that the
current system offers to residents based on the locations of their home and work.
4. STUDY CONTEXT
The greater Toronto region is the most populated area in Canada. Total jobs increased from
2,236,381 in 1996 to 2,638,537 in 2006, while the total employed workforce increased from
2,161,339 in 1996 to 2,521,545 in 2006 (Statistics Canada, 1996b, 2006b). With a growing
workforce, accessibility to jobs for workers is increasingly important. Both population and
employment concentration show a suburbanization trend. This shift may be influenced by
construction of the tolled Highway 407 north of the city centre, as the highway offers faster
connections to residents in these areas and greater access to labour for businesses. The region,
particularly the City of Toronto, is well-served by bus, subway, and commuter rail transit.
During the study’s time period, there were two significant infrastructure additions to public
transit (Figure 1). The first is the 5.5 km Sheppard subway line with five new stations. The
second is seven new GO Train stations along the existing commuter train network. The bus
network experienced several changes as well, including express bus expansions. In the Toronto

10
region, fewer residents take transit as they live farther from the city centre. Around 53% of
commuters who live within 5 km of the city centre take transit; this drops to 10% when
commuters are located 15 to 20 km away from the city centre (Statistics Canada, 2005).
For our research, we selected the City of Toronto and the adjacent municipalities that have
significant public transit connections to the City of Toronto (Figure 1). The maps make use of
data and shapefiles from DMTI Spatial Inc. (2007) and ‘‘The Big Move: Transforming
Transportation in the Greater Toronto and Hamilton Area’’ (Metrolinx, 2008). While data were
available for the whole region, this area has the bulk of public transit routes, services, and
connections in the region. It also has the highest variation of income levels. Thus, this study
focuses on the most populous area with high levels of transit accessibility, including large areas
with limited transit accessibility could potentially skew the findings.
FIGURE 1 Context map

11
5. FINDINGS AND DISCUSSION
5.1 Regional trends
Figure 2 shows the spatial distribution of the social indicator deciles in both years. The lowest
social indicator decile, outlined in black, represents the most socially disadvantaged census
tracts. Some census tracts are excluded from the analysis and appear blank because land use is
not residential, or the data are not reported in the census. There is a clear suburbanization trend
for the most socially disadvantaged areas (Figure 2). From 1996 to 2006, the lowest decile
increased an average of 1.3 km in Euclidian distance from downtown. An increase of 0.61 in
standard deviation indicates that the lowest deciles are occupying more geographically diverse
areas in 2006 when compared to 1996. Around 36% of the lowest decile census tracts in 1996 are
no longer among the lowest decile of socially disadvantaged population in 2006. This can be
related to the suburbanization of the socially disadvantaged populations, which may be linked to
a variety of reasons including but not limited to increases in housing prices near the regional
centre, suburbanization of jobs, and improvements in the transit network. Thus, it is clear that the
most socially disadvantaged census tracts are increasingly located in geographically diverse
areas.
FIGURE 2 Social indicator deciles, 1996 and 2006
Figure 3 displays the spatial distribution of standardized accessibility to all jobs by
census tract, and standardized transit travel time (not minutes) for both years. These standardized
values compare each census tract’s standing to the region in the same year. The accessibility
maps show that higher levels of accessibility have spread outward in the region, with the core
accessing the greatest number of jobs. For transit travel time, these maps show that some areas
farther from the city centre have decreasing transit travel times relative to the rest of the region
from 1996 to 2006. Over the ten-year time period, more census tracts have viable access to

12
transit. In 1996, 4.4% of census tracts had over 85% of commuters with no viable transit options.
This decreased to 1.3% of the studied census tracts in 2006.
In 1996, we find that the more socially disadvantaged populations have greater
accessibility to jobs and shorter transit travel times compared to the rest of the region (Figure 4).
Ten years later, the more socially disadvantaged populations continue to have higher levels of
accessibility to jobs and shorter transit travel times compared to other census tracts in the study
area (Figure 4). The main finding from the data displayed in the scatterplots is that the socially
disadvantaged populations continue to have the most transit-related benefits in the region within
the 10-year period. Interestingly, Table 1 shows that the range of the relative social indicator
widens over the 10-year period. Some census tracts become much more socially disadvantaged
than others. Comparing 1996 and 2006 in Table 1, the median level of the relative gravity-based
accessibility to all jobs increases and the range narrows from 1996 to 2006.
FIGURE 3 Relative accessibility and relative transit travel time to jobs by deciles, 1996
and 2006

13
In terms of accessibility, this finding is consistent with the equity principles of increasing
benefit levels to all while narrowing the range. Thus, Toronto’s transit system is becoming more
equitable in terms of accessibility to jobs. When we analyze transit travel time, the range in times
narrows slightly (Table 1). Note that these values are relative scores, and do not represent units
of time such as minutes. However, in relative terms, commuters in 2006 have a slightly longer
median transit travel time compared to 1996 (Table 1). Therefore, while accessibility to jobs is
improving, transit travel time for actual home to work commutes is longer relative to the region
in 2006 compared to 1996. Longer commute times are a reflection of the transit system, as well
as changes in home and work locations, land use patterns, and commuters’ willingness to travel.
For instance, commuters may be more willing to commute to farther work locations with
improvements in transit system infrastructure and service. Overall, the range for both transit
travel time and accessibility narrows from 1996 to 2006. As well, the relative median level of
accessibility increased over time, while the relative median level of transit travel time increased
(longer travel times).
Accessibility Transit Travel Time
1
996
2
006
FIGURE 4 Comparing accessibility and transit travel time to the social indicator
-3-113-15 -10 -5 0 5 10 15Standardized
Accessibility Standardized Social Indicator -3-11
35-15 -10 -5 0 5 10 15Standardized
Transit TimeStandardized Social Indicator
-3-113-15 -10 -5 0 5 10 15Standardized
Accessibility Standarized Social Indicator -3-11
35-15 -10 -5 0 5 10 15Standardized
Transit TimeStandardized Social Indicator
A B
C D
14
TABLE 1 Standardized values of the dataset
YearYearYearYear MaxMaxMaxMaximumimumimumimum MinMinMinMinimumimumimumimum RangeRangeRangeRange MedianMedianMedianMedian Social indicatorSocial indicatorSocial indicatorSocial indicator 1996 9.67 -9.96 19.63 0.27 2006 9.63 -12.45 22.08 0.21 AccessibilityAccessibilityAccessibilityAccessibility 1996 2.09 -2.46 4.55 0.13 2006 1.92 -2.23 4.15 0.18 Transit Transit Transit Transit travel travel travel travel timetimetimetime**** 1996 7.00 -1.67 8.67 -0.22 2006 6.66 -1.86 8.52 -0.16 *note these are relative values, not units of time
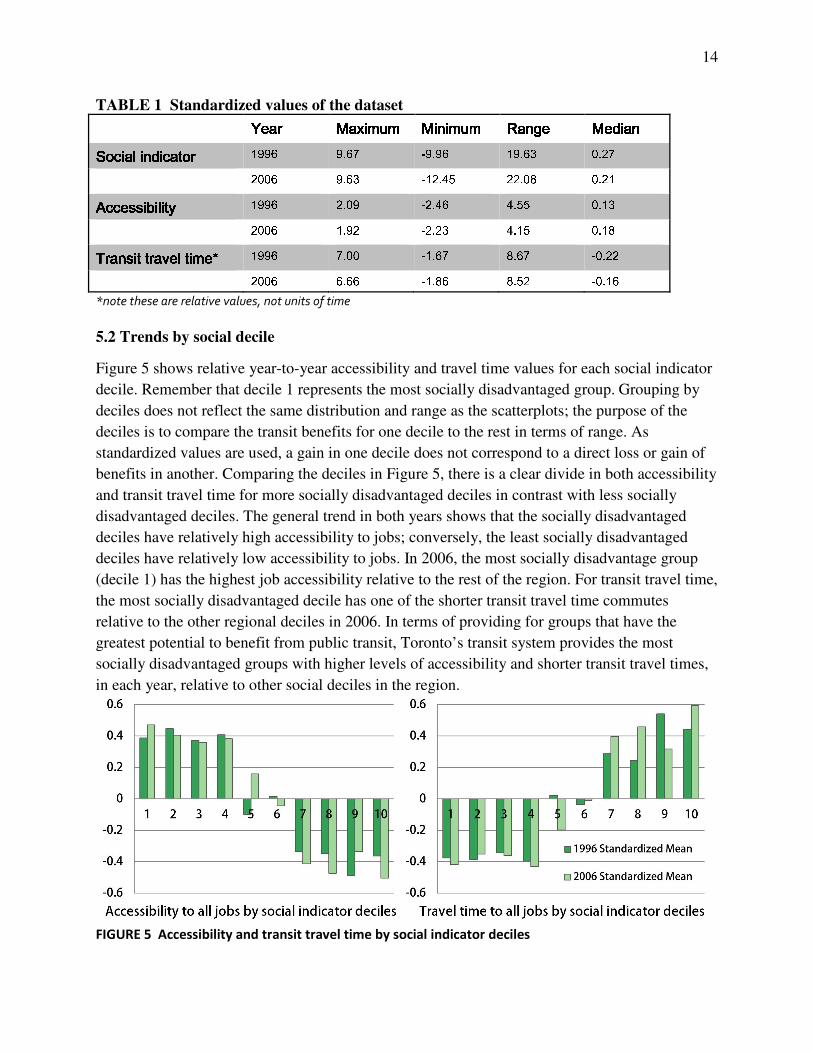
5.2 Trends by social decile
Figure 5 shows relative year-to-year accessibility and travel time values for each social indicator
decile. Remember that decile 1 represents the most socially disadvantaged group. Grouping by
deciles does not reflect the same distribution and range as the scatterplots; the purpose of the
deciles is to compare the transit benefits for one decile to the rest in terms of range. As
standardized values are used, a gain in one decile does not correspond to a direct loss or gain of
benefits in another. Comparing the deciles in Figure 5, there is a clear divide in both accessibility
and transit travel time for more socially disadvantaged deciles in contrast with less socially
disadvantaged deciles. The general trend in both years shows that the socially disadvantaged
deciles have relatively high accessibility to jobs; conversely, the least socially disadvantaged
deciles have relatively low accessibility to jobs. In 2006, the most socially disadvantage group
(decile 1) has the highest job accessibility relative to the rest of the region. For transit travel time,
the most socially disadvantaged decile has one of the shorter transit travel time commutes
relative to the other regional deciles in 2006. In terms of providing for groups that have the
greatest potential to benefit from public transit, Toronto’s transit system provides the most
socially disadvantaged groups with higher levels of accessibility and shorter transit travel times,
in each year, relative to other social deciles in the region.
FIGURE 5 Accessibility and transit travel time by social indicator deciles

15
We also group the data by three job categories: all jobs, low skill jobs, and all other jobs.
In all circumstances except one we did not observe that job categories had different results than
all jobs; therefore, we report the findings for all jobs. Using two sample t-tests, we compare
social indicator deciles in the same year. The t-tests demonstrate statistical significance of many
findings displayed in the scatterplots and bar graphs. In 1996, the lowest decile has better
accessibility, t(677) = 3.39, p = .001, and shorter transit travel times, t(166) = -6.14, p < .001,
compared to all other deciles in the same year, as well as compared to the highest decile for all
jobs (accessibility: t(134) = 4.71, p < .001, transit travel time: t(81) = -4.71, p < .001). As an
equitable transit system should first maintain a decent level of benefits for socially disadvantaged
groups, we find that in 1996 the Toronto transit system benefits the most socially disadvantaged
census tracts for their commutes to real job locations. A decade later, these findings are
consistent: the lowest decile has better relative accessibility, t(819) = 4.55, p < 0.001, and shorter
transit travel times, t(148) = -6.37, p < .001, compared to all other deciles in the same year, as
well as compared to the highest decile in 2006 for all jobs (accessibility: t(163) = 7.15, p < .001,
transit travel time: t(110) = -6.25, p < .001). Thus, relative to all other census tracts in the same
year, Toronto’s transit system provides the best accessibility to jobs and shortest transit travel
times for the most socially disadvantaged groups.
Regarding the changes over time, we compare the most socially disadvantaged decile in
each year to determine relative differences. The lowest social indicator decile in 1996 improves
in their level of accessibility to all jobs in 2006, compared to the other deciles, t(81) = -6.14, p <
.001. Likewise, the census tracts that became part of the lowest decile in 2006 improves their
accessibility to all jobs from their level in 1996, relative to the other deciles, t(81) = -4.64, p <
.001. This demonstrates that both the 1996 and 2006 most socially disadvantaged decile
improves their levels of accessibility to all jobs compared to the rest of the deciles.
In terms of commute time to all jobs, transit travel time significantly decreases over time
for the lowest 1996 decile, t(81) = 5.93, p < .001, and the lowest 2006 decile, t(81) = 4.12, p <
.001, compared to relative change in transit time for other deciles. Interestingly, the most socially
disadvantaged decile in 1996 did not experience a statistically significant decrease in transit
travel time to low skill jobs, t(80) = 1.86, p = .066. This finding is remarkable because low skill
jobs represent the type of jobs that this group would most likely need to reach. In addition,
comparing the lowest deciles in each year, accessibility to jobs and transit travel time did not
change significantly, t(148) = -0.77, p = 0.443, and t(148) = 0.51 , p = 0.61, respectively.
This means that regardless of the location of the lowest decile in each year, these census
tracts did not experience a significant change in accessibility to all jobs, low skill jobs, or all
other jobs, nor in transit travel time. From the results in the scatterplots, we know that the lowest
social indicator decile has higher accessibility to jobs and lower transit travel time compared to
all others. Not finding statistical significance simply confirms that the lowest decile in each year
continues to have relatively high accessibility and low transit travel time. Lastly, we test if
accessibility and transit travel time to different job categories changes at different rates over
time. We find that low skill jobs and all other jobs changes at the same rate (since it is not

16
significant) from 1996 to 2006 for both accessibility, t(818) = 1.38, p = 0.168, and transit travel
time, t(818) = 0.14, p = 0.892. Thus, one job category is not gaining transit benefits over another
during the ten-year period.
6. DISCUSSION
Past work has examined accessibility over time (El-Geneidy and Levinson, 2007) or
accessibility throughout the socio-economic spectrum (Fan et al., 2012). However, the authors
are not aware of previous work that has looked at both simultaneously. Furthermore, while much
work has examined accessibility and the location of socially-deprived neighbourhoods, this is the
first time to examine these relationships in the Canadian context. Baum-Snow & Kahn (2005) do
examine related issues but focus predominantly on transit ridership as opposed to how transport
system benefits are distributed throughout society.
Our findings for transit travel time and accessibility to jobs do not support that the spatial
mismatch hypothesis is present in Toronto from 1996 to 2006. While the more socially
disadvantaged census tracts are located nearer to the city centre in 1996, some move outward in
the region by 2006. Even with the changing dynamics of where socially disadvantaged areas
locate in the Toronto area, the most socially disadvantaged census tracts have better accessibility
to jobs and shorter transit travel times from home to work in 1996 and 2006 compared to all
other groups. This is similar to Hess’ (2005) finding that low-wage workers have the best
accessibility to jobs, while workers not in poverty have the lowest employment accessibility. In
terms of serving socially disadvantaged populations that stand to gain the most from public
transit, Toronto’s transit system and distribution of job locations serve these groups well. This
shows that vertical equity continues to be present. Interestingly, these findings are in contrast
with the conclusion of other research on Toronto (Hulchanski, 2007), which claims that low
income populations have lower job accessibility and longer access time to jobs compared to the
rest of the region. However, it should be noted that both the report’s study area and methodology
used to determine accessibility vary from our research. For example, the current research uses a
robust transit travel time model and actual home and work locations. Hulchanski (2007) uses two
simplified indicators: the number of subway stops in the area, and the number of jobs per 100
“working age population”, which only approximate job accessibility or travel time to work.
Thus, actual home-work location data provide a more accurate view of commuting patterns by
transit in the region.
In this research we have shown that the residential location of socially disadvantaged
commuters has been suburbanizing over the ten-year period. However, even with the trend of
suburbanization, the most socially disadvantaged deciles have relatively high accessibility to all
jobs and relatively low transit times compared the rest of the region in both 1996 and 2006. Over
time, the most socially disadvantaged decile shows a statistically significant increase in
accessibility and decrease in transit travel time. Current land use policies adopted by different
cities that encourage building high-end residential properties in downtown and its vicinity are
expected to have a similar effect on the suburbanization of the socially disadvantaged population.

17
Yet the network structure and its changes in these cities are what will determine if similar
changes in accessibility will be present or not. Overall, we find that Toronto’s transit system
moves towards a more equitable distribution of transit-related benefits from 1996 to 2006, while
maintaining a high level of these benefits for the most socially disadvantaged groups. In other
words, socially disadvantaged commuters continue to have a greater share of benefits, higher job
accessibility, and lower relative transit travel time compared to the rest of the region in both
years.
The results of this Canadian study differ from U.S. research on spatial mismatch
hypothesis and transportation or modal mismatch. Literature from American studies tends to find
that lower income groups have a more difficult time accessing jobs due to distance or
transportation and modal mismatch (Grengs, 2001; Kain, 1968; Kawabata, 2003; Ong and
Miller, 2005). Besides differences in commuting patterns from city to city, the results from this
study emphasize that residential and work locations of the socially disadvantaged shift over time.
As a result, transit providers need to be aware that transit systems must be flexible to adjust
alongside changing commuting patterns.
7. CONCLUSIONS
By focusing on how the measurable benefits of a transport system changes over time, as well as
who receives these benefits, this study offers an important analysis of how transport equity can
be better measured and understood. While this study did not find patterns that would suggest a
clear spatial or modal mismatch in Toronto, the authors certainly recognize that these patterns of
injustice do exist elsewhere. This paper’s primary contribution may be the generation of a new
social indicator tailored to transportation studies. The methodology simultaneously accounts for
differences in social need of the population, land use, and employment. The social indicator
shows groups by social disadvantage deciles and measures their accessibility to jobs and relative
transit travel time. It is a helpful tool for transportation planners when evaluating networks
because it identifies who benefits from a transit network. This methodology could be applied to
allow practitioners and researchers to locate where transit service levels should be maintained in
case of funding cutbacks. Consequently, when transit agencies face funding shortfalls, service
changes should be careful not to harm socially disadvantaged populations.
Every data set, model, and study has limitations. In this study, two models were used to
calculate transit travel time in each year that used different assumptions; thus we are limited to
using standardized values in order to compare year to year. An assumption in this study is that
shorter transit travel times are inherently better. This risks missing the importance of transfers,
comfort, and preference for modes of transit travel.
Suggestions for further research on this topic include comparisons of the mean and range
of accessibility and travel time for automobiles to transit. This would help quantify the
performance of Toronto’s transit system. Such an analysis would show whether one mode is
receiving an increase in transportation benefits compared to the other over time. In addition,
origin-destination survey data could be analyzed to gain a better understanding of whether

18
changes in transit systems encourage farther commutes. Another topic to pursue is to compare
changes in neighbourhood clusters and their relationship to transit using spatial auto-correlation
in a GIS. Finally, there are remaining questions regarding the relationship between changes in
accessibility and the process of neighbourhood change and gentrification over time in the region.
ACKNOWLEDGEMENT
The authors thank Metrolinx for providing Statistics Canada data, and Professor Khandker Nurul
Habib from the University of Toronto for providing the travel time matrix. The authors would
also like to thank the three anonymous reviewers for their valuable feedback on the earlier
version of the manuscript.

19
REFERENCES
Alonso, W., 1964. Location and land use: Towards a general theory of land rent. Harvard University
Press, Cambridge, MA.
Baum-Snow, N., Kahn, M., Voith, R., 2005. Effects of urban rail transit expansions: Evidence from
sixteen cities, 1970-2000. Brookings-Wharton Papers on Urban Affairs 147-206.
Bauman, L., Silver, E., Stein, R., 2006. Cumulative social disadvantage and child health. Pediatrics 117,
1321-1328.
Blumenberg, E., Hess, D., 2003. Measuring the role of transportation in facilitating welfare-to-work
transition : Evidence from three California counties. Transportation Research Record: Journal of
the Transportation Research Board 1859, 93-101.
Blumenberg, E., Manville, M., 2004. Beyond the spatial mismatch: Welfare recipients and transportation
policy. Journal of Planning Literature 19, 182-205.
Boschmann, E., 2011. Job access, location decision, and the working poor: A qualitative study in the
Columbus, Ohio metropolitan area. Geoforum 42, 671-682.
Bruekner, J., Thisse, J.-F., Zenou, Y., 1999. Why is central Paris rich and downtown Detroit poor?: An
amenity-based theory. European Economic Review 43, 91-107.
Canada Mortgage and Housing Corporation, 2011. Affordable housing. Accessed from:
http://www.cmhc-schl.gc.ca/en/corp/faq/faq_002.cfm#5
Chang, H., Liao, C., 2011. Exploring an integrated method for measuring the relative spatial equity in
public facilities in the context of urban parks. Cities 28, 361-371.
Christie, S., Fone, D., 2003. Does car ownership reflect socio-economic disadvantage in rural areas? A
cross-sectional geographical study in Wales, UK. Public Health 117, 112–116.
Church, A., Frost, M., Sullivan, K., 2000. Transport and social exclusion in London. Transport Policy 7,
195-205.
Day, N., Habib, K., Miller, E., 2010. Analysis of work trip timing and mode choice in the Greater
Toronto Area. Canadian Journal of Civil Engineering 37, 695-705.
DMTI Spatial Inc. 2007. CanMap Shapefiles.
Dodson, J., Buchanan, N., Gleeson, B., Sipe, N., 2006. Investigating the social dimensions of transport
disadvantage-I. Towards new concepts and methods. Urban Policy and Research 24, 433-453.
El-Geneidy, A., Levinson, D., 2007. Mapping accessibility over time. Journal of Maps 3, 76-87.
Fan, Y., Guthrie, A., Levinson, D., 2012. Impact of rail implementation on abor market accessibility: A
transportation equity perspective. Journal of Transport and Land Use. 5(3), 28-39. Garrett, M., Taylor, B., 1999. Reconsidering social equity in public transit. Berkeley Planning Journal 13,
6-27.
Geurs, K., Van Wee, B., 2004. Accessibility evaluation of land-use and transport strategies: review and
research directions. Journal of Transport Geography 12, 127-140.
Glaeser, E., Kahn, M., Rappaport, M., 2006. Why do the poor live in cities? The role of public
transportation. Journal of Urban Economics 63, 1-24.
Grengs, J., 2001. Does public transit counteract the segregation of carless households? Measuring spatial
patterns of accessibility. Transportation Research Record: Journal of the Transportation
Research Board, 3-10.
Grengs, J., 2010. Job accessibility and the modal mismatch in Detroit. Journal of Transport Geography
18, 42-54.
Hansen, W., 1959. How accessibility shapes land use. Journal of the American Institute of Planners 25,
73-76.
Heisz, A., Schellenberg, G., 2004. Public transit use among immigrants. Canadian Journal of Urban
Research 13, 170-191.
Hess, D., 2005. Access to employment for adults in poverty in the Buffalo–Niagara region. Urban Studies
42, 1177–1200.

20
Hine, J., Mitchell, M., 2001. Better for everyone? Travel experiences and transport exclusion. Urban
Studies 38, 319–332.
Hulchanski, J., 2007. The three cities within Toronto: Income polarization among Toronto's
neighbourhoods, 1970-2000, Research Bulletin. Centre for Urban and Community Studies,
University of Toronto, Toronto.
Human Resources and Skills Development Canada, Government of Canada, 2009. National occupational
classification matrix 2006. Accessed from:
http://www30.hrsdc.gc.ca/NOC/english/NOC/2006/html/Matrix.html
Krizek, K., Horning, J., El-Geneidy, A., 2007. Perceptions of accessibility to neighbourhood retail and
other public services, In: Geurs, K., Krizek, K.R., A. (Eds.), For accessibility and transport
planning: Challenges for Europe and North America. Edward Elgar, London, pp. 96-117.
Jarman, B., 1983. Identification of underprivileged areas. British Medical Journal 286, 1706-1709.
Johnson, V., Currie, G., Stanley, J., 2010. Measures of disadvantage: is car ownership a good indicator?
Social Indicators Research 97, 439–450.
Kain, J., 1968. Housing segregation, negro employment, and metropolitan decentralization. Quarterly
Journal of Economics 82, 175-197.
Kawabata, M., 2003. Job access and employment among low-skilled autoless workers in US metropolitan
areas. Environment and Planning A 35, 1651-1668.
Krumholz, N., Forrester, J., 1990. Making Equity Planning Work. Temple University Press, Philadelphia.
Lucas, K., 2006. Providing transport for social inclusion within a framework for environmental justice in
the UK. Transportation Research Part A 40, 801-809.
Luffman, J., 2006. Measuring housing affordability, Perspectives on Labour and Income. Statistics
Canada.
Manaugh, K., El-Geneidy, A., 2012. Who benefits from new transportation infrastructure? Using
accessibility measures to evaluate social equity in transit provision, In: Geurs, K., Krizek, K.R.,
A. (Eds.), For accessibility and transport planning: Challenges for Europe and North America.
Edward Elgar, London, pp. 211-227.
Martens, K., 2012. Justice in transport as justice in accessibility: applying Walzer’s ‘Spheres of Justice’ to
the transport sector. Transportation 39, 1035-1053.
Martens, K., Golub, A., Robinson, G., 2012. A justice-theoretic approach to the distribution of
transportation benefits: Implications for transportation planning practice in the United States.
Transportation Research Part A: Policy and Practice 46, 684-695.
Metrolinx 2008. The Big Move: Transforming Transportation in the Greater Toronto and Hamilton Area.
Accessed at: http://www.metrolinx.com/thebigmove/Docs/big_move/TheBigMove_020109.pdf
Michalos, A., Zumbo, B., 1999. Public services and quality of life. Social Indicators Research 48, 125-
157.
Moos, M., Skaburskis, A., 2009. Workplace restructuring and urban form: The changing national
settlement patterns of the Canadian workforce. Journal of Urban Affairs 32, 25-53.
Morris, J., Dumble, P., Wigan, M., 1979. Accessibility indicators for transport planning. Transportation
Research Part A 13, 91-109.
Murray, A., Davis, R., 2001. Equity in Regional Service Provision. Journal of Regional Science 41, 557-
600.
Ong, P., Miller, D., 2005. Spatial and transportation mismatch in Los Angeles. Journal of Planning
Education and Research 25, 43-56.
Preston, J., 2009. Epilogue: Transport policy and social exclusion—Some reflections. Transport Policy
16, 140-142.
Rawls, J., 1971. A Theory of Justice. Harvard University Press, Cambridge, MA.
Sànchez-Cantalejo, C., Ocana-Riola, R., Fernàndez-Ajuria, A., 2008. Deprivation index for small areas in
Spain. Social Indicators Research 89, 259–273.
Social Disadvantage Research Centre, 2003. Scottish indices of deprivation 2003. Social Disadvantage
Research Centre, Department of Social Policy and Social Work, University of Oxford, Oxford.

21
Stanley, J., 2012. Measuring social exclusion, In: Currie, G. (Ed.), New perspectives and methods in
transport and social exclusion research. Emerald Group Publishing, Bingley, pp. 77-90.
Statistics Canada, 1996a. Profile of Census Tracts.
Statistics Canada, 1996b. Commuting Flows Census Metropolitan Areas.
Statistics Canada, 2004. Study: Immigrants in Canada's urban centres, The Daily. Accessed at:
http://www.statcan.gc.ca/daily-quotidien/040818/dq040818b-eng.htm
Statistics Canada, 2005. Study: Work and commuting in urban centres, The Daily. Accessed at:
http://www.statcan.gc.ca/daily-quotidien/050601/dq050601a-eng.htm
Statistics Canada, 2006a. Profile of Census Tracts.
Statistics Canada, 2006b. Commuting Flows Census Metropolitan Area. Purchased from Statistics
Canada.
Thomopoulos, N., Grant-Muller, S., Tight, M.R., 2009. Incorporating equity considerations in transport
infrastructure evaluation: Current practice and a proposed methodology. Evaluation and
Program Planning 32, 351-359.
Townsend, P., Phillimore, P., Beattie, A., 1988. Health and deprivation: Inequality and the North. Croom
Helm, Beckenham, U.K.
Tsou, K., Hung, Y., Chang, Y., 2005. An accessibility-based integrated measure of relative spatial equity
in urban public facilities. Cities 22, 424-435.
Wachs, M., Kumagai, T., 1973. Physical accessibility as a social indicator. Socio-Economic Planning
Sciences 7, 437-456.
Walker, J., 2008. Purpose-driven public transport: creating a clear conversation about public transport
goals. Journal of Transport Geography 16, 436-442.
Wilkinson, R., Marmot, M., 2003. The Solid Facts: Social Determinants of Health, 2 ed. World Health
Organization, Copenhagen, Denmark.
Wu, B., Hine, J., 2003. A PTAL approach to measuring changes in bus service accessibility. Transport
Policy 10, 307-320.