Towards drug quantification in human skin with confocal Raman microscopy
8
Research paper Towards drug quantification in human skin with confocal Raman microscopy Lutz Franzen a , Dominik Selzer a , Joachim W. Fluhr b , Ulrich F. Schaefer a , Maike Windbergs a,c,d,⇑ a Biopharmaceutics and Pharmaceutical Technology, Saarland University, Saarbruecken, Germany b Center of Experimental & Applied Cutaneous Physiology (CCP), Charite, Berlin, Germany c PharmBioTec GmbH, Saarland University, Saarbruecken, Germany d Helmholtz-Institute for Pharmaceutical Research Saarland, Saarland University, Saarbruecken, Germany article info Article history: Available online 6 December 2012 Keywords: Confocal Raman microscopy Human skin Quantitative depth profiling Dermal drug delivery Skin surrogate Raman signal attenuation abstract Understanding the penetration behaviour of drugs into human skin is a prerequisite for the rational development and evaluation of effective dermal drug delivery. The general procedure for the acquisition of quantitative drug penetration profiles in human skin is performed by sequential segmentation and extraction. Unfortunately, this technique is destructive, labo- rious and lacks spatial resolution. Confocal Raman microscopy bares the potential of a chemically selec- tive, label free and nondestructive analysis. However, the acquisition of quantitative drug depth profiles within skin by Raman microscopy is impeded by imponderable signal attenuation inside the tissue. In this study, we present a chemical semi-solid matrix system simulating the optical properties of human skin. This system serves as a skin surrogate for investigation of Raman signal attenuation under controlled conditions. Caffeine was homogeneously incorporated within the skin surrogate, and Raman intensity depth profiles were acquired. A mathematical algorithm describing the Raman signal attenua- tion within the surrogate was derived from these profiles. Human skin samples were incubated with caf- feine, and Raman intensity depth profiles were similarly acquired. The surrogate algorithm was successfully applied to correct the drug profiles in human skin for signal attenuation. For the first time, a mathematical algorithm was established, which allows correction of Raman signal attenuation in human skin, thus facilitating reliable drug quantification in human skin by confocal Raman spectroscopy. Ó 2012 Elsevier B.V. All rights reserved. 1. Introduction The analysis of dermal drug absorption is essential for rational development of novel drug delivery options via the skin. As com- position and barrier function of animal skin differ from human skin, the transferability of absorption data from animal testing to human skin is exacerbated [1]. Thus, for appropriate in vitro testing of dermal drug delivery, excised human skin is the gold standard specimen. Human skin comprises a complex assembly of different layers with varying composition. The stratum corneum as the outermost skin layer represents the main barrier. Therefore, most in vitro pen- etration and permeation studies focus on this particular layer. According to the brick–mortar model, the stratum corneum con- sists of hydrophilic corneocytes surrounded by an extracellular li- pid matrix [2]. Most substances enter the skin via an extracellular pathway, diffusing along this lipid matrix. The analysis of penetra- tion processes in the different skin layers is a complex and labori- ous procedure which requires destructive segmentation as well as extraction [3]. Furthermore, the analytical determination lacks spatial resolution. Recently, biophysical techniques like confocal laser scanning microscopy [4] or two photon microscopy [5,6] have been proven to provide spatially resolved information about kinetics and depth of dermal penetration and molecular interaction with the skin. However, quantification of drug penetration by two photon microscopy is limited to autofluorescent drug compounds in the absence of dyes or labels. Linking drugs with dyes or labels poten- tially introduces changes in substance physicochemical properties like lipophilicity or molecular weight which impair reliable trans- ferability of the data. Unlike the former mentioned techniques, vibrational spectroscopy provides direct molecular information of the sample without labelling. For instance, infrared (IR) spectros- copy was successfully used to track lipids within the skin [7]. Unfortunately, the use of this technique is limited by its sensitivity to water. In this context, Raman spectroscopy as a complementary ana- lytical technique to IR spectroscopy bears a lot of potential for the analysis of skin. In contrast to IR, Raman spectroscopy is not 0939-6411/$ - see front matter Ó 2012 Elsevier B.V. All rights reserved. http://dx.doi.org/10.1016/j.ejpb.2012.11.017 ⇑ Corresponding author. Department for Biopharmaceutics and Pharmaceutical Technology, Saarland University, Campus A4.1, 66123 Saarbruecken, Germany. Tel.: +49 681 302 2358; fax: +49 681 302 4677. E-mail addresses: [email protected] (L. Franzen), d.selzer@mx. uni-saarland.de (D. Selzer), jochim.fl[email protected] (J.W. Fluhr), ufs@mx. uni-saarland.de (U.F. Schaefer), [email protected] (M. Windbergs). European Journal of Pharmaceutics and Biopharmaceutics 84 (2013) 437–444 Contents lists available at SciVerse ScienceDirect European Journal of Pharmaceutics and Biopharmaceutics journal homepage: www.elsevier.com/locate/ejpb
Transcript of Towards drug quantification in human skin with confocal Raman microscopy
European Journal of Pharmaceutics and Biopharmaceutics 84 (2013) 437–444
Contents lists available at SciVerse ScienceDirect
European Journal of Pharmaceutics and Biopharmaceutics
journal homepage: www.elsevier .com/locate /e jpb
Research paper
Towards drug quantification in human skin with confocal Raman microscopy
Lutz Franzen a, Dominik Selzer a, Joachim W. Fluhr b, Ulrich F. Schaefer a, Maike Windbergs a,c,d,⇑a Biopharmaceutics and Pharmaceutical Technology, Saarland University, Saarbruecken, Germanyb Center of Experimental & Applied Cutaneous Physiology (CCP), Charite, Berlin, Germanyc PharmBioTec GmbH, Saarland University, Saarbruecken, Germanyd Helmholtz-Institute for Pharmaceutical Research Saarland, Saarland University, Saarbruecken, Germany
a r t i c l e i n f o
Article history:Available online 6 December 2012
Keywords:Confocal Raman microscopyHuman skinQuantitative depth profilingDermal drug deliverySkin surrogateRaman signal attenuation
0939-6411/$ - see front matter � 2012 Elsevier B.V. Ahttp://dx.doi.org/10.1016/j.ejpb.2012.11.017
⇑ Corresponding author. Department for BiopharmTechnology, Saarland University, Campus A4.1, 66123+49 681 302 2358; fax: +49 681 302 4677.
E-mail addresses: [email protected] (D. Selzer), [email protected] (U.F. Schaefer), [email protected]
a b s t r a c t
Understanding the penetration behaviour of drugs into human skin is a prerequisite for the rationaldevelopment and evaluation of effective dermal drug delivery.
The general procedure for the acquisition of quantitative drug penetration profiles in human skin isperformed by sequential segmentation and extraction. Unfortunately, this technique is destructive, labo-rious and lacks spatial resolution. Confocal Raman microscopy bares the potential of a chemically selec-tive, label free and nondestructive analysis. However, the acquisition of quantitative drug depth profileswithin skin by Raman microscopy is impeded by imponderable signal attenuation inside the tissue.
In this study, we present a chemical semi-solid matrix system simulating the optical properties ofhuman skin. This system serves as a skin surrogate for investigation of Raman signal attenuation undercontrolled conditions. Caffeine was homogeneously incorporated within the skin surrogate, and Ramanintensity depth profiles were acquired. A mathematical algorithm describing the Raman signal attenua-tion within the surrogate was derived from these profiles. Human skin samples were incubated with caf-feine, and Raman intensity depth profiles were similarly acquired. The surrogate algorithm wassuccessfully applied to correct the drug profiles in human skin for signal attenuation. For the first time,a mathematical algorithm was established, which allows correction of Raman signal attenuation inhuman skin, thus facilitating reliable drug quantification in human skin by confocal Raman spectroscopy.
� 2012 Elsevier B.V. All rights reserved.
1. Introduction
The analysis of dermal drug absorption is essential for rationaldevelopment of novel drug delivery options via the skin. As com-position and barrier function of animal skin differ from humanskin, the transferability of absorption data from animal testing tohuman skin is exacerbated [1]. Thus, for appropriate in vitro testingof dermal drug delivery, excised human skin is the gold standardspecimen.
Human skin comprises a complex assembly of different layerswith varying composition. The stratum corneum as the outermostskin layer represents the main barrier. Therefore, most in vitro pen-etration and permeation studies focus on this particular layer.According to the brick–mortar model, the stratum corneum con-sists of hydrophilic corneocytes surrounded by an extracellular li-pid matrix [2]. Most substances enter the skin via an extracellular
ll rights reserved.
aceutics and PharmaceuticalSaarbruecken, Germany. Tel.:
e (L. Franzen), [email protected] (J.W. Fluhr), [email protected] (M. Windbergs).
pathway, diffusing along this lipid matrix. The analysis of penetra-tion processes in the different skin layers is a complex and labori-ous procedure which requires destructive segmentation as well asextraction [3]. Furthermore, the analytical determination lacksspatial resolution.
Recently, biophysical techniques like confocal laser scanningmicroscopy [4] or two photon microscopy [5,6] have been provento provide spatially resolved information about kinetics and depthof dermal penetration and molecular interaction with the skin.However, quantification of drug penetration by two photonmicroscopy is limited to autofluorescent drug compounds in theabsence of dyes or labels. Linking drugs with dyes or labels poten-tially introduces changes in substance physicochemical propertieslike lipophilicity or molecular weight which impair reliable trans-ferability of the data. Unlike the former mentioned techniques,vibrational spectroscopy provides direct molecular information ofthe sample without labelling. For instance, infrared (IR) spectros-copy was successfully used to track lipids within the skin [7].Unfortunately, the use of this technique is limited by its sensitivityto water.
In this context, Raman spectroscopy as a complementary ana-lytical technique to IR spectroscopy bears a lot of potential forthe analysis of skin. In contrast to IR, Raman spectroscopy is not

Table 1Chemical composition of the skin surrogate.
Ingredients Skin surrogate composition (w/w) [%]
Keratin 42Water 28Lipids 30
Cholesterol 9.3Triglycerides 9.3Fatty acids 11.4
Myristic acid 0.27Palmitic acid 4.35Stearic acid 1.23Oleic acid 4.14Linoleic acid 1.41
438 L. Franzen et al. / European Journal of Pharmaceutics and Biopharmaceutics 84 (2013) 437–444
constraint by the presence of water. By detecting the frequencyshift of scattered laser light after irradiating a sample, chemicallyselective information of the sample composition is acquired. Fur-thermore, combining Raman spectroscopy with a confocal micro-scope provides spatially resolved analysis of the sample. Thus,confocal Raman microscopy is a promising analytical approachfor label free and nondestructive follow-up of substances withinhuman skin.
Confocal Raman spectroscopy has already been applied for anal-ysis of skin hydration status [8], the effect of penetration enhancers[9] and the epidermal antioxidative potential [10,11] of skin. In vi-tro follow-up studies of metronidazole [12] and phospholipids [13]indicated the potential of confocal Raman microscopy for penetra-tion experiments.
Recently, several authors described mathematical models tocorrect depth determination uncertainties of confocal Ramanmicroscopy in polymer films [14–16]. Previous studies used thesemodels to improve accuracy of confocal depth determination inskin [17]. Determination of the exact depth of the focal plane insidehuman skin allows the accurate acquisition of qualitative drugpenetration follow-up profiles.
However, for rational development and in vitro testing of noveldermal drug delivery systems, quantitative analysis of drug pene-tration processes is mandatory. Unfortunately, so far drug quanti-fication within skin based on Raman microscopy is exacerbated byRaman signal attenuation, as with increasing depth a decrease inRaman signal intensity distorts reliable drug quantification. Oneapproach to overcome the influence of Raman signal attenuationin skin was already performed by relating the intensity of a drugRaman peak to the intensity of a skin derived Raman peak[12,18]. Unfortunately, potential inhomogenities due to the com-plex skin structure cannot be taken into consideration with thisrelative method. For reliable quantification of substances insidehuman skin by Raman microscopy, the exact extent of Raman sig-nal attenuation has to be determined. As Raman microscopy offersunique possibilities for nondestructive and chemically selectiveanalysis of substances in human skin, there is a strong need toovercome the analytical pitfalls exacerbating a reliable quantifica-tion of drugs in skin samples.
In this study, we present a novel approach to quantify Ramansignal attenuation in human skin. We successfully developed asimplified and reproducible surrogate system simulating theoptical properties of human stratum corneum. A comprehensivephysical characterisation comprising spectroscopic as well as ther-moanalytical methods was performed on the skin surrogate as wellas on its single components followed by a comparison to excisedhuman skin samples. Caffeine was homogeneously incorporatedwithin the skin surrogate, and Raman depth profiles of caffeinewere acquired. To address the issue of Raman signal attenuation,these profiles were mathematically fitted, and a correction algo-rithm was derived. Furthermore, excised human skin samples wereincubated with caffeine, and Raman intensity depth profiles wereacquired. Using the surrogate algorithm, these human skin inten-sity depth profiles were finally corrected for Raman signalattenuation.
2. Materials and methods
2.1. Skin surrogate fabrication
The main chemical components of human stratum corneumwere used to create a suitable skin surrogate, namely keratin asthe main protein component, purified water and a specific lipidmixture (Table 1). The lipid mixture was based on the work of Jaec-kle et al. [19] and contains fatty acids, cholesterol and triglyceridesin predefined ratios.
Keratin, extracted from rabbit fur (Chemos GmbH, Regenstau-fen, Germany), and purified water were mixed in a melamin bowlby dropwise adding water to the keratin powder. The fatty acidsmyristic acid (Edenor C 14�), palmitic acid (Edenor C 16�), stearicacid (Edenor C 18�), oleic acid (Edenor Ti05�) and linolic acid (Ede-nor SB05�), provided by Cognis Oleochemicals GmbH (Duesseldorf,Germany) were mixed and molten in a metal bowl at 75 �C forminga clear liquid and stirred during cooling down to room tempera-ture. This mixture is referred to as ‘fatty acids’ in the text. Triglyc-erides (Witepsol H5�, Sasol, Hamburg, Germany) and cholesterol(Sigma–Aldrich, Steinheim, Germany) were added, and the proce-dure was repeated as described. The cold lipid mixture was addedto the keratin in water and finally homogenised. First approachesto form a homogeneous matrix involved gentle physical mixingof the components in a melamin bowl leading to inhomogeneousdistribution of hydrophilic and lipophilic compounds and theincorporation of air bubbles. Further processing by means of a por-phyrisator improved homogeneity but multiplied the air contribu-tion, resulting in a foamy consistence.
The optimised fabrication process involves premixing in a mel-amin bowl and final homogenisation using a three-roll-mill. Theappearance of the final product was a creamy matrix of brightbrown colour. The refractive index of the skin surrogate was deter-mined using a Abbe-refractometer. The final skin surrogate wasstored at room temperature in a scintillation vial sealed withparafilm.
2.2. Incorporation of caffeine
Micronized caffeine (Sigma–Aldrich, Steinheim, Germany) as amodel drug was incorporated in the surrogate by adding the pow-dered substance to the keratin water mixture. The subsequent fab-rication of the skin surrogate follows the protocol as describedabove. A caffeine concentration of 30 mg caffeine per 1 g surrogatewas used as reported for penetration experiments in human skin[20]. This concentration could be detected by Raman microscopywithout any constraints. To verify the homogenous distributionof caffeine, the surrogate is spread on a glass slide, and at leastsix single spectra are recorded at random positions on the surro-gate surface.
2.3. Human skin preparation
Human skin was obtained from plastic surgery of female Cauca-sians (Department of Plastic and Hand Surgery, Caritaskranken-haus, Lebach, Germany). Only abdominal skin was used. Afterexcision, the stratum corneum was cleaned with purified water,and the fatty tissue was removed with a scalpel. The skin wasstored in impermeable polyethylene bags at �26 �C. For stratumcorneum isolation, the protocol of Kligman et al. [21] was followed.First, punches of 25 mm in diameter were taken from the frozen

Table 2Chemical composition of human stratum corneum [21–24].
Ingredients Human stratum corneum composition (w/w) [%]
Keratin 50–70Water 10–40Lipids 10–30
Fatty acids 9.1–26Cholesterol 14–28.9Triglycerides 0–25.2Sterolesters 0.7–10Ceramides 18.1–49.2Other 1.9–18
L. Franzen et al. / European Journal of Pharmaceutics and Biopharmaceutics 84 (2013) 437–444 439
skin and thawed to room temperature on a filter paper soaked withphosphate-buffered saline (composed of 0.2 g potassium chloride,8.0 g sodium chloride, 1.44 g disodium hydrogen phosphate dehy-drate and 0.2 g potassium dihydrogen phosphate in 1 l of purifiedwater). To separate the full-thickness skin in dermis and epidermis,the thawed sheets were immersed in 60 �C warm purified waterfor 90 s. Subsequently, the epidermis was peeled off using forceps.The dermis was disposed, and the heat-separated epidermis wastransferred into a petri dish. To separate stratum corneum andepidermis, the sheets were incubated in 0.15% (m/m) solution oftrypsin in phosphate-buffered saline at 37 �C. After 24 h, the rem-nants of viable epidermis were removed in purified water, and theremaining stratum corneum sheets were blotted dry between twofilter papers using a pressure roll. Placed on flat Teflon sheets thestratum corneum was freeze-dried (Martin Christ Gefriertrock-nungsanlagen GmbH, Osterode, Germany). The freeze drying pro-cess took at least 48 h, and the crimp stratum corneum sheetswere stored in a desiccator until further analysis.
2.4. Drug incubation experiments
For drug incubation experiments, the heat-separated epidermiswas incubated in a petri dish filled with caffeine solution (12.5 mg/ml) in phosphate-buffer for 12 h. After incubation, the skin waspatted dry and analysed. For Raman measurements, the skin wasfixed on glass slides covered with adhesive aluminium foil. Allmeasurements were performed at controlled temperature andhumidity conditions (21 �C/30–40% rh).
2.5. Differential scanning calorimetry (DSC)
Differential scanning calorimetry was used to study thermalcharacteristics of the surrogate and its single components. Samplesof 2–3 mg were sealed in hermetic aluminium pans (HermeticPans, TA Instruments, USA). After equilibration for 2 min at 20 �C,temperature ramps in the range of 20–160 �C were performed witha heating rate of 10 �C/min (DSC Q100, TA Instruments, USA). Forstability testing, the freshly prepared surrogate was sealed in her-metic pans and stored at room temperature (21 �C) for 1 or 5 days,respectively.
Fig. 1. Physical characterisation of the skin surrogate. DSC thermograms (A)comparison of skin surrogate and its single components (B) detail of the skinsurrogate thermogram upon storage (mean, n = 3).
2.6. Confocal Raman microscopy
For Raman analysis, the surrogate was filled in silicon ringsfixed on glass slides. This procedure results in a reproducible sur-rogate layer of 2 mm in thickness providing a plane upper surfacesuitable for single spectra and depth scan acquisition. Raman spec-tra were recorded using a confocal Raman microscope (al-pha300R+, WITec GmbH, Ulm, Germany). The excitation sourcewas a diode laser with a wavelength of 785 nm adjusted to a powerof 50 mW before the objective. Single spectra were recorded usinga 50� objective (Epiplan Neofluar, Zeiss, Germany) with a numericaperture of 0.8. For z-line-scans, the corresponding long distanceobjective (NA 0.55) was used. A confocal pinhole of 100 lm re-jected signals from out-of-focus regions. Raman spectra were re-corded in the range of 400–1780 cm�1 with a spectral resolutionof 4 cm�1 and 10 s acquisition time with 10 accumulations. Fordepth profiling, spectra were collected in 2 lm steps with threeaccumulations. All spectra were background subtracted and nor-malised to the most intense peak at 1430–1480 cm�1 representingm(CAH) vibration using WITec Project Plus software (WITec GmbH,Ulm, Germany).
2.7. Infrared Spectroscopy (IR)
Infrared spectroscopy analysis was performed with an attenu-ated total reflectance (ATR) unit (Spectrometer 400 ATR-IR, PerkinElmer, USA). Spectra were recorded in the range of 650–4000 cm�1
with 10 accumulations.
3. Results and discussion
3.1. Skin surrogate fabrication
The development of an artificial skin surrogate is based on theidea to establish a reproducible system simulating the opticalproperties of human stratum corneum. The surrogate compositionis based on the chemical composition of human stratum cor-neum. Human stratum corneum consists of keratin as the main

440 L. Franzen et al. / European Journal of Pharmaceutics and Biopharmaceutics 84 (2013) 437–444
structure-forming protein and the intercellular lipid bilayerscomprising fatty acids, triglycerides, cholesterol, ceramides andsterolesters (Table 2) [22–25].
Based on this information, a simplified composition of the mainstratum corneum components is chosen (Table 1). The use of othercomponents like ceramides appears to be unessential to achieveoptical similarity. Homogeneity of the skin surrogate is nonde-structively verified by Raman spectroscopy.
3.2. Physical characterisation and stability testing
To assure stability and reproducibility of the surrogate system, acomprehensive physical characterisation of single components andthe final surrogate is performed comprising thermoanalytical aswell as spectroscopic methods. Furthermore, stability testing isconducted to monitor potential changes upon storage.
DSC thermograms of the single components and the surrogateare recorded (Fig. 1A). The lipid components (fatty acids, choles-terol and triglycerides) exhibit clear endothermic peaks, represent-ing the respective melting processes. The denaturation of keratin isslightly visible around 110 �C, corresponding well with literature[26,27]. The skin surrogate shows one endothermic peak around35 �C, representing triglycerides and fatty acid melting. No addi-tional peaks indicating transformations during fabrication can beobserved.
As lipids are prone to undergo polymorphic transitions uponstorage [28], the surrogate is analysed in terms of physical stabil-ity. A certain amount of skin surrogate is transferred to hermeti-cally sealed DSC pans, and thermoanalysis is performed directly
Fig. 2. Vibrational characterisation of the skin surrogate. Raman spectra (A) skinsurrogate and its single components (B) comparison of virtual and real skinsurrogate.
after fabrication and after defined storage intervals in room condi-tions. The lipid melting endotherm around 35 �C depicts a slimshoulder directly after fabrication indicating transitional lipid for-mations which disappears after 1 day (Fig. 1B) [29]. No furtherchanges are observed up to 5 days after production. Based on theseresults, all studies are carried out 24 h after surrogate fabrication,to assure the absence of lipid transformations during experiments.
3.3. Raman microscopy analysis
As a basis for depth profiling, Raman analysis is performed onthe single components as well as on the skin surrogate (Fig. 2A).The surrogate spectrum reflects the vibrational information ofthe single components without the appearance of any additionalpeaks or shifts. The most intense peak is localised at 1430–1480 cm�1 representing m(CAH) vibration as expected [30]. In asecond step, the spectral information of the individual componentsis summed up to form a virtual surrogate spectrum. Based on theexact predefined ratios of the components in the skin surrogate,the single component spectra are combined by Eq. (1) to form a vir-tual spectrum of the ideal, homogeneous mixture without anyinteractions
FA � 0:114þ TG � 0:093þ Chol � 0:093þ K=W � 0:7 ð1Þ
(FA = fatty acids, TG = triglycerides, Chol = cholesterol, K/W = kera-tin/water)
The virtual spectrum perfectly reflects the original skin surro-gate spectrum without any shifted or additional peaks (Fig. 2B).Thus, the fabrication procedure does not affect the chemical
Fig. 3. Comparison of human stratum corneum and skin surrogate. (A) Raman spectra(B) IR spectra.
L. Franzen et al. / European Journal of Pharmaceutics and Biopharmaceutics 84 (2013) 437–444 441
structure and physical behaviour of the individual components.Furthermore, there is no hint for any interactions of the individualcomponents.
3.4. Comparison of skin surrogate and human skin
As the skin surrogate is supposed to serve as a model system toanalyse Raman signal attenuation in human skin, the essentialoptical properties of the surrogate have to coincide with humanskin.
As one of the main optical properties, the refractive index of theskin surrogate is determined using an Abbe-refractometer. The re-sult of 1.48 (n = 5) corresponds well with the refractive index ofhuman stratum corneum (1.51) [31]. Furthermore, IR and Ramanspectroscopy were used as complementary techniques to compareisolated human stratum corneum and skin surrogate with eachother (Fig. 3). With respect to its simplified composition, the surro-gate successfully mimics the spectroscopic properties of humanstratum corneum. The Raman spectra of the surrogate representthe bands of the major components of human stratum corneum(Fig. 3A), explicitly the amid I stretch band at 1650 cm�1 and thefatty acid CAC chains stretch at 1125 cm�1 [30]. The Raman peakat 1003 cm�1 is less pronounced in the surrogate due to overlap-ping of aromatic amino acid bands with the urea band in humanskin, as urea is not included in the surrogate composition.
IR spectroscopy cannot detect any differences between stratumcorneum and the skin surrogate except for peak broadening causedby higher water content in the skin surrogate (Fig. 3B).
Fig. 4. Raman spectral evaluation of an incorporated model drug. Raman spectra of (A)incubated with caffeine and caffeine (C) three different batches of skin surrogate withintensities of three different surrogate batches (mean ± SD, n = 6).
The surrogate closely mimics the optical properties of humanskin, which is an important prerequisite for simulating and evalu-ating Raman signal attenuation in human skin.
3.5. Incorporation of a model drug
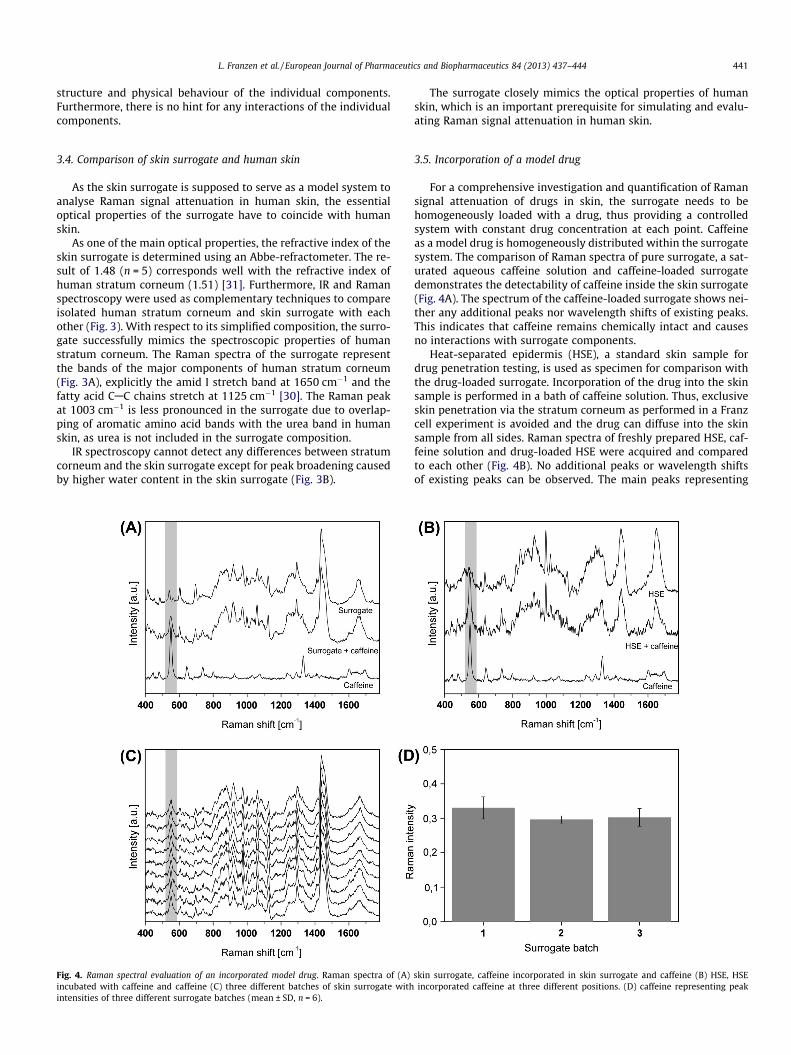
For a comprehensive investigation and quantification of Ramansignal attenuation of drugs in skin, the surrogate needs to behomogeneously loaded with a drug, thus providing a controlledsystem with constant drug concentration at each point. Caffeineas a model drug is homogeneously distributed within the surrogatesystem. The comparison of Raman spectra of pure surrogate, a sat-urated aqueous caffeine solution and caffeine-loaded surrogatedemonstrates the detectability of caffeine inside the skin surrogate(Fig. 4A). The spectrum of the caffeine-loaded surrogate shows nei-ther any additional peaks nor wavelength shifts of existing peaks.This indicates that caffeine remains chemically intact and causesno interactions with surrogate components.
Heat-separated epidermis (HSE), a standard skin sample fordrug penetration testing, is used as specimen for comparison withthe drug-loaded surrogate. Incorporation of the drug into the skinsample is performed in a bath of caffeine solution. Thus, exclusiveskin penetration via the stratum corneum as performed in a Franzcell experiment is avoided and the drug can diffuse into the skinsample from all sides. Raman spectra of freshly prepared HSE, caf-feine solution and drug-loaded HSE were acquired and comparedto each other (Fig. 4B). No additional peaks or wavelength shiftsof existing peaks can be observed. The main peaks representing
skin surrogate, caffeine incorporated in skin surrogate and caffeine (B) HSE, HSEincorporated caffeine at three different positions. (D) caffeine representing peak
442 L. Franzen et al. / European Journal of Pharmaceutics and Biopharmaceutics 84 (2013) 437–444
caffeine are indentified at 553 cm�1 (deformation d(O@CAN)) and1337 cm�1 (stretch m(C-N)) [32].
To verify a homogenous distribution of caffeine within the skinsurrogate, three different batches of surrogate are analysed by con-focal Raman microscopy. Fig. 4C depicts three representative spec-tra for each surrogate batch. The normalised peak intensities of thepeak representing caffeine range from 33.1 ± 3.2% to 29.7 ± 1.1%(n = 6) for the individual batches (Fig. 4D). Comparison of the meanpeak intensities of three surrogate batches revealed no statisticaldifference. This proves reproducible and homogeneous concentra-tions of caffeine inside the surrogate.
3.6. Drug depth profiling
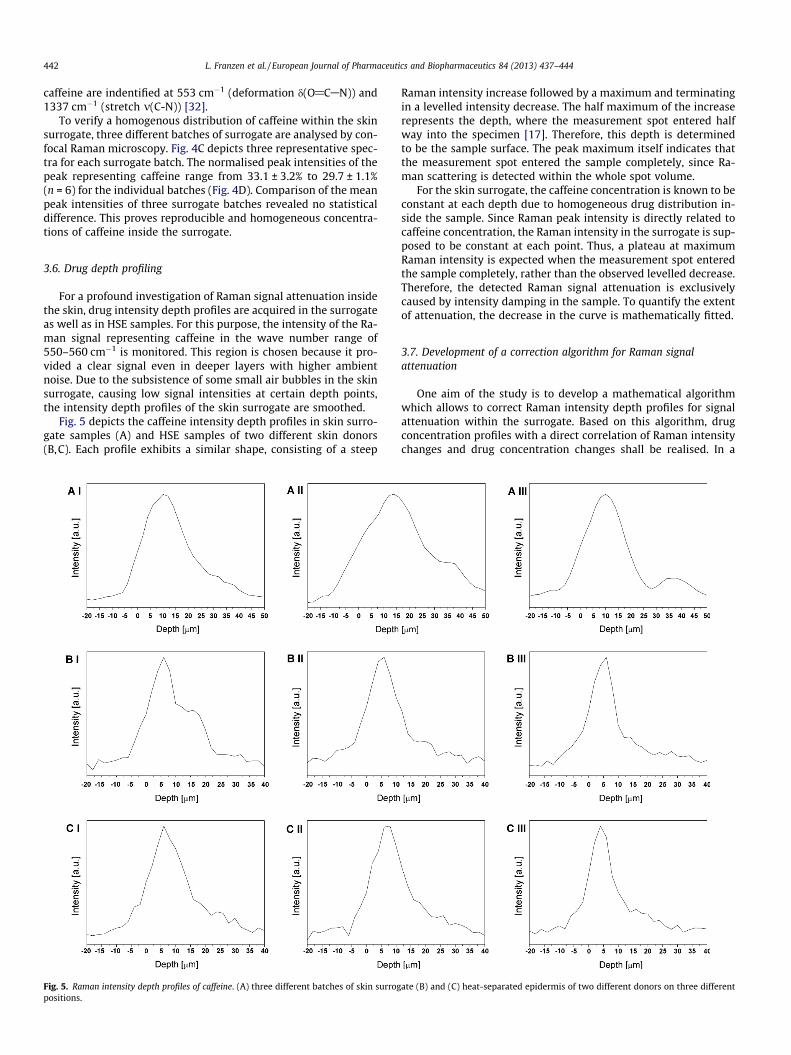
For a profound investigation of Raman signal attenuation insidethe skin, drug intensity depth profiles are acquired in the surrogateas well as in HSE samples. For this purpose, the intensity of the Ra-man signal representing caffeine in the wave number range of550–560 cm�1 is monitored. This region is chosen because it pro-vided a clear signal even in deeper layers with higher ambientnoise. Due to the subsistence of some small air bubbles in the skinsurrogate, causing low signal intensities at certain depth points,the intensity depth profiles of the skin surrogate are smoothed.
Fig. 5 depicts the caffeine intensity depth profiles in skin surro-gate samples (A) and HSE samples of two different skin donors(B,C). Each profile exhibits a similar shape, consisting of a steep
Fig. 5. Raman intensity depth profiles of caffeine. (A) three different batches of skin surrogpositions.
Raman intensity increase followed by a maximum and terminatingin a levelled intensity decrease. The half maximum of the increaserepresents the depth, where the measurement spot entered halfway into the specimen [17]. Therefore, this depth is determinedto be the sample surface. The peak maximum itself indicates thatthe measurement spot entered the sample completely, since Ra-man scattering is detected within the whole spot volume.
For the skin surrogate, the caffeine concentration is known to beconstant at each depth due to homogeneous drug distribution in-side the sample. Since Raman peak intensity is directly related tocaffeine concentration, the Raman intensity in the surrogate is sup-posed to be constant at each point. Thus, a plateau at maximumRaman intensity is expected when the measurement spot enteredthe sample completely, rather than the observed levelled decrease.Therefore, the detected Raman signal attenuation is exclusivelycaused by intensity damping in the sample. To quantify the extentof attenuation, the decrease in the curve is mathematically fitted.
3.7. Development of a correction algorithm for Raman signalattenuation
One aim of the study is to develop a mathematical algorithmwhich allows to correct Raman intensity depth profiles for signalattenuation within the surrogate. Based on this algorithm, drugconcentration profiles with a direct correlation of Raman intensitychanges and drug concentration changes shall be realised. In a
ate (B) and (C) heat-separated epidermis of two different donors on three different

L. Franzen et al. / European Journal of Pharmaceutics and Biopharmaceutics 84 (2013) 437–444 443
further step, this algorithm is meant to be transferred to skin sam-ples for correction of Raman depth profiles.
Based on the drug intensity depth profiles of three different skinsurrogates, a mean curve is calculated. In a next step, the decreasein this curve is fitted by an exponential function (Eq. (2)). Exponen-tial fitting is chosen because it is well known that the intensity ofelectromagnetic waves undergo an exponential decay while pene-trating an opaque medium. To avoid overfitting, a simple exponen-tial relationship as presented in Eq. (2) is applied. Least-squareregression with constraint D(0) = 1 is applied to mathematicallydescribe the decrease of the curve, with x being the depth alongthe z-axis and x = 0 being the skin surrogate surface (Eq. (3)). Theresidual standard error is 0.04848, and the variables a and b aresignificantly different from zero with p < 0.001.
DðxÞ ¼ a � exp � xb
� �þ ð1� aÞ ð2Þ
Fig. 7. Corrected Raman intensity depth profiles in human skin. (A) And (B) Ramanmean intensity depth profile for caffeine in two skin donors (solid line, mean ± SD,n = 3) and corrected profile (dashed line, mean ± SD, n = 3).
DðxÞ ¼ 0:9997 � exp � x15:7581
� �þ ð1� 0:9997Þ ð3Þ
Eq. (3) exhibits a representative mathematical description ofthe drug Raman signal intensity attenuation within the skin surro-gate. Fig. 6 displays the mean drug intensity depth profile and thecorresponding fit by Eq. (3). Apart from three single data pointswithin the steepest decrease of the profile, the fit accurately de-scribes the recorded data points. To obtain caffeine intensity depthprofiles based on a direct correlation of Raman signal intensity andcaffeine concentration in the surrogate, the attenuation basedintensity decrease has to be mathematically corrected.
Using the attenuation function (Eq. (3)), a signal re-attenuatingalgorithm is derived with f(x) representing the detected Ramanintensity at depth x and R(x) representing the corrected signal.
RðxÞ ¼ f ðxÞ þ 1� ð0:9997 � exp � x15:7581
� �þ ð1� 0:9997ÞÞ ð4Þ
As the skin surrogate simulates the optical properties of humanstratum corneum, the re-attenuation algorithm is supposed to cor-rect drug intensity profiles in human skin samples.
For a proof of concept, the re-attenuation algorithm is used torecalculate caffeine intensity depth profiles in HSE samples. Fig. 7shows mean drug intensity depth profiles of two different skin do-nors based on raw spectral data without any correction (solid line)and after processing the data with the re-attenuation algorithm(dashed line). After correction, the drug intensity depth profiles ex-hibit a nearly constant Raman intensity, which is directly related tothe drug concentration within the whole skin sample. A slight
Fig. 6. Description of Raman signal attenuation. Raman mean drug intensity depthprofile based on three skin surrogates (solid line mean ± SD, n = 3) and fittingfunction (dashed line).
deviance in the first part of the corrected profile is based on a lessaccurate fit in the steep part of the profile as discussed above. Incu-bating the skin samples in caffeine solution bypasses the stratumcorneum barrier function and facilitates complete soaking withdrug solution. Assuming that the caffeine concentration is constantin each depth in the HSE, a calculated constant intensity of the caf-feine related Raman peak over depth in HSE is plausible. These re-sults indicate the suitability of the correction algorithm to correctintensity depth profiles for Raman signal attenuation. So far, moststudies relied on a relative method to deal with Raman signalattenuation. By applying this method, the intensity of a drug repre-senting Raman peak is related to a skin derived Raman peak[12,18]. Inconsistencies in Raman peak intensity due to inhomoge-nities in skin composition are potentially causing uncertainties indepth profiling. Against this background, our novel approach toquantify Raman signal attenuation in a chemical skin surrogatewith similar optical properties as skin and to generate a mathemat-ical algorism for correction of attenuation within skin samplesbares many advantages. This approach potentially allows directquantification of drug in skin tissue solely based on Raman peakintensities. Furthermore, the influence of skin inhomogenities onconcentration depth profiles is reduced. On the contrary to theexisting qualitative and semi-quantitative studies, this facilitatesthe acquisition of quantitative concentration depth profiles[9,12]. However, future studies will investigate the applicabilityof the developed algorithm on a larger set of different drug depthprofiles including a comparison of Raman spectroscopy resultsand established standard techniques for the acquisition of drugdepth profiles.
444 L. Franzen et al. / European Journal of Pharmaceutics and Biopharmaceutics 84 (2013) 437–444
4. Conclusion
An artificial skin surrogate simulating the optical properties ofhuman skin is successfully developed. Evaluation of the skin surro-gate by comprehensive physical characterisation with thermal andvibrational spectroscopy techniques proves reproducibility andstability of the system. A mathematical function for the descriptionof Raman signal attenuation in the skin surrogate is derived basedon an incubation study with a homogeneously distributed modeldrug and is applied to approximate drug intensity depth profilesin human skin. This novel mathematical approach serves as a firststep towards a reliable acquisition of quantitative drug concentra-tion profiles by confocal Raman microscopy.
Acknowledgements
The Authors would like to thank K.-H. Kostka from Caritaskran-kenhaus Lebach for providing freshly excised skin, D. Neumannfrom Scientific Consilience and T. Hahn for the fruitful discussions.
References
[1] F.P. Schmook, J.G. Meingassner, A. Billich, Comparison of human skin orepidermis models with human and animal skin in in vitro percutaneousabsorption, Int. J. Pharm. 215 (2001) 51–56.
[2] P.M. Elias, Epidermal lipids, barrier function, and desquamation, J. Invest.Dermatol. 80 (1983) S44–S49.
[3] H. Wagner, K.H. Kostka, W. Adelhardt, U.F. Schaefer, Effects of various vehicleson the penetration of flufenamic acid into human skin, Eur. J. Pharm.Biopharm. 58 (2004) 121–129.
[4] Y.Y. Grams, L. Whitehead, P. Cornwell, J.A. Bouwstra, Time and depth resolvedvisualisation of the diffusion of a lipophilic dye into the hair follicle of freshunfixed human scalp skin, J. Control Release 98 (2004) 367–378.
[5] B. Yu, K.H. Kim, P.T.C. So, D. Blankschtein, R. Langer, Visualization of oleic acid-induced transdermal diffusion pathways using two-photon fluorescencemicroscopy, J. Invest. Dermatol. 120 (2003) 448–455.
[6] M.S. Roberts, Y. Dancik, T.W. Prow, C.A. Thorling, L.L. Lin, J.E. Grice, T.A.Robertson, K. Konig, W. Becker, Non-invasive imaging of skin physiology andpercutaneous penetration using fluorescence spectral and lifetime imagingwith multiphoton and confocal microscopy, Eur. J. Pharm. Biopharm. 77 (2011)469–488.
[7] C.H. Xiao, D.J. Moore, C.R. Flach, R. Mendelsohn, Permeation ofdimyristoylphosphatidylcholine into skin – structural and spatial informationfrom IR and Raman microscopic imaging, Vib. Spectrosc. 38 (2005) 151–158.
[8] P.J. Caspers, G.W. Lucassen, H.A. Bruining, G.J. Puppels, Automated depth-scanning confocal Raman microspectrometer for rapid in vivo determination ofwater concentration profiles in human skin, J. Raman Spectrosc. 31 (2000)813–818.
[9] M. Melot, P.D.A. Pudney, A.M. Williamson, P.J. Caspers, A. Van Der Pol, G.J.Puppels, Studying the effectiveness of penetration enhancers to deliver retinolthrough the stratum cornum by in vivo confocal Raman spectroscopy, J.Control Release 138 (2009) 32–39.
[10] J. Lademann, P.J. Caspers, A. van der Pol, H. Richter, A. Patzelt, L. Zastrow, M.Darvin, W. Sterry, J.W. Fluhr, In vivo Raman spectroscopy detects increasedepidermal antioxidative potential with topically applied carotenoids, LaserPhys. Lett. 6 (2009) 76–79.
[11] G. Zhang, C.R. Flach, R. Mendelsohn, Tracking the dephosphorylation ofresveratrol triphosphate in skin by confocal Raman microscopy, J. Control.Release 123 (2007) 141–147.
[12] A. Tfayli, O. Piot, F. Pitre, M. Manfait, Follow-up of drug permeation throughexcised human skin with confocal Raman microspectroscopy, Eur. Biophys. J.Biophy. 36 (2007) 1049–1058.
[13] C.H. Xiao, D.J. Moore, M.E. Rerek, C.R. Flach, R. Mendelsohn, Feasibility oftracking phospholipid permeation into skin using infrared and ramanmicroscopic imaging, J. Invest. Dermatol. 124 (2005) 622–632.
[14] N. Everall, Depth profining with confocal Raman microscopy, Part I,Spectroscopy 19 (2004) 22–27.
[15] N. Everall, Depth profiling with confocal Raman microscopy, Part II,Spectroscopy 19 (2004) 16–27.
[16] C. Sourisseau, J.L. Bruneel, J.C. Lassegues, In-depth analyses by confocal Ramanmicrospectrometry: experimental features and modeling of the refractioneffects, J. Raman Spectrosc. 33 (2002) 815–828.
[17] O. Piot, A. Tfayli, M. Manfait, Confocal Raman microspectroscopy on excisedhuman skin: uncertainties in depth profiling and mathematical correctionapplied to dermatological drug permeation, J. Biophotonics. 1 (2008) 140–153.
[18] M. Forster, M.A. Bolzinger, D. Ach, G. Montagnac, S. Briancon, Ingredientstracking of cosmetic formulations in the skin: a confocal Raman microscopyinvestigation, Pharm. Res. 28 (2011) 858–872.
[19] E. Jaeckle, U.F. Schaefer, H. Loth, Comparison of effects of different ointmentbases on the penetration of ketoprofen through heat-separated humanepidermis and artificial lipid barriers, J. Pharm. Sci. – Us 92 (2003) 1396–1406.
[20] S. Hansen, A. Henning, A. Naegel, M. Heisig, G. Wittum, D. Neumann, K.H.Kostka, J. Zbytovska, C.M. Lehr, U.F. Schaefer, In-silico model of skinpenetration based on experimentally determined input parameters. Part I:Experimental determination of partition and diffusion coefficients, Eur. J.Pharm. Biopharm. 68 (2008) 352–367.
[21] A.M. Kligman, E. Christophel, Preparation of isolated sheets of human stratumcorneum, Arch. Dermatol. 88 (1963) 702–705.
[22] H.J. Yardley, R. Summerly, Lipid-composition and metabolism in normal anddiseased epidermis, Pharmacol. Therapeut. 13 (1981) 357–383.
[23] P.W. Wertz, D.C. Swartzendruber, K.C. Madison, D.T. Downing, Compositionand morphology of epidermal cyst lipids, J. Invest. Dermatol. 89 (1987) 419–425.
[24] B.C. Melnik, J. Hollmann, E. Erler, B. Verhoeven, G. Plewig, Microanalyticalscreening of all major stratum-corneum lipids by sequential high-performancethin-layer chromatography, J. Invest. Dermatol. 92 (1989) 231–234.
[25] M.A. Lampe, A.L. Burlingame, J.A. Whitney, Human stratum corneum lipids:characterization and regional variations, J. Lipid Res. 24 (1983) 120–130.
[26] S.M. Al-Saidan, B.W. Barry, A.C. Williams, Differential scanning calorimetry ofhuman and animal stratum corneum membranes, Int. J. Pharm. 168 (1998)17–22.
[27] P.A. Cornwell, B.W. Barry, J.A. Bouwstra, G.S. Gooris, Modes of action of terpenepenetration enhancers in human skin differential scanning calorimetry, small-angle X-ray diffraction and enhancer uptake studies, Int. J. Pharm. 127 (1996)9–26.
[28] M. Windbergs, C.J. Strachan, P. Kleinebudde, Investigating the principles ofrecrystallization from glyceride melts, Aaps. Pharmscitech. 10 (2009) 1224–1233.
[29] N. Garti, K. Sato, Crystallization Processes in Fats and Lipid Systems, first ed.,CRC Press, 2001.
[30] B.W. Barry, H.G.M. Edwards, A.C. Williams, Fourier-transform raman andinfrared vibrational study of human skin – assignment of spectral bands, J.Raman Spectrosc. 23 (1992) 641–645.
[31] A. Knuttel, M. Boehlau-Godau, Spatially confined and temporally resolvedrefractive index and scattering evaluation in human skin performed withoptical coherence tomography, J. Biomed. Opt. 5 (2000) 83–92.
[32] M. Baranska, L.M. Proniewicz, Raman mapping of caffeine alkaloid, Vib.Spectrosc. 48 (2008) 153–157.