Towards Detecting Crop Diseases and Pest by Supervised Learning1 · 2016-10-27 · Towards...
22
Ing. Univ. Bogotá (Colombia), 19 (1): 207-228, enero-junio de 2015. ISSN 0123-2126 Towards Detecting Crop Diseases and Pest by Supervised Learning 1 Hacia la detección de plagas y enfermedades en cultivos a través de aprendizaje supervisado 2 David Camilo Corrales 3 Juan Carlos Corrales 4 Apolinar Figueroa-Casas 5 doi: 10.11144/Javeriana.iyu19-1.tdcd How to cite this article: D. C. Corrales, J. C. Corrales and A. Figueroa-Casas, “Towards detecting crop diseases and pest by supervised learning”, Ing. Univ., vol. 19, no. 1, pp. 207-228, Ene.-Jun., 2015. http://dx.doi.org/10.11144/Javeriana.iyu19-1.tdcd 1 Submitted on: February 3 rd , 2014. Accepted on: November 20 th , 2014. This article comprises the state of art of doctoral research by David Camilo Corrales, MSc., with scientific support to the Telematics Engineering Group (GIT), Environmental Study Group (GEA) of the University of Cauca and Colciencias. 2 Fecha de recepción: 3 de febrero de 2014. Fecha de aceptación: 20 de noviembre de 2014. Este artículo es el resultado de la revisión del estado del arte del trabajo de doctorado de David Camilo Corrales, MSc., el cual cuenta con el apoyo científico del Grupo de Ingenieria Telemática (GIT), Grupo de Estudios Ambientales (GEA) de la Universidad del Cauca y Colciencias. 3 Informatic Engineer, MSc Telematics Engineering and PhD (c). Telematics Engineering in University of Cauca. Popayán, Colombia. PhD Scholarship holder of Colciencias. E-mail: dcorrales@unicauca.edu.co 4 Electronic Engineer, University of Cauca. MSc. Telematics Engineering, University of Cauca. PhD. Computer Science, Versailles Saint-Quentin-en-Yvelines University. Full Professor Universidad of Cauca. Popayán, Colombia. E-mail: jcorral@unicauca.edu.co 5 Biologist, University of Cauca. MsCc. Ecology, University of Barcelona. PhD. Biologic Science, University of Valencia. Full Professor Universidad of Cauca. Popayán, Colombia. E-mail: apolinar@unicauca.edu.co
Transcript of Towards Detecting Crop Diseases and Pest by Supervised Learning1 · 2016-10-27 · Towards...
Ing. Univ. Bogotá (Colombia), 19 (1): 207-228, enero-junio de 2015. ISSN 0123-2126
Towards Detecting Crop Diseases and Pest by Supervised Learning1
Hacia la detección de plagas y enfermedades en cultivos a través de aprendizaje supervisado2
David Camilo Corrales3
Juan Carlos Corrales4
Apolinar Figueroa-Casas5
doi: 10.11144/Javeriana.iyu19-1.tdcd
How to cite this article:D. C. Corrales, J. C. Corrales and A. Figueroa-Casas, “Towards detecting crop diseases and pest by supervised learning”, Ing. Univ., vol. 19, no. 1, pp. 207-228, Ene.-Jun., 2015. http://dx.doi.org/10.11144/Javeriana.iyu19-1.tdcd
1 Submitted on: February 3rd, 2014. Accepted on: November 20th, 2014. This article comprises the state of art of doctoral research by David Camilo Corrales, MSc., with scientific support to the Telematics Engineering Group (GIT), Environmental Study Group (GEA) of the University of Cauca and Colciencias.2 Fecha de recepción: 3 de febrero de 2014. Fecha de aceptación: 20 de noviembre de 2014. Este artículo es el resultado de la revisión del estado del arte del trabajo de doctorado de David Camilo Corrales, MSc., el cual cuenta con el apoyo científico del Grupo de Ingenieria Telemática (GIT), Grupo de Estudios Ambientales (GEA) de la Universidad del Cauca y Colciencias.3 Informatic Engineer, MSc Telematics Engineering and PhD (c). Telematics Engineering in University of Cauca. Popayán, Colombia. PhD Scholarship holder of Colciencias. E-mail: [email protected] Electronic Engineer, University of Cauca. MSc. Telematics Engineering, University of Cauca. PhD. Computer Science, Versailles Saint-Quentin-en-Yvelines University. Full Professor Universidad of Cauca. Popayán, Colombia. E-mail: [email protected] Biologist, University of Cauca. MsCc. Ecology, University of Barcelona. PhD. Biologic Science, University of Valencia. Full Professor Universidad of Cauca. Popayán, Colombia. E-mail: [email protected]
208 David Camilo Corrales, Juan Carlos Corrales, Apolinar Figueroa-Casas
Ing. Univ. Bogotá (Colombia), 19 (1): 207-228, enero-junio de 2015
Abstract The climate change has caused threats to agricultural production; the extremes of temperature and humidity, and other abiotic stresses are contributing factors to the etiology of disease and pest on crops. About the matter, recent research efforts have focused on predicting disease and pest crops using techniques such as supervised learning algorithms. Therefore in this paper, we present an overview of supervised learning algorithms commonly used in agriculture for the detection of pests and diseases in crops such as corn, rice, coffee, mango, peanut, and tomato, among others, with the aim of selecting the algorithms that give the best performance for the agricultural sector.
Keywords supervised learning; classifier; crop; disease; pest; agri-culture
ResumenEl cambio climático ha generado amenazas a la produc-ción agrícola. Los cambios extremos de temperatura y humedad y otros factores abióticos de estrés contribuyen a la aparición de enfermedades y plagas en los cultivos. Por ello, recientes esfuerzos de investigación se han enfocado en la predicción de plagas y enfermedades en cultivos, haciendo uso de algoritmos de aprendizaje supervisado. En este artículo se presenta una revisión bibliográfica de los algoritmos de aprendizaje supervisado más utilizados para la detección de plagas y enfermedades en cultivos como maíz, arroz, café, mango, maní y tomate, con el objetivo de seleccionar los algoritmos con mejor rendimiento para el sector agrícola.
Palabras clave aprendizaje supervisado; clasificador; cultivo; enfermedad; peste; agricultura
computer science
209Towards detecting crop diseases and pest by supervised learning
Ing. Univ. Bogotá (Colombia), 19 (1): 207-228, enero-junio de 2015
1. IntroductionNowadays the agricultural yield is affected by global change factors such as: new varieties in the crops, changes in consumer taste, natural causes, and/or anthropogenic events [1], [2]. In this sense, the agricultural is exposed to global change effects, where its vulnerability depend of factors such as abiotics, biolog-ics, socioeconomics and regionals [3]-[5], thus different land areas on earth are potentially vulnerable to climate change and direct and indirect productivity loses, contributing also to the occurrence of diseases and pest [6].
On the other hand exist an area of machine learning, which builds models for regression and classification named supervised learning. These algorithms learn through examples (data training), with the goal of predict or detect a new input data [7]. The outcome of learning process (training) of the algorithm (Bayesian networks, Decision tree, Support vector machine, Artificial neural networks, K-nearest neighbors, etc) is to create a classifier (hypothesis or model) for data set training.
The idea of using information as examples, has inspired researchers in apply supervised learning algorithms for predicting future diseases and pest in agri-cultural crops [8]. For example, data collected about weather conditions, soil fertility properties, and physical properties and management of a coffee crop, can be used to predict the rust infection rate still in the early days of the harvest [9]. In the same way, weather conditions such as the minimum and maximum levels of temperature, humidity and rainy days can help estimating the behavior of rice blast [10].
This article focuses on presenting a review of supervised learning algorithms commonly used in agriculture for the detection of pests and diseases in crops such as corn, rice, coffee, mango, tomato, wheat, peanut, grape, kiwi and fungal. The remainder of this paper is organized as follows: Section 2 describes the main supervised learning algorithms; Section 3 refers to the most relevant research of this topic; Section 4 reviews algorithms used in the agricultural sector; and Section 5 presents the conclusions.
210 David Camilo Corrales, Juan Carlos Corrales, Apolinar Figueroa-Casas
Ing. Univ. Bogotá (Colombia), 19 (1): 207-228, enero-junio de 2015
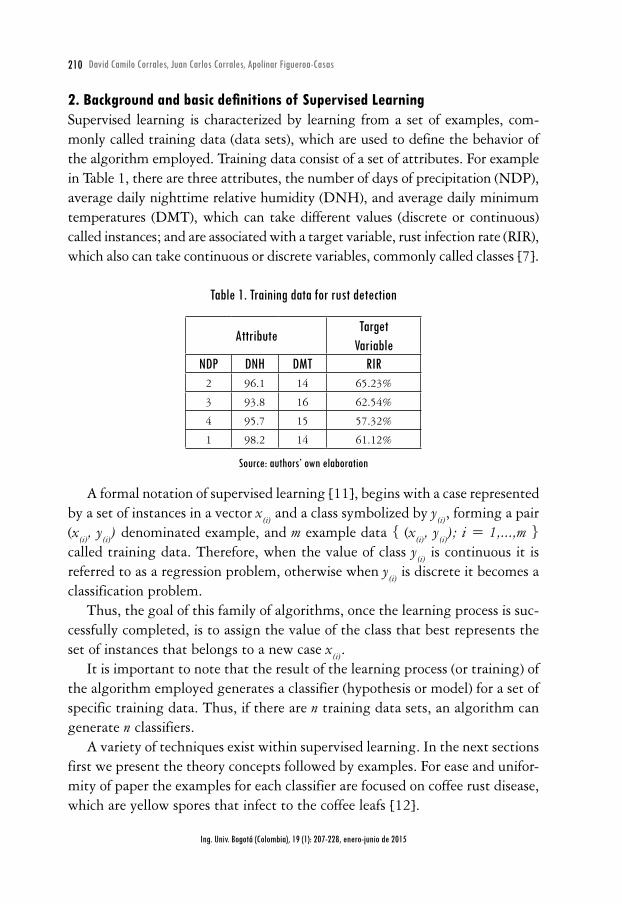
2. Background and basic definitions of Supervised LearningSupervised learning is characterized by learning from a set of examples, com-monly called training data (data sets), which are used to define the behavior of the algorithm employed. Training data consist of a set of attributes. For example in Table 1, there are three attributes, the number of days of precipitation (NDP), average daily nighttime relative humidity (DNH), and average daily minimum temperatures (DMT), which can take different values (discrete or continuous) called instances; and are associated with a target variable, rust infection rate (RIR), which also can take continuous or discrete variables, commonly called classes [7].
Table 1. Training data for rust detection
AttributeTarget
VariableNDP DNH DMT RIR
2 96.1 14 65.23%
3 93.8 16 62.54%
4 95.7 15 57.32%
1 98.2 14 61.12%
Source: authors’ own elaboration
A formal notation of supervised learning [11], begins with a case represented by a set of instances in a vector x(i) and a class symbolized by y(i), forming a pair (x(i), y(i)) denominated example, and m example data { (x(i), y(i)); i = 1,...,m } called training data. Therefore, when the value of class y(i) is continuous it is referred to as a regression problem, otherwise when y(i) is discrete it becomes a classification problem.
Thus, the goal of this family of algorithms, once the learning process is suc-cessfully completed, is to assign the value of the class that best represents the set of instances that belongs to a new case x(i).
It is important to note that the result of the learning process (or training) of the algorithm employed generates a classifier (hypothesis or model) for a set of specific training data. Thus, if there are n training data sets, an algorithm can generate n classifiers.
A variety of techniques exist within supervised learning. In the next sections first we present the theory concepts followed by examples. For ease and unifor-mity of paper the examples for each classifier are focused on coffee rust disease, which are yellow spores that infect to the coffee leafs [12].
211Towards detecting crop diseases and pest by supervised learning
Ing. Univ. Bogotá (Colombia), 19 (1): 207-228, enero-junio de 2015
2.1. Decision Trees (DT): Decision trees are algorithms that allow the approximation of functions of dis-crete and continuous values, beginning with the generation of a set of rules. DTs classify the values that attributes (called instances) can take in a tree, where each node represents an instance of an attribute, and each branch descending from the node corresponds to one of the possible values that the attribute can take [13]. In other words the DTs seek the instance that has the closest relationship with the target variable, dividing the dataset into subsets according to attribute. The procedure is repeated until the established criterion is satisfactorily met [14]. Among the most popular algorithms for building DTs include: ID3 [15], C4.5 [16], CART [17], CHAID [18], and QUEST [19].
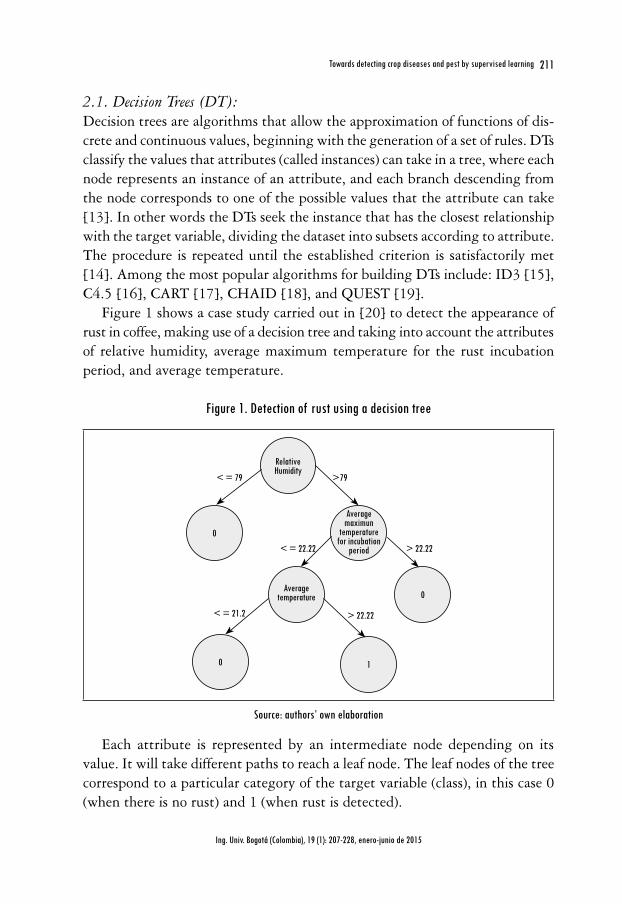
Figure 1 shows a case study carried out in [20] to detect the appearance of rust in coffee, making use of a decision tree and taking into account the attributes of relative humidity, average maximum temperature for the rust incubation period, and average temperature.
Figure 1. Detection of rust using a decision tree
Relative Humidity
0
Average temperature 0
1
0
Average maximun
temperature for incubation
period
< = 79 >79
< = 22.22
< = 21.2 > 22.22
> 22.22
Source: authors’ own elaboration
Each attribute is represented by an intermediate node depending on its value. It will take different paths to reach a leaf node. The leaf nodes of the tree correspond to a particular category of the target variable (class), in this case 0 (when there is no rust) and 1 (when rust is detected).
212 David Camilo Corrales, Juan Carlos Corrales, Apolinar Figueroa-Casas
Ing. Univ. Bogotá (Colombia), 19 (1): 207-228, enero-junio de 2015
2.2. Bayesian networks (BN): Bayesian networks model a set of variables and the dependency relations between them, making use of Bayes theorem. Through this model, the a posteriori prob-ability of unknown variables can be estimated, based on known variables. These models can have diverse applications: classification, prediction, diagnosis, and so on [7]. Bayesian networks have two essential components: a directed acyclic graph showing the dependence and independence between variables, and a set of probability distribution tables. According to [14], two specific classes of Bayesian networks are popular in the supervised learning context - Naive Bayes ( NB) and Tree-Augmented Naive Bayes (TAN). In NB, a relation only exists between the parent and the offspring nodes, while TAN allows relations between peer nodes.
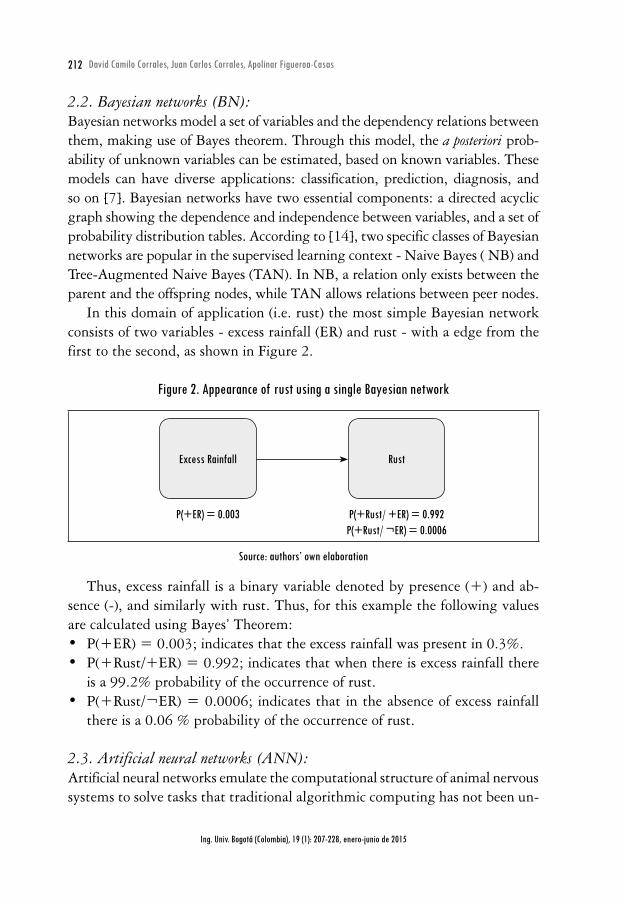
In this domain of application (i.e. rust) the most simple Bayesian network consists of two variables - excess rainfall (ER) and rust - with a edge from the first to the second, as shown in Figure 2.
Figure 2. Appearance of rust using a single Bayesian network
Excess Rainfall Rust
P(+ER) = 0.003 P(+Rust/ +ER) = 0.992P(+Rust/ ¬ER) = 0.0006
Source: authors’ own elaboration
Thus, excess rainfall is a binary variable denoted by presence (+) and ab-sence (-), and similarly with rust. Thus, for this example the following values are calculated using Bayes’ Theorem:• P(+ER) = 0.003; indicates that the excess rainfall was present in 0.3%.• P(+Rust/+ER) = 0.992; indicates that when there is excess rainfall there
is a 99.2% probability of the occurrence of rust. • P(+Rust/¬ER) = 0.0006; indicates that in the absence of excess rainfall
there is a 0.06 % probability of the occurrence of rust.
2.3. Artificial neural networks (ANN):Artificial neural networks emulate the computational structure of animal nervous systems to solve tasks that traditional algorithmic computing has not been un-
213Towards detecting crop diseases and pest by supervised learning
Ing. Univ. Bogotá (Colombia), 19 (1): 207-228, enero-junio de 2015
able to solve satisfactorily [21]. Among the main advantages of neural networks are: adaptive learning, self-organizing capacity, failover, and the integration of diverse technologies [22].
In the same vein, the authors in [14], [23] define an ANN as a collection of simple processing units called neurons (or nodes) that receives a series of entries (X
1,X
2,X
3, ..., X
n) aimed at producing an output (Y). The output consists of a
set of propagation, activation and transfer functions.The neurons can be interconnected to each other and a weight fixed on each
interconnection (W1,W
2,W
3,...,W
n). This procedure is called Feed Forward. It
should be noted that the weights can be adjusted until the desired output for a set of training data is obtained. This mechanism is implemented by calculating error, which is defined as the difference of the desired value less the value obtained by the neuron. It is thus possible that the errors obtained are propagated backward such that the weights can be adjusted. This technique is called backpropagation [24].
Similarly the neural networks have the capability to organize themselves, forming layers with their neurons. In this regard, there are input layers, hidden layers (intermediate) and output layers [25].
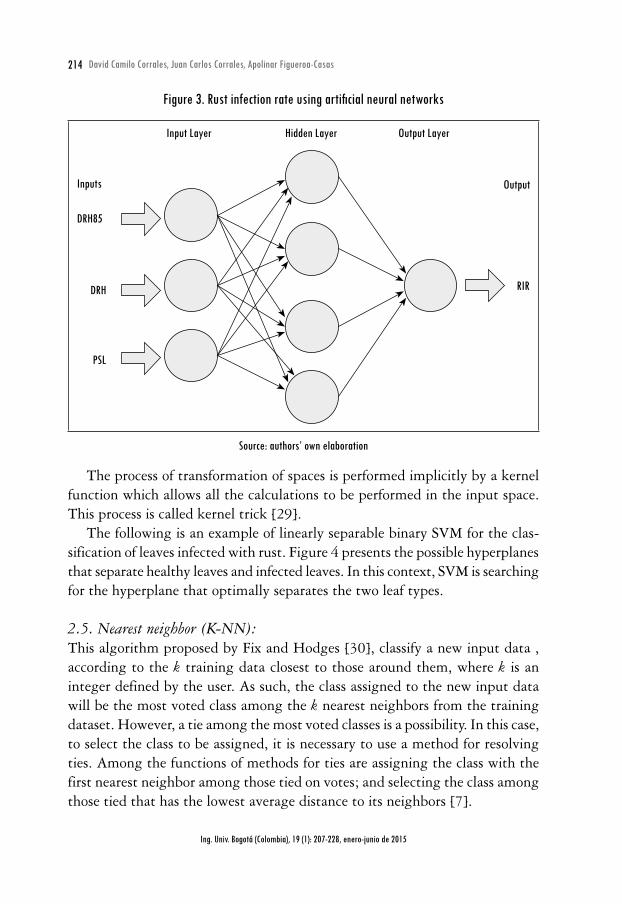
Figure 3 shows an ANN that calculates the rust infection rate (RIR) in coffee one month beforehand. This ANN is comprised of input, hidden and output layers. The input layer receives the number of consecutive days with relative humidity above 85 % (DRH85), number of consecutive days with rain at night (DRN), and the percentage of shade in the lot (PSL). The hidden layer further solves problems when the data are not linearly separable, this way different hidden layers can be used depending on the organization of the data. Finally the output layer calculates the rust incidence rate.
2.4. Support vector machines (SVM): Support vector machine is a method proposed by Vladimir Vapnik [26] for solv-ing classification and regression problems. The basic operation begins with a set of points, which in turn contains two subsets of points, in which each one belongs to one of two possible classes. Based on this, the support vector machine searches for the greatest distance (maximum margin) that separates the classes by way of a hyperplane, in order to build a model that is able to predict whether a new point (of unknown class) belongs to one class or the other [27]. This method is applied as long as the set of points are linearly separable. Otherwise the input data must first be transformed to a new space, usually to a higher dimension where classes are linearly separable [28].
214 David Camilo Corrales, Juan Carlos Corrales, Apolinar Figueroa-Casas
Ing. Univ. Bogotá (Colombia), 19 (1): 207-228, enero-junio de 2015
Figure 3. Rust infection rate using artificial neural networks
Input Layer Hidden Layer Output Layer
Inputs
DRH85
DRH
PSL
Output
RIR
Source: authors’ own elaboration
The process of transformation of spaces is performed implicitly by a kernel function which allows all the calculations to be performed in the input space. This process is called kernel trick [29].
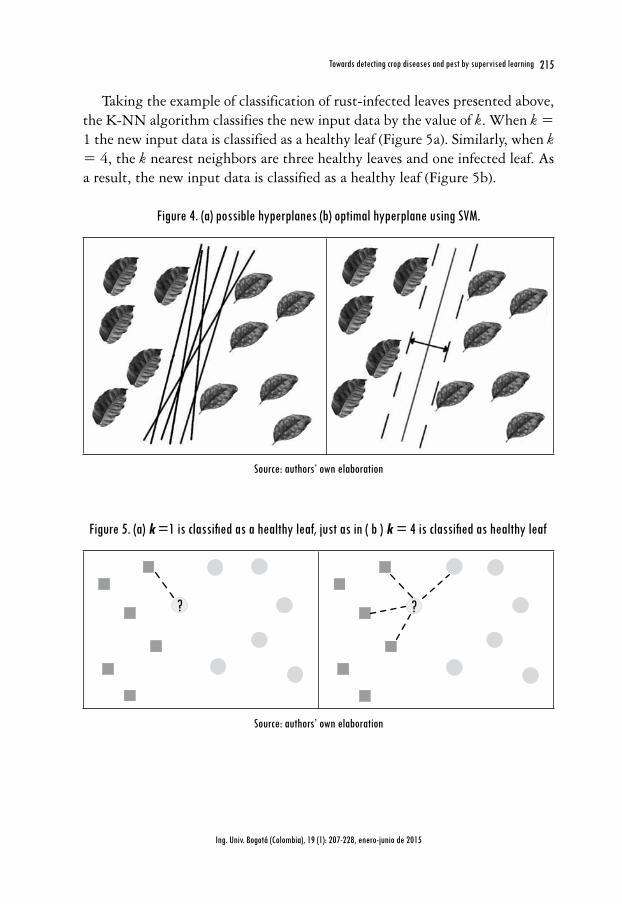
The following is an example of linearly separable binary SVM for the clas-sification of leaves infected with rust. Figure 4 presents the possible hyperplanes that separate healthy leaves and infected leaves. In this context, SVM is searching for the hyperplane that optimally separates the two leaf types.
2.5. Nearest neighbor (K-NN): This algorithm proposed by Fix and Hodges [30], classify a new input data , according to the k training data closest to those around them, where k is an integer defined by the user. As such, the class assigned to the new input data will be the most voted class among the k nearest neighbors from the training dataset. However, a tie among the most voted classes is a possibility. In this case, to select the class to be assigned, it is necessary to use a method for resolving ties. Among the functions of methods for ties are assigning the class with the first nearest neighbor among those tied on votes; and selecting the class among those tied that has the lowest average distance to its neighbors [7].
215Towards detecting crop diseases and pest by supervised learning
Ing. Univ. Bogotá (Colombia), 19 (1): 207-228, enero-junio de 2015
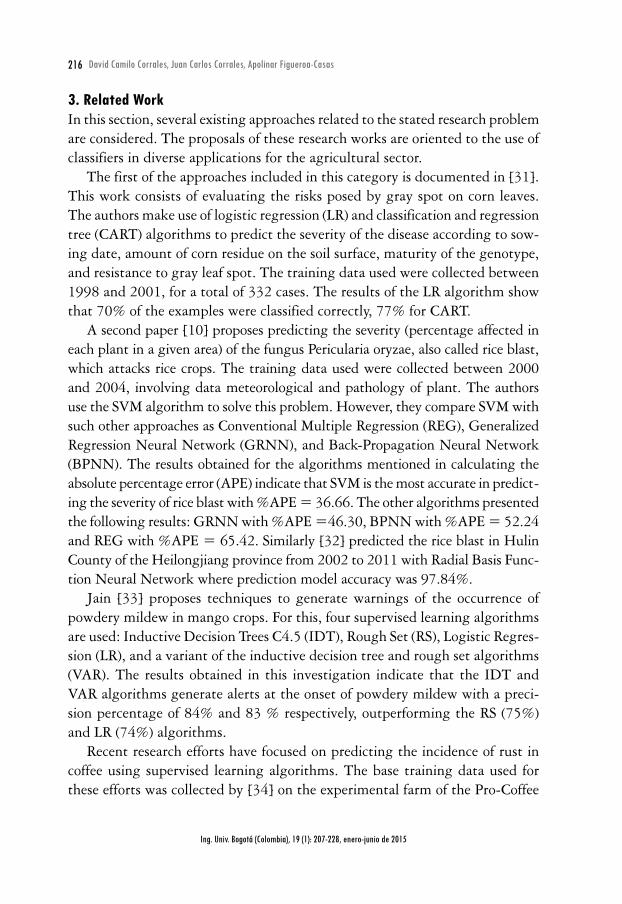
Taking the example of classification of rust-infected leaves presented above, the K-NN algorithm classifies the new input data by the value of k. When k = 1 the new input data is classified as a healthy leaf (Figure 5a). Similarly, when k = 4, the k nearest neighbors are three healthy leaves and one infected leaf. As a result, the new input data is classified as a healthy leaf (Figure 5b).
Figure 4. (a) possible hyperplanes (b) optimal hyperplane using SVM.
Source: authors’ own elaboration
Figure 5. (a) k =1 is classified as a healthy leaf, just as in ( b ) k = 4 is classified as healthy leaf
? ?
Source: authors’ own elaboration
216 David Camilo Corrales, Juan Carlos Corrales, Apolinar Figueroa-Casas
Ing. Univ. Bogotá (Colombia), 19 (1): 207-228, enero-junio de 2015
3. Related WorkIn this section, several existing approaches related to the stated research problem are considered. The proposals of these research works are oriented to the use of classifiers in diverse applications for the agricultural sector.
The first of the approaches included in this category is documented in [31]. This work consists of evaluating the risks posed by gray spot on corn leaves. The authors make use of logistic regression (LR) and classification and regression tree (CART) algorithms to predict the severity of the disease according to sow-ing date, amount of corn residue on the soil surface, maturity of the genotype, and resistance to gray leaf spot. The training data used were collected between 1998 and 2001, for a total of 332 cases. The results of the LR algorithm show that 70% of the examples were classified correctly, 77% for CART.
A second paper [10] proposes predicting the severity (percentage affected in each plant in a given area) of the fungus Pericularia oryzae, also called rice blast, which attacks rice crops. The training data used were collected between 2000 and 2004, involving data meteorological and pathology of plant. The authors use the SVM algorithm to solve this problem. However, they compare SVM with such other approaches as Conventional Multiple Regression (REG), Generalized Regression Neural Network (GRNN), and Back-Propagation Neural Network (BPNN). The results obtained for the algorithms mentioned in calculating the absolute percentage error (APE) indicate that SVM is the most accurate in predict-ing the severity of rice blast with %APE = 36.66. The other algorithms presented the following results: GRNN with %APE =46.30, BPNN with %APE = 52.24 and REG with %APE = 65.42. Similarly [32] predicted the rice blast in Hulin County of the Heilongjiang province from 2002 to 2011 with Radial Basis Func-tion Neural Network where prediction model accuracy was 97.84%.
Jain [33] proposes techniques to generate warnings of the occurrence of powdery mildew in mango crops. For this, four supervised learning algorithms are used: Inductive Decision Trees C4.5 (IDT), Rough Set (RS), Logistic Regres-sion (LR), and a variant of the inductive decision tree and rough set algorithms (VAR). The results obtained in this investigation indicate that the IDT and VAR algorithms generate alerts at the onset of powdery mildew with a preci-sion percentage of 84% and 83 % respectively, outperforming the RS (75%) and LR (74%) algorithms.
Recent research efforts have focused on predicting the incidence of rust in coffee using supervised learning algorithms. The base training data used for these efforts was collected by [34] on the experimental farm of the Pro-Coffee
217Towards detecting crop diseases and pest by supervised learning
Ing. Univ. Bogotá (Colombia), 19 (1): 207-228, enero-junio de 2015
Foundation in Varginha, Minas Gerais, Brazil over eight years (from October 1998 to October 2006). The final dataset includes 182 examples. This work is presented below.
In [35] the authors develop a decision tree (DT) for cultivation areas with a high fruit load, in which the target variable (class), is determined by the rust infection rate (RIR), defined by the percentage of leaves infected monthly. In this respect the target variable is defined by three classes. The first class is given the name of reduction or allocation and occurs when RIR is less than or equal to 0%, while the second, named moderate growth, occurs when RIR is greater than 0% and less than or equal to 5%. Finally a class called accelerated growth occurs when RIR is greater than 5%. The precision results obtained for the three classes were 88%, 75% and 79% respectively.
The authors of [36], [37] similarly developed decision trees, but unlike the approach proposed in [35], various classifiers are generated depending on the plant fruit load. The reason for the generation of different classifiers is due to the characteristics presented in biannual coffee crops (Brazil), indicating that crops in years with a high fruit load are more likely to be attacked by rust than those in years with low fruit load.
In this connection, recent research involving the same authors [38] presents an approach for predicting the percentage of coffee leaves infected by rust, to develop a warning system, using the support vector machine algorithm (SVM) for regression (discrete target variable). The results express a 94% correlation between SVM predictions and actual results obtained in the field.
Similarly, in [39] the research presented above is extended, using non-deterministic classifiers (carrying out modifications on the SVM regression algorithm) in order to predict if the percentage of coffee leaves infected by rust is above a threshold defined by an expert on the subject. The research in this way contributes to reducing the use of chemical fungicides, investment costs, environmental impact, and thus increases the quality of coffee production.
Elsewhere in [20] the use of fuzzy decision trees (FDT) is proposed for gen-erating coffee rust alerts. The target variable representing the monthly infection rate consists of two levels (5% and 10%). The first level allows the application of preventive actions, while the latter requires remedial action. With this in mind, the FDT were compared with the classic DT algorithm, the FDT obtaining better results in terms of accuracy and interpretability.
In [40] the authors use a portion of the training data from the experimental farm of the Pro Coffee Foundation in Brazil. These data contain evaluations for
218 David Camilo Corrales, Juan Carlos Corrales, Apolinar Figueroa-Casas
Ing. Univ. Bogotá (Colombia), 19 (1): 207-228, enero-junio de 2015
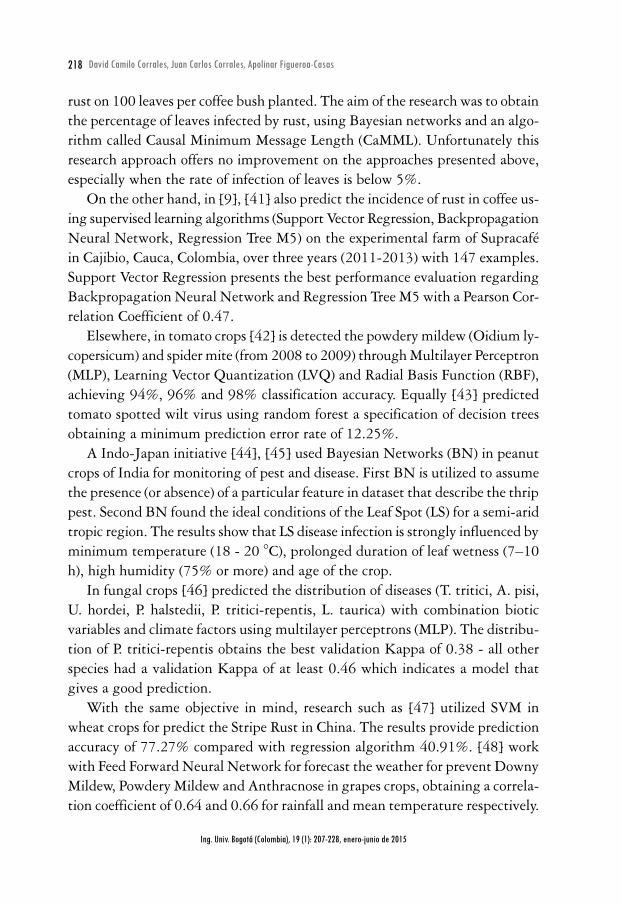
rust on 100 leaves per coffee bush planted. The aim of the research was to obtain the percentage of leaves infected by rust, using Bayesian networks and an algo-rithm called Causal Minimum Message Length (CaMML). Unfortunately this research approach offers no improvement on the approaches presented above, especially when the rate of infection of leaves is below 5%.
On the other hand, in [9], [41] also predict the incidence of rust in coffee us-ing supervised learning algorithms (Support Vector Regression, Backpropagation Neural Network, Regression Tree M5) on the experimental farm of Supracafé in Cajibio, Cauca, Colombia, over three years (2011-2013) with 147 examples. Support Vector Regression presents the best performance evaluation regarding Backpropagation Neural Network and Regression Tree M5 with a Pearson Cor-relation Coefficient of 0.47.
Elsewhere, in tomato crops [42] is detected the powdery mildew (Oidium ly-copersicum) and spider mite (from 2008 to 2009) through Multilayer Perceptron (MLP), Learning Vector Quantization (LVQ) and Radial Basis Function (RBF), achieving 94%, 96% and 98% classification accuracy. Equally [43] predicted tomato spotted wilt virus using random forest a specification of decision trees obtaining a minimum prediction error rate of 12.25%.
A Indo-Japan initiative [44], [45] used Bayesian Networks (BN) in peanut crops of India for monitoring of pest and disease. First BN is utilized to assume the presence (or absence) of a particular feature in dataset that describe the thrip pest. Second BN found the ideal conditions of the Leaf Spot (LS) for a semi-arid tropic region. The results show that LS disease infection is strongly influenced by minimum temperature (18 - 20 °C), prolonged duration of leaf wetness (7–10 h), high humidity (75% or more) and age of the crop.
In fungal crops [46] predicted the distribution of diseases (T. tritici, A. pisi, U. hordei, P. halstedii, P. tritici-repentis, L. taurica) with combination biotic variables and climate factors using multilayer perceptrons (MLP). The distribu-tion of P. tritici-repentis obtains the best validation Kappa of 0.38 - all other species had a validation Kappa of at least 0.46 which indicates a model that gives a good prediction.
With the same objective in mind, research such as [47] utilized SVM in wheat crops for predict the Stripe Rust in China. The results provide prediction accuracy of 77.27% compared with regression algorithm 40.91%. [48] work with Feed Forward Neural Network for forecast the weather for prevent Downy Mildew, Powdery Mildew and Anthracnose in grapes crops, obtaining a correla-tion coefficient of 0.64 and 0.66 for rainfall and mean temperature respectively.
219Towards detecting crop diseases and pest by supervised learning
Ing. Univ. Bogotá (Colombia), 19 (1): 207-228, enero-junio de 2015
Finally, [49] discover the apparition of Leafroller in kiwi crops through Bayes-ian Networks. The evaluation denoted a 0.65 for recall measure with 888 true positives and 35 false negatives.
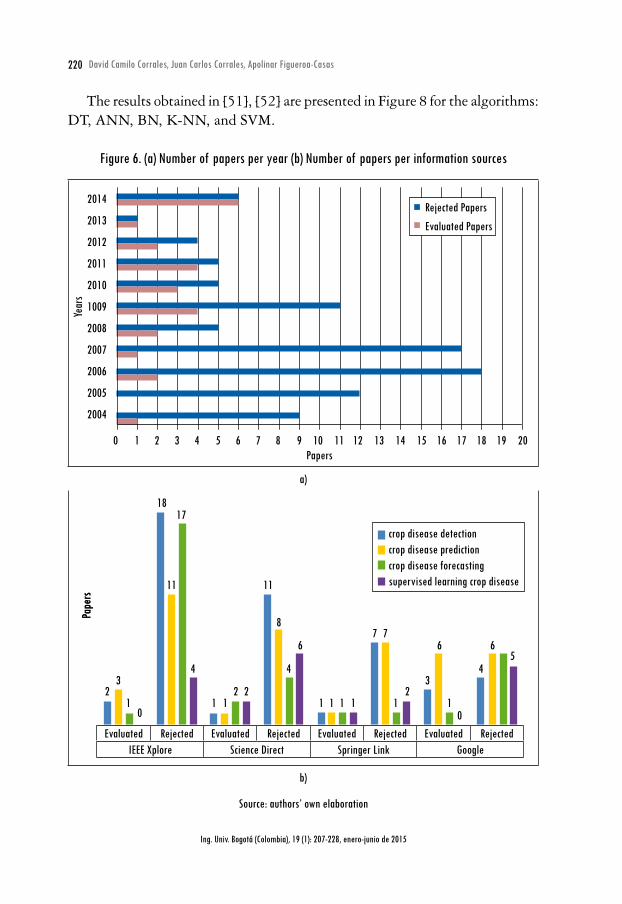
4. DiscussionWe selected 119 papers (from 2004 - 2014) based on methodology [50], which comprising 20 evaluated and 99 rejected papers in our review (Figure 6a), drawn from 4 information sources: IEEE Xplore, ScienceDirect, Springer Link and Google, taking into account 4 search queries: crop disease detection, crop disease prediction, crop disease forecasting and supervised learning crop disease (Figure 6b). As noted, the information source with more papers is Google (10 evaluated papers), but the articles found in IEEE Xplore (6 evaluated papers), ScienceDi-rect (6 evaluated papers) and Springer Link (4 evaluated papers) have quality major, insomuch as its journals are evaluated with Journal Impact Factor (JIF).
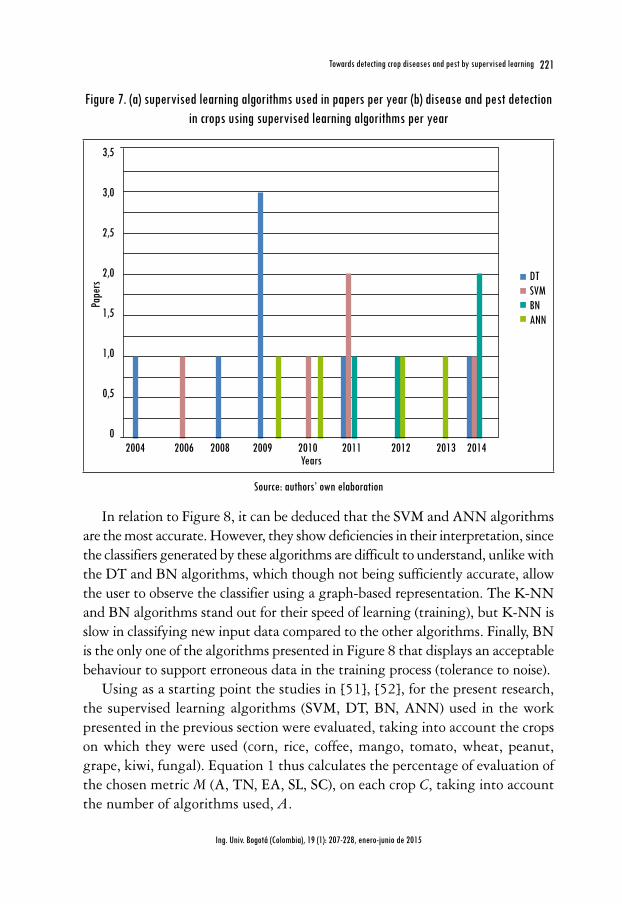
The papers considered in our review (20 evaluated papers) use the supervised learning algorithms: DT, SVM, BN and ANN as reported in Figure 7a. The most used algorithm is DT (7 papers), followed by SVM (5 papers), ANN (4 papers) and BN (4 papers). On the other hand the classifiers were applied for disease and pest detection in crops such as: Corn (1 paper), Rice (2 papers), Coffee (8 papers), Mango (1 papers), Tomato (2 papers), Wheat (1 papers), Peanut (2 papers), Grape (1 paper), Kiwi (1 paper), and Fungal (1 paper). The supervised learning algorithms in coffee crops are the most used since 2008, as shown in Figure 7b.
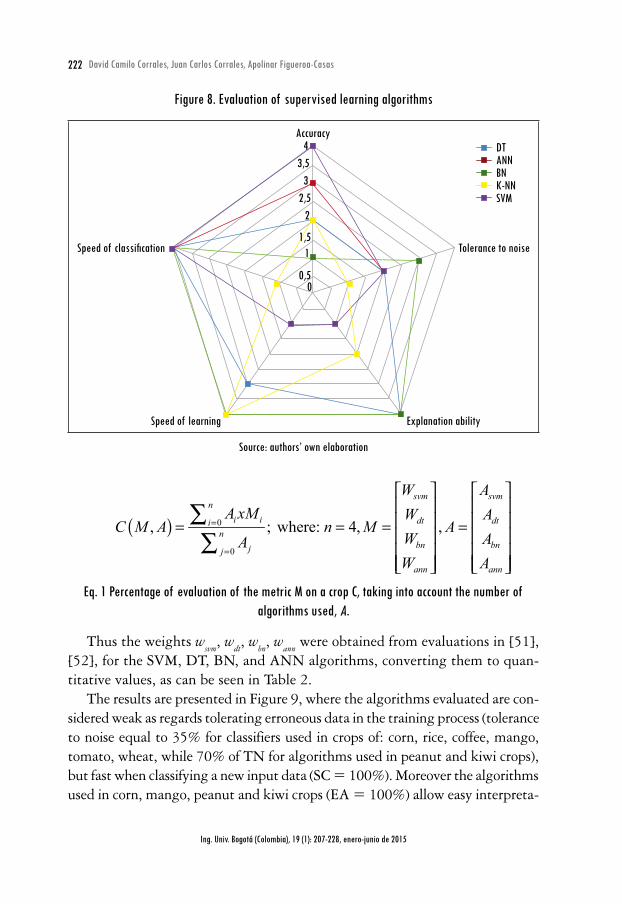
Based on supervised learning algorithms used in the research mentioned above, the following is an assessment conducted in [51] for the DT, ANN, BN, K-NN, and SVM algorithms, taking the following metrics into account:• Accuracy(A): precision of the classifier in predicting a value. • Tolerancetonoise(TN): ability of the classifier to handle erroneous data
in the training process.• Explanationability(EA): ease of understanding by a user how the classifier
operates.• Speedoflearning(SL): speed of learning of the classifier.• Speedofclassification(SC): speed of the algorithm in classifying a new
instance.
These metrics can have values between 1 and 4, with 4 being Excellent, 3 Good, 2 Average, and 1 Poor.
220 David Camilo Corrales, Juan Carlos Corrales, Apolinar Figueroa-Casas
Ing. Univ. Bogotá (Colombia), 19 (1): 207-228, enero-junio de 2015
The results obtained in [51], [52] are presented in Figure 8 for the algorithms: DT, ANN, BN, K-NN, and SVM.
Figure 6. (a) Number of papers per year (b) Number of papers per information sources
Papers0 1 2 3 4 5 6 7 8 9 10 11 12 13 14 15 16 17 18 19 20
2014
2013
2012
2011
2010
1009
2008
2007
2006
2005
2004
Year
s
Rejected PapersEvaluated Papers
a)
Pape
rs
Evaluated Rejected Evaluated Rejected Evaluated Rejected Evaluated RejectedIEEE Xplore Science Direct Springer Link Google
Pape
rs
2 22 23
1 1 1 1 1 1 1 1 10
4 4 43 3
0
8
67 7
6 65
1111
1817
crop disease detectioncrop disease predictioncrop disease forecastingsupervised learning crop disease
b)
Source: authors’ own elaboration
221Towards detecting crop diseases and pest by supervised learning
Ing. Univ. Bogotá (Colombia), 19 (1): 207-228, enero-junio de 2015
Figure 7. (a) supervised learning algorithms used in papers per year (b) disease and pest detection in crops using supervised learning algorithms per year
3,5
3,0
2,5
2,0
1,5
1,0
0,5
0
Years2004 2006 2008 2009 2010 2011 2012 2013 2014
Pape
rs
DTSVMBNANN
Source: authors’ own elaboration
In relation to Figure 8, it can be deduced that the SVM and ANN algorithms are the most accurate. However, they show deficiencies in their interpretation, since the classifiers generated by these algorithms are difficult to understand, unlike with the DT and BN algorithms, which though not being sufficiently accurate, allow the user to observe the classifier using a graph-based representation. The K-NN and BN algorithms stand out for their speed of learning (training), but K-NN is slow in classifying new input data compared to the other algorithms. Finally, BN is the only one of the algorithms presented in Figure 8 that displays an acceptable behaviour to support erroneous data in the training process (tolerance to noise).
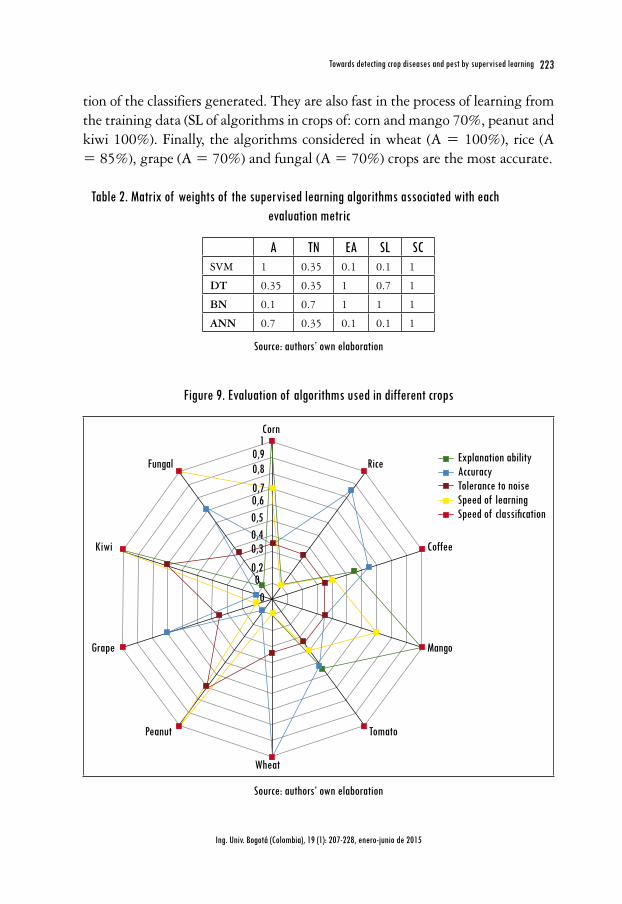
Using as a starting point the studies in [51], [52], for the present research, the supervised learning algorithms (SVM, DT, BN, ANN) used in the work presented in the previous section were evaluated, taking into account the crops on which they were used (corn, rice, coffee, mango, tomato, wheat, peanut, grape, kiwi, fungal). Equation 1 thus calculates the percentage of evaluation of the chosen metric M (A, TN, EA, SL, SC), on each crop C, taking into account the number of algorithms used, A.
222 David Camilo Corrales, Juan Carlos Corrales, Apolinar Figueroa-Casas
Ing. Univ. Bogotá (Colombia), 19 (1): 207-228, enero-junio de 2015
Figure 8. Evaluation of supervised learning algorithms
DTANNBNK-NNSVM
Tolerance to noise
Explanation abilitySpeed of learning
Speed of classification
Accuracy4
3,53
2,52
1,51
0,50
Source: authors’ own elaboration
( ) 0
0
, ; where: 4, ,=
=
= = = =
∑∑
svm svmn
i i dt dtin
bn bnjj
ann ann
W AA xM W A
C M A n M AW AAW A
Eq. 1 Percentage of evaluation of the metric M on a crop C, taking into account the number of algorithms used, A.
Thus the weights wsvm, wdt, wbn, wann were obtained from evaluations in [51], [52], for the SVM, DT, BN, and ANN algorithms, converting them to quan-titative values, as can be seen in Table 2.
The results are presented in Figure 9, where the algorithms evaluated are con-sidered weak as regards tolerating erroneous data in the training process (tolerance to noise equal to 35% for classifiers used in crops of: corn, rice, coffee, mango, tomato, wheat, while 70% of TN for algorithms used in peanut and kiwi crops), but fast when classifying a new input data (SC = 100%). Moreover the algorithms used in corn, mango, peanut and kiwi crops (EA = 100%) allow easy interpreta-
223Towards detecting crop diseases and pest by supervised learning
Ing. Univ. Bogotá (Colombia), 19 (1): 207-228, enero-junio de 2015
tion of the classifiers generated. They are also fast in the process of learning from the training data (SL of algorithms in crops of: corn and mango 70%, peanut and kiwi 100%). Finally, the algorithms considered in wheat (A = 100%), rice (A = 85%), grape (A = 70%) and fungal (A = 70%) crops are the most accurate.
Table 2. Matrix of weights of the supervised learning algorithms associated with each evaluation metric
A TN EA SL SCSVM 1 0.35 0.1 0.1 1
DT 0.35 0.35 1 0.7 1
BN 0.1 0.7 1 1 1
ANN 0.7 0.35 0.1 0.1 1
Source: authors’ own elaboration
Figure 9. Evaluation of algorithms used in different crops
Corn
Rice
Coffee
Mango
Tomato
Wheat
Peanut
Grape
Kiwi
Fungal
00
0,20,30,40,50,60,70,80,9
1Explanation abilityAccuracyTolerance to noiseSpeed of learningSpeed of classification
Source: authors’ own elaboration
224 David Camilo Corrales, Juan Carlos Corrales, Apolinar Figueroa-Casas
Ing. Univ. Bogotá (Colombia), 19 (1): 207-228, enero-junio de 2015
It is thus worth noting that the DT algorithm is the most widely used for the detection of pests and diseases - in corn, coffee, mango, tomato. It is followed by the SVM and ANN algorithms, used for such crops as rice, coffee, tomato, wheat, grape, fungal. Placing an emphasis on these three algorithms, it can be concluded that SVM and ANN are most used in sectors where the priority is to obtain a high degree of accuracy in predictions, while DT is used in areas where it is most important to generate classifiers that are easy for any user to interpret.
5. ConclusionsIn this article a review is carried out of research on the detection of diseases and pests in different crops using supervised learning algorithms. The research and algorithms were compared in order to observe performance, DT being regarded as the most widely used and the best to generate easily interpretable classifiers, followed by SVM and ANN algorithms, which are the most accurate algorithms for predicting or classifying diseases and pests. On the other hand, K-NN, and BN are seldom used in an agricultural context. Nevertheless, K-NN and BN stand out for their speed of learning (training).
Regarding future work, it is intended to combine a set of classifiers for the detection of diseases and pest in Colombian crops, to increase the accuracy of prediction results through the use of techniques commonly referred to as en-semble methods [53]-[55].
6. AcknowledgementsThe authors are grateful to the Environmental Study Group (GEA), the Telemat-ics Engineering Group (GIT) of the University of Cauca for scientific support and Colciencias for PhD scholarship granted to David Camilo Corrales, MSc.
References[1] G. Jones, “Cambio climático: observaciones, pronósticos e implicaciones generales en
viticultura y producción vinícola”, Rev. Enol., no. 93, s. p., 2008.[2] H. R. Schultz, “¿Cómo puede afectar el clima a la viticultura en Europa?”, Rev Enol., no.
93, s. p. 2007.[3] D. C. Corrales, I. D. López, F. Campo, S. A. Ordóñez, J. C. Corrales, A. F. Casas et al.,
“Plataforma para el seguimiento de variables meteorológicas y ambientales para el sector agropecuario”, en VII Congreso Ibérico de AgroIngeniería y Ciencias Hortícolas, Madrid, 2013.
[4] D. Sauri, “Potential effects of global change at Catalonian’s socio– economic and cultural levels”, Proc. of Adaptation to climate change: bridging science and decision making Seminary, 2007.
225Towards detecting crop diseases and pest by supervised learning
Ing. Univ. Bogotá (Colombia), 19 (1): 207-228, enero-junio de 2015
[5] R. Savé, “Potential effects of global change on Catalonian’s agriculture”, Proc. of Adaptation to climate change: bridging science and decision making Seminary ETC/LUSI/GenCat/UAB, 2007.
[6] E. Lowry, E. J. Rollinson, A. J. Laybourn, T. E. Scott, M. E. Aiello-Lammens, S. M. Gray, et al., “Biological invasions: a field synopsis, systematic review, and database of the lite-rature”, Ecol Evol., vol. 3, no. 1, pp. 182-196, 2013.
[7] B. S. Araujo, Aprendizaje automático: conceptos básicos y avanzados: aspectos prácticos utilizando el software Weka. España: Pearson Prentice Hall, 2006.
[8] A. Mucherino, P. Papajorgji, and P. Pardalos, Data Mining in Agriculture. Springer, 2009.[9] D. C. Corrales, A. Ledezma, A. Peña, J. Hoyos, A. Figueroa, and J. C. Corrales, “A new
dataset for coffee rust detection in Colombian crops base on classifiers”, Sist Telemát., vol. 12, no. 29, pp. 9-22, 2014.
[10] R. Kaundal, A. Kapoor, and G. Raghava, “Machine learning techniques in disease fore-casting: a case study on rice blast prediction”, BMC Bioinformatics, vol. 7, p. 485, 2006.
[11] A. Ng, (Producer). CS 229 Machine Learning Course Materials. Supervised learning. 2003. [Online]. Available: http://cs229.stanford.edu/materials.html
[12] S. Becker, La propagación de la roya del cafeto. Sociedad alemana de cooperación técnica (GTZ), 1979. pp. 70.
[13] T. Mitchell, Machine learning. Maidenhead, U.K.: McGraw-Hill, 1997.[14] G. Meyfroidt, F. Güiza, J. Ramon, and M. Bruynooghe, “Machine learning techniques
to examine large patient databases”, Best Pract Res Clin Anaesthesiol., vol. 23, no. 1, pp. 127-143, 2009.
[15] J. R. Quinlan, “Induction of decision trees”, Mach. Learn., vol. 1, no. 1, pp. 81-106, 1986.[16] J. R. Quinlan, C4.5: programs for machine learning. Burlington, MA: Morgan Kaufmann
Publishers, 1993.[17] L. Breiman, J. H. Friedman, R. A. Olshen, C. J. Stone, and R. Trees, Classification and
Regression Trees. Wads-worth & Brooks/Cole Advanced Books & Software, 1984.[18] G. V. Kass, “An exploratory technique for investigating large quantities of categorical
data”, J Royal Statist Soc., vol. 29, no. 2, pp. 119-127, 1980.[19] W.-Y. Loh and Y.-S. Shih, “Split selection methods for classification trees”, Statist Sinica,
vol. 7, pp. 815-840, 1997. [20] M. E. Cintra, C. A. A. Meira, M. C. Monard, H. A. Camargo, and L. H. A. Rodríguez,
“The use of fuzzy decision trees for coffee rust warning in Brazilian crops”, en Intell Syst Design Applic. (ISDA), 11th International Conference, 22-24 Nov. 2011.
[21] C. S. Cinca and B. M. Brío, “Predicción de la quiebra bancaria mediante el empleo de redes neuronales artificiales”, Rev esp financ contab., vol. 74, pp. 153-176, 1993.
[22] J. Hilera and V. Martínez, “Redes neuronales artificiales”, Fund, Mod Aplic., 1995.[23] C. Bishop, Neural Networks for Pattern Recognition. Oxford: Clarendon, 1996.[24] R. Erb, “Introduction to backpropagation neural network computation”, Biomed Life Sci.,
vol. 2, pp. 165-170, 1993.
226 David Camilo Corrales, Juan Carlos Corrales, Apolinar Figueroa-Casas
Ing. Univ. Bogotá (Colombia), 19 (1): 207-228, enero-junio de 2015
[25] C.-S. Cheng, “A multi-layerneuralnetwork model for detecting changes in the process
mean”, Comp Ind Engine., vol. 28, pp. 51-61, 2000.
[26] V. N. Vapnik, Statistical learning theory. Wiley, 1998.
[27] T. O. Ayodele, “Types of machine learning algorithms”, en Y. Zhang (Ed.), New advances in machine learning. India: In-Tech, 2010, pp. 20-48.
[28] J. Hernandez, and S. Salazar, “Implementación de una máquina de vectores soporte em-
pleando FPGA”, Sci Tech., vol. 31, pp. 47-52, 2006.
[29] A. G. Morales and G. Hernández, “Utilización de las maquinas con vectores de soporte
para regresión: m² de construcción en Bogotá”, Rev Av Sist Inf., vol. 6, pp. 21-28, 2009.
[30] E. Fix and J. L. Hodges, “Discriminatory analysis: nonparametric discrimination: consis-
tency properties”, USAF School of Aviation Medicine, 1951.
[31] P. A. Paul and G. M. Munkvold, “A Model-based approach to preplanting risk assessment
for gray leaf spot of maize”, Am Phytopatholog Soc: Ecol Epidemiol., P-2004-1011-04R.
[32] K. Liu and Z. Wang, “Rice blast prediction based on gray ant colony and RBF neural
network combination model”, en Comput Intell Design (ISCID), 2012 Fifth International
Symposium, 28-29 oct., 2012.
[33] R. Jain, S. Minz, and V. Ramasubramanian, “Machine learning for forewarning crop
diseases”, J Ind Soc Agricult Stat., vol. 63, pp. 97-107, 2009.
[34] L. Japiassu, A. García, A. Miguel, C. Carvalho, R. Ferreira, L. Padilha et al., “Effect of crop
load, tree density and weather conditions on the development of the coffee leaf rust”, en
Simposio de pesquisa dos cafes do Brasil, 5, 2007.
[35] C. Meira, L. Rodrigues, and S. Moraes, “Análise da epidemia da ferrugem do cafeeiro com
árvore de decisão”, Tropical Plant Pathol., vol. 33, no. 2, pp. 114-124, 2008.
[36] C. A. A. Meira and L. H. A. Rodrigues, “Árvore de decisão na análise de epidemias da
ferrugem do cafeeiro”, en VI Simpósio de Pesquisa dos Cafés do Brasil, 2009.
[37] C. A. A. Meira, L. H. A. Rodrigues, and S. A. d. Moraes, “Modelos de alerta para o con-
trole da ferrugem-do-cafeeiro em lavouras com alta carga pendente”, Pesq Agrop Bras., vol. 44, pp. 233-242, 2009.
[38] O. Luaces, L. H. A. Rodrigues, C. A. A. Meira, R. Quevedo, and A. Bahamonde, Via-bility of an alarm predictor for coffee rust disease using interval regression. Paper presented at the Proceedings of the 23rd international conference on Industrial engineering and other applications of applied intelligent systems, Part II. Cordoba, Spain, 2010.
[39] O. Luaces, L. H. A. Rodrigues, C. A. Alves Meira, and A. Bahamonde, “Using nonde-
terministic learners to alert on coffee rust disease”, Expert Syst Appl., vol. 38, no. 11, pp.
14276-14283, 2011.
[40] C. B. Pérez-Ariza, A. E. Nicholson, and M. J. Flores, “Prediction of coffee rust disease
using bayesian networks”, en The Sixth European Workshop on Probabilistic Graphical Models, Granada, España, 2012.
227Towards detecting crop diseases and pest by supervised learning
Ing. Univ. Bogotá (Colombia), 19 (1): 207-228, enero-junio de 2015
[41] D. C. Corrales, A. J. Peña, C. Leon, A. Figueroa, and J. C. Corrales, “Early warning system
for coffee rust disease based on Error Correcting Output Codes: a proposal”, Ingen Univ Med., vol. 13, no. 5, 2014.
[42] R. Ghaffari, Z. Fu, D. Iliescu, E. Hines, M. Leeson, Napier, R. et al., “Early detection
of diseases in tomato crops: An Electronic Nose and intelligent systems approach”, en
Neural Networks (IJCNN), The 2010 International Joint Conference on., 18-23 julio, 2010.
[43] G. Pokharel and R. Deardon, “Supervised learning and prediction of spatial epidemics”,
Spatial Spatio-temporal Epidemiol., vol. 1, no. 0, pp. 59-77, 2014.
[44] A. K. Tripathy, J. Adinarayana, D. Sudharsan, S. N. Merchant, U. B. Desai, K. Vijaya-
lakshmi et al., “Data mining and wireless sensor network for agriculture pest/disease
predictions”, en Information and Communication Technologies (WICT), 2011 World Congress on, 11-14 dic. 2011.
[45] A. K. Tripathy, J. Adinarayana, K. Vijayalakshmi, S. N. Merchant, U. B. Desai, S. Nino-
miya et al., “Knowledge discovery and Leaf Spot dynamics of groundnut crop through
wireless sensor network and data mining techniques”, Comp Electr Agric., vol. 107, no. 0,
pp. 104-114, 2014.
[46] M. Watts and S. Worner, “Predicting the distribution of fungal crop diseases from abiotic
and biotic factors using multi-layer perceptrons”, en M. Köppen, N. Kasabov & G. Coghill
(Eds.), Advances in Neuro-Information Processing. Berlin Heidelberg: Springer, 2009, pp.
901-908.
[47] W. Haiguang and M. Zhanhong, “Prediction of wheat stripe rust based on support vector
machine”, en Natural Computation (ICNC), 2011 Seventh International Conference on, 26-28
julio 2011.
[48] S. Sannakki, V. S. Rajpurohit, F. Sumira, and H. Venkatesh, “A neural network approach
for disease forecasting in grapes using weather parameters”, en Computing, Communications and Networking Technologies (ICCCNT), 2013 Fourth International Conference on, 4-6 julio
2013.
[49] M. G. Hill, P. G. Connolly, P. Reutemann, and D. Fletcher, “The use of data mining to
assist crop protection decisions on kiwifruit in New Zealand”, Comp Electr Agricult., vol.
108, no. 0, pp. 250-257, 2014.
[50] B. Kitchenham and S. Charters, Guidelines for performing Systematic Literature Reviews in Software Engineering. UK: Keele University and Durham University Joint Report, 2007.
[51] H. Bhavsar and A. Ganatra, “A comparative study of training algorithms for supervised
machine learning”, Int J Soft Comput Engineer., vol. 2, no. 4, pp. 74-81, 2012.
[52] S. B. Kotsiantis, “Supervised machine learning: a review of classification techniques”, en
Proceedings of the 2007 conference on Emerging Artificial Intelligence Applications in Computer Engineering: Real Word AI Systems with Applications in eHealth, HCI, Information Retrieval and Pervasive Technologies, 2007.
228 David Camilo Corrales, Juan Carlos Corrales, Apolinar Figueroa-Casas
Ing. Univ. Bogotá (Colombia), 19 (1): 207-228, enero-junio de 2015
[53] J. Ghosh, “Multiclassifier systems: back to the future”, en Proceedings of the Third Interna-tional Workshop on Multiple Classifier Systems, 2002.
[54] L. Li, B. Zou, Q. Hu, X. Wu, and D. Yu, “Dynamic classifier ensemble using classification confidence”, Neurocomputing, vol. 99, no. 0, pp. 581-591, 2013.
[55] R. Ranawana and V. Palade, “Multi-classifier systems: review and a roadmap for develo-pers”, Int. J. Hybrid Intell. Syst., vol. 3, no. 1, pp. 35-61, 2006.


![Detecting Carbon Monoxide Poisoning Detecting Carbon ...2].pdf · Detecting Carbon Monoxide Poisoning Detecting Carbon Monoxide Poisoning. Detecting Carbon Monoxide Poisoning C arbon](https://static.fdocuments.net/doc/165x107/5f551747b859172cd56bb119/detecting-carbon-monoxide-poisoning-detecting-carbon-2pdf-detecting-carbon.jpg)