Towards an Atlas of Lakes and Reservoirs in Burkina … 02 Faso MAB...Small Reservoirs Toolkit 1...
23
Small Reservoirs Toolkit 1 Towards an Atlas of Lakes and Reservoirs in Burkina Faso Authors CECCHI Philippe, IRD - UMR 5119, Université Montpellier, France Aude Meunier-Nikiema, INSS, Ouagadougou, Burkina Faso Nicolas Moiroux, IRD - UR 167 CyRoCo, Ouagadougou, Burkina Faso Bakary Sanou, IRD - UR 167 CyRoCo, Ouagadougou, Burkina Faso Scope: questions/ challenges the tool addresses In many parts of the world, inventories of small reservoirs are unreliable, out-of-date, or unavailable. Evaluation of the potential for small reservoirs at national or regional scales, however, and strategic planning of future reservoir infrastructure in selected areas, depends on accurate information. It is important to have a synoptic perspective regarding “where reservoirs are”. In West Africa, Burkina Faso appears to be the country with the highest density of small reservoirs. Here, as elsewhere, there is a constant demand to create new reservoirs. Little information has been available, however, regarding the existing spatial distribution of small reservoirs or the spatial dynamics of new reservoir construction. Small reservoirs are artificially-created aquatic ecosystems. Intrinsic factors such as surface area and depth determine their potential (e.g. capacity, biological productivity). But external driving pressures, hereafter called contexts, ultimately control their performance (Cecchi 2007). Population growth and intensive use of watersheds may exert severe pressures that, for example, modify runoff or stimulate eutrophication. On the other hand, small reservoirs located in relatively unpopulated areas (where there are fewer external driving pressures associated with human behavior) are of questionable value. Contexts influence the extent to which reservoir potential can be achieved. It is useful to characterize reservoirs in response to these key drivers. A ‘pilot’ Atlas of Lakes and Reservoirs of Burkina Faso, called FasoMAB, has been developed to fulfill this need. Initially, the atlas was designed to help guide Small Reservoir Project (SRP) interventions in Burkina Faso, beginning with the question of “where to work”. It was decided to focus SRP activities in “hot spot” areas, where population density and reservoir density are both high. Administrative boundaries were used as a first step in selecting “hot spots”, with the most detailed level being that of “departments” (N=351) (Fig. 1). Further refinements provided alternative geographical views of hot spots. The grid of the Climatic Research Unit was used to pixelize the country: this allowed an objective identification of clusters of reservoirs. A Digital Elevation Model was used to develop a hydrographic perspective and to identify target basins. The atlas was developed using only the most recent available secondary databases provided by official sources (to insure the fingerprinting of data). Merging and interconnecting these heterogeneous datasets was challenging. This disparate information was “homogenized” in a metadata base, and a customized GIS was developed to combine data and generate maps.
Transcript of Towards an Atlas of Lakes and Reservoirs in Burkina … 02 Faso MAB...Small Reservoirs Toolkit 1...

Small Reservoirs Toolkit
1
Towards an Atlas of Lakes and Reservoirs in Burkina Faso
Authors CECCHI Philippe, IRD - UMR 5119, Université Montpellier, France
Aude Meunier-Nikiema, INSS, Ouagadougou, Burkina Faso
Nicolas Moiroux, IRD - UR 167 CyRoCo, Ouagadougou, Burkina Faso
Bakary Sanou, IRD - UR 167 CyRoCo, Ouagadougou, Burkina Faso
Scope: questions/ challenges the tool addresses In many parts of the world, inventories of small reservoirs are unreliable, out-of-date, or unavailable. Evaluation of the potential for small reservoirs at national or regional scales, however, and strategic planning of future reservoir infrastructure in selected areas, depends on accurate information. It is important to have a synoptic perspective regarding “where reservoirs are”. In West Africa, Burkina Faso appears to be the country with the highest density of small reservoirs. Here, as elsewhere, there is a constant demand to create new reservoirs. Little information has been available, however, regarding the existing spatial distribution of small reservoirs or the spatial dynamics of new reservoir construction.
Small reservoirs are artificially-created aquatic ecosystems. Intrinsic factors such as surface area and depth determine their potential (e.g. capacity, biological productivity). But external driving pressures, hereafter called contexts, ultimately control their performance (Cecchi 2007). Population growth and intensive use of watersheds may exert severe pressures that, for example, modify runoff or stimulate eutrophication. On the other hand, small reservoirs located in relatively unpopulated areas (where there are fewer external driving pressures associated with human behavior) are of questionable value.
Contexts influence the extent to which reservoir potential can be achieved. It is useful to characterize reservoirs in response to these key drivers. A ‘pilot’ Atlas of Lakes and Reservoirs of Burkina Faso, called FasoMAB, has been developed to fulfill this need.
Initially, the atlas was designed to help guide Small Reservoir Project (SRP) interventions in Burkina Faso, beginning with the question of “where to work”. It was decided to focus SRP activities in “hot spot” areas, where population density and reservoir density are both high. Administrative boundaries were used as a first step in selecting “hot spots”, with the most detailed level being that of “departments” (N=351) (Fig. 1). Further refinements provided alternative geographical views of hot spots. The grid of the Climatic Research Unit was used to pixelize the country: this allowed an objective identification of clusters of reservoirs. A Digital Elevation Model was used to develop a hydrographic perspective and to identify target basins. The atlas was developed using only the most recent available secondary databases provided by official sources (to insure the fingerprinting of data). Merging and interconnecting these heterogeneous datasets was challenging. This disparate information was “homogenized” in a metadata base, and a customized GIS was developed to combine data and generate maps.

Small Reservoirs Toolkit
2
Figure 1: Examples of tools used to the selection of hot spots, clusters of reservoirs and target basins for the implementation of SRP activities in Burkina Faso.
Later, tool developers recognized that the atlas could also be valuable to a broader range of users. Subsequent versions of the FasoMAB atlas aimed to more broadly share basic information on the main characteristics of lakes and reservoirs in Burkina Faso, through a limited series of maps and commentaries. The goal was not to provide a definitive description: every day, reservoirs are built or destroyed. Rather, it aimed to contribute to a better assessment of reservoirs, and to stimulate further initiatives in reservoir characterization. From a pragmatic point of view, the atlas facilitates visualizations ("the power of maps") of reservoirs and illustrates their role and importance. The tool described herein illustrates some of the insights gained through the FasoMAB atlas.
Target group of the tool Target groups for this tool include people concerned with small reservoirs in Burkina Faso, and people interested in developing an atlas similar to FasoMAB for their region of interest.
The FasoMAB atlas as such was developed to share small reservoir information with the National Water Management Directorate (DGRE), an institutional partner of SRP in Burkina Faso. FasoMAB is accessible online via the DGRE and IRD web sites.
Requirements for tool application Secondary databases from different institutions were used in developing the atlas (Table 1). These databases often utilized different geographical attributes, so cross-validation was required. GIS specialists performed a meticulous and time-consuming comparison and validation of data from different sources, and organized data in a meta-system.
Different categories of data were used:
- Registers and inventories (reservoirs, populations, etc.) developed by national institutions such as DGRE and the National Institute for Statistics and Demography (INSD). Although various attributes and descriptors are included in these data sets, information was not always systematically georeferenced. One exception is a new DGRE database (PEM: Modern Watering-Places, 2006) that for the first time provides reservoir locations and population data with georeferenced attributes for the entire country. After cleaning and preparation, this data base was used extensively (see limits in Table 1).

Small Reservoirs Toolkit
3
- Thematic maps (administrative limits, hydrographic networks, and geomorphology, etc.). When maps covering the same variables were provided by more than one source, it was necessary to correct and merge them (e.g., the DGRE and National Geographic Institute maps of the hydrographic network). Sometimes data were georeferenced using different projection systems. The DGRE uses a geographical reference system incompatible with currently accepted geographical format. The use of an alternative resource (Digital Terrain Model SRTM90, NASA) allowed a clarification of the hydrographic network. Other thematic data, not georeferenced, were provided as polygons.
- Remote sensing information provided by IGB, corresponding to a Landsat TM-based description of land use at the national scale from two different periods (1992 and 2002). Important limitations regarding these data sources are described below (Table 1). This data base is unique in providing a national and synoptic perspective. Thematic maps and remotely sensed information provide details on the extent and distribution of water masses, but have limitations when individual attributes (e.g. age) are of interest.
The FasoMAB pilot Atlas was developed by combining information from these different sources so as to characterize the status of surface waters in Burkina Faso within a human and biophysical context. FasoMAB is a small "pilot" project. A more complete version of this kind of tool would most appropriately be developed by national or basin level agencies, using a regularly updated and uniform data format shared by all agencies. It should be a public good accessible to all users.
Tool: description and application
Thematic data
Data used in the creation the FasoMAB Atlas are listed in Table 1.
Verification, treatment, and modification
Data were systematically verified (quality, mode of acquisition, comparison of sources) and treated (reformatting and organization). Whenever necessary, records were modified (localized, substituted, deleted, or extended). Finally they were validated, a step which consisted of defining quantitative limits and a few subjective standards. Missing or inadequate data were recreated if they could not be found in other available data sets.
Projection system
ArcGIS was used to incorporate all collected information and to generate maps. ArcGIS uses the first northern UTM zone (zone 30N) projection, based on the WGS 84 datum. Our data are most densely concentrated in this zone, and WGS 84 is the datum used by the global positioning system (GPS). Thus, this choice facilitates the importation of new data without excessive treatment.

Small Reservoirs Toolkit
4
Type Name Source Treatment
Departments
BNDT (National database on places and territories) from IGB (Geographic Institute of Burkina Faso)
Verification and modification of polygons. Projection and creation of identifiers.
National boarders, Provinces, Regions BNDT Verification of boarders (different versions depending on date and eventual local
conflicts).
BNDT PEM 2006 (Modern Water Resources) database from DGRE (General Direction of Water Resources) RGPH 1996 (National Population Census) from INSD 2005 (National Institute for Statistics and Demography)
There are 2 tables for villages in the PEM database. For the first (10,307 records), populations (from RGPH 1996) are available in 76% of records. The second (8,909 georeferenced records) provides information regarding habitat and activities. These two tables have been merged and verified: comparison with "paper" census of 1996, verification of localizations with BNDT 2002 and eventual relocalization, etc. Finally, 8,302 georeferenced villages (among the 8,909) are available with their populations. It has to be mentioned that all the information provided by the second database has been completely modified (data extraction, codification, format, etc.) to be exploitable (toward Access requests).
limits : After several verifications and confrontations of the different available date resources, the majority of villages appeared correctly georeferenced. However a fraction (724) of these villages remained localized out of their administrative department where their populations are nevertheless aggregated. Only 80 of them are localized at more than 5 km from their administrative department. We hypothesize that, owing to the augmentation of the number of departments in 1996 (from 301 to 350), some villages are still today administratively attached to their "older" department, inducing the observed discrepancies.
GroundwaterPublic fountains (BF), Watering Places (PEM), Distribution network (SD)
PEM 2006
Creation of identifiers; verification of localization (in the PEM database, watering-places are identified by the village's code: it's possible to measure the distances between infrastructures and villages, and to eventually correct their localization); modification (extraction and codage) of data.
Surface water Lakes and reservoirs
PEM 2006 from DGRE (725 reservoirs), PPB/BAD 2001 (Small Reservoirs Project of African Bank for Development) from DGRE (1450 water masses)
These two bases have been compared and merged. The important discrepancies between the information they provide and the field's realities are discussed hereafter.
Access to water Domestic water providing RGPH 1996 from INSD 2000 Departments are the finest available grain.
National and international basins
Created in using the DTM (Digital Terrain Model) SRTM90 from NASA: existing data appear either false, or insufficiently precise, or provided in unknown projection system. Creation of identifiers, ordering and classification.
version for representation verification, adaptation and modification of the hydrographic network provided by the BNDT 2002.
version for eventual further modelizations created following the DTM (Digital Terrain Model) SRTM90 from NASA.
Topography DTM SRTM90 from NASABDOT 2002 (Land Use National Database) from IGB, Geomorpho 2002 from IGB
Simplification of classes (20 intially and 9 finally), rasterization.
limits : The results of the diachronic approach (differences in land use at the national scale between 1992 and 2002) where intriguing. After a meeting and discussions with the responsible of the BDOT project at IGB, we decided to invalidate all the 1992 data base, except water, owing to important biases associated to the (visual) discrimination of land use classes for the 1992 coverage (see text hereafter). It was a deception not to be able to realize such a diachronic approach, even at short time scale (ten years).
Meteorology CRU 2006 (Climatic Resarch Unit), 10' x 10'
Geomorphology, Land use in 1992 and 2002
Land and land use
Administrative
Hydrographic network (2 versions)
Hydrography
Villages
Table 1: Types, names, sources and treatments of data used for the implementation of the FasoMAB’ GIS.
Illustration of results Burkina Faso is a small (274,000 km2) land-locked West African country. It falls within the large northward swing of the Niger River. About a third (30.5 %) of the national territory, mainly in the northern and eastern parts, lies in the Niger basin (Map 1). Most of the country (63.1 %) is in the upper end of the Volta Basin. The remaining (6.5 %), bordering Mali and Ivory Coast, drains into rivers that constitute the Comoé basin. In Burkina Faso, the Volta basin is largely comprised of two large watersheds, the Mouhoun (former Black Volta, 53 % of the Volta basin’s area in Burkina Faso) and the Nakambé (ex-White Volta, 47%).

Small Reservoirs Toolkit
5
Map 1: Location of Burkina Faso (West Africa)
Owing to their different characteristics (size, latitude, etc.), these basins carry very different quantities of water across Burkina Faso’s borders. With an annual flow into Ghana of more than 5 km3 (via the Nakambé and Mouhoun rivers: Table 2), the Volta basin is of paramount importance (Andreini et al. 2002). It is crucial to the hydrologic budget of Lake Volta in Ghana.
BasinAnnual Flow at Boarder (km3)
Population (inh./km2)
relative anthropogenic
pressureComoé 1.55 19.6 0.52Niger 0.87 23.3 0.62
Mouhoun 2.64 40.6 1.08Nakambé 2.44 52.9 1.40
Burkina Faso 7.50 37.6 1.00 Table 2: The transboundary basins of Burkina Faso (data: populations, INSD 2000; hydraulic features, DGRE 2001).
A large fraction of the national population of Burkina Faso resides in the Volta basin. Population densities are high, especially in the Nakambé basin (see Table 2). Anthropogenic pressures exerted on resources (population densities used as proxy) are expected to be two to three times greater than those in the Comoé and Niger basins.

Small Reservoirs Toolkit
6
Lakes and reservoirs in Burkina Faso
Information on the lakes and reservoirs of Burkina Faso are available from two main sources: official inventories provided by DGRE (cut-off date 2001) and remote sensing data on water bodies with surface area greater than five hectares, as described by the BDOT (IGB) in 2002.
DGRE database
The DGRE data are presented as a series of attributes (location, administrative features, technical characteristics, date of construction, type and dimensions of dikes, heights and volumes, etc.). In theory, these are provided for 1450 records (Map 2).
Map 2: Location of the 1450 lakes and reservoirs in Burkina Faso (DGRE records). The class < 0.2 Mm3 also includes reservoirs whose capacity is unknown
Apart from location and administrative features that could be confirmed from other sources of information (location by BDOT; administrative features by BNDT) none of these characteristics could be verified. Moreover, only a fraction of records are complete.
Age of reservoirs, as one example, is an important parameter for which 1053 records (72.6 %) are available (Fig. 2). The oldest reservoirs are over a century old! Today, this water constitutes a normal component of landscape: uses and users have evolved together. Half of registered reservoirs were built between 1974 and 1987, during a dramatic drought that affected all West Africa. Dams were constructed to secure water for people and their livestock. Building reservoirs as a form of insurance against drought continues today and is likely to continue for the foreseeable future.

Small Reservoirs Toolkit
7
The census of DGRE indicates that 335 reservoirs were built in the 14 years between 1988 and 2001, approximately 24 per year. Following this same pattern, 143 reservoirs were built in the six years between 2002 and 2007. Assuming this trend continues, 198 reservoirs will have been built recently, bringing the total number of reservoirs in Burkina Faso to about 1650
Where are they? What are their sizes?
10 12
65108
523
335
0
100
200
300
400
500
< 1910 1912-1939 1940-1956 1957-1973 1974-1987 1988-2001
Periods
Reservoirs
0
200
400
600
800
1000
Cumul
Figure 2: Age of reservoirs in Burkina Faso (N = 1053). The drought period (1974-1987) is indicated in grey.
Capacities of reservoirs
Volume is registered for 1015 reservoirs (70 % of the records) in the DGRE census (Fig. 3).
6 3 21194
118
284
497
0
100
200
300
400
500
< 0,001 <0,01 <0,1 <1 <10 <100 <1000 >1000Size classes
N
0
10
20
30
40
50
60
70Mm3 (% total)
Figure 3: Size distribution (volumes) of reservoirs in Burkina Faso (DGRE database).
Two large reservoirs (Bagré and Kompienga, 1.7 and 2 km3 respectively), both in the Southern part of the Nakambé basin (see Map 3) account for more than 60 % of national water storage capacity (Fig. 3). Conversely, the nearly 900 small reservoirs, each with a capacity of less than 1 Mm3, together account for less than 4% of national storage capacity.
The number and size of the reservoirs depends on their location in the drainage network. In general, there is an inverse relationship between the number of reservoirs and their size: the smaller, the more numerous. Both the histogram and the frequency distribution of registered
0
200
400
600
800
1000
0.00001 0.001 0.1 10 1000V: Volume (Mm3)
N: N
umbe
r of l
akes
> V
olum
e

Small Reservoirs Toolkit
8
volumes indicate a truncation of the observed distribution, reflecting the fact that small-size infrastructure tends to be poorly represented in official data (Meybeck 1995, Lehner & Döll 2004). We therefore postulated that the DGRE database significantly underestimates the number of very small reservoirs. It should be noted, however, that doubling the number of the smallest reservoirs (less than 1 Mm3) does not significantly change the relative contribution of different size categories: the largest reservoirs continue to represent more than 93 % of national storage capacity.
The Volta basin is particularly important (Tab. 3): 85% of national storage capacity is held in reservoirs located on the Nakambé or its tributaries, confirming the strategic role played by this basin in Burkina Faso.
Basins <0.2[ [0.2-1] ]1-5] ]5-10] ]>10 Total Stocked %Comoé 0 3 17 6 89 0.11 0.06 49.0Niger 6 28 42 74 83 0.23 0.10 42.2
Mouhoun 9 28 36 20 370 0.46 0.29 61.6Nakambé 18 88 116 30 4182 4.43 2.24 50.5
Total 33 146 211 130 4724 5.24 2.68 51.1
CapacityClasses (Mm3)
Table 3: Reservoir capacity Burkina Faso - stocked capacity corresponds to the mean interannual volume stocked within reservoirs as estimated by DGRE (2001)
Around fifty percent of the total storage capacity is replenished annually (DGRE 2001). Yearly filling of reservoirs is not systematic; a large fraction of stored water is used immediately, mainly for hydropower, irrigation and tap water. For the Nakambé river and its tributaries, the amount of water stored in reservoirs each year corresponds to the annual inflow of the river (see table 2): transboundary water sharing for this watershed is of particular relevance.
BDOT
The classification procedure applied by IGB for land use characterization (BDOT) allows for the description of all water bodies with surface areas greater than five hectares. It provides synoptic information, at the national scale, that includes both location and size. Unfortunately, no clear indication is given regarding seasonal and hydrologic status (high versus low water). In order to use information provided by BDOT, two major assumptions were used:
- The addition of all water bodies identified by the automatic classification procedure used by IGB for the treatment of the 2002 remote sensing sources (Landsat TM; see § limitations of the tools) provides a minimum value. We assume that identified water bodies of more than five hectares of surface area were effectively present. Given the likelihood that surface area was undercounted because of seasonality (e.g. low versus high levels), and some reservoirs were not detected by remote sensing because they were too small or dry, the estimates given below should be considered as minimum values.
- The spatially heterogeneous visual treatment used for the establishment of the BDOT 1992 data made unrealistic an analysis of land use evolution from 1992 and 2002 (see § limitations of the tools). Nevertheless, because of the unambiguous (visual) detection of

Small Reservoirs Toolkit
9
water bodies with surface areas greater than five hectares on Landsat TM colored compositions (> 50 pixels 30m x 30m), the values indicated for 1992 will also (e.g. as for 2002) constitute a minimum. Seasonal reasons (e.g. low water levels) as accuracy of treatments (more or less convincing) are likely to lead to underestimates of water surface area, and particularly the differences hereafter discussed between the two periods.
Spatial distribution of lakes and reservoirs
Around 1,050 km2 of water (0.4 % of the national territory, 274,000 km2) were automatically identified by IGB using a standardized procedure for the classification of 2002 remote sensed information (Map 2). They found, distributed across the country, 620 lakes and reservoirs with a surface area greater than five hectares. There is no simple relationship between rainfall patterns (here represented by the CRU data, see New et al. 2002) and reservoir distribution. Most reservoirs are concentrated in the central part of the country and along the Nakambé corridor. Burkina Faso is a relatively flat country with no significant topographical relief. The majority of water bodies are located at altitudes between 200 and 400 m. No relationship between size and altitude was detected, possibly because of the coarse resolution of data used in delineating elevation (100 m). The deepest reservoir of the country, Kompienga, lies under the 200 m isocline.
In the 2001 DGRE database, 1,450 reservoirs were inventoried. An unknown fraction of them are temporary. But in 2002, BDOT only identified 620 water masses: the discrepancy is large! One explanation may lie in seasonality. A complete Landsat TM coverage of the country for land use characterization may reasonably be obtained during the dry season, when cloud cover is minimal, and when contrasts between land use classes are said to be most apparent. For the four largest reservoirs in the country (Kompienga, Bagré, Ziga and Yako), observed sizes in 2002 corresponded to around 70% of their maxima. It’s reasonable to assume that the BDOT classifications were made with dry season pictures. This implies that smaller water bodies may have dried out, or may have been too small to be depixelized, explaining some of the observed discrepancy.
The DGRE database indicated that some 24 reservoirs were built each year between 1988 and 2001 while 240 reservoirs appear to have been built between 1992 and 2002. The BDOT indicates an increase of only 79 reservoirs between the two periods. In accord with the previous discussion, we argue that the BDOT identified perennial systems large enough to contain dry season water. This once again highlights the inadequate representation of the smallest reservoirs.
Small Reservoirs Toolkit
10
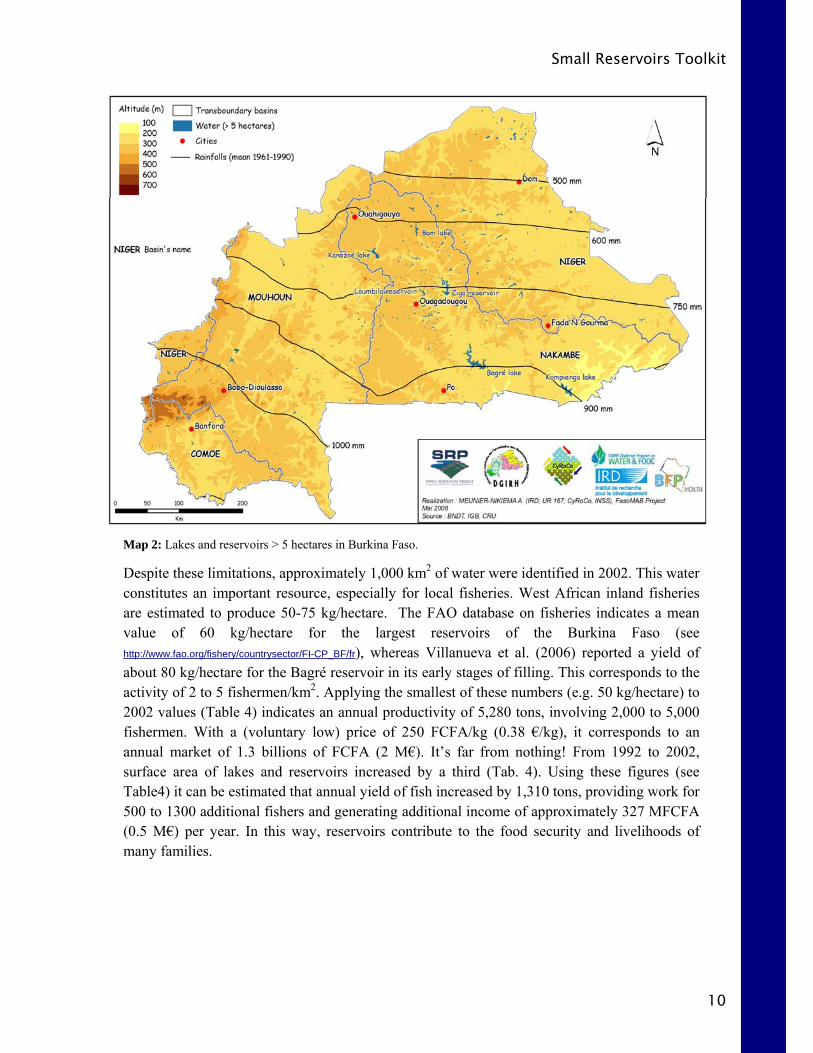
Map 2: Lakes and reservoirs > 5 hectares in Burkina Faso.
Despite these limitations, approximately 1,000 km2 of water were identified in 2002. This water constitutes an important resource, especially for local fisheries. West African inland fisheries are estimated to produce 50-75 kg/hectare. The FAO database on fisheries indicates a mean value of 60 kg/hectare for the largest reservoirs of the Burkina Faso (see http://www.fao.org/fishery/countrysector/FI-CP_BF/fr), whereas Villanueva et al. (2006) reported a yield of about 80 kg/hectare for the Bagré reservoir in its early stages of filling. This corresponds to the activity of 2 to 5 fishermen/km2. Applying the smallest of these numbers (e.g. 50 kg/hectare) to 2002 values (Table 4) indicates an annual productivity of 5,280 tons, involving 2,000 to 5,000 fishermen. With a (voluntary low) price of 250 FCFA/kg (0.38 €/kg), it corresponds to an annual market of 1.3 billions of FCFA (2 M€). It’s far from nothing! From 1992 to 2002, surface area of lakes and reservoirs increased by a third (Tab. 4). Using these figures (see Table4) it can be estimated that annual yield of fish increased by 1,310 tons, providing work for 500 to 1300 additional fishers and generating additional income of approximately 327 MFCFA (0.5 M€) per year. In this way, reservoirs contribute to the food security and livelihoods of many families.

Small Reservoirs Toolkit
11
BDOT N A (km2) P (km)1992 541 794 32372002 620 1056 4043Dif. 79 262 806
Dif. (%) + 14.6 + 33.0 + 24.9 Table 4: Water surfaces associated to reservoirs as discriminated by BDOT in 1992 and 2002: N, number; A, area; P, perimeter.
Studies recently conducted in Gnagna province, a rural area located in the Sahelian Northeast part of Burkina Faso, have specifically highlighted the importance of fresh fish in the nutritional status of women, especially at the end of the rainy season (Savy et al., 2006). This period corresponds to a seasonal food shortage, when cereal stocks from the previous harvest are depleted, and before the next harvest is gathered. It also corresponds to a period of intense agricultural work when seasonal endemic disease, especially malaria, is at its peak. All these conditions contribute to the impoverished nutritional status of the population. Fresh fish, owing to its low cost and local availability, constitutes at this time of the year a significant nutritional resource for low-income households. Although rarely documented, it is probable that much of this fish is provided by small reservoirs and that these reservoirs are therefore an important factor in food security for poor people living near them.
In 2002, BDOT reported that the length of the shoreline associated with these water bodies was approximately 4,000 km. Applying the mean national population’ density (see table 2) to a buffer zone of 3 km along this shoreline indicates that about half a million inhabitants are in close contact with water (Keiser et al. 2005 used a distance of 2 km away from the shoreline of reservoirs to delineate the potential biting area of mosquitoes; 3 km is much less than the distance traveled daily by rural people to use water from reservoirs). This population could be considered at risk regarding water borne diseases (McCartney et al. 2007). The shoreline is the contact area between users and water bodies: it’s a place for labor, domestic water utilization, small scale production, and a place for leisure, especially for children. The shoreline is the principal hot spot for transmission of water borne diseases and contamination. From 1992 to 2002, the creation of 800 km of new shoreline has benefited about 90,000 people, making available goods and services associated with proximity to water, while also exposing them to exposure to water-related disease.
These estimates are probably on the low side. Reservoir surface area and length of shoreline are intermediate or minimum values owing to seasonal fluctuations in the dry season. We assume a huge underestimation for both area and length of shoreline due to the pixel size (11 pixels/hectare with Landsat TM) while the number of reservoirs is obviously underestimated.
How to deal with this last point?
Size distribution of reservoirs
Size (surface area) distribution of water bodies in 1992 and 2002 reveals interesting characteristics: the most striking feature is its linearity when drawn on a double logarithmic scale (Fig. 4). This indicates that the lake size distribution follows a power law in the form N =

Small Reservoirs Toolkit
12
xAy; an observation made already by various authors (Wetzel 1990, Meybeck 1995). If y = -1, the relationship becomes scale invariant, implying that the distribution of lakes and their sizes is fractal in form (Lehner & Döll 2004), as observed for small reservoirs in the Upper East of Ghana (Liebe 2002).
N (1992) = 103.28 A-0.984
R2 = 0.97
N (2002) = 131.33 . A -0.9405
R2 = 0.99
0.1
1
10
100
1000
10000
0.1 1 10 100 1000
A: Area (km2)
N: N
umbe
r of l
akes
> A
rea
Figure 4: Size distributions of the lakes and reservoirs distinguished by the BDOT in 1992 (N=541) and in 2002 (N = 620).
The application of these power laws allows the calculation of (theoretical) N values for the different size classes in 1992 and in 2002 (Tab. 5).
Area (km2) N cumul 92 N calc. 92 N obs. 92 Δ 92 N cumul 02 N calc. 02 N obs. 02 Δ 020.05 1969 973 86 887 2198 1053 86 9670.1 995 892 343 549 1145 1014 402 6121 103 93 102 -9 131 116 119 -310 11 10 9 1 15 13 12 1
100 1 1 1 0 2 2 1 1Total 92 1969 541 1428 Total 02 2198 620 1578
Table 5: Calculated size distribution of reservoirs in 1992 and 2002
Estimates of the size distribution of reservoirs in 1992 and 2002 are somewhat crude and should be used with caution. Having said this, the following points are highlighted:
- Regressions are strongly influenced by large systems. The addition of four large identifiable reservoirs (surfaces between 10 and 100 km2) between 1992 and 2002 significantly improved the fit of the regression (Fig. 4).
- Differences between calculated and observed numbers of reservoirs indicate that discrepancies are concentrated in the smallest size classes of reservoirs. (Tab. 5).

Small Reservoirs Toolkit
13
- In the BDOT report, for the smallest size class, 0.05 – 0.1 km2, the value N=86 is the same both in 1992 and in 2002 whereas for all the other classes, ‘N’ increased during the same period. This is not likely to be by chance, but rather an artifact of the visual treatment done for BDOT 1992. Assemblages of pixels are too small for a global and efficient “on-screen” discrimination. This class is also the most sensitive to seasonal variation and will be the most underestimated by BDOT, owing to the period of the year in which remote sensing images were taken.
- More interesting are the results associated to the size class, 0.1 – 1 km2. In both years, 1992 and 2002, and using processed remote sensing data, fewer than half of the theoretical number of water bodies were identified. Within this size range, the smallest reservoirs (100 hectares in surface area) are for the most part too large to dry out completely. Where present, they should at least have been identified by the automatic procedure applied by IGB in 2002. We conclude that, even if the number of reservoirs in this size class was underestimated, the underestimation should not be as important as the regression suggests. The DGRE census inventoried 1450 reservoirs in 2001: we already noted that the discrepancy between this number and the 620 water masses depicted by BDOT in 2002 is largely due to a systematic undercount of very small reservoirs. There should not have been a similar undercount for medium-size reservoirs of 0.1 – 1 km2. This supports the notion that there are still many locations “theoretically” eligible for reservoirs where construction has not yet taken place.
- Using information from the DGRE database, we estimated that 240 reservoirs were likely to have been built between 1992 and 2002, but BDOT information indicates that only 79 were constructed. We consider that the difference (240 - 79 = 161) should be attributed to smallest reservoirs (< 0.1 km2), the number of which did not change between 1992 and 2002 in BDOT (N = 86 for both periods). Therefore, we believe that in 2002 this class corresponded to an effective of (86 + 161) 247 reservoirs, increasing the total towards 781 in 2002.
From 1992 to 2002, 526 new km2 of water were identified by BDOT. Among them, 262 km2 (Tab. 4) were attributed to reservoirs: 264 km2, 50 % of this increase, has yet to be explained.
We postulated that BDOT systematically underestimated the number of very small reservoirs of less than 100 hectares surface area. In response, we increased the number of such reservoirs from 86 to 247. This addition of 161 reservoirs, however, only accounts for around 16 km2 in reservoir surface area. Even if this size class had been increased by a factor 10, the associated increase in reservoir surface area would not exceed 160 km2. Around 100 km2 remains to be explained. We conclude that apart from the artificial evolution of the water surface associated to the construction of new reservoirs, other factor(s) may be at play. A lag between the two seasons of remote sensed information acquisition could first be suggested as, independent of the presence (and number) of reservoirs at these two periods, there was more water (≈ + 38%) in 1992 than in 2002 [(264 – 160)/264 km2].

Small Reservoirs Toolkit
14
It follows that areas and shorelines described for 2002 correspond to minimum values that are clearly associated with ecosystems large enough to occupy significant surfaces “late” in the dry season. We conclude that the 620 water bodies identified in 2002 are all perennial water bodies.
Assembling BDOT and DGRE census
Among the 1450 records in the DGRE lakes and reservoirs census, data on essential characteristics (volume and surface area as estimated by the BDOT classification) are only available for 419 of them. Even with this reduced number of reservoirs, it is useful to explore relationships between these two parameters.
As previously discussed, BDOT 2002 provides data on surface areas and length of shorelines: there is (logically) a perfect allometric relationship between both (Fig. 5). This relationship validates the quality of data obtained from the BDOT. It also indicates a clear homogeneity in the form of the reservoirs.
A compactness coefficient (equivalent to the Gravelius coefficient for watersheds), called Shoreline Development Index (DL, Hutchinson 1957) was calculated as: DL = 0,282 * P * A-1/2 where P represents shoreline length in kilometers; A represents reservoir surface area in square kilometers; and DL is the ratio of the length of the shore line to the length of the circumference of a circle of area equal to that of the water system under consideration. Only a few lakes, such as crater lakes approach a circular shape, i.e., DL = 1. This coefficient is always greater than 1, and the closer the coefficient is to 1, the more regular the form of the reservoir. DL is strongly dependant on the size of water masses (Fig. 6), indicating that smaller reservoirs have a more simple morphology. It also reveals the global homogeneity of reservoirs both within (relatively small and non-recovering standard deviations) and between the different classes (regression). That sounds logical regarding their spatial distribution (Nakambé corridor mainly) and their dispersion within the low margins of the basin (between the 200 m and 400 m isoclines).
y = 0.0651x1.4247
R2 = 0.9251
0.01
0.1
1
10
100
1000
0.1 1 10 100 1000
Shoreline (km)
Area (km2)
Figure 5: Allometric relationship between areas and shorelines, as provided by the BDOT 2002, for the 620 water masses detected.

Small Reservoirs Toolkit
15
In general, reservoirs in Burkina Faso are known to have low mean and maximum depths. Apart from the Kompienga reservoir, the deepest of the country, which benefits from an undulated landscape, and from some rare medium systems located within the high course of Comoé River (e.g. Moussodougou, Douna), maximum depths rarely exceed 10 to 15 m. For perennial reservoirs, areas may vary from 1 to 1000 km2, with the maximum depths remaining relatively constant, varying between 5 to 15 m. This represents a factor of 1000 for area and a factor of 3 for depth. Reservoirs in Burkina Faso are mostly shallow lakes, with relative shallowness increasing with size.
1.66
1.57
1.40
1.28
y = -0.1289x + 1.7995R2 = 0.9848
1.2
1.4
1.6
< 100 < 10 < 1 < 0.1A (km2)
DL
Figure 6: Shoreline Development Index (DL) by size classes (N = 620, BDOT 2002).
This is consistent with previous observations regarding the morphology of reservoirs: as surface area increases, length of shoreline increases proportionally more rapidly in larger systems than in smaller ones, but involving very shallow areas. In other words, to increase water storage volume by one unit, the volume of larger systems will require proportionally more surface area than is required for smaller ones.
The same ensemble of objects, namely the lakes and reservoirs from Burkina Faso, were described by two completely independent data sources: the DGRE census and the BDOT classification. The census, done in 2001, and the BDOT, in 2002, are supposed to be contemporaneous, and thus comparable. The superposition of both distributions suggests a certain amount of redundancy (Fig. 7).

Small Reservoirs Toolkit
16
31.6
15.2
49.0
1.1 0.50.11.5
51.5
11.6
37.8
0
10
20
30
40
50
60
]< 0.1] ]0.1 - 1] ]1 - 10] ]10 - 100] ]> 100]
A (km2) - V (Mm3)
N reservoirs (%)
AreaVolume
Figure 7: Size’s distribution (% per classes) of lakes and reservoirs. Volume, V (Mm3): DGRE census, N=1015; Surface, A (km2): BDOT 2002 modified to take into account the smallest reservoirs, N=781.
Both distributions apply to the same ensemble of objects: the relative contribution of different size classes reveals a coherent pattern, in volume as in surface, indicating again the predominance of small (< 1 km2 / 1 Mm3) even very small (< 10 hectares / 100 000 m3) water bodies. Unfortunately, no information is provided regarding relationships linking volumes and surfaces.
Volumes provided by the DGRE census and areas from the BDOT 2002 are available for 419 water masses. A significant tendency links these morphological traits (Fig. 8).
The two larger reservoirs (Bagré and Kompienga) were eliminated. Three small size outliers have been (graphically) identified and were simply discarded because of evident error for their volumes. For the larger systems (grey dots on Fig. 8), two apparent outliers have also been identified and obvious typographic mistakes corrected. But it is not possible to proceed in this way for the whole data base, if only due to the absence of any external reference allowing the validation of the information provided. Overall tendencies alone can be proposed.
For each record, we first estimated its theoretical volume by applying the regression (Fig. 8), the compared these estimates to values provided by the DGRE census. We eliminated all records in which volume was over- or underestimated by more than 75 %: 277 records remained available for further regression analysis: V (x 1000 m3) = 1,612 x A (km2), R2= 0.95.
Applying this second regression to the 618 records < 100 km2 provided by BDOT indicates that 1.2 km3 were stored in these perennial water bodies during the 2002 dry season. We previously observed that the BDOT 2002 classification underestimated volumes by about 38 %, compared to the 1992 classification. We also indicated that the surface surfaces provided by BDOT 2002 for the larger reservoirs of the country were underestimated by around 30 %.

Small Reservoirs Toolkit
17
It seems thus appropriate to apply such a coefficient to the estimated volumes, for which reason we propose a storage capacity of (1.2 km3 + 30 %) = 1.56 km3. Adding the cumulated capacities of Bagré and Kompienga indicates that 5.26 km3 were stored in 2002. This corresponds to values provided by the DGRE census (Tab. 3) but without taking in account the numerous < 0.1 km2 reservoirs (30 to 35 % of the total, Fig. 7). We already observed, however, that the contribution of very small reservoirs to overall water storage capacity is small, regardless of their number.
y = 1543.8xR2 = 0.7274
1
10
100
1000
10000
100000
0.01 0.1 1 10 100
Area (km2)
Volume (x 1000 m3)
Figure 8: Allometric relationship linking volume (V) and areas (A) for 414 lakes and reservoirs < 100 km2 from Burkina Faso. Blue dots: < 1 km2, red dots: [1 – 10] km2, grey dots: > 10 km2.
Even if this assertion can be accepted at a national or sub-national scale, its relevance is doubtful at local scales. Water storage facilities are a resource, particularly in arid country, and as such contribute to increased water availability and reduced water poverty.
About water resources and availability in Burkina Faso
Map 3 provides an illustration of a more sophisticated treatment allowed by the FasoMAB project. The PEM database (DGRE 2006) indicates the location of all groundwater distribution devices built in Burkina Faso. We added all reservoirs as inventoried by the DGRE (2001) database, and projected both categories of water resources onto a map of the hydrographic network (a combination of BDOT 2002 and those that has been created with the SRTM numerical model). A three km radius buffer has thus been created around each of the georeferenced point indicating the presence of a water providing device. Any point of the territory that is located out of this buffer is declared as “water scarce area” and appears with a pink color on Map 3. WHO (Howard & Bartram 2003) defines a distance of more than one kilometer as a “no water access” situation, with inevitable negative health consequences. By

Small Reservoirs Toolkit
18
increasing this distance to 3 kilometers to minimize the effects of local heterogeneities, large intra- and inter-regional differences are illustrated more clearly. Water devices are defined here as points. For lakes and reservoirs, polygons should have been used: their shorelines are indeed systematically used by local communities. Pink areas around the Bagré and Kompienga lakes (in the southern part of the Nakambé basin) are thus misleading.
The observed distribution of water scarce areas is characterized by extreme patchiness. An important fraction of the country is “water scarce” (as defined above), and large areas appear to lack water infrastructure. These areas may constitute target areas for future water-related investments.
The lack of “water scarce” zones in the central part of the country constitutes a dramatic exception. The concentration of water provision devices within the Nakambé basin (dark line on Map 3) is obvious: surface water and groundwater are intensively exploited. This area corresponds to the most densely populated zone in the country. Understandably, water storage investments have been made in areas with high population density.
Map 3: Water scarcity in Burkina Faso. The mooré linguistic area delineation provided by BNDT corresponds to the extension of the “Moogo” kingdom at the end of the 19th century, as indicated by Izard (2004, p. 114).
The delineation of the linguistic area shared by the Mossi folk (red line on Map 3) provides another insight into this concentration of infrastructures. It probably highlights the resilience of a traditional, but still powerful political elite that continues to steer development projects to its own area.

Small Reservoirs Toolkit
19
Conservation areas, free of human settlements are also of interest: most of them (dark green on Map 3) are not equipped with water harvesting devices, as theoretically there is nobody to use them. The Nakambé corridor, East of Ouagadougou, constitutes a noticeable exception. All clear green zones correspond to areas theoretically free of population that appear either pressured on their borders (as particularly apparent in the western part of the country, along the Mouhoun River and its tributaries), or completely invaded (see the two conservation areas located east of Bobo Dioulasso). In this last case, the people are refugees recently resettled from Côte d’Ivoire (Courtin 2007).
These two last points introduce a fundamental dimension: the historical perspective. The map illustrates the location of all georeferenced watering places in Burkina Faso. Their obvious concentration in the central part of the country has a historical foundation. The delineation of the Mooré linguistic area in Map 3 corresponds to an area degraded for many years (Izard 2004). With a mean population density of 15 persons/km2 at the end of the 19th century, with important exceptions (the desertion of inland valleys, the scattering of settlements, and concentrations in focal places), the former “Moogo” kingdom appeared to be densely settled. It’s seems paradoxical given the unfavorable soils found in this area. It is may be that population pressure on resources and consequent land degradation have been underway for a long time.
The situation observed on the periphery of conservation areas points to the existence of another scale of change, related to contemporary dynamics. If in some places the resettlement of refugees (at one time a priority) explains the erosion of protected areas, in other places degradation can be traced to increased population density in bordering buffer zones. These examples highlight the location-specific demographic dynamics that may induce resource degradation.
With regard to the “contexts” of small reservoirs, earlier described as an important part of our tool, two dimensions are of concern, both related to water quality. In two separate tools, the Nakambé basin will be revisited with regard to intensification of agricultural practices near reservoirs, and the development of cyanobacterial communities in reservoir water. It is hypothesized that driving pressures are exerted by watersheds on the global metabolism of reservoirs, and that these pressures determine the structure of the living communities in reservoirs. The influence of land use is now clearly established (Burford et al. 2007) and diachronic insights have been proven to be important (Harding et al. 1998). It creates a very complex situation, however, and proxies and indicators (and the data to estimate them) are needed at suitable scales for both current and historical conditions. It couldn’t be the case with a global perspective. This constitutes a main limitation of our tool.
Limitations of the tool
Reservoirs themselves
It is well known that even for large systems, the reservoir census provided by DGRE is not complete. Neither the Ziga reservoir of 200 Mm3, recently constructed to provide drinking

Small Reservoirs Toolkit
20
water to the capital, nor the 75 Mm3 Kanazoe Dam are included. Both are amongst the ten largest reservoirs in the country and both lie in the Nakambé River.
It is by definition very difficult to quantify measurement error for small reservoirs. We estimated in comparing our data to maps provided by the RESO Project (a regional inventory of water resources) that in some places (along the southern portion of the Mouhoun River, particularly) the official reservoir database includes fewer than 70% of existing dams. Numerous dams constructed after 2001 may also not be included in the DGRE database. Furthermore, although there has been a general increase in the number of dams, new construction is not necessarily occurring at the same rate in different parts of the country. Even if their contribution to the national water budget remains small, their local influence is always of great importance.
Land Use
The BDOT (Base de Données d’Occupation des Terres, "Land Use Data Base") provides information on land use for the whole country. This came out of a project sponsored by Burkina Faso’s Projet National de Gestion des Terroirs (PNGT; “National Land Management Project”) and carried out by IGN-France International in partnership with the Geographic Institute of Burkina (IGB). BDOT uses the hierarchical nomenclature standardized by CORINE LAND COVER, which was initially developed for the European Union and later validated for tropical zones. Land use is described using pixels whose size can range between 5 and 25 hectares according to land use classes.
The current BDOT database consists of three elements: data collected in 1992 and 2002, and a third field named “changes” which summarizes all the differences in land use values between the two periods. It has a resolution of 5 hectares and can be theoretically considered as a dynamic view of the changes that occurred during the decade. This third field, however, has turned out to be unusable. The 2002 database is valid: it was created automatically by a standard procedure and provides local data at the national scale. The 1992 database, on the other hand, was constructed manually by superposing the BDOT 2002 data and a classification of Landsat images taken in 1992. Changes in land use were detected by examining the two images on the screen. To accomplish this, the country was partitioned into 200,000 square tiles; these were then assigned to various IGB operators for processing.
The noticeable heterogeneity of the “changes” data (Fig. 9) thus reflects the relative skill, precision, and patience of the operators. The central part of the country contains the greatest number of reservoirs and a very large population, and is therefore crucial to any mobilization of water resources. Yet, quite obviously, this strategic region is far from being the best documented. Is the absence of visible change actually attributable to the fact that local development of dam infrastructure has been on a scale too small (< 5 hectares) to be detected? Or does this zone’s apparent stability simply reflect the operators’ lack of proficiency in data processing? In the end, the 1992 BDOT and the “changes” database were not used in our analysis. We only keep the water surface estimates provided by BDOT 1992, as it is assumed that even visual inspection allows a minimal detection, at least for medium size’ reservoirs.

Small Reservoirs Toolkit
21
Figure 9: The BDOT “changes” database.
Population
Today 650,000 people, or about 5% of the national population, are not correctly geo-referenced. If one assumes that this population is uniformly scattered at the national level, then no bias is introduced. This assertion becomes less valid when zooming in on smaller areas. The “villages” database (N>8000) that we have constituted represents the fundamental unit of the GIS. Its coherence is assumed on the scale of departements (N=351) or basins of several thousand square kilometers. However, the validity of this data base will have to be confirmed on a case-by-case basis for any geographic units of smaller size (notably for basins covering tens to hundreds of square kilometers). On the scale of the Nariarlé Basin1, for example, specific validation reduces the uncertainty to about 2% of the basin’s 150,000 inhabitants.
Lessons learned and perspectives By combining different sources of information, it has been possible to develop a synthetic description of lakes and reservoirs in Burkina Faso. The number of these lakes and reservoirs has obviously been underestimated by the official census and should be increased by at least 10%. To correct the database for large systems is not problematic. It is difficult or impossible to rectify information for small systems, due to the absence of an external reference. Remote sensed information was limited by seasonality. It did allow us to show that the information from both sources (DGRE census and BDOT classifications) was consistent: the same objects (e.g. reservoirs) were identified. The very high number of small even very small systems is highlighted. However, owing to their small size, even a doubling of their number would not
1 As of today, this basin contains the highest known density of reservoirs in West Africa: more than 50 in a region of about 1500 km2.

Small Reservoirs Toolkit
22
diminish the importance of a small number of large reservoirs with regard to water storage capacity in Burkina Faso.
In the highly populated Nakambé basin the annual flow is retained principally in only four reservoirs, four of the largest five in the country. The Nakambé also exhibits the most elevated number of small reservoirs, constituting a very dense network of distributed storage.
In general, reservoirs show a similar morphology: they tend to be shallow and open, because of the flat landscape. They have large surface area to volume ratios, with long and sinuous shorelines. These conditions are conducive to evaporation losses.
It is estimated that a minimum of half a million of people are living less than 3 km from a perennial reservoir, mostly within the Nakambé corridor. Historical reasons explain the concentration of reservoirs within this basin where both (i) long term degradation and overexploitation of watersheds, and (ii) recent dynamics associated to agricultural intensification processes around reservoirs, may exert strong influences on the functioning and properties of reservoirs.
The combination of data provided by DGRE and BDOT allow ultimately the establishment of a crude relationship linking areas and volumes of reservoirs at the national scale.
References and further reading Andreini M., Vlek P., Van de Giesen N., 2002. Water Sharing in the Volta Basin. IAHS Publication 274:
329-335.
Burford M. A., Johnston S. A., Cook A. J., Packer T. V., Taylor B. M. and Townsley E. R., 2007. Correlations between watershed and reservoir characteristics, and algal blooms in subtropical reservoirs, Water Research 41: 4105-4114.
Cecchi P (Ed.) 2007. L’eau en partage: les petits barrages de Côte d’Ivoire. Collection Latitudes 23. IRD Editions. Paris.
Courtin F. 2007. Les dynamiques de peuplement induites par la crise ivoirienne dans l'espace ivoiro-burkinabé, au regard de la maladie du sommeil. Ph D thesis, geography, Université Montpellier 3, France.
DGRE, 2001. Etat des lieux des ressources en eau au Burkina Faso et de leur cadre de gestion. Ouagadougou : Direction Générale des Ressources en Eau – GIRE, 243 p.
Howard G. & Bartram J., 2003. Domestic water quantity, service level and health. Informal paper WHO/SDE/WSH/03.02, 36 p. http://www.who.int/water_sanitation_health/diseases/wsh0302/en/index.html
Harding J. S., Benfield E. F., Bolstad P. V., Helfman G. S., Jones E. B. D., 1998 - Stream biodiversity: the ghost of land use past. Proceedings of the National Academy of Sciences of the United States of America 95: 14843-14847.
Hutchinson G. E., 1957. A treatise on limnology, vol. 1. Geography, Physics and Chemistry. Wiley. 1015p.
INSD, 2000. Analyse des résultats du Recensement Général de la Population et de l’Habitation de 1996. Volume 1. Ouagadougou : Institut National de la Statistique et de la Démographie (INSD), 348 p.

Small Reservoirs Toolkit
23
Izard M., 2004. Moogo - L'émergence d'un espace étatique ouest-africain au XVIe siècle. Karthala, Paris, 400 p.
Keiser J., Caldas de Castro M., Maltese M. F., Bos R., Tanner M., Singer B. H., Utzinger J., 2005. Effect of irrigation and large dams on the burden of malaria on a global and regional scale. American Journal of Tropical Medicine and Hygiene 72(4): 392-406.
Lehner B., Döll P., 2004. Development and validation of a global database of lakes, reservoirs and wetlands. Journal of Hydrology 296: 1-22.
Liebe J., 2002. Estimation of water storage capacity and evaporation losses of small reservoirs in the Upper East region of Ghana. Diploma Thesis, Département de Géographie, Université de Bonn, RFA, 106 p.
McCartney M. P., Boelee E., Cofie O., Mutero C. M., 2007. Minimizing the negative environmental and health impacts of agricultural water resources development in sub-Saharan Africa. IWMI Working Paper 117.
Meybeck M., 1995. Global distribution of lakes. In Lerman A., Imboden D.M., Gat J.R. (Eds.), Physics and Chemistry of Lakes. Springer, Berlin, pp. 1-36.
New M., Lister D., Hulme M., Makin I., 2002. A high-resolution data set of surface climate over global land areas. Climate Research 21: 1-25.
Savy M., Martin-Prével Y., Traissac P., Eymard-Duvernay S., Delpeuch F. 2006. Dietary diversity scores and nutritional status of women change during the seasonal food shortage in rural Burkina Faso. The Journal of Nutrition 136: 2625-2632.
Villanueva M. C., Ouedraogo M., Moreau J., 2006. Trophic relationships in the recently impounded Bagré reservoir in Burkina Faso. Ecological Modelling 191: 243-259.
Wetzel R.G., 1990. Land-water interfaces: Metabolic and limnological regulators. Verh. Int. Ver. Limnol. 24: 6-24.
Contacts and Links Philippe CECCHI, IRD - UMR 5119, Université Montpellier 2, Place Eugène Bataillon, CC
093, 34095 Montpellier Cedex France, [email protected]
Link (in French):
http://www.smallreservoirs.org/full/publications/posters/Q13-IRD-AfricaGIS_ConferenceSum-0907.pdf