TOWARDS ACTIVITY RECOGNITION IN MOVING OBJECT...
12
TOWARDS ACTIVITY RECOGNITION IN MOVING OBJECT TRAJECTORIES FROM TWITTER DATA Marco Aurelio Beber 1 , Carlos Andres Ferrero 2 , Renato Fileto 1 , Vania Bogorny 1 1 Programa de P ´ os-Graduac ¸˜ ao em Ciˆ encia da Computac ¸˜ ao (PPGCC) Universidade Federal de Santa Catarina (UFSC), Florian´ opolis, SC, Brasil 2 Coordenac ¸˜ ao de Inform´ atica e Ciˆ encia da Computac ¸˜ ao Instituto Federal de Santa Catarina (IFSC), Lages, SC, Brasil [email protected], [email protected], {r.fileto,vania.bogorny}@ufsc.br Abstract. The knowledge about people daily activities is of great value for sev- eral application domains. On the one hand, the activity recognition in trajec- tories has not been deeply investigated. On the other hand, social media data such as tweets can be rich in information about where people go and what they do. We strongly believe that the integration of trajectory data and social media can reveal the activities performed by individuals in daily life. In this paper we propose a new method to infer moving object activities from their trajecto- ries, using knowledge extracted from Twitter data. We evaluate the proposed approach with two datasets and show that it outperforms current works. 1. Introduction The knowledge about which activities people do at certain Points Of Interest (POIs) can be of great value for several applications. For instance, recommendation systems could infer user activities from visited locations obtained from their Google account 1 and sug- gest new places based on the inferred activities. Architects and city planners could project better public spaces, such as parks, based on how people perform activities. Augmented reality games, such as Pokemon Go 2 , could improve the security of the players by warn- ing them about suspicious activities at POIs to prevent cases of robbery. We are living the era of big data, where individuals are constantly leaving traces of their movements and their activities. Even though we are not fully aware of it, we are tracked everyday. Our spatiotemporal traces can be delineated as moving object tra- jectories. A raw trajectory is a temporally ordered sequence of geographical coordinates associated with a timestamp, which does not present explicit semantics. A semantic tra- jectory [Spaccapietra et al. 2008] is represented as a sequence of stops and moves, where stops are the places visited by the object. Bogorny in [Bogorny et al. 2014] extends the concept of semantic trajectory by considering other important aspects such as activities and goals of trajectories. Several recent works address semantic trajectory data analy- sis [de Aquino et al. 2013, Ying et al. 2014, de Alencar et al. 2015, Furtado et al. 2016], but only a few have focused on activity recognition. While it might be easy to discover visited places in many situations, determining the activities performed at these places is 1 https://accounts.google.com/ 2 http://www.pokemongo.com Proceedings XVII GEOINFO, November 27-30, 2016, Campos do Jord˜ ao, Brazil 68
Transcript of TOWARDS ACTIVITY RECOGNITION IN MOVING OBJECT...

TOWARDS ACTIVITY RECOGNITION IN MOVINGOBJECT TRAJECTORIES FROM TWITTER DATA
Marco Aurelio Beber 1, Carlos Andres Ferrero 2, Renato Fileto 1, Vania Bogorny 1
1Programa de Pos-Graduacao em Ciencia da Computacao (PPGCC)Universidade Federal de Santa Catarina (UFSC), Florianopolis, SC, Brasil
2Coordenacao de Informatica e Ciencia da ComputacaoInstituto Federal de Santa Catarina (IFSC), Lages, SC, Brasil
[email protected], [email protected], {r.fileto,vania.bogorny}@ufsc.br
Abstract. The knowledge about people daily activities is of great value for sev-eral application domains. On the one hand, the activity recognition in trajec-tories has not been deeply investigated. On the other hand, social media datasuch as tweets can be rich in information about where people go and what theydo. We strongly believe that the integration of trajectory data and social mediacan reveal the activities performed by individuals in daily life. In this paperwe propose a new method to infer moving object activities from their trajecto-ries, using knowledge extracted from Twitter data. We evaluate the proposedapproach with two datasets and show that it outperforms current works.
1. IntroductionThe knowledge about which activities people do at certain Points Of Interest (POIs) canbe of great value for several applications. For instance, recommendation systems couldinfer user activities from visited locations obtained from their Google account 1 and sug-gest new places based on the inferred activities. Architects and city planners could projectbetter public spaces, such as parks, based on how people perform activities. Augmentedreality games, such as Pokemon Go 2, could improve the security of the players by warn-ing them about suspicious activities at POIs to prevent cases of robbery.
We are living the era of big data, where individuals are constantly leaving tracesof their movements and their activities. Even though we are not fully aware of it, weare tracked everyday. Our spatiotemporal traces can be delineated as moving object tra-jectories. A raw trajectory is a temporally ordered sequence of geographical coordinatesassociated with a timestamp, which does not present explicit semantics. A semantic tra-jectory [Spaccapietra et al. 2008] is represented as a sequence of stops and moves, wherestops are the places visited by the object. Bogorny in [Bogorny et al. 2014] extends theconcept of semantic trajectory by considering other important aspects such as activitiesand goals of trajectories. Several recent works address semantic trajectory data analy-sis [de Aquino et al. 2013, Ying et al. 2014, de Alencar et al. 2015, Furtado et al. 2016],but only a few have focused on activity recognition. While it might be easy to discovervisited places in many situations, determining the activities performed at these places is
1https://accounts.google.com/2http://www.pokemongo.com
Proceedings XVII GEOINFO, November 27-30, 2016, Campos do Jordao, Brazil
68
not a trivial task. There is no unique association between each POI (or POI type) andthe activities that can be performed at that POI. Several activities may be performed inthe same POI (or POI type). There is a wide range of possibilities that vary in numberand nature according with the POI type. For instance, at a shopping mall, one could beeating, purchasing, working, socializing, watching a movie, or at a commercial buildingone could be drinking a coffee, working, visiting, purchasing and at a company one couldbe working or visiting.
We strongly believe that the main limitation of existing works for activ-ity recognition from GPS trajectory data, such as the works [Weerkamp et al. 2012,Furletti et al. 2013, Njoo et al. 2015] is the assignment of only one activity at a POI, andrelying on specialists to manually label POIs (or POI types) with activities that can happenat these POIs (or POI types). Another limitation is the dependence of an annotated trajec-tory dataset to generate a classification model. In this paper we overcome these problemsby proposing a novel solution to recognize activities in moving object trajectories basedon tweets sent from the visited POIs. First, we assume that more than one activity canbe performed at each POI (e.g. one can study, socialize and eat at a University). Second,we enrich Foursquare POI types with statistics about the activities observed in tweets sentfrom the respective POI types. Third, we propose a matching process to infer activitiesbased on the similarity between the trajectory and the POI type profiles extracted fromTwitter. To the best of our knowledge, our proposal is the first to extract knowledge fromTwitter data to infer activities in moving object trajectories. In summary, we make thefollowing contributions: (i) we build a knowledge base with POI type profiles based onactivities observed in tweets sent from each POI type; (ii) we propose the algorithm T-Activity to infer activities in trajectory data, by matching the POIs visited by trajectorieswith POI type profiles in the knowledge base; (iii) we evaluate the proposed approachwith real trajectories and census data to evaluate our method in real case scenarios.
The rest of this paper is organized as follows. Section 2 discusses related work.Section 3 presents the main definitions. Section 4 describes our proposal for activityrecognition. Section 5 reports the experimental evaluation, and finally, Section 6 presentsour conclusions.
2. Related Work
There are different works in the literature related to human activity recognition usingdifferent types of data, such as social media and GPS trajectories. The works based onsocial media focus on text classification, and extract features from text and POIs to buildclassifiers for activity recognition. For instance, Liu in [Liu et al. 2012] builds a classifierover tweets in order to predict the POI type of tweets linked to Foursquare. Althoughthis work does not recognize activities, it recognizes POI types that can be related todifferent activities. Weerkamp in [Weerkamp et al. 2012] proposed an approach to predictthe popular activities that will happen in a future time window, such as tonight, tomorrow,and next week, by using a future time-window and keywords related to activities. Zhuin [Zhu et al. 2016] builds a multi-label classifier using tweets manually annotated withactivities in order to predict up to three activities. To build the classifier, it considers thetweet text, the tweet posting time, the POI type from Foursquare and POI name fromFoursquare.
Proceedings XVII GEOINFO, November 27-30, 2016, Campos do Jordao, Brazil
69

On the other hand, only a few works try to recognize activities on GPS trajecto-ries. Moreno in [Moreno et al. 2010] proposed an algorithm that given a set of stops of atrajectory, uses a predefined set of rules that considers the minimum time and maximumspeed to infer the goal of movement. However, the set of rules has to be defined by aspecialist, and the matching process is based on movement aspects of the goal, such as itsminimum time and its maximum speed. Therefore, it ignores important aspects such asthe place and the time of the goal. Our work, instead, focuses on recognizing activities,and we do not depend on a specialist, since we extract the knowledge from Twitter inorder to build a knowledge base that describes the activities that can be performed at aPOI. Furletti in [Furletti et al. 2013] proposed a method for activity recognition where aset of activities is manually defined for POI types, and given a trajectory, it finds the stopsand matches the POI type of the stop with the manually defined activities. Our work onthe other hand considers that multiple activities can happen at each POI and computes thesimilarity of the trajectory and the activities in the knowledge base in order to infer activ-ities. Reumers in [Reumers et al. 2013] uses a dataset of semantic trajectories annotatedwith activities and proposes to infer activities using a decision-tree based model. To buildthe tree, it uses the start time, duration and activity of each stop, but does not consider theplace where the activity happened and depends on the annotated trajectory data to buildthe model. Kim in [Kim et al. 2014] builds a classification model to recognize groups ofactivities, as for instance, home, work and transportation. It uses spatial regions annotatedwith the frequency of time, duration and frequency of the activities. However, it does notinfer activities, just groups of activities, and it also depends on the annotated trajectorydata to build the model. Njoo in [Njoo et al. 2015] also manually defines an activity foreach POI type, and using a dataset of semantic trajectories annotated with activities itbuilds classifiers with trajectories from the same moving object, to represent the routineof a moving object. However, if the moving object goes to a place that was not previouslyseen, it matches the POI type with the manually defined activity.
Overall, our work is different from the previous approaches since we do not de-pend on a specialist to build the knowledge base, instead, we extract the knowledge fromTwitter data. We also consider that multiple activities can take place at each POI and wepropose an algorithm to match trajectories with our knowledge base to infer activities.
3. Main Definitions
There are several definitions of semantic trajectories in the literature, such as[Bogorny et al. 2014] and [Spaccapietra et al. 2008]. In this work we adapt the defini-tion of semantic trajectory defined by Spaccapietra, considering a semantic trajectory asa set of stops and the POI type of the stops. Definition 1 shows our formal definition ofsemantic trajectory.
Definition 1 (Semantic Trajectory). A semantic trajectory S = {s0, s1, ..., sn} is a setof stops, where the ith stop is a tuple s
i
= (xi
, yi
, sti
, eti
, poii
), with xi
and yi
being thespatial coordinates of the stop from the start time st
i
to the end time eti
at the POI poii
.
A stop of a trajectory occurs at a place, called POI, given in Definition 2.
Definition 2 (Point of Interest). A point of interest is a tuple poi = (type, x, y, ot, ct)where type is the type of the POI (e.g. Restaurant, Gym, University, Shopping Mall), x
Proceedings XVII GEOINFO, November 27-30, 2016, Campos do Jordao, Brazil
70

and y are its spatial coordinates, and ot and ct are, respectively, the opening and closingtimes of the point of interest.
The moving object can perform multiple activities at each stop, then how couldwe distinguish, for instance, at a shopping mall, if people are purchasing items at a store,eating at a restaurant or watching a movie? In order to identify multiple activities at thesame stop, we split the stop into sub-stops, which are smaller stops happening inside abigger stop, as proposed by [Moreno et al. 2010]. For example, let us consider Figure 1as a trajectory of a student that has a stop at a university. Inside this stop, he has a sub-stop at a classroom (A), a sub-stop at the laboratory (B) and a sub-stop at the universitycafeteria (C). Therefore, by using the concept of sub-stops we can identify more than oneactivity at each stop. The formal definition of sub-stop is given in Definition 3.
Figure 1. Example of Stop with Sub-Stops
CB
A
Definition 3 (Sub-Stop). A sub-stop is a tuple sub = (s, st, et, x, y) where sub is thesub-stop from the start time st until the end time et inside the stop s with x and y beingthe centroid of the sub-stop.
We extend the definition of semantic trajectory to cope with activities. Definition4 shows our formal definition of activity trajectory.
Definition 4 (Activity Trajectory). An activity trajectory T = {t0, t1, ..., tn} is a set ofstops, where the ith stop is a tuple t
i
= (xi
, yi
, sti
, eti
, poii
, Ai
), with xi
and yi
being thespatial coordinates of the stop from the start time st
i
to the end time eti
with the set ofactivities A
i
= {a0, a1, ..., an} performed at the POI poii
, where the jth activity aj
is anactivity label.
In this work we extract activities from georeferenced tweets associated withFoursquare, and collect the POI information through the Foursquare API3. The defini-tion of georeferenced tweet is given in Definition 5.
Definition 5 (Georeferenced Tweet). A georeferenced tweet is a tuple(text, time, day week, POI, act), where act is the activity extracted from the tweet texttext shared at the time time at the day of the week day week and at the point of interestPOI (as in Definition 2).
We consider that every POI type has a set of activities that can be performed at agiven time and with a certain duration. We define this set of activities as the POI TypeProfile, given in Definition 6.
Definition 6 (POI Type Profile). A POI type profile is a tuple pro =(POItype, act,meanT ime, sdT ime,meanDuration, sdDuration, frequency),where meanT ime is the mean time of the observed ocurrences of the activity act at thePOI type POItype; sdT ime is the standard deviation of this time, meanDuration is
3https://developer.foursquare.com
Proceedings XVII GEOINFO, November 27-30, 2016, Campos do Jordao, Brazil
71
the mean duration time of act at POItype, sdDuration is the standard deviation of thisduration, and frequency is the frequency of act at POItype relative to the total numberof activity occurrences observed at POItype.
In the following section we present the proposed approach.
4. Proposed ApproachOur approach to infer activities in moving object trajectories has two steps. The first oneis to build a knowledge base in the form of POI type profiles, which are extracted fromTwitter, Foursquare and census data. The second step is to infer activities in trajectoriesby matching the object movement with the POI type profiles in the knowledge base. Forthat end, we propose an algorithm called T-Activity. These steps are described in thefollowing sections.
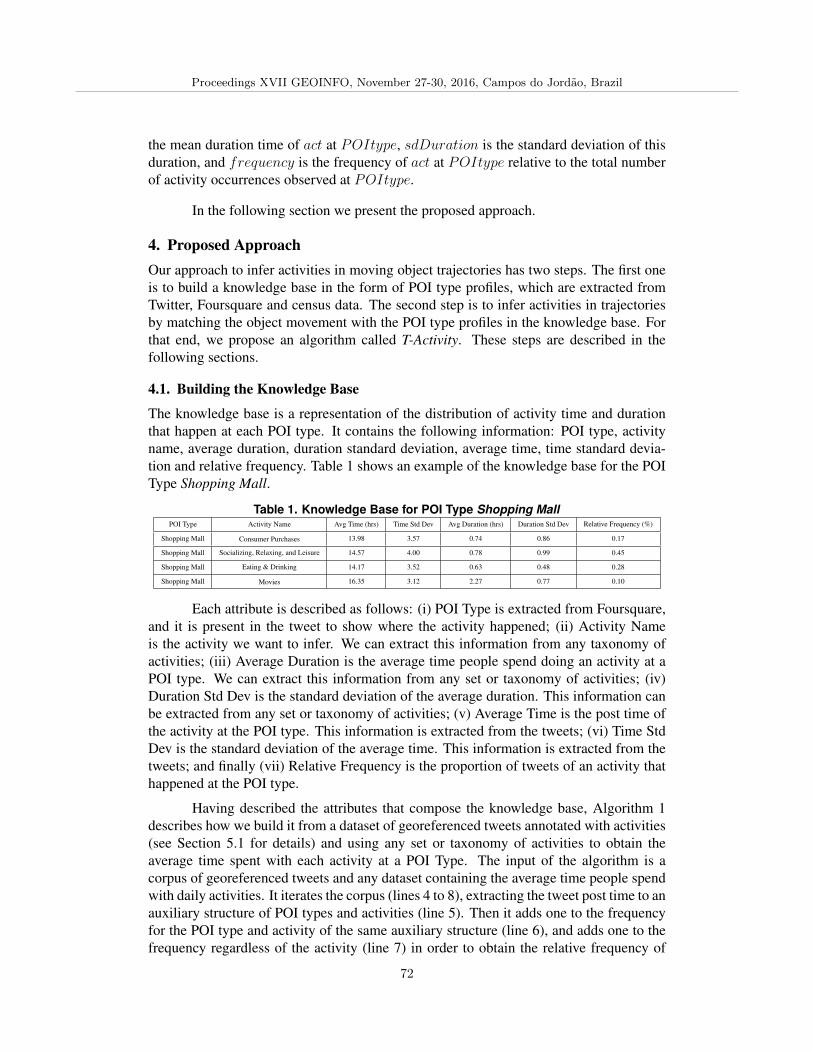
4.1. Building the Knowledge BaseThe knowledge base is a representation of the distribution of activity time and durationthat happen at each POI type. It contains the following information: POI type, activityname, average duration, duration standard deviation, average time, time standard devia-tion and relative frequency. Table 1 shows an example of the knowledge base for the POIType Shopping Mall.
Table 1. Knowledge Base for POI Type Shopping Mall
POI Type Activity Name Avg Time (hrs) Time Std Dev Avg Duration (hrs) Duration Std Dev Relative Frequency (%)
Shopping Mall Consumer Purchases 13.98 3.57 0.74 0.86 0.17
Shopping Mall Socializing, Relaxing, and Leisure 14.57 4.00 0.78 0.99 0.45
Shopping Mall Eating & Drinking 14.17 3.52 0.63 0.48 0.28
Shopping Mall Movies 16.35 3.12 2.27 0.77 0.10
Each attribute is described as follows: (i) POI Type is extracted from Foursquare,and it is present in the tweet to show where the activity happened; (ii) Activity Nameis the activity we want to infer. We can extract this information from any taxonomy ofactivities; (iii) Average Duration is the average time people spend doing an activity at aPOI type. We can extract this information from any set or taxonomy of activities; (iv)Duration Std Dev is the standard deviation of the average duration. This information canbe extracted from any set or taxonomy of activities; (v) Average Time is the post time ofthe activity at the POI type. This information is extracted from the tweets; (vi) Time StdDev is the standard deviation of the average time. This information is extracted from thetweets; and finally (vii) Relative Frequency is the proportion of tweets of an activity thathappened at the POI type.
Having described the attributes that compose the knowledge base, Algorithm 1describes how we build it from a dataset of georeferenced tweets annotated with activities(see Section 5.1 for details) and using any set or taxonomy of activities to obtain theaverage time spent with each activity at a POI Type. The input of the algorithm is acorpus of georeferenced tweets and any dataset containing the average time people spendwith daily activities. It iterates the corpus (lines 4 to 8), extracting the tweet post time to anauxiliary structure of POI types and activities (line 5). Then it adds one to the frequencyfor the POI type and activity of the same auxiliary structure (line 6), and adds one to thefrequency regardless of the activity (line 7) in order to obtain the relative frequency of
Proceedings XVII GEOINFO, November 27-30, 2016, Campos do Jordao, Brazil
72

the activities at each POI type. After that, it iterates the auxiliary structure A (lines 9 to18) and obtains the POI type and activity of each instance (lines 10 and 11). After that, itcalls the method C.getDuration, which has a list of durations for each POI type/activity,and gets the activity duration list filtered by POI type and activity (line 12) and calculatesthe mean and standard deviation (lines 13 and 14). Then it also calculates the mean andstandard deviation of the tweet post time (lines 15 and 16) and the relative frequencyof the activity for the POI type (line 17). Finally, it returns the POI Type profiles asthe knowledge base K (line 19). As this algorithm iterates the corpus of tweets and theauxiliary dictionary A only once, the complexity is O(n
d
+ np
), where nd
is the corpussize and n
p
= nt
⇤ na
, with nt
being the number of unique POI types in the corpus oftweets D and n
a
being the number of unique activities in the corpus of tweets D.
Algorithm 1 Knowledge-Base BuilderRequire:
D // corpus of tweetsC // census dataset / activity taxonomy
1: K = empty dictionary;2: A = empty dictionary;3: T = empty dictionary;4: for each tweet in D do5: A[tweet.poi.type, tweet.act].time.append(tweet.time);6: A[tweet.poi.type, tweet.act].frequency += 1;7: T [tweet.poi.type].frequency += 1;8: end for9: for i = 0; i < A.size(); i = i + 1 do
10: ptype = A.getPOIType(i);11: act = A.getActivity(i);12: duration list = C.getDuration(ptype, act);13: K[ptype, act].meanDuration = mean(duration list);14: K[ptype, act].sdDuration = sd(duration list);15: K[ptype, act].meanT ime = mean(A[ptype, act].time);16: K[ptype, act].sdT ime = sd(A[ptype, act].time);17: K[ptype, act].frequency = A[ptype, act].frequency / T [ptype].frequency;18: end for19: return K;
In the next section we describe the algorithm T-Activity and show how to inferactivities using the knowledge base.
4.2. T-Activity
Before we describe the algorithm that performs activity inference, we introduce the activ-ity inference model, which is based on time, duration and the relative frequency. The timesimilarity is computed in Equation 1, where K is the POI type profile, st is the sub-stopstart time, meanT ime is the average time the activity starts in the POI type profile andKsdTime
KmeanTimeis the variation coefficient of the time in the POI type profile.
T (K, st) = 1�
�����K
avgT ime
� st
KavgT ime
����� ⇤K
sdT ime
KmeanT ime
(1)
The duration similarity between the sub-stop and each activity in the POI typeprofile is computed using Equation 2, where K is the POI type profile, d is the sub-stop
Proceedings XVII GEOINFO, November 27-30, 2016, Campos do Jordao, Brazil
73
duration, meanDur is the average duration of the activity in the POI type profile andKsdDur
KmeanDuris the variation coefficient of the duration in the POI type profile.
D(K, d) = 1�����K
meanDur
� d
KmeanDur
���� ⇤K
sdDur
KmeanDur
(2)
However, if the score between the activities is too much similar, the time andduration cannot describe which activity happened. Therefore, our model considers thefrequency of the activities, according to Equation 3, where K is a POI type profile andfrequency is the relative frequency of the activity at the POI type.
M(K, d, st) = Kfrequency
⇤D(K, d) ⇤ T (K, st) (3)
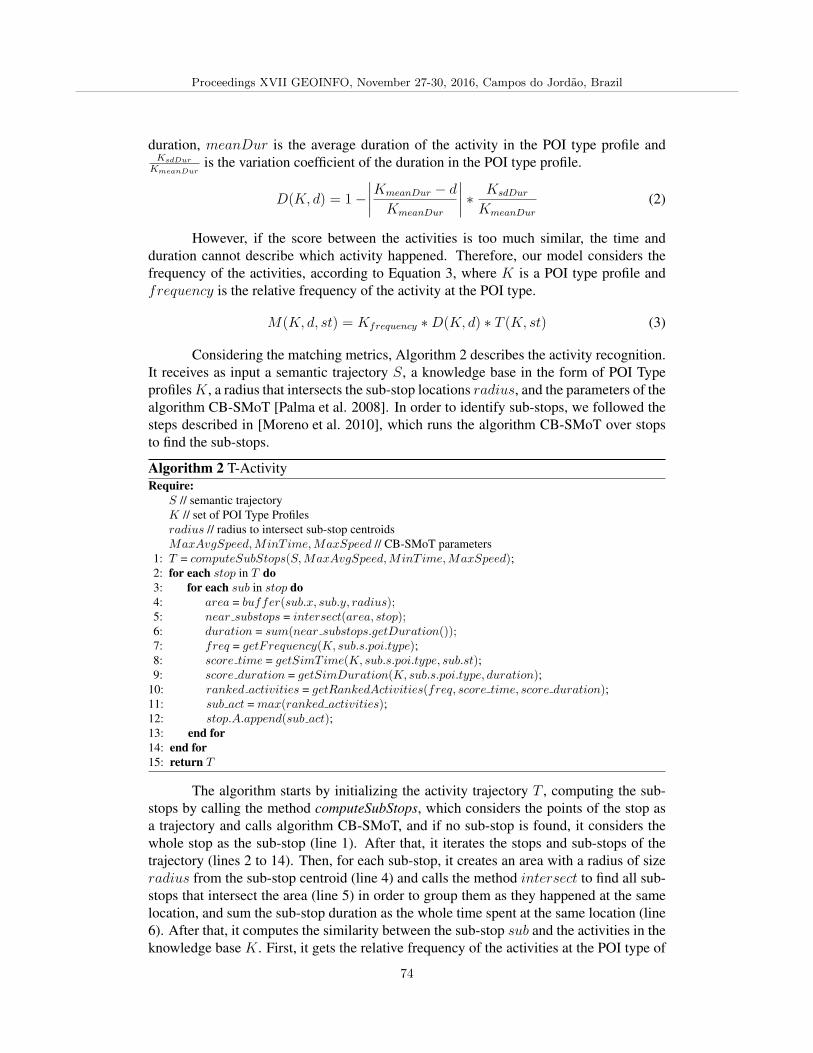
Considering the matching metrics, Algorithm 2 describes the activity recognition.It receives as input a semantic trajectory S, a knowledge base in the form of POI Typeprofiles K, a radius that intersects the sub-stop locations radius, and the parameters of thealgorithm CB-SMoT [Palma et al. 2008]. In order to identify sub-stops, we followed thesteps described in [Moreno et al. 2010], which runs the algorithm CB-SMoT over stopsto find the sub-stops.
Algorithm 2 T-ActivityRequire:
S // semantic trajectoryK // set of POI Type Profilesradius // radius to intersect sub-stop centroidsMaxAvgSpeed,MinT ime,MaxSpeed // CB-SMoT parameters
1: T = computeSubStops(S,MaxAvgSpeed,MinT ime,MaxSpeed);2: for each stop in T do3: for each sub in stop do4: area = buffer(sub.x, sub.y, radius);5: near substops = intersect(area, stop);6: duration = sum(near substops.getDuration());7: freq = getFrequency(K, sub.s.poi.type);8: score time = getSimTime(K, sub.s.poi.type, sub.st);9: score duration = getSimDuration(K, sub.s.poi.type, duration);
10: ranked activities = getRankedActivities(freq, score time, score duration);11: sub act = max(ranked activities);12: stop.A.append(sub act);13: end for14: end for15: return T
The algorithm starts by initializing the activity trajectory T , computing the sub-stops by calling the method computeSubStops, which considers the points of the stop asa trajectory and calls algorithm CB-SMoT, and if no sub-stop is found, it considers thewhole stop as the sub-stop (line 1). After that, it iterates the stops and sub-stops of thetrajectory (lines 2 to 14). Then, for each sub-stop, it creates an area with a radius of sizeradius from the sub-stop centroid (line 4) and calls the method intersect to find all sub-stops that intersect the area (line 5) in order to group them as they happened at the samelocation, and sum the sub-stop duration as the whole time spent at the same location (line6). After that, it computes the similarity between the sub-stop sub and the activities in theknowledge base K. First, it gets the relative frequency of the activities at the POI type of
Proceedings XVII GEOINFO, November 27-30, 2016, Campos do Jordao, Brazil
74

the stop from the knowledge base K (line 7). Then it computes the time similarity scoreof each activity at the POI type of the stop using Equation 1 (line 8). After that it computesthe duration similarity score of each activity at the POI type of the stop using Equation 2(line 9). Then, it computes the score of each activity by multiplying the activity scoresof each set using Equation 3 (line 10), and selects the activity with the highest score (line11). Finally, it appends the activity with the highest score to the stop (line 12), and returnsthe activity trajectory (line 15).
The complexity of this algorithm is O(ns
+ n2sub
), where ns
is the number ofstops and n
sub
is the number of sub-stops. Also, as the algorithm CB-SMoT is executedoutside the loop, it does not increase our complexity. In the next section we describe theperformed experiments and compare our results with other work.
5. ExperimentsIn this section we describe the experiments performed in two trajectory datasets and howwe extracted activities from tweets in order to build the knowledge base.
5.1. Building the Knowledge Base from TwitterWe use the Twitter Public Streaming API 4 to gather tweets for the knowledge base.We selected 137,509 instances of georeferenced tweets generated from Foursquare from14/09/2010 to 11/05/2015. The collection was filtered by Portuguese written tweets insideBrazil’s bounding box and with at least 3 words.
To build and evaluate the knowledge base, the first step is to extract the POI infor-mation from Foursquare, using the Venue Search API 5. We do that by looking the VenueID present in the tweet text. As a result we have the tweet text, the tweet time, the POItype and the POI name. Then, for this experiment we filtered the tweets by the follow-ing POI types: Restaurant, Gym, Supermarket, University and Shopping Mall, which aretypes we assumed to have more than one activity. The result was a corpus with 45,209tweets.
To identify the activities from tweets, we follow the method proposed by Zhu in[Zhu et al. 2016], which consists of using the activities defined in the American Time-Use Survey (ATUS) [Shelley 2005] to build a classification model to assign each tweetto an activity. We randomly selected a sample of tweets stratified by POI type, withthe size determined by a confidence level of 95% and a confidence interval of 5%, andmanually classify each one to an activity present in the ATUS taxonomy accordinglyto the text of the tweet. Having the annotated tweets, we build a classification modelconsidering the following features: (i) POI Type: as each tweet is georeferenced to aFoursquare POI, we extract the POI type and construct a matrix containing 887 binaryfeatures, each one representing a POI type; (ii) Tweet Text: by extracting the most relevantunigrams and bigrams weighted by TF-IDF, we obtain 9394 features from the text; (iii)POI Name: the same way we extract features from the tweet text we extract the POIname, as some POI names can be indicative of activities (e.g. Japanese Restaurant, FourthStreet Market); Posting Time: we chunk the tweet posting time by hour of the day toconstruct a matrix of 24 features. We combine the previous features in a matrix and apply
4https://stream.twitter.com/1.1/statuses/sample.json5https://developer.foursquare.com/docs/venues/search
Proceedings XVII GEOINFO, November 27-30, 2016, Campos do Jordao, Brazil
75

the Linear SVM package from Scikit-Learn library [Pedregosa et al. 2011] to build theclassification model. We select L1-regularization with squared hinge loss and keep thedefault parameters. We evaluate the tweet classification model using a 10-fold cross-validation, obtaining an average accuracy of 76%.
After building and evaluating the classification model, we classify the remainingtweets. In addition, we run Algorithm 1 to extract the mean and standard deviation of timeand duration and also the relative frequency of the activities to store in the knowledgebase. Table 2 shows the knowledge base generated for this experiment.
Table 2. Entire Knowledge BasePOI Type Activity Name Avg Time (hrs) Time Std Dev Avg Duration (hrs) Duration Std Dev Relative Frequency (%)
Shopping Mall Consumer Purchases 13.98 3.57 0.74 0.86 0.17
Shopping Mall Socializing, Relaxing, and Leisure 14.57 4.00 0.78 0.99 0.45
Shopping Mall Eating & Drinking 14.17 3.52 0.63 0.48 0.28
Shopping Mall Movies 16.35 3.12 2.27 0.77 0.10
Supermarket Consumer Purchases 15.12 4.52 0.69 0.52 0.73
Supermarket Eating & Drinking 14.50 5.17 0.54 0.47 0.27
Restaurant Eating & Drinking 12.24 6.83 1.00 0.62 0.78
Restaurant Socializing, Relaxing, and Leisure 14.60 6.59 1.47 1.34 0.18
Restaurant Consumer Purchases 14.51 5.28 0.16 0.19 0.04
University Socializing, Relaxing, and Leisure 14.52 5.69 0.73 0.88 0.02
University Education 13.38 5.37 3.16 1.90 0.96
University Eating & Drinking 13.96 4.51 0.51 0.30 0.02
Gym Sports, Exercise, and Recreation 13.25 5.98 0.99 0.67 1.00
As we can see in Table 2, the majority of the POI types have multiple activities.For instance, Shopping Mall has four different activities, where the most common activityis Socializing, Relaxing, and Leisure. The relative frequency is a reflex of what peopledo and tweet about. It is important to notice that the average time is an approximation ofmultiple distributions, which explains the high standard deviations of time.
Having the knowledge base, we run the algorithm T-Activity using two differentdatasets, a semantic trajectory dataset built from census data (Section 5.2), and a semantictrajectory dataset collected in Florianopolis, Brazil (Section 5.3).
5.2. Census Trajectory DatasetConsidering the difficulty for obtaining a semantic trajectory dataset with ground truth,we evaluate our algorithm with a dataset generated from the ATUS dataset. This datasetconsists of activity diaries, where each diary corresponds to the semantic trajectory of anindividual, resident of the United States of America. The diary contains the activity, theplace where the activity was performed (POI), and the start and end times of the activity.From this dataset we selected all households that have activity entries with more than5 days, resulting in 41 households with 5246 stops. Every POI where an activity wasperformed is considered as a stop, and as we have multiple entries at the same POI, weconsider them as sub-stops. However, and as we do not have the POI coordinates in thisdataset, we consider the parameter radius as 0 meters, as we cannot match the locationof sub-stops.
We compare the algorithm T-Activity with the works [Furletti et al. 2013],[Reumers et al. 2013] and [Njoo et al. 2015]. In order to compare the works, we con-sider only the activity with the highest score at each sub-stop to calculate f1-score and
Proceedings XVII GEOINFO, November 27-30, 2016, Campos do Jordao, Brazil
76

accuracy. On the other hand, as the POIs can have several activities, the metrics ofthe related work are calculated based on the activity that consumed more time at thePOI. Figure 2 shows the f1-score for the methods of Furletti [Furletti et al. 2013] andReumers [Reumers et al. 2013]. From the f1-score we can see that our method outper-forms the existing works. The work of Furletti has a lower or equal score for all classes.This happens because each POI type is matched to an exclusive activity, and our methodconsiders the similarity of the activities along the relative frequency of the activities.However, considering the relative frequency is problematic for activities that are too sim-ilar and have a low frequency, such as Socializing, Relaxing and Leisure. On the otherhand, as Reumers does not consider the POI type, the f1-score has the lowest result.
0.00
0.25
0.50
0.75
1.00
Consumer Purchases Eating & Drinking Education Socializing, Relaxing, and Leisure
Sports, Exercise, and Recreation
Activity
F1−s
core
WorkFurletti et al. (2013)Reumers et al. (2013)T−Activity
Figure 2. Comparison of F1-Score
In order to demonstrate the multi-activities, we analyze the accuracy at the POItype University in Figure 3. It shows that our method outperforms the works of Njooand Reumers for the activities Eating & Drinking and Socializing, Relaxing, and Leisure,and that our work is the only one that recognizes the activity Socializing, Relaxing, andLeisure. On the other hand, as Furletti and Njoo consider one activity, they have anaccuracy of 1.00 for Education.
0.00
0.25
0.50
0.75
1.00
Eating & Drinking Education Socializing, Relaxing, and LeisureActivity
Accu
racy
WorkFurletti et al. (2013)Njoo et al. (2015)Reumers et al. (2013)T−Activity
Figure 3. Accuracy Comparison at POI Type University
5.3. GPS Trajectory Dataset
The GPS trajectory dataset is a ground-truth dataset of semantic trajectories annotatedwith activities collected from 14/04/2016 to 08/06/2016 by 8 participants in the city ofFlorianopolis, Brazil. The dataset has 59 trajectories, 100 stops and 128 sub-stops. Forthis experiment we use a radius of 10 meters to group sub-stops at the same location,and consider the activity with the highest score at the sub-stop to calculate f1-score andaccuracy. However, as the stops can have several activities, the metrics of the related workare calculated based on the activity that consumed more time at the stop. Figure 4 showsthe f1-score in comparison to [Furletti et al. 2013, Reumers et al. 2013]. Analyzing thef1-score we can see that our work has the best result. In addition, Furletti has a scoreof 1.00 where the main activity is the only activity in the GPS trajectory dataset, such
Proceedings XVII GEOINFO, November 27-30, 2016, Campos do Jordao, Brazil
77
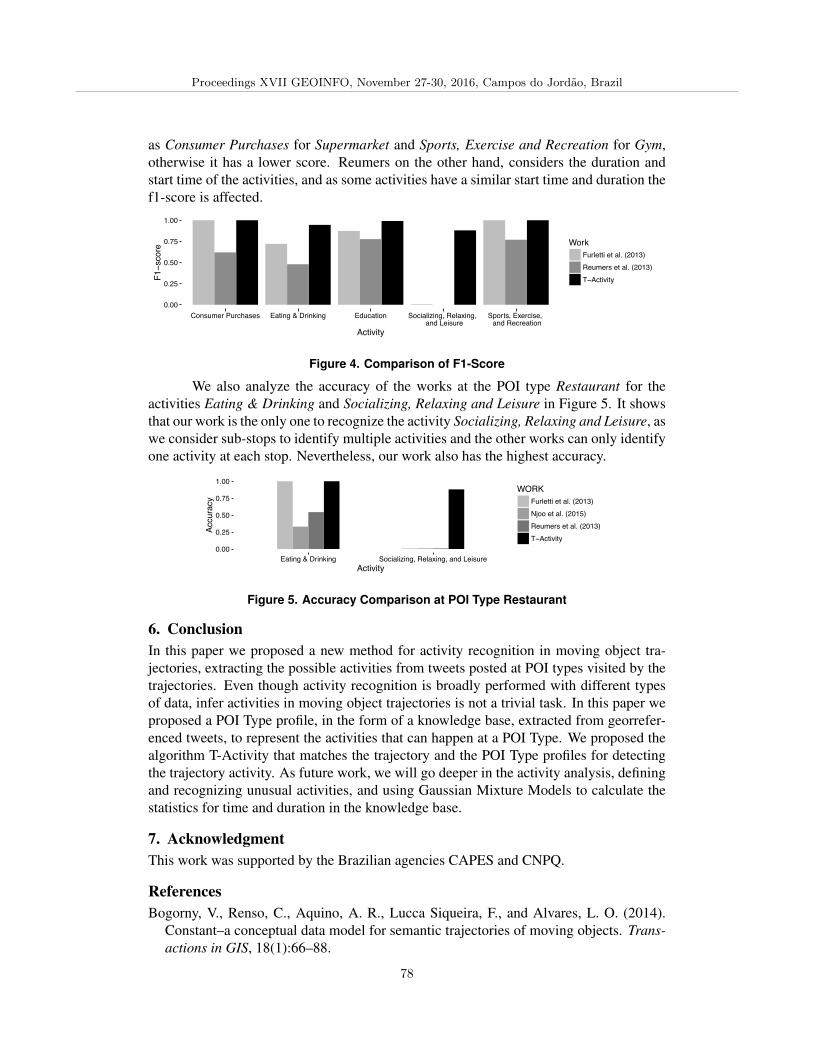
as Consumer Purchases for Supermarket and Sports, Exercise and Recreation for Gym,otherwise it has a lower score. Reumers on the other hand, considers the duration andstart time of the activities, and as some activities have a similar start time and duration thef1-score is affected.
0.00
0.25
0.50
0.75
1.00
Consumer Purchases Eating & Drinking Education Socializing, Relaxing, and Leisure
Sports, Exercise, and Recreation
Activity
F1−s
core
WorkFurletti et al. (2013)Reumers et al. (2013)T−Activity
Figure 4. Comparison of F1-Score
We also analyze the accuracy of the works at the POI type Restaurant for theactivities Eating & Drinking and Socializing, Relaxing and Leisure in Figure 5. It showsthat our work is the only one to recognize the activity Socializing, Relaxing and Leisure, aswe consider sub-stops to identify multiple activities and the other works can only identifyone activity at each stop. Nevertheless, our work also has the highest accuracy.
0.00
0.25
0.50
0.75
1.00
Eating & Drinking Socializing, Relaxing, and LeisureActivity
Accu
racy
WORKFurletti et al. (2013)Njoo et al. (2015)Reumers et al. (2013)T−Activity
Figure 5. Accuracy Comparison at POI Type Restaurant
6. ConclusionIn this paper we proposed a new method for activity recognition in moving object tra-jectories, extracting the possible activities from tweets posted at POI types visited by thetrajectories. Even though activity recognition is broadly performed with different typesof data, infer activities in moving object trajectories is not a trivial task. In this paper weproposed a POI Type profile, in the form of a knowledge base, extracted from georrefer-enced tweets, to represent the activities that can happen at a POI Type. We proposed thealgorithm T-Activity that matches the trajectory and the POI Type profiles for detectingthe trajectory activity. As future work, we will go deeper in the activity analysis, definingand recognizing unusual activities, and using Gaussian Mixture Models to calculate thestatistics for time and duration in the knowledge base.
7. AcknowledgmentThis work was supported by the Brazilian agencies CAPES and CNPQ.
ReferencesBogorny, V., Renso, C., Aquino, A. R., Lucca Siqueira, F., and Alvares, L. O. (2014).
Constant–a conceptual data model for semantic trajectories of moving objects. Trans-actions in GIS, 18(1):66–88.
Proceedings XVII GEOINFO, November 27-30, 2016, Campos do Jordao, Brazil
78

de Alencar, L. A., Alvares, L. O., Renso, C., Raffaeta, A., and Bogorny, V. (2015). Arule-based method for discovering trajectory profiles. In SEKE 2015, pages 244–249,Pittsburgh, PA, USA.
de Aquino, A. R., Alvares, L. O., Renso, C., and Bogorny, V. (2013). Towards semantictrajectory outlier detection. In GeoInfo, pages 115–126.
Furletti, B., Cintia, P., Renso, C., and Spinsanti, L. (2013). Inferring human activitiesfrom gps tracks. In 2nd ACM SIGKDD, pages 5:1–5:8, New York, NY, USA. ACM.
Furtado, A. S., Kopanaki, D., Alvares, L. O., and Bogorny, V. (2016). Multidimensionalsimilarity measuring for semantic trajectories. Transactions in GIS, 20(2):280–298.
Kim, Y., Pereira, F. C., Zhao, F., Ghorpade, A., Zegras, P. C., and Ben-Akiva, M. (2014).Activity recognition for a smartphone based travel survey based on cross-user historydata. In ICPR 2014, pages 432–437. IEEE.
Liu, H., Luo, B., and Lee, D. (2012). Location type classification using tweet content. InICMLA, 2012, volume 1, pages 232–237.
Moreno, B., Times, V. C., Renso, C., and Bogorny, V. (2010). Looking inside the stops oftrajectories of moving objects. In Geoinfo, pages 9–20.
Njoo, G. S., Ruan, X. W., Hsu, K. W., and Peng, W. C. (2015). A fusion-based approachfor user activities recognition on smart phones. In DSAA, pages 1–10.
Palma, A. T., Bogorny, V., Kuijpers, B., and Alvares, L. O. (2008). A clustering-basedapproach for discovering interesting places in trajectories. In Proceedings of the 2008ACM SAC, pages 863–868, New York, NY, USA.
Pedregosa, F., Varoquaux, G., Gramfort, A., Michel, V., Thirion, B., Grisel, O., Blondel,M., Prettenhofer, P., Weiss, R., Dubourg, V., Vanderplas, J., Passos, A., Cournapeau,D., Brucher, M., Perrot, M., and Duchesnay, E. (2011). Scikit-learn: Machine learningin python. J. Mach. Learn. Res., 12:2825–2830.
Reumers, S., Liu, F., Janssens, D., Cools, M., and Wets, G. (2013). Semantic annotationof global positioning system traces: Activity type inference. Transportation ResearchRecord: Journal of the Transportation Research Board, (2383):35–43.
Shelley, K. J. (2005). Developing the american time use survey activity classificationsystem. Monthly Lab. Rev., 128:3.
Spaccapietra, S., Parent, C., Damiani, M. L., de Macedo, J. A., Porto, F., and Vangenot,C. (2008). A conceptual view on trajectories. DKE, 65(1):126 – 146.
Weerkamp, W., Rijke, M. d., et al. (2012). Activity prediction: A twitter-based explo-ration. In Proceedings of the TAIA’12 Workshop Associated to SIGIR’12.
Ying, J. J.-C., Lee, W.-C., and Tseng, V. S. (2014). Mining geographic-temporal-semanticpatterns in trajectories for location prediction. ACM TIST, 5(1):2:1–2:33.
Zhu, Z., Blanke, U., and Troster, G. (2016). Recognizing composite daily activities fromcrowd-labelled social media data. PerCom, 26:103 – 120.
Proceedings XVII GEOINFO, November 27-30, 2016, Campos do Jordao, Brazil
79


![Desafios no Mapeamento de Esquemas Conceituais …mtc-m16c.sid.inpe.br/col/sid.inpe.br/mtc-m16c/2015/12.10.17.25/doc/... · Bugiotti et al. [2] propuseram uma metodologia de projeto](https://static.fdocuments.net/doc/165x107/5be5b01809d3f2580c8c231f/desaos-no-mapeamento-de-esquemas-conceituais-mtc-m16csidinpebrcolsidinpebrmtc-m16c201512101725doc.jpg)