Towards achieving higher impact industrialisation in the ... Policy... · Towards achieving higher...
51
Towards achieving higher impact industrialisation in the Pharmaceuticals and Medical Device Sectors in SA Directorate: Pharmaceuticals and Medical Devices DEPARTMENT OF TRADE AND INDUSTRY
Transcript of Towards achieving higher impact industrialisation in the ... Policy... · Towards achieving higher...
Towards achieving higher impact industrialisation in the Pharmaceuticals and
Medical Device Sectors in SA
Directorate: Pharmaceuticals and Medical DevicesDEPARTMENT OF TRADE AND INDUSTRY

Policy context of the IPAP
• Government policy identifies industrial development as one of the key pillarsrequired for inclusive growth with an emphasis, on value-addition, labourintensive sectors and exports
• The IPAP 2016/17-2018/19 is in its eighth iteration and is informed by thevision set out for South Africa’s development provided by the NationalDevelopment Plan and is aligned the Medium Term Strategic Framework(MTSF) and the Medium Term Expenditure Framework, (MTEF)
• It is a product of the Economic Sector and Employment Cluster ofGovernment and its iterative annual format has served as a useful tool tostrengthen intra-governmental integration and co-ordination
Policy context of the IPAP• IPAP programmes are underpinned by an understanding that the domestic
economy has deep structural fault lines which require longer term solution. IPAPis also informed by a process which seeks identify key constraints tomanufacturing growth in the domestic economy and a problem solving,collaborative approach to the solution of these constraints.
• IPAP 2016/17 – 18/19 seeks to build upon the successes achieved and lessonslearnt where industrial policy which is well designed; the subject of stakeholderengagement and collaboration and is adequately resourced has been successful– auto’s and CTLF
• Successive annual iterations of IPAP have introduced new themes and focusareas to achieve a higher impact industrial policy. e.g. IPAP 2016 introduces anexport focus leveraging a devalued currency.
• Successive iterations of IPAP take into account the need to adjust andstrengthen the range of policy instruments at governments disposal in a verydynamic global and domestic market

Core Objectives of the IPAP

Industrial Financing
IPAP TRANSVERSAL FOCUS AREAS
SEZs and Regional Economic Clusters
Regional Integration
Public procurement
Developmental trade policy
Innovation and
technology
Monitor and ensure compliance with sector designation and localization
requirements in state procurement
Monitor expenditure and implements of local content requirements
Increasing aggregate demand through “Buy Local” campaign
Further designation of products for local procurement
Flexible/strategic tariff setting
Further development of enabling standards and compulsory specifications
Closer and more detailed collaboration with Custom to prevent illegal imports
Continued realignment of technical infrastructure activities in support of key
IPAP sectors
Ongoing review of incentives and instruments for Science, Technology and
Innovation (STI) to finalise an STI system, aligned to incentives and
industrial financing
Formalise and R&D-led industrial development approach through
implementation of the Emerging Industries Action Plan (EIAP)
Develop a portfolio of R&D projects aimed at scaling up industrial growth
Strategic, coordinated, integrated industrial financing system, combining the joint efforts of state and development finance institutions
Integration of DST innovation and commercialization support measures with roll out of Black Industrialist program
Priority processing for dynamic firms –with greater selective/strengthened conditionalities
Expansion of existing Industrial Development Zones: creation of new Special Economic Zones
Develop SEZs as dynamic platforms for foreign direct investment (FDI) and for the deepening of strategic industrial and export capacity, both in the SEZs themselves and in associated regional industrial clusters
Coordinated development of African regional infrastructure, support for complementary industrialisation, integrated of value chains and expanded trade
IPAP 2016/2017 TRANSVERSAL FOCUS AREAS
5
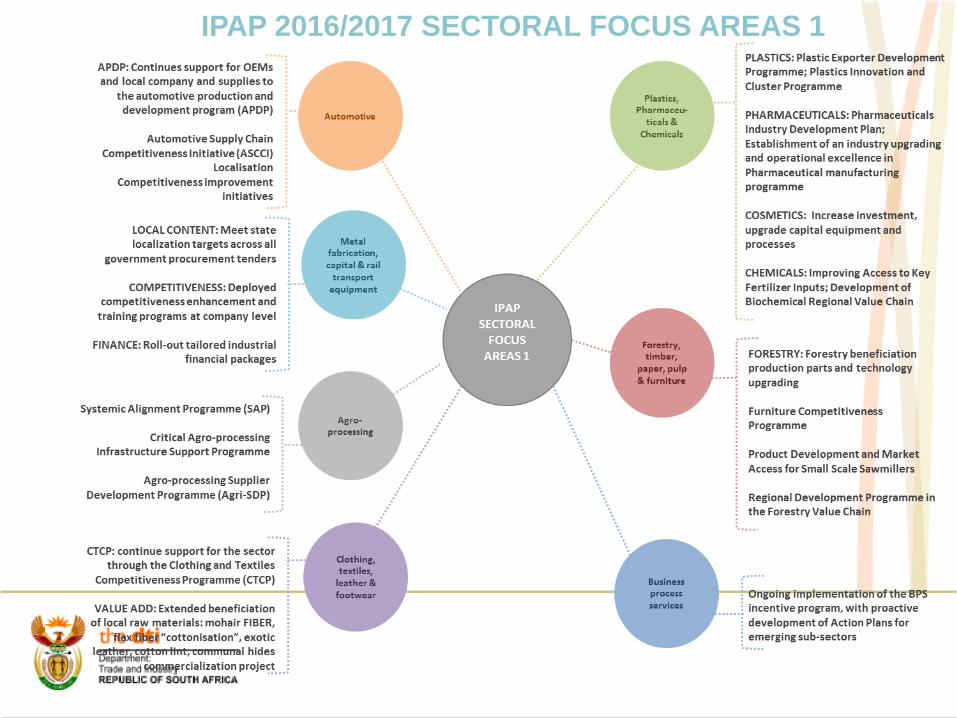
IPAP 2016/2017 SECTORAL FOCUS AREAS 1

PHARMACEUTICALS

Key Statistics: PharmaceuticalsVariable Contribution in 2014/15
Global marketEstimated to reach $1 trillion – 2015
SA marketApproximately ZAR 44 bn (US$ 3.5 bn)
Contribution to GDPApproximately 1.1 % (2014) - decline noted
SA share of global market 0.4% (value) and 1.0% (volume) - Deloitte, 2016
CAGR (SA)2.7% revised
Employment 9,500 in the industry
25,000 downstream (specialized logistics, retail and hospitalpharmacies)
Trade balance ZAR 22 billion (Chapter 30 - Pharmaceuticals)
Active pharm. ingredients (APIs) est. - R 6 billionBiologics – SA market
Estimated ZAR 4 bn (biologics and vaccines)
Estimated multiplier1.35 (Deloitte, 2016)

Pharmaceutical manufacturing value chain
The pharmaceutical value chain is an ‘additive’ value chain. The main activities in the pharmaceuticals industry include:- R&D and clinical trials- Manufacturing (Product link)- Distribution and wholesale - Retail/sale/marketing
Main activities in SA: - Tertiary and secondary pharmaceutical
manufacturing. Multinationals operate distribution, sales and marketing facilities in SA and contract local manufacturers to package their products
- SA does have specialised clinical trial capabilities


• The pharmaceutical market in SA was valued at approximately R44 billion in 2015. The private sector accounted for 84% of the market. The public sector accounted for 16% of the market.
• Approximately 276 companies are licensed by the DoH and the MCC to manufacture or export pharmaceuticals.
• Domestic manufacturing pharmaceutical companies almost exclusively produce generic products. SA pharmaceutical manufacturing companies are import dependent. In 2013, generics accounted for 63% of the private pharmaceutical market and 80% market share in government’s pharmaceutical use.
• The value of locally manufactured pharmaceuticals exported in 2015 was R4.9billion.
• Two local pharmaceutical multinational companies dominate the pharmaceutical manufacturing industry.
- As of 2013, Aspen market share = 16,2%; Adcock Ingram market share =8,9%
Broad profile of the SA pharmaceutical manufacturing industry

• Key players: Dominant Multinational companies are Local. Aspen Pharmacare, Adcock Ingram, Cipla, Sanofi
• Key Input: Active Pharmaceutical Ingredients• Market structure: Few dominant multinational companies that are vertical integrated across
the pharmaceutical supply chain but vertical integration not located in SA• Key Influencing factors: Intellectual Property (IP), Single Exit Price (SEP), Medicine
selection by patients, registration process for new pharmaceuticals• Regulatory bodies governing the industry - The Medicines Control Council (MCC), The South African National Accreditation System (SANAS), South African Health Products Regulatory Authority (SAHPRA)
• Regulations:- The South African National Policy on Intellectual property (in process of be revised) - Technical standards: Trade-related Aspects of TRIPS agreement (e.g. EU Good distribution
practices), WTO standards/accreditation - Section 15 of the Medicines and Related Substances Amendment Act – enables DOH
minister to prescribe the registration period for complementary medicines (imported without consent of the patent holder)
- Department of Health via SEP legislation and Local Procurement framework- Although, the industry is subject to the dti BBBEE codes the draft charter for the health
industry (released in 2005) has yet to materialise.
Summary of SA Pharmaceutical manufacturing industry

Key Players (Performance):
Source: Utipharma
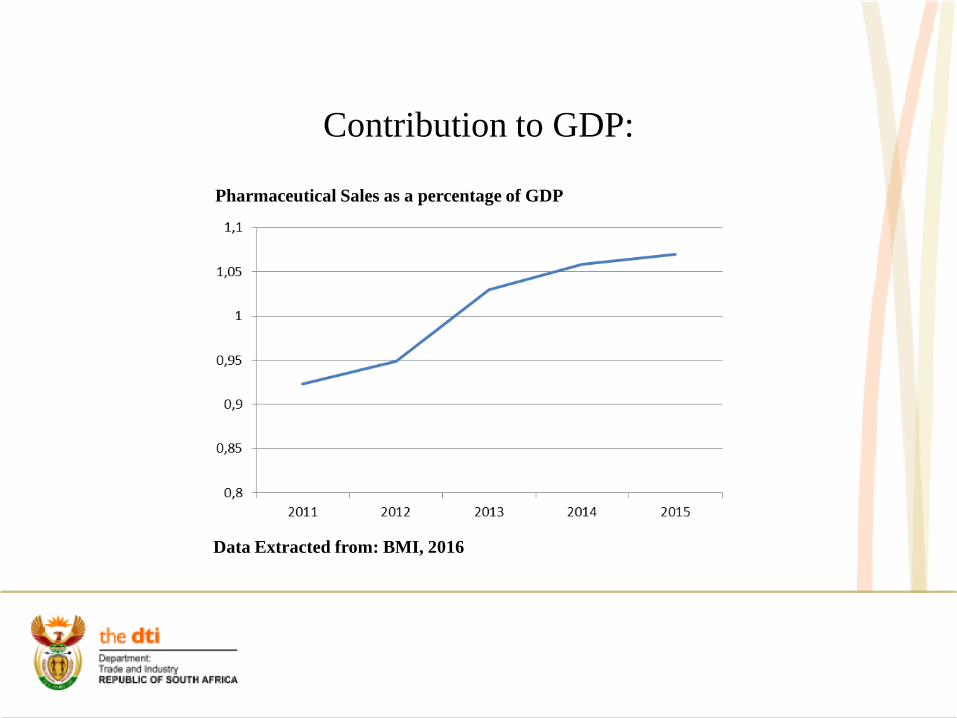
Contribution to GDP:
Pharmaceutical Sales as a percentage of GDP
Data Extracted from: BMI, 2016

Top 10 Global Exporters of Pharmaceutical Products
Rank Exporters Value 2014 (ZAR million)
% Growth 2014 %Share 2014
1 Germany 862 869 20,1% 15,6%
2 Switzerland 677 686 22,7% 12,3%
3 Belgium 539 656 11,6% 9,8%
4 United States 476 320 24,9% 8,6%
5 France 380 670 7,0% 6,9%
6 United Kingdom 363 419 17,9% 6,6%
7 Ireland 294 806 17,5% 5,3%
8 Netherlands 278 728 28,9% 5,0%
9 Italy 273 553 20,8% 5,0%
10 Spain 137 305 9,7% 2,5%
46 South Africa 4 642 11,7% 0,1%
TOTAL EXPORTS 5 524 474 18,3% 100,0%
Data Extracted from: Trade Map, 2016
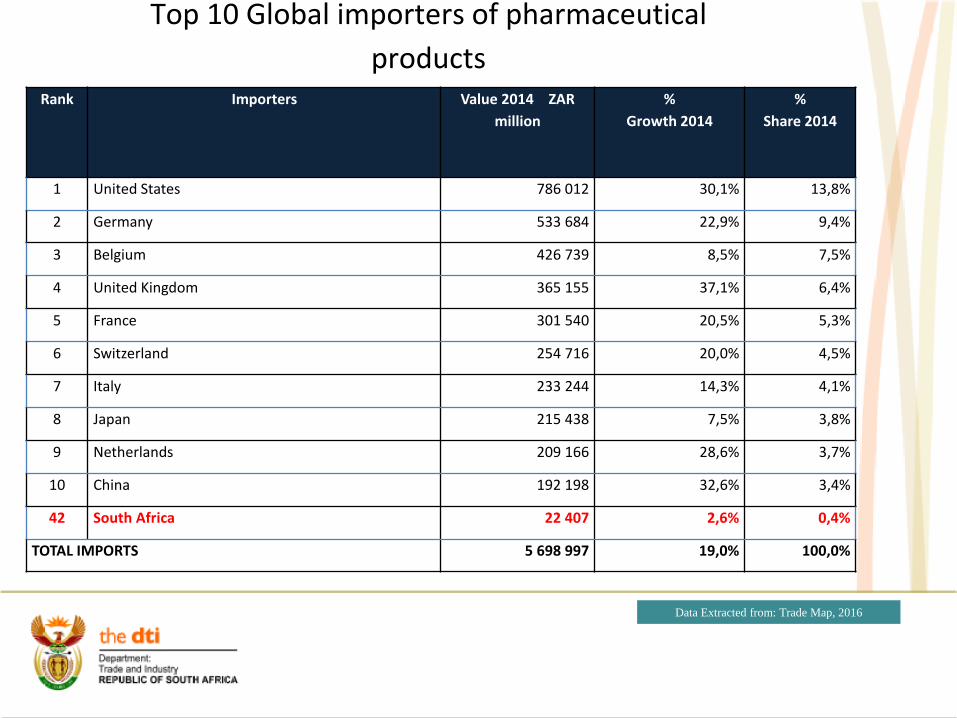
Top 10 Global importers of pharmaceutical products
Rank Importers Value 2014 ZAR million
%Growth 2014
%Share 2014
1 United States 786 012 30,1% 13,8%
2 Germany 533 684 22,9% 9,4%
3 Belgium 426 739 8,5% 7,5%
4 United Kingdom 365 155 37,1% 6,4%
5 France 301 540 20,5% 5,3%
6 Switzerland 254 716 20,0% 4,5%
7 Italy 233 244 14,3% 4,1%
8 Japan 215 438 7,5% 3,8%
9 Netherlands 209 166 28,6% 3,7%
10 China 192 198 32,6% 3,4%
42 South Africa 22 407 2,6% 0,4%
TOTAL IMPORTS 5 698 997 19,0% 100,0%
Data Extracted from: Trade Map, 2016

South Africa’s Trade in Pharmaceutical Products
• Note: *BMI Forecasted Values• ^ Quantec values• It is evident that imports are five times more than exports, thus the huge deficit in the pharmaceutical trade
Data Extracted from: Trade Map, 2016; Quantec, 2016; BMI 2016a & BMI 2016b

South Africa pharmaceutical imports source countries
Rank 2015
Country Value 2014ZAR million
Value 2015 ZAR million
% share 2015
% Growth 2015
AAGR(2010-2015)
1 India 3 626 5 895 21,3% 62,6% 29,0%
2 United States 2 629 3 817 13,8% 45,2% 14,6%
3 Germany 2 826 3 321 12,0% 17,5% 11,8%
4 France 2 392 2 495 9,0% 4,3% 8,3%
5 United Kingdom 1 841 1 629 5,9% -11,5% 6,6%
6 Italy 1 502 1 348 4,9% -10,2% 3,7%
7 Ireland 772 1 254 4,5% 62,4% 4,4%
8 Belgium 807 995 3,6% 23,3% 11,2%
9 Switzerland 869 781 2,8% -10,1% 1,4%
10 Spain 537 759 2,7% 41,3% 14,2%
Total Imports 22 446 27 615 100,0% 23,0% 12,6%
Data Extracted from: Quantec, 2016

Top 10 South Africa’s Pharmaceutical Exports Destination Countries
Rank 2015
CountryValue 2014 ZAR million
Value 2015 ZAR million
% Share 2015
% Growth 2015
AAGR(2010-2015)
1 Namibia 1 293 1 371 28,4% 6,1% 9,2%2 Botswana 584 675 14,0% 15,7% 3,0%3 U.S 282 358 7,4% 26,7% 24,1%4 Hong Kong 234 318 6,6% 35,7% 78,3%5 Zimbabwe 230 229 4,7% -0,6% 26,7%6 Swaziland 238 220 4,5% -7,9% -1,4%7 Zambia 155 196 4,1% 26,5% 30,9%8 Kenya 169 153 3,2% -9,3% 16,5%9 Australia 144 143 3,0% -0,7% 25,9%
10 Lesotho 109 138 2,9% 26,9% 6,5%Total Exports 4 474 4 827 100,0% 7,9% 12,8%
Data Extracted from: Quantec, 2016

SA pharmaceutical imports 2014/15
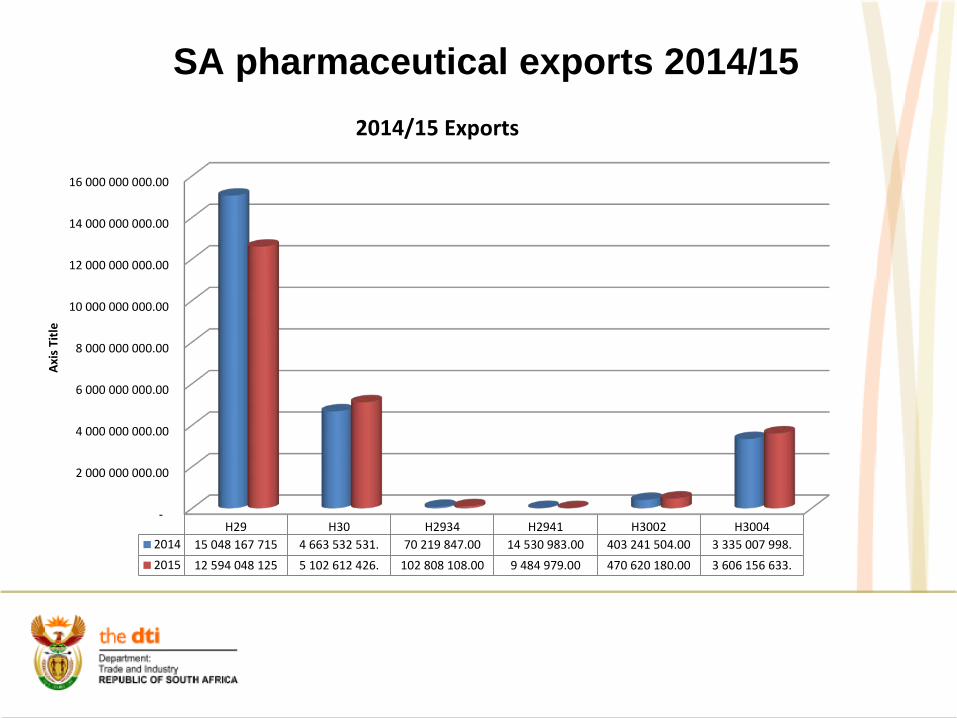
SA pharmaceutical exports 2014/15
-
2 000 000 000.00
4 000 000 000.00
6 000 000 000.00
8 000 000 000.00
10 000 000 000.00
12 000 000 000.00
14 000 000 000.00
16 000 000 000.00
H29 H30 H2934 H2941 H3002 H30042014 15 048 167 715 4 663 532 531. 70 219 847.00 14 530 983.00 403 241 504.00 3 335 007 998.2015 12 594 048 125 5 102 612 426. 102 808 108.00 9 484 979.00 470 620 180.00 3 606 156 633.
Axis
Titl
e
2014/15 Exports
• Strengths High demand for pharmaceutical products in SA. Local Manufacturing capabilities in clinical trials, secondary and tertiary
manufacturing. A number of different pharmaceutical companies operating in specialised markets
operating in SA. API manufacturing sites exist in SA. • Weaknesses High capital upfront costs required to invest and gain a competitive position within
the market, limiting new entry. Significant dependence on imported APIs and finished pharmaceutical products. Dependence on MCC and long registration period of new products – This is due to a
shortage in required skills within MCC. The skills shortage (and the cost of specialised skills) also affects the entire
pharmaceutical industry supply chain as companies are required to have a supervising pharmacist. It is estimated that SA requires 12 000 pharmacists to meet the international benchmark of 50 pharmacists per 100 000 people
SWOT Analysis

• Weaknesses The fragmented nature of the industry, across the private and public sectors has lead
to difficulties in setting targets for each sub-sector. Incentivising transformation is limited as particular sub-sectors do not rely on government contracts. The fragmented approach to transformation in the industry has entrenched limited transformation of the supply chain.
Lack of cohesive policy approach targeting the industry. Legislation governing and influencing the industry is spread across the DoH, NT and the dti
• Opportunities Local manufacturing capabilities in niche pharmaceutical sectors can be leveraged
to serve growing market demand in the rest of Africa and globally.• Threats Economic conditions: the volatility of the rand and the relative weakness of the
rand means that APIs are more expensive and given the SEP, companies are dis-incentivised to invest in local production facilities as predicting future profit margins is difficult.
SWOT Analysis

Challenges facing further Sector development
• Absence of integrated plan between relevant Government Departments re local production of pharmaceuticals
• Lack of efficiency within regulatory bodies• Policy uncertainty and unpredictability within public
procurement process – PPPFA • Price controls – Single Exit Price – increasing cost base –
R/$ fx volatility – contributes to higher than normal API costs
• Uncertainty in policy environment – e.g. national IP Policy• Growing trade deficit in pharmaceuticals • Lack of adequate incentives across the pharmaceutical
value chain
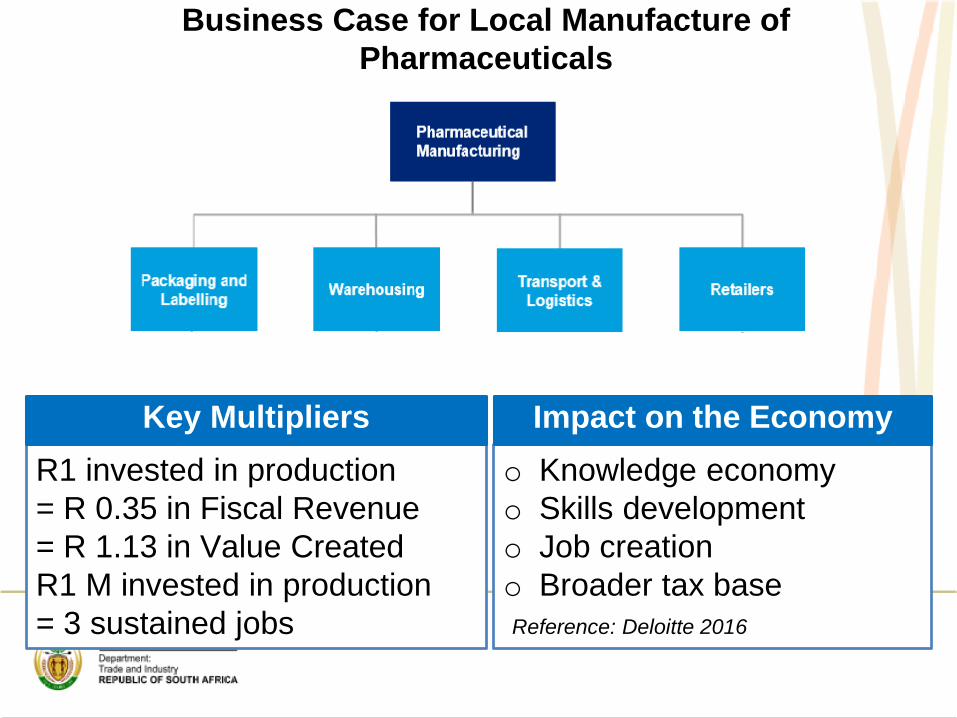
R1 invested in production= R 0.35 in Fiscal Revenue = R 1.13 in Value CreatedR1 M invested in production = 3 sustained jobs
o Knowledge economyo Skills development o Job creation o Broader tax base Reference: Deloitte 2016
Key Multipliers Impact on the Economy
Business Case for Local Manufacture of Pharmaceuticals

+
‘Vision 2030’ for Pharma
Healthy and productive nation Security of supply of essential medicines - NHI High rate of economic growth and job creation Thriving knowledge economy and investment in R&D Local pharmaceutical industry that is globally
competitive – DDI and FDI specifically in high growth areas such as biopharmaceuticals
Highly skilled individuals that are employed within the industry and drivers of further development of the industry
Key exporter of quality medicines especially to the African market
Gap in growing trade balance reduced
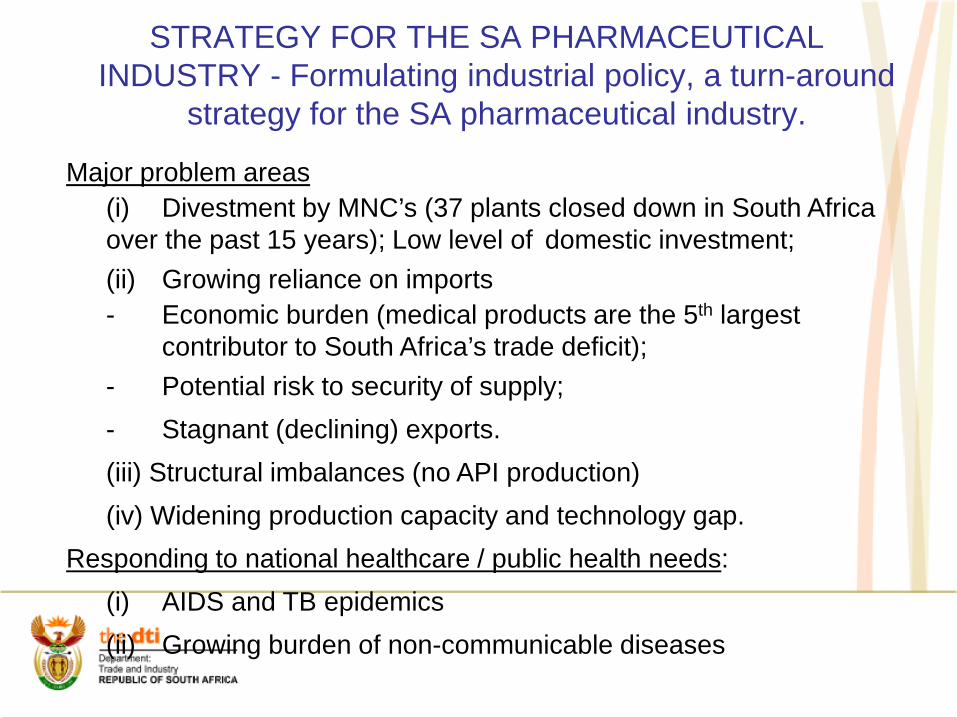
STRATEGY FOR THE SA PHARMACEUTICAL INDUSTRY - Formulating industrial policy, a turn-around
strategy for the SA pharmaceutical industry.
Major problem areas(i) Divestment by MNC’s (37 plants closed down in South Africa over the past 15 years); Low level of domestic investment;(ii) Growing reliance on imports - Economic burden (medical products are the 5th largest
contributor to South Africa’s trade deficit); - Potential risk to security of supply; - Stagnant (declining) exports.(iii) Structural imbalances (no API production)(iv) Widening production capacity and technology gap.
Responding to national healthcare / public health needs:(i) AIDS and TB epidemics(ii) Growing burden of non-communicable diseases
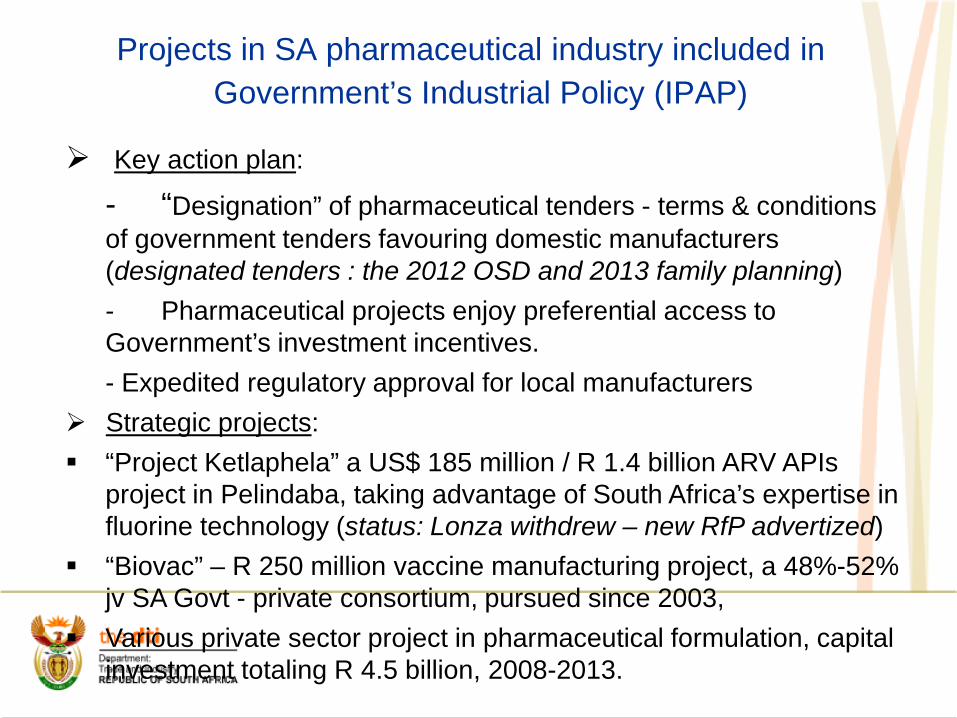
Projects in SA pharmaceutical industry included in Government’s Industrial Policy (IPAP)
Key action plan:
- “Designation” of pharmaceutical tenders - terms & conditions of government tenders favouring domestic manufacturers (designated tenders : the 2012 OSD and 2013 family planning)- Pharmaceutical projects enjoy preferential access to Government’s investment incentives.- Expedited regulatory approval for local manufacturers
Strategic projects: “Project Ketlaphela” a US$ 185 million / R 1.4 billion ARV APIs
project in Pelindaba, taking advantage of South Africa’s expertise in fluorine technology (status: Lonza withdrew – new RfP advertized)
“Biovac” – R 250 million vaccine manufacturing project, a 48%-52% jv SA Govt - private consortium, pursued since 2003,
Various private sector project in pharmaceutical formulation, capital investment totaling R 4.5 billion, 2008-2013.

Government procurement of pharmaceuticals: Fast-growing public (tender) segment
Tender Tender No. Est. Value[designated tenders]
ARVs (Jan/Apr 2013 – March 2015)
HP-13 ARV 2013 R 5.9 billion(US$ 667 million)
Anti-TB(Sept 2013-Aug 2015)
HP-01 TB 2013 R 890 million
Antibiotics(April 2009)
RT 301-2009 MF R 750 million
Family planning –contraceptives (June 2013)
HP-03 FP 2013 R 210 million
Oral solids (OSD)(April 2012 – March 2014)
HP-09 SD 2012 R 2.5 billion

KEY POINTSin DTI’s Industrial Policy for Pharmaceutical industry
1. Building investors’ confidence:I. Using Government procurement to leverage local manufacture.II. Exploring the means (also political) to boost exports (to Africa, to the Least Developed Countries etc.) III. Reasonable approach to the medicines pricing policy.
2. Growing domestic capacity in the manufacture of key APIs (ARVs, anti-TB, biologics, reagents for in vitro diagnostics etc.) via technology transfers, investment incentives, preferences in Government tenders, offtake guarantees etc.
3. Preserving and encouraging good relations of SA generic industry with the Big Pharma (through voluntary licenses and technology transfers, joint R&D programmes etc.)
4. Looking beyond simple manufacturing; Establishing alliances in R&D, Promoting clinical R&D, Preparing foundations for the upcoming revolution in pharmaceutical technologies and treatment (biologics, individual therapies).
the dti’s industrial policy toolbox
• Public procurement- localisation- NIPP
• Industrial Financing, incentives and export support
• Developmental Trade Policy • SEZ’s • Tariffs• Cluster Development • Regional integration
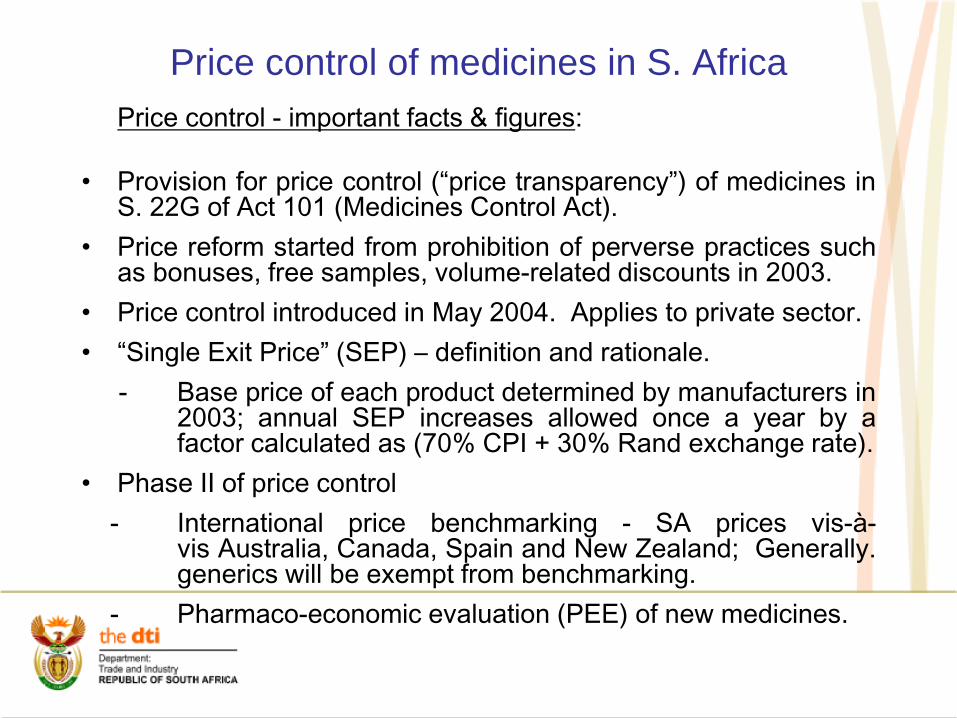
Price control of medicines in S. AfricaPrice control - important facts & figures:
• Provision for price control (“price transparency”) of medicines inS. 22G of Act 101 (Medicines Control Act).
• Price reform started from prohibition of perverse practices suchas bonuses, free samples, volume-related discounts in 2003.
• Price control introduced in May 2004. Applies to private sector.• “Single Exit Price” (SEP) – definition and rationale.
- Base price of each product determined by manufacturers in2003; annual SEP increases allowed once a year by afactor calculated as (70% CPI + 30% Rand exchange rate).
• Phase II of price control- International price benchmarking - SA prices vis-à-
vis Australia, Canada, Spain and New Zealand; Generally.generics will be exempt from benchmarking.
- Pharmaco-economic evaluation (PEE) of new medicines.
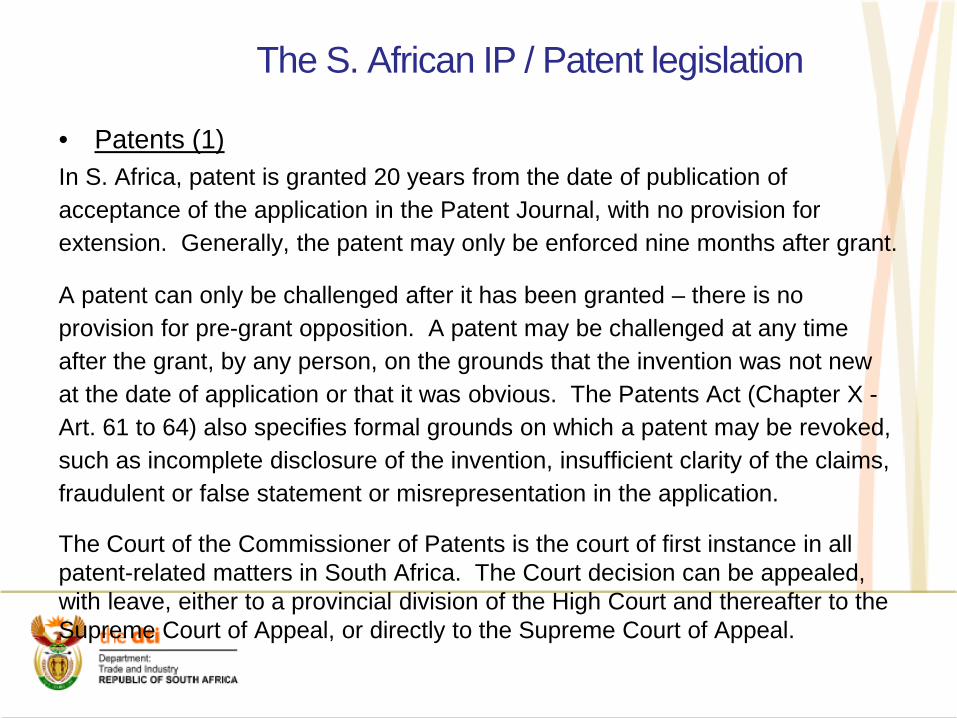
The S. African IP / Patent legislation
• Patents (1) In S. Africa, patent is granted 20 years from the date of publication of acceptance of the application in the Patent Journal, with no provision for extension. Generally, the patent may only be enforced nine months after grant.
A patent can only be challenged after it has been granted – there is no provision for pre-grant opposition. A patent may be challenged at any time after the grant, by any person, on the grounds that the invention was not new at the date of application or that it was obvious. The Patents Act (Chapter X -Art. 61 to 64) also specifies formal grounds on which a patent may be revoked, such as incomplete disclosure of the invention, insufficient clarity of the claims, fraudulent or false statement or misrepresentation in the application.
The Court of the Commissioner of Patents is the court of first instance in all patent-related matters in South Africa. The Court decision can be appealed, with leave, either to a provincial division of the High Court and thereafter to the Supreme Court of Appeal, or directly to the Supreme Court of Appeal.
FAQ’s - the S. African IP / Patent legislation
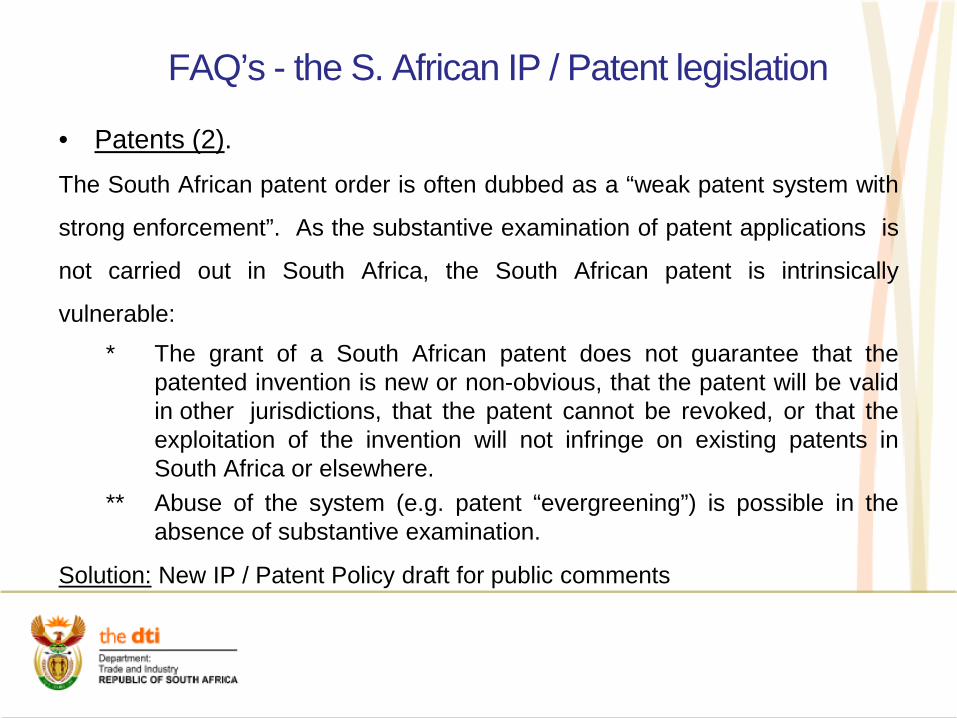
• Patents (2).The South African patent order is often dubbed as a “weak patent system with
strong enforcement”. As the substantive examination of patent applications is
not carried out in South Africa, the South African patent is intrinsically
vulnerable:* The grant of a South African patent does not guarantee that the
patented invention is new or non-obvious, that the patent will be validin other jurisdictions, that the patent cannot be revoked, or that theexploitation of the invention will not infringe on existing patents inSouth Africa or elsewhere.
** Abuse of the system (e.g. patent “evergreening”) is possible in theabsence of substantive examination.
Solution: New IP / Patent Policy draft for public comments
Way Forward
• Framework published on the dti website and GG.
• Continuous engagement including roundtables and workshops.
• Draft Policy addressing immediate issues and framework for in-built agenda by 03/17
35

Medical Devices

Medical Device Stats: SAVariable Contribution in 2014/15
Global market$ 320 bn
Medical devices – SA marketZAR 13.4 bn (US$ 1.22 bn), expected to grow at a CAGR of 7.6%over the next 5 years in local currency terms
SA share of global market0.4%, 30stth largest in the world
CAGR (SA)7.6% revised
Medical devices - employment Total 20,000 including manufacturing, marketing and sales,servicing, providing specialized laboratory & diagnostics services.
Medical devices – trade balanceApproximately ZAR 10 bn
ImportsEstimated at 90% (Rand value: approximately R 11.8bn )
Exports into Africa71% of total exports
Estimated multiplier1.25
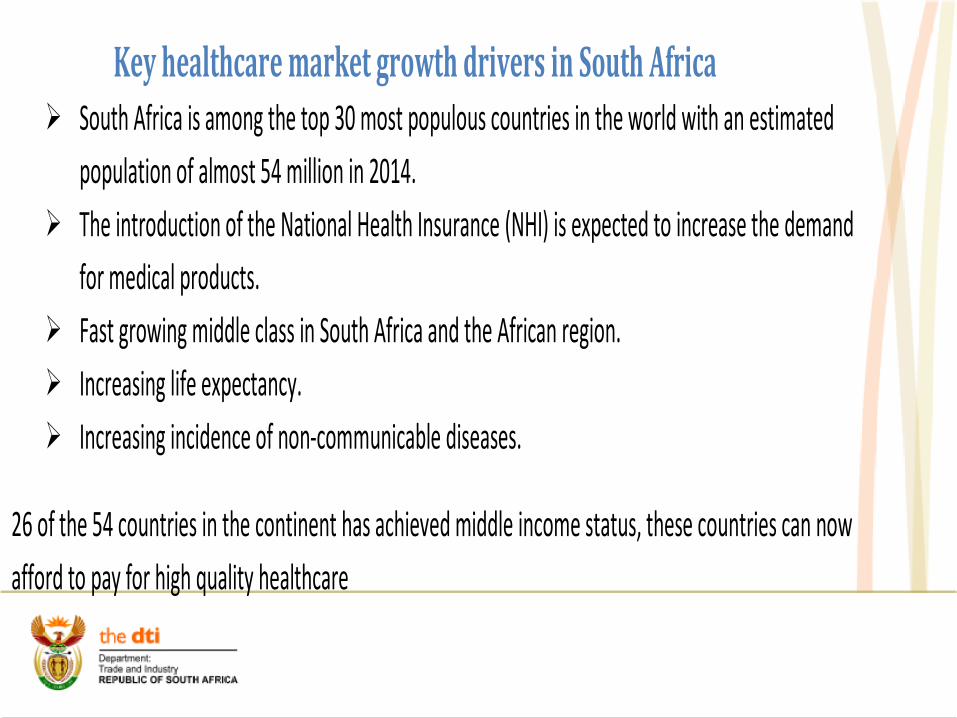
Key healthcare market growth drivers in South Africa South Africa is among the top 30 most populous countries in the world with an estimated
population of almost 54 million in 2014. The introduction of the National Health Insurance (NHI) is expected to increase the demand
for medical products. Fast growing middle class in South Africa and the African region. Increasing life expectancy. Increasing incidence of non-communicable diseases.
26 of the 54 countries in the continent has achieved middle income status, these countries can now afford to pay for high quality healthcare

Consumables 2,284.5
Diagnostic imaging 2,107.6
Dental products 467.3
Orthopaedics & prosthetics 1,301.9
Patient aids 1,501.3
Other medical devices 5,156.1
Total Market 12,818.7
The size of the South African Medical devices market
The medical devices market size in 2014 was estimated at almost R13 billion. It is among the top 40largest markets in the world. Per capita spending was R238.48 in 2014; this is more than five times thelevel of spending in most other parts of Sub Saharan Africa where per capita spending is less than R54.
Table: Medical Device Market by Product Area, 2014 (ZAR millions)
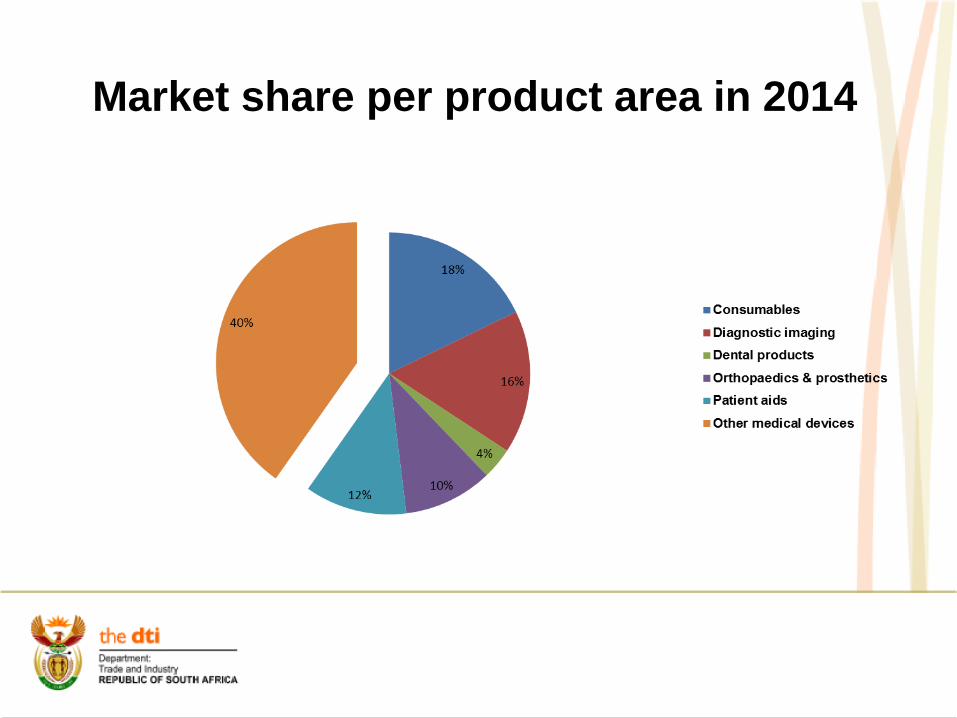
Market share per product area in 2014

Medical Devices Export Destinations 2014

SWOT Analysis: Medical Devices Sector in SA
Strengths
Wealthy African economy whose healthcare system is envied by other African nationsStrong, sizeable private sector
Opportunities
Public-private partnership growthImports account for around 95% of marketEmergence of affluent, Black middle classProposed national health insurance scheme which is prompting further investment in the public healthcare systemSteady expansion of HIV treatment programme should help reduce pressures on public healthcare systemEmergent introduction of SAHPRAPreferential Public Procurement
Weaknesses
Poor infrastructure, particularly in the extensive rural areas, limits efficiency of healthcare delivery as does the chronic shortage of medical personnelMany rural facilities grossly under-used or lying idle due to poor organisationHIV/AIDS patients overburdening the systemPrivate sector out of reach for most of the Black populationPurchasing procedures complex and fragmentedLack of Regulatory Standards and Certification to enable exports of products
Threats
No solution in sight to increasing the number of doctors in public sector andpreventing them from working in private sector or abroadDepreciating Rand is making imports less affordableLaunch of market inquiry into pricing in the private healthcare sector could negatively impact its future developmentGovernment moves to centralise certain functions within the National

CSP Development Process 8 IMS SECTOR PROGRAMMES
MONITOR & EVALUATE
1A) PRIORITISE SUB-SECTORS1B) CHOOSE TARGETED LEVEL OF INDUSTRY UPGRADING
= Evaluate Potential (Growth, Employment, Equity)= Evaluate Institutional Factors= Consult with Industry
2. RESEARCH SUB-SECTOR = Global (Quantitative, Qualitative, Industry Consultation)= Domestic (Quantitative, Qualitative, Industry Consultation)
3. INTERPRET RESEARCH = SWOT = Value Matrix Diagram = GAP Analysis= Critical Success Factors
4. FORMULATE SUB-SECTOR VISION / STRATEGIC OBJECTIVES
= Consult DTI Divisions / Government Departments= Consult Industry + Related Stakeholders
5. IDENTIFY AND DEVELOP LEVERS = Consider all levers available to Government= Develop interventions
6. LEVERS: ECONOMIC / INSTITUTIONAL EVALUATION
= Rank= Justify selection
7. GOVERNMENT STRATEGIC OBJECTIVES AND CHOICES: CSP + LEVERS
= EXBO approval= Industry buy-in= Cabinet approval
8. IMPLEMENT CUSTOMISED SECTOR PROGRAMME
= Strategic Partnerships: Industry, DTI, Govt Depts, S/holders= Apply Levers to achieve:
- Competitiveness - Exports- Investment - Equity- Employment
STAGES
VISION
LEVERS
IMPLE-MENT
UP
GR
AD
E C
SP
’S8 IMS SECTOR PROGRAMMES
MONITOR & EVALUATE
8 IMS SECTOR PROGRAMMES
MONITOR & EVALUATE
1A) PRIORITISE SUB-SECTORS1B) CHOOSE TARGETED LEVEL OF INDUSTRY UPGRADING
= Evaluate Potential (Growth, Employment, Equity)= Evaluate Institutional Factors= Consult with Industry
1A) PRIORITISE SUB-SECTORS1B) CHOOSE TARGETED LEVEL OF INDUSTRY UPGRADING
= Evaluate Potential (Growth, Employment, Equity)= Evaluate Institutional Factors= Consult with Industry
2. RESEARCH SUB-SECTOR = Global (Quantitative, Qualitative, Industry Consultation)= Domestic (Quantitative, Qualitative, Industry Consultation)
2. RESEARCH SUB-SECTOR = Global (Quantitative, Qualitative, Industry Consultation)= Domestic (Quantitative, Qualitative, Industry Consultation)
3. INTERPRET RESEARCH = SWOT = Value Matrix Diagram = GAP Analysis= Critical Success Factors
3. INTERPRET RESEARCH = SWOT = Value Matrix Diagram = GAP Analysis= Critical Success Factors
4. FORMULATE SUB-SECTOR VISION / STRATEGIC OBJECTIVES
= Consult DTI Divisions / Government Departments= Consult Industry + Related Stakeholders
4. FORMULATE SUB-SECTOR VISION / STRATEGIC OBJECTIVES
= Consult DTI Divisions / Government Departments= Consult Industry + Related Stakeholders
5. IDENTIFY AND DEVELOP LEVERS = Consider all levers available to Government= Develop interventions
5. IDENTIFY AND DEVELOP LEVERS = Consider all levers available to Government= Develop interventions
6. LEVERS: ECONOMIC / INSTITUTIONAL EVALUATION
= Rank= Justify selection
6. LEVERS: ECONOMIC / INSTITUTIONAL EVALUATION
= Rank= Justify selection
7. GOVERNMENT STRATEGIC OBJECTIVES AND CHOICES: CSP + LEVERS
= EXBO approval= Industry buy-in= Cabinet approval
7. GOVERNMENT STRATEGIC OBJECTIVES AND CHOICES: CSP + LEVERS
= EXBO approval= Industry buy-in= Cabinet approval
8. IMPLEMENT CUSTOMISED SECTOR PROGRAMME
= Strategic Partnerships: Industry, DTI, Govt Depts, S/holders= Apply Levers to achieve:
- Competitiveness - Exports- Investment - Equity- Employment
8. IMPLEMENT CUSTOMISED SECTOR PROGRAMME
= Strategic Partnerships: Industry, DTI, Govt Depts, S/holders= Apply Levers to achieve:
- Competitiveness - Exports- Investment - Equity- Employment
STAGES
VISION
LEVERS
IMPLE-MENT
UP
GR
AD
E C
SP
’S

Level of industry upgradingUpgrading level Illustrative activitiesBasic industry upgrading o Facilitation of the removal of immediate constraints to the development of the industry, such as:
• Infrastructure• Skills• Finance• Legislative / regulatory barrierso Facilitation of industry cooperation / clusteringo Investment and export promotion
Process and product upgrading o Facilitating increased efficiency of internal processes and / or the introduction of new products within theindustry. This is associated with activities such as:
• Benchmarking against world best practice• Access to institutions which facilitate process and product improvements
Functional upgrading o Facilitating an increasing value-addition by changing the mix of activities conducted within the industry.This is associated with activities such as:
• Moving from assembly to component manufacture• Moving from manufacture to design
Industry upgrading / New industry development
o Moving the industry to an altogether new set of activities, e.g. from television monitors to computermonitors, or
o Facilitating the creation of entirely new economic activities within the economy.
•Adapted from Kaplinsky and Morris (2001)

Critical Success Factors
• Partnerships• Investment in innovation• Regulatory framework• Quality

Identify industrial policy levers
• Coordination: achieve higher impact of private sector e.g. Clusters
• Finance: sector-specific incentives• Policy, legislation and regulation: partnership with UNIDO• Strategic Partnerships: Internal and external• Procurement: leveraging state procurement for medical devices• Trade barriers• Reciprocal benefits**Economic evaluation of levers

4-point plan for Industry Development (1)
1. Support for and creation of enabling environment to drive importsubstitution• Establishment of a formal structure for better State-Business relations
between key medical device industry stakeholders (Industry, dti, DoH,SABS, DST etc.)
• Short term targets/Low hanging fruit - low hanging fruit can be defined asproducts that do not require significant capital investment or raretechnical expertise to manufacture. As a result manufacture of such itemsis often high volume and subject to considerable cost pressure. Thesetypes of items are the most appropriate targets for short term interventionin order to address issues surrounding the trade deficit i.e. diagnostics,gloves, syringes, textiles, services such as Health TechnologyAssessments (dti, DoH, Industry)
• WC Regional Cluster establishment - shared infrastructure,competitiveness, export development and develop global supply chains(Wesgro, WC Provincial Government, industry, dti, TIA)
4-point plan for Industry Development (2)
2. Establish mechanisms to increase exports•More attractive incentives for local manufactures – ISO13485 and CE Mark (dti,industry, DST, NIPMO) – requires business case to be developed• Establish dti recognised Industry Association that would evolve into ExportCouncil (instrument is over-subscribed currently) to target high growth marketsthrough facilitation of access to EMIA and TEO funding (dti, industry)• Develop sector export Strategy with Regional Heads in Export Promotion
(TISA)

4-point plan for Industry Development (3)
3. Support for R&D and Innovation in the sector to increasecompetiveness of products• Establish incubator to support the spin out of medical device
companies, products, prototypes from researchorganisations, universities etc. – investigate whether amultinational could anchor such a programme under equityequivalence, NIPP or supplier/enterprise development(CSIR, DST, dti, industry)
• Develop business case for joint programme of supportbetween TIA and the dti to support innovation in medicaldevices/diagnostics and equipment (DST, TIA, dti, IDC andindustry)
• Leverage the DST SIP funding for industry to direct andconduct relevant RDI (DST, industry, dti)
4-point plan for Industry Development (4)
4. Deploy instruments of industrial policy to support of sectorgrowth• Introduction of an internationally graded ISO 13485 as a
compulsory Quality Management Standard for all localmanufacturers (industry, SABS, DoH, dti)
• More attractive incentives for local manufacturers: businesscase for the subsidisation of certification costs i.e. ISO13485,CE Mark and SABS Mark dti, industry, DFI’s)
• Record all customs data to an 8-digit HS level (SARS,industry, DoH, dti) to better manage data within the sector onwhich future industry development mechanisms will behypothesised

Thank You!!